We've passed the 50th anniversary of the first meteorological satellite*, on to 60! Even though satellites have been used for decades, it's still far from simple to do so. Or, rather, it is much more involved than I used to think. I suppose it shouldn't really have been a surprise. Automated weather stations on earth have plenty of problems, and they're operating at earthly temperatures, near somebody who can fix minor problems if they occur, and do so before they become major problems.
By way of my day job (again, I do _not_ speak for my employer), I use satellite data and do so heavily enough that I'm on the mailing list for operational updates about the current status of the satellites, data receiving stations, and other parts of the system between my desk (well, the supercomputer at work) and the satellite.
One thing which has really impressed itself on me is that there is far more to satellites than launching them and waiting for lovely data to flow forth. Second is that there must be a large number of very highly skilled people working between the satellite and my desk to ensure that the data flows reliably, at high quality, and in a timely fashion.
Fortunately, though I'm about to name some challenges and problems, they're _known_ problems and challenges, with solutions. Engineers don't like leaving problems standing. Problems are things to be solved! So, a few stories:
Showing posts with label data. Show all posts
Showing posts with label data. Show all posts
27 June 2017
17 April 2016
2016 Tough on Sea Ice Satellites
The last several weeks have been hard on the satellites people like me use most for determining sea ice coverage. We use passive microwave instruments on a number of different satellites. The 'passive' in its name means that it doesn't emit microwaves. It just sits back and collects the emissions from where it's looking. In this, the instrument is rather like our eyes.
Different centers use different instruments and different combinations of instruments. The main ones are:
SSMI on DMSP F-15, launched on 12 December 1999 (pushing 17 years!)
SSMI-S on DMSP F-16, launched 18 October 2003 (pushing 13!)
SSMI-S on DMSP F-17, 4 November 2006 (almost 10!)
SSMI-S on DMSP F-18, 18 October 2009 (approaching 7)
SSMI-S on DMSP F-19, 3 April 2014 (only 2)
AMSR2 on GCOM-W, 18 May 2012 (nearly 4)
A word about the names. SSMI is Special Sensor Microwave Imager. 'Imager' is the key word. With satellites, 'imager' means that the instrument is designed to be able to see (mostly) the surface. Handy for us sea ice people. DMSP is the Defense Meteorological Satellite Program -- the US Department of Defense operates these satellites. SSMI-S (or SSMI-SU) is the SSMI -- Sounder (or Sounding Unit). Means that in addition to the regular SSMI observing of the surface, it also carries some sensors that can do 'sounding'. Sounding is to see what's going on in the atmosphere rather than mostly the surface. (Name comes from the weather balloons -- which collect data known as soundings.) AMSR is Advanced Microwave Sounding Radiometer. It's operated by the Japanese Space Agency (JAXA). The advance is that it is able to see more detail and the much older designs in the SSMI and SSMI-S.
So, to our stories of woe. All of these instruments are designed for 5 years' operation. F-15 giving (mostly) good data after 17 years is spectacular for this type of satellite. Notice that most of these potential data sources are already past their design life. Since February 2016:
F-16: the sounding channels quit working early February
F-17: April 5th data quality impaired on one of the surface imaging channels, data volumes sent are greatly reduced.
F-18: Mostly ok, but reduced volume of data. Many orbits' data not making it through.
F-19: Data ceased flowing February 2
AMSR2: Data outage afternoon of April 15th through morning of April 16th.
F-15, the oldest of the crowd, is still sending basically normal data volumes at basically normal volumes.
So, hiccups all around the sea ice analysis world. The NSIDC was using only the F-17 SSMI-S, so has to rebuild their system to work with another instrument. The AMSR2 temporary outage affected some centers seriously as they relied only on that instrument. The US NWS uses both F-15 and F-17, and so far seems to be ok. I haven't checked the operating status of the OSI-SAF sea ice (European analysis). If I remember correctly, they also use more than one instrument, so should also be ok.
More gory details below the fold ...
19 January 2016
The Pacemaker of the Chandler Wobble
Abstract: The Chandler Wobble is one of the largest circumannual periodic or quasi-periodic variations in the earth's orientation. After over a century of searching for its forcing, it was found to be caused by atmospheric circulation and induced ocean circulation and pressure. The question of why there should be such forcing from the atmosphere has remained open. I suggest that variations in earth-sun distance cause this forcing to the atmosphere and thence the ocean. Analysis of earth-sun distance, earth's orientation, and atmospheric winds shows a coherent relationship between the atmosphere and earth orientation at just those periods expected from earth-sun distance variation. As this is a general mechanism, it can be used in examining regular climatic variations on a wide range of periods and for climate parameters other than the earth's orientation.
That is the abstract for the paper I link to below. It's not a peer-reviewed paper in the sense of being in a peer-reviewed journal. But it has been reviewed by an expert in the field (William P. O'Connor), who was quite favorable.
I am posting the idea and paper here. Long past time for the ideas to be discussed. If they're shredded in the blogosphere, so be it. I have quite a bit more than what I've put in the document. Over the next few days and weeks, I'll post more of those additional materials as well.
The Pacemaker of the Chandler Wobble, Grumbine 2014
-- -- -- -- -- -- --
That is the abstract for the paper I link to below. It's not a peer-reviewed paper in the sense of being in a peer-reviewed journal. But it has been reviewed by an expert in the field (William P. O'Connor), who was quite favorable.
I am posting the idea and paper here. Long past time for the ideas to be discussed. If they're shredded in the blogosphere, so be it. I have quite a bit more than what I've put in the document. Over the next few days and weeks, I'll post more of those additional materials as well.
The Pacemaker of the Chandler Wobble, Grumbine 2014
23 July 2014
Data are ugly
Current news about whether there really is an increase in Antarctic sea ice cover is reinforcing my belief, shared by most people who deal with data, that data are ugly. This work argues that the trend that some have seen in some trend analyses has more to do with the data processing than with nature. I encourage you to read the article in full itself. It is freely available.
From the abstract:
So a few considerations of what all is behind the scenes of this paper and the earlier Screen, 2011. The latter paper involved some of my work (read deep in to the acknowledgements). This one doesn't, but the fundamental issues are the same ...
From the abstract:
Although our analysis does not definitively identify whether this change introduced an error or removed one, the resulting difference in the trends suggests that a substantial error exists in either the current data set or the version that was used prior to the mid- 2000s, and numerous studies that have relied on these observations should be reexamined to determine the sensitivity of their results to this change in the data set.One of the obnoxious things about data sources is that they don't remain the same forever. This is not so much a problem for my concerns about weather prediction, since the atmosphere forgets what you said you observed in a few days. But for a climate trend, the entire record is important. For the data set being discussed, the Bootstrap Algorithm (Comiso) applied to passive microwave, we immediately run in to data obnoxing. Since 1978, there have been several passive microwave instruments -- SMMR, SSMI F-8, SSMI-F11, SSMI-F13, 14, 15, AMSR-E, SSMI-S F16, 17, 18, and AMSR-2. They didn't all fly at the same time, and they don't have exactly the same methods of observation. And none of them exactly observe 'sea ice', which leads to a universal problem which we (people who want to use these instruments to say something about sea ice) all have to deal with.
So a few considerations of what all is behind the scenes of this paper and the earlier Screen, 2011. The latter paper involved some of my work (read deep in to the acknowledgements). This one doesn't, but the fundamental issues are the same ...
01 April 2013
When was climate normal?
It's been a couple years since I took up the question of normal climate, so time for another go. At that time, I used monthly data from Hadley, and arrived at the observation that if you're younger than 26, you've never seen a month where the global average as as cold as the 1850-2011 average, 317 consecutive months (at that point, now over 330) of warmer than 'normal' temperatures. I'll cheat and give you some answers first, read on to see how they're established:
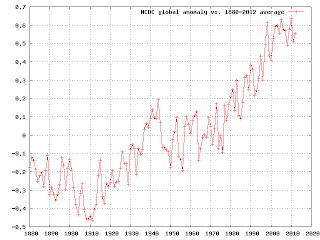
- Climate was 'normal' only between 1936-1977
- Every year 1987-present has been warmer than any year before that
- 1976 was warmer than any year before 1926
- 1978 (next coldest year of the recent run) was warmer than any year before 1940

07 October 2011
AMSR-E failure and fallout
Update 17 October: The meeting last Tuesday gives little hope. There will definitely be no data for weeks. I don't know what prevents a conclusion of never.
original:
AMSR-E has failed and is probably permanently out of commission. For most of you, that's merely news. Perhaps a source of amusement and interest is now gone. For me, since I use(d) it in my day job, AMSR-E failing means some real work. Most of that work was already planned, but now it needs to be done more speedily.
As I've often said here, and even more often in 3d, data are messy and ugly. One sort of ugliness is that instruments do not last forever. When (not if) they fail, you have to turn to a different instrument. Ideally, you already have the replacement in hand and have been running it regularly and intercomparing its results with your current main system and ensured that there are no differences other than those you wanted -- like better resolution on the new instrument. The present situation is not ideal, so, as we usually do in science, I'm making the best of it that I can. And making notes for what to do when I have a chance to rework the immediate fixes.
26 July 2011
How not to compute trends
Did you know that scientists are lying about the trend in sea ice extent? That's the conclusion if you apply the popular trend analysis technique those who claim that the earth has cooled, or 'not warmed', since 1998, or 2005. The probable reason you don't hear about this is that the 'lie' would be that scientists are grossly underestimating how drastic the trend to less ice is if you believe that method.
The method used to claim that there's a cooling trend, or no warming trend, is to cherry-pick a too-recent start year that is exceptionally high and compute the difference between that and a particular recent year (any one, repeat the 'no cooling trend for the last decade' for years afterwards, even if more recent years are warmer).
So I'll take a recent year that had large sea ice extent -- 1996, and compute the trend between there and a recent year that had a low extent -- 2007. Here's the straight line computed that way, plotted against the observations between 1996 and present. These data are September ice extents from the NSIDC:
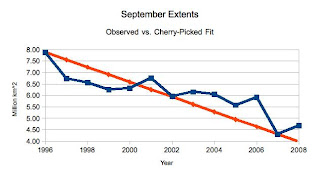 And from eye-inspection of it, it even looks like the average error is about 0. Sometimes high, sometimes low. This trend is for ice pack extent to lose about 330,000 km^2 per year, against the about 78,000 km^2 that is computed for a linear trend by climate scientists. Clearly climate scientists are trying to hide the decline!
I've already done some things more honest than what the 'no warming since 1998' folks do, not least is, I showed you the trend line and the data. But this is far from sufficient to have a reasonable trend analysis.
The method used to claim that there's a cooling trend, or no warming trend, is to cherry-pick a too-recent start year that is exceptionally high and compute the difference between that and a particular recent year (any one, repeat the 'no cooling trend for the last decade' for years afterwards, even if more recent years are warmer).
So I'll take a recent year that had large sea ice extent -- 1996, and compute the trend between there and a recent year that had a low extent -- 2007. Here's the straight line computed that way, plotted against the observations between 1996 and present. These data are September ice extents from the NSIDC:

I've already done some things more honest than what the 'no warming since 1998' folks do, not least is, I showed you the trend line and the data. But this is far from sufficient to have a reasonable trend analysis.
05 April 2011
Starting to work with data
Let's suppose you have no particular axe to grind and are wondering about what 2011's average temperature will look like. What are some things you would do? First, of course, is try to get some data to work with. I'm choosing the NCDC global land and sea temperatures, annual average. If you prefer some other source, go with that. And if you're interested in something entirely different than this, have a go with that data source. I'll be talking about methods of dealing with data, not anything unique to annual average global mean 2 meter air temperatures.
Next is to do some basic looking around the data. That includes plotting it, finding the maximum, the minimum, the average, and the standard deviation. Since you're thinking about making a prediction of 2011, you also want to take a look at how things change from year to year. What does the plot of year to year change look like? What are the maximum, minimum, average, and standard deviations of change?
Next is to do some basic looking around the data. That includes plotting it, finding the maximum, the minimum, the average, and the standard deviation. Since you're thinking about making a prediction of 2011, you also want to take a look at how things change from year to year. What does the plot of year to year change look like? What are the maximum, minimum, average, and standard deviations of change?
24 January 2011
Whiteboard on the end of global warming
The Whiteboard also has a series (now looks to be finished) on whether global warming has 'stopped'. That's what prompted the series I linked to last week. The question is pursued statistically, following the lead of Tamino at Open Mind. The brief summary of the series is 'no'. But it is well worth looking in to the series for the how and why we can say this, and how strongly we can say it.
Did Global Warming Stop After 1998?
Did Global Warming Stop After 2000?
Did Global Warming Stop in 1940?
Did Global Warming Stop After 2007?
For looking at the converse, global cooling:
Did Global Cooling Stop in 1970?
These are more mathematical takes than my old What cooling trend? They come to the same conclusion, so those who'd like more math behind their conclusions can get it. Since I did that post over a year ago, it's probably time for an update. One of these days ...
21 January 2011
Wrestling with data
I'll suggest those who haven't been, join me in keeping an eye on a series of posts that Ron Broberg is doing over at The Whiteboard. As befits a whiteboard, he's showing a lot of the details that get cleaned out of most final publications, even on blogs. The topic at hand is looking at the temperature records since 1880 and testing ideas on fitting curves to the data. The series is now to #9 and it's apparent that there will be several more:
http://rhinohide.wordpress.com/2011/01/07/lines-sines-and-curve-fitting-1-oh-my/ (Starts out more on the issue of testing ideas on what we can conclude about temperature trends)
http://rhinohide.wordpress.com/2011/01/08/lines-sines-and-curve-fitting-2-r/ (try fitting the sine and then a line)
http://rhinohide.wordpress.com/2011/01/09/lines-sines-and-curve-fitting-3-double-down/ (Try fitting 2 sine waves)
http://rhinohide.wordpress.com/2011/01/10/lines-sines-and-curve-fittings-4-walk-and-chew-gum/ (Simultaneous line and sine fit.)
http://rhinohide.wordpress.com/2011/01/12/lines-sines-and-curve-fitting-5-a-growth/ (Trying an exponential curve)
http://rhinohide.wordpress.com/2011/01/14/lines-sines-and-curve-fitting-6-backcast-and-forecast/
http://rhinohide.wordpress.com/2011/01/15/lines-sines-and-curve-fitting-7-normal/ (Testing Normality 1)
http://rhinohide.wordpress.com/2011/01/16/lines-sines-and-curve-fitting-8-dagostino/ (Testing Normality 2)
http://rhinohide.wordpress.com/2011/01/17/lines-sines-and-curve-fitting-9-girma/
A sine is a standard oscillation. It would be a pure tone (rather flute-like) in music. For a bit more about oscillations and data series, and the language of time series analysis, take a look at my Introduction to Time Series Analysis.
20 January 2011
Help save data
You've noticed by now the frequent pleas from people studying climate for more data, particularly from the past; here's your chance to help: Data Rescue at Home is working to retrieve hand-written climate records to make them useful for modern science. The catch being exactly the fact that they are hand-written. It is best to have a person looking at the writing to decide whether that squiggle is a 9 or 7 (to name one that confuses others who try to read my writing). You can be that person.
Subscribe to:
Comments (Atom)

