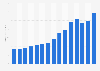
In 2023, gaming audiences in the United States spent an average of ***** U.S. dollars on video games per month, down from ***** U.S. dollars per month in 2022. In November 2023, the retail gaming revenue in the United States amounted to **** billion U.S. dollars.
Profit from the additional features of your individual account
Currently, you are using a shared account. To use individual functions (e.g., mark statistics as favourites, set
statistic alerts) please log in with your personal account.
If you are an admin, please authenticate by logging in again.
Learn more about how Statista can support your business.
Activate. (October 10, 2023). Average monthly video game expenditure per gamer in the United States from 2019 to 2023 (in U.S. dollars) [Graph]. In Statista. Retrieved October 18, 2025, from https://www.statista.com/statistics/259569/distribution-of-monthly-consumer-spending-on-video-gaming-in-the-us/
Activate. "Average monthly video game expenditure per gamer in the United States from 2019 to 2023 (in U.S. dollars)." Chart. October 10, 2023. Statista. Accessed October 18, 2025. https://www.statista.com/statistics/259569/distribution-of-monthly-consumer-spending-on-video-gaming-in-the-us/
Activate. (2023). Average monthly video game expenditure per gamer in the United States from 2019 to 2023 (in U.S. dollars). Statista. Statista Inc.. Accessed: October 18, 2025. https://www.statista.com/statistics/259569/distribution-of-monthly-consumer-spending-on-video-gaming-in-the-us/
Activate. "Average Monthly Video Game Expenditure per Gamer in The United States from 2019 to 2023 (in U.S. Dollars)." Statista, Statista Inc., 10 Oct 2023, https://www.statista.com/statistics/259569/distribution-of-monthly-consumer-spending-on-video-gaming-in-the-us/
Activate, Average monthly video game expenditure per gamer in the United States from 2019 to 2023 (in U.S. dollars) Statista, https://www.statista.com/statistics/259569/distribution-of-monthly-consumer-spending-on-video-gaming-in-the-us/ (last visited October 18, 2025)
Average monthly video game expenditure per gamer in the United States from 2019 to 2023 (in U.S. dollars) [Graph], Activate, October 10, 2023. [Online]. Available: https://www.statista.com/statistics/259569/distribution-of-monthly-consumer-spending-on-video-gaming-in-the-us/