Feature scaling is a technique to improve the accuracy of machine learning models. This can be done by removing unreliable data points from the training set so that the model can learn useful information about relevant features. Feature scaling is widely used in many fields, including business analytics and clinical data science.
Feature Scaling Using R Programming Language
Feature scaling in R refers to the process of standardizing or normalizing the range of independent variables or features in a dataset. It ensures that each feature contributes equally to the model, preventing features with larger values from disproportionately influencing the results.
There are mainly two types of feature scaling techniques.
1. Standardization
Standardization is the simplest form of scaling, in which all the values are standardized to have a mean of zero and a standard deviation of one. For example, if you had a dataset with two variables (age and height), then you would calculate their means and standard deviations before performing any statistical tests on them.
 Feature Scaling Using R
2. Normalization
Normalization involves calculating the mean and median of a dataset and assessing their difference. If they significantly differ, it suggests something unusual about the data, preventing misleading conclusions, such as assuming a sample is representative of the population without further analysis. (e.g., "My kid might be taller than average because he grew faster than most kids his age").
 Feature Scaling Using R
Creating a Dataset to apply feature scaling in R
First, we need to create a dataframe to apply feature scaling techniques on the dataframe. We will explore different methods and libraries to do so.
R
age <- c(19,20,21,22,23,24,24,26,27)

salary <- c(10000,20000,30000,40000,
            50000,60000,70000,80000,90000)

df <- data.frame( "Age" = age,
                 "Salary" = salary,
                 stringsAsFactors = FALSE)
df
Output:
 Output
Once the dataset is created we can start implementing Feature Scaling.
We know the formulas for both standardization and normalization. Let's apply them one by one.
1. For Standardization
We are manually standardizing the dataset df using z-score normalization. Each column is transformed with the formula (x - \text{mean}) / \text{sd} and the result is saved as a new data frame scaled_data.
R
scaled_data <- as.data.frame(sapply(df, function(x)
                      (x-mean(x))/sd(x)))
scaled_data
Output:
 Output
2. For Normalization
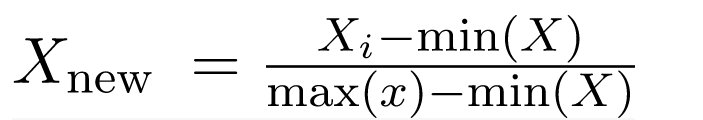
We are manually normalizing the dataset df to a 0–1 range using the min-max formula. Each column is transformed using the expression (x - \text{min}) / (\text{max} - \text{min}) and the result is stored as a new data frame scaled_data2.
R
scaled_data2 <- as.data.frame(sapply(df, function(x)
                      (x-min(x))/(max(x)-min(x))))
scaled_data2
Output:
 Output
Using Caret Library
Let's import the library caret and then apply the Standardization and Normalisation.
1. Standardization Using Caret Library
We are standardizing the dataset df by centering and scaling its numeric features using the caret package. First, we create a preprocessing model with preProcess(), then apply it to the data using predict().
R
install.packages("caret")
library(caret)

data1.pre <- preProcess(df, method=c("center", "scale"))
data1<- predict(data1.pre, df)
data1
Output:
 Output
2. Normalisation Using Caret Library
We are normalizing the dataset df to a 0–1 range using the caret package. First, we create a preprocessing model with preProcess(method = "range"), then apply it to the data using predict().
R
library("caret")

data2.pre <- preProcess(df, method="range")
data2 <- predict(data2.pre, df)
data2
Output:
 Output
Using Dplyr Library
Let's import the library dplyr and then apply the Standardization and Normalisation.
1. Standardization Using Dplyr Library
We are standardizing the "Salary" column in the dataset df using the scale() function. After loading the dplyr package, we use mutate_at() to apply z-score normalization to the "Salary" column and store the result in data_s.
R
install.packages("dplyr")
library(dplyr)

data_s <- df %>%
mutate_at(vars("Salary"), scale)
data_s
Output:
 Output
2. Normalisation Using Dplyr Library
We are standardizing all columns in the dataset df using the scale() function. With the dplyr package, we use mutate_all() to apply z-score normalization to every column and save the result in data_n.
R
library(dplyr)

data_n <- df %>%
mutate_all(scale)
data_n
Output:
 Output
Using BBmisc package
BBmisc is an R package so with the help of it we can calculate the standardization and normalization.
1. Standardization Using BBmisc package
We are standardizing the entire dataset df using the BBmisc package. The normalize() function with method = "standardize" applies z-score normalization to all numeric columns and stores the result in df_standardized.
R
install.packages("BBmisc")
library(BBmisc)

df_standardized <- BBmisc::normalize(df, method = "standardize")

df_standardized
Output:
 Output
2. Normalization Using BBmisc package
We are normalizing the dataset df to a 0–1 range using the BBmisc package. The normalize() function with method = "range" scales all numeric columns and stores the result in df_normalized.
R
library(BBmisc)

df_normalized <- BBmisc::normalize(df, method = "range")

df_normalized
Output:
 Output
In this article, we explored various methods for performing feature scaling in R using different libraries and techniques.
Similar Reads
SVM Feature Selection in R with Example In machine learning, SVM is often praised for its robustness and accuracy, particularly in binary classification problems. However, like any model, its performance can be heavily dependent on the input features. Effective feature selection not only simplifies the model by reducing the number of vari
4 min read
GE Stock Price Analysis Using R Language Stock analysis is a technique used by investors and traders to make purchasing and selling choices. Investors and traders strive to obtain an advantage in the markets by making educated judgments by researching and analyzing previous and current data. In this article, we will analyze the 'GE Stock P
5 min read
Feature Selection with the Caret R Package The Caret (Classification And REgression Training) is an R package that provides a unified interface for performing machine learning tasks, such as data preprocessing, model training and performance evaluation. One of the tasks that Caret can help with is feature selection, which involves selecting
6 min read
R Programming for Data Science R is an open-source programming language used statistical software and data analysis tools. It is an important tool for Data Science. It is highly popular and is the first choice of many statisticians and data scientists.R includes powerful tools for creating aesthetic and insightful visualizations.
13 min read
Sentiment Analysis Using quanteda in R Sentiment analysis is the technique used to determine the sentiment expressed in the piece of text, classifying it as positive, negative or neutral. In R, the quanteda package is the robust tool for text processing. While sentimentr can be used for sentiment analysis. This article will guide you thr
3 min read
Learn R Programming R is a Programming Language that is mostly used for machine learning, data analysis, and statistical computing. It is an interpreted language and is platform independent that means it can be used on platforms like Windows, Linux, and macOS. In this R Language tutorial, we will Learn R Programming La
15+ min read