Venn diagrams are visual tools used to show relationships between different sets. They use overlapping circles to represent how sets intersect, share elements, or stay separate. These diagrams help categorize items, making it easier to understand similarities and differences.
In mathematics, Venn diagrams are placed inside a rectangle, which represents the universal set—a set that contains all elements from all the sets shown. This visual method makes it easier to understand complex relationships between sets.

Venn Diagrams are used to represent the groups of data in circles, if the circles are overlapping, some elements in the groups are common, if they are not overlapping, there is nothing common between the groups or sets of data.
Venn Diagram Examples
Venn diagrams are highly useful in solving problems of sets and other problems. They are useful in representing the data in picture form. Let's learn more about the Venn diagram through an example,
Example 1: Take a set A representing even numbers up to 10 and another set B representing natural numbers less than 5 then their interaction is represented using the Venn diagram.
Solution:

How to Draw a Venn Diagram?
The above symbols are used while drawing and showing the relationship among sets. In order to draw a Venn diagram.
Step 1: Start by drawing a Rectangle showing the Universal Set.

Step 2: According to the number of sets given and the relationship between/among them, draw different circles representing different Sets.

Step 3: Find the intersection or union of the set using the condition given.

Read More: Representation of a Set
Venn Diagram for Sets Operations
There are different operations that can be done on sets in order to find the possible unknown parameter, for example, if two sets have something in common, their intersection is possible. The basic operations performed on the set are,
Let's look at these set operations and how they look on the Venn diagram.
Venn Diagram of Union of Sets
The Union of two or more two sets represents the data of the sets without repeating the same data more than once, it is shown with the symbol ⇢∪.
n(A∪ B) = {a: a∈ A OR a∈ B}

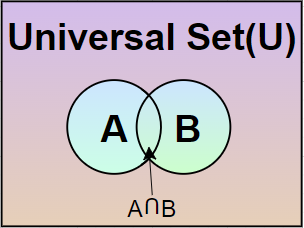
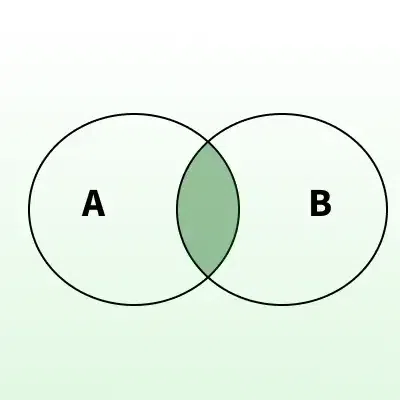
Venn Diagram of Intersection of Sets
The intersection of two or more two sets means extracting only the amount of data that is common between/among the sets. The symbol used for the intersection⇢ ∩.
n(A∩ B)= {a: a∈ A and a∈ B}
Venn Diagram of Complement of a Set
Complementing a set means finding the value of the data present in the Universal set other than the data of the set.
n(A') = U- n(A)

Venn Diagram of Difference of Set
Suppose we take two sets, Set A and Set B then their difference is given as A - B. This difference represents all the values of set A which are not present in set B.
For example, if we take Set A = {1, 2, 3, 4, 5, 6} and set B = {2, 4, 6, 8} then A- B = {1, 3, 5}.
In the Venn diagram, we represent the A - B as the area of set A which is not intersecting with set B.
The concept of the Venn diagram is very useful for solving a variety of problems in Mathematics and others. To understand more about it lets learn some important terms related to it.
Universal Set
Universal Set is a large set that contains all the sets which we are considering in a particular situation.
For example, suppose we are considering the set of Honda cars in a society say set A, and let set B is the group of red car in the same society then the set of all the cars in that society is the universal set as it contains the values of both the sets, set A and set B in consideration.
The image representing the Universal set is discussed below,
Subset
Subset is actually a set of values that is contained inside another set i.e. we can say that set B is the subset of set A if all the values of set B are contained in set A.
For example, if we take N as the set of all the natural numbers and W as the set of all whole numbers then,
- N = Set of all Natural Numbers
- W = Set of all Whole Numbers
We can say that N is a subset of W all the values of set N are contained in set W i.e.,N ⊆ W
We use Venn diagrams to easily represent a subset of a set. The images discussing the subset of a set are given below,

Venn Diagram Symbols
In order to draw a Venn diagram, first, understand the type of symbols used in sets. Sets can be easily represented on the Venn diagram and the parameters are easily taken out from the diagram itself. We use various types of symbols in drawing Venn diagrams, some of the most important types of symbols used in drawing Venn diagrams are,
Venn Diagram Symbols | Name of Symbol | Description |
|---|
∪ | Union Symbol | Union symbol is used for taking the union of two or more sets. |
∩ | Intersection Symbol | Intersection symbol is used for taking the intersection of two or more sets. |
A' or Ac | Compliment Symbol | Complement symbol is used for taking the complement of a set. |
Types of Venn Diagrams
There are various types of Venn diagrams that are widely used in Mathematics and other related fields. They are categorized based on the number of sets involved or circles involved in the Universal set.
- Two-set Venn diagram
- Three-set Venn diagram
- Four-set Venn diagram
- Five-set Venn diagram
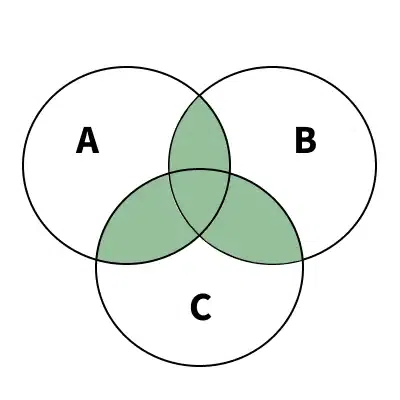
Venn Diagram for Three Sets
We can represent three sets easily using the Venn Diagram. Their representation is done by three overlapping circles. Suppose we take three sets of Set A of the people who play cricket. Set B of the people who are graduates and Set C of the people who are 18 years and above of the age.
Then the Venn diagram representing the above three sets is drawn using three circles and taking their intersection wherever required.
We can represent the intersection of three sets using the Venn diagram. The below image represents the intersection of three sets.

We can find the various parameters using the above Venn diagram.
Suppose we have to find,
- No of graduates who play cricket it is given by B⋂C
- No of graduates who play cricket and are at least 18 years old is given by A⋂B⋂C, etc.
Also Check:
We use various formulas of the set to find various parameters of the sets.
Let's take two sets, set A and set B then the various formulas of the sets are,
n(A U B) = n(A) + n(B) – n (A ⋂ B)
Where,
- n(A) represents the number of elements in set A,
- n(B) represents the number of elements in set B,
- n(A U B) represent the number of elements in A U B, and
- n(A ⋂ B) represent the number of elements in A ⋂ B
Similarly, for three sets, Set A, Set B, and Set C we get,
n (A U B U C) = n(A) + n(B) + n(C) - n(A ⋂ B) - n(B ⋂ C) - n(C ⋂ A) + n(A ⋂ B ⋂ C)
We can understand these formulas with the help of the example discussed below,
Example: In a class of 40 students, 18 like Mathematics, 16 like Science, and 10 like both Mathematics and Science. Then find the students who like either Mathematics or Science.
Solution:
Let A be the set of students who like Mathematics and B be the set of students who like Science, then
n(A) = 18,
n(B) = 16, and
n(A ⋂ B) = 10
Now to find the number of students who like either Mathematics or Science i.e. n(A U B) we use the above formula.
n(A U B) = n(A) + n(B) – n (A ⋂ B)
⇒ n(A U B) = 18 + 16 - 10
⇒ n(A U B) = 24
Uses and Applications of Venn Diagram
Venn diagrams have various use cases such as solving various problems and representing the data in an easy-to-understand format. Various applications of Venn Diagrams are:
- The relation between various sets and their operations can be easily achieved using Venn diagrams.
- They are used for explaining large data sets in a very easy way.
- They are used for logic building and finding the solution to complex data problems.
- They are used to solve problems based on various analogies.
- Analysts use Venn diagrams to represent complex data in easily understandable ways, etc.
Related Article on Venn Diagram:
Solved Example Problems on Venn Diagram
Example 1: Set A= {1, 2, 3, 4, 5} and U= {1, 2, 3, 4, 5, 6, 7, 8, 9, 10}. Represent A' or Ac on the Venn diagram.
Solution:
Venn Diagram for A'

Example 2: In a Group of people, 50 people either speak Hindi or English, 10 prefer speaking both Hindi and English, 20 prefer only English. How many people prefer speaking Hindi? Explain both by formula and by Venn diagram.
Solution:
According to formula,
n(H∪E) = n(H) + n(E) - n(H∩E)
Both English and Hindi speakers, n(H∩E) = 10
English speakers, n(E)= 20
Either Hindi or English, n(H∪E)= 50
50= 20+ n(H) - 10
n(H)= 50 - 10
n(H)= 40
From Venn Diagram,

Example 3: In a Class, Students like to play these games- Football, Cricket, and Volleyball. 5 students Play all 3 games, 20 play Football, 30 play Volleyball, and 40 play Cricket. 10 play both cricket and volleyball, 12 play both football and cricket, 9 play both football and volleyball. How many students are present in the class?
Solution:
n(F∪ C∪ V)= n(F)+ n(C)+ n(V) - n(F∩C) - n(F∩V) - n(C∩V)+ n(F∩ C∩ V)
n(F∪ C∪ V)= 20+ 30+ 40- 10-12-9+5
n(F∪ C∪ V)= 64
There are 64 Students in the class.
Example 4: Represent the above information with the help of a Venn diagram showing the amount of data present in each set.
Solution:
Above information should look something like this on Venn diagram,

Example 5: Below given Venn diagram has all the sufficient information required to show the data of all the sets possible. Observe the diagram carefully then answer the following.

- What is the value of n(A∩ B∩ C)?
- What is the value of n(C)?
- What is the value of n(B ∩ A)?
- What is the value of n(A∪ B∪ C)?
- What is the value of n(B')?
Solution:
Observing the Venn diagram, the above questions can be easily answered,
1. n(A ∩ B∩ C) = 5
2. n(C) = 15 + 5 + 5 + 5 = 30
3. n( B∩A) = 5 + 5 = 10
4. n(A∪ B∪ C) = 15+ 20 + 10 + 5 + 5 + 5 + 5 = 65
5. n(B') = U - n(B) = 100 - (20 + 5 + 5 + 5) = 100 - 35 = 65
➣ Suggested Article: Venn Diagrams on Reasoning
Venn Diagrams Practice Questions
Question 1: Consider two sets, A and B, where A represents fruits and B represents vegetables. Set A contains apples, bananas, and grapes, while set B contains carrots, lettuce, and apples. Draw a Venn diagram to represent these sets. How many items are only in the fruit category?
Question 2: In a small neighborhood, 10 households have dogs, 7 have cats, and 3 households have both dogs and cats. How many households have at least one kind of pet? Draw a Venn diagram to represent this situation.
Question 3: In a sports club, 120 members play tennis, 150 play badminton, and 50 play both tennis and badminton. How many members play either tennis or badminton? Create a Venn diagram to help you answer.
Question 4: In a class of 30 students, 18 students play basketball, 12 students play football, and 8 students play both basketball and football. How many students do not play either basketball or football?
Question 5: A survey of 100 people was conducted to find their preferences for three types of movies: Action, Comedy, and Drama. The survey results showed:
- 45 people like Action movies.
- 50 people like Comedy movies.
- 60 people like Drama movies.
- 25 people like both Action and Comedy.
- 30 people like both Comedy and Drama.
- 20 people like both Drama and Action.
- 10 people like all three types of movies.
How many people like exactly two types of movies?
Conclusion
Venn diagrams, created by English logician John Venn in the 1880s. Venn diagrams are a powerful tool for visualizing the relationships between different sets, making complex concepts more accessible and easier to understand. Using overlapping circles within a rectangle (the universal set), they illustrate how sets intersect, differ, and relate, with each circle representing a different set. Overlapping regions show common elements, while non-overlapping areas highlight unique element. Venn diagrams are applied across various fields for problem-solving, data presentation, and logical reasoning, making them a versatile tool for educators, students, and professionals alike.
Suggested Quiz
10 Questions
Which expression correctly explains the following Venn diagram?
Explanation:
The shaded area is the common area of both circles, i.e., the intersection of sets A and B.
Which expression correctly explains the following Venn diagram?

Explanation:
The shaded area represents all the elements that are in set B but not in set A, i.e., B − A.
Which expression correctly explains the following Venn diagram?

Explanation:
The shaded area in the image represents all the elements which are neither in set A nor in set B i.e., (A ⋃ B)c.
Which expression correctly explains the following Venn diagram?

Explanation:
The shaded area represents all the elements which are not in A i.e. Ac.
Which expression correctly explains the following Venn diagram?

Explanation:
The shaded part is the intersection of set B and set C, where the intersection of all three is set missing i.e., (B ⋂ C) - (A ⋂ B ⋂ C).
Which of the following statements about Venn diagrams is true?

-
-
(B ⋃ C)' ⋃ [(B ⋂ C) - (A ⋂ B ⋂ C)
-
-
Explanation:
The shaded region contains elements which are neither in B nor C i.e., (B ⋃ C)' but there is one more shaded region other than this i.e., (B ⋂ C) - (A ⋂ B ⋂ C).
Thus, the shaded region is (B ⋃ C)' ⋃ [(B ⋂ C) - (A ⋂ B ⋂ C).
Which of the following statements about Venn diagrams is true?

Explanation:
As (A ⋃ B ⋃ C)' represents elements which are not present in A, B or C. However, in the shaded region given, all the elements of C are also present.
Thus, the shaded region can be represented by C ⋃ (A ⋃ B ⋃ C)'.
Which of the following statements about Venn diagrams is true?

-
(A ⋂ B) ⋃ (B ⋂ C) ⋃ (A ⋂ C)
-
[(A ⋂ B) ⋃ (B ⋂ C) ⋃ (A ⋂ C)]'
-
(A ⋂ B) ⋃ (B ⋂ C) ⋃ (A ⋂ C) - (A ⋂ B ⋂ C)
-
Explanation:
The shaded region contains all the elements which are part of at most 1 set i.e., union of all the common parts of sets. This can be represented as: (A ⋂ B) ⋃ (B ⋂ C) ⋃ (A ⋂ C)
Which of the following statements about Venn diagrams is true?

Explanation:
The shaded region contains all the elements which are not in all three sets i.e., (A ⋂ B ⋂ C)'
Which of the following statements about Venn diagrams is true?
-
(A ⋂ B) ⋃ (B ⋂ C) ⋃ (A ⋂ C)
-
[(A ⋂ B) ⋃ (B ⋂ C) ⋃ (A ⋂ C)]'
-
(A ⋃ B) ⋂ (B ⋃ C) ⋂ (A ⋃ C)
-
Explanation:
The shaded region contains all the elements which are in at least one set i.e., (A ⋂ B) ⋃ (B ⋂ C) ⋃ (A ⋂ C)
Quiz Completed Successfully
Your Score : 2/10
Accuracy : 0%
Login to View Explanation
1/10
1/10
< Previous
Next >
Similar Reads
Maths Mathematics, often referred to as "math" for short. It is the study of numbers, quantities, shapes, structures, patterns, and relationships. It is a fundamental subject that explores the logical reasoning and systematic approach to solving problems. Mathematics is used extensively in various fields
5 min read
Basic Arithmetic
What are Numbers?Numbers are symbols we use to count, measure, and describe things. They are everywhere in our daily lives and help us understand and organize the world.Numbers are like tools that help us:Count how many things there are (e.g., 1 apple, 3 pencils).Measure things (e.g., 5 meters, 10 kilograms).Show or
15+ min read
Arithmetic OperationsArithmetic Operations are the basic mathematical operations—Addition, Subtraction, Multiplication, and Division—used for calculations. These operations form the foundation of mathematics and are essential in daily life, such as sharing items, calculating bills, solving time and work problems, and in
9 min read
Fractions - Definition, Types and ExamplesFractions are numerical expressions used to represent parts of a whole or ratios between quantities. They consist of a numerator (the top number), indicating how many parts are considered, and a denominator (the bottom number), showing the total number of equal parts the whole is divided into. For E
7 min read
What are Decimals?Decimals are numbers that use a decimal point to separate the whole number part from the fractional part. This system helps represent values between whole numbers, making it easier to express and measure smaller quantities. Each digit after the decimal point represents a specific place value, like t
10 min read
ExponentsExponents are a way to show that a number (base) is multiplied by itself many times. It's written as a small number (called the exponent) to the top right of the base number.Think of exponents as a shortcut for repeated multiplication:23 means 2 x 2 x 2 = 8 52 means 5 x 5 = 25So instead of writing t
9 min read
PercentageIn mathematics, a percentage is a figure or ratio that signifies a fraction out of 100, i.e., A fraction whose denominator is 100 is called a Percent. In all the fractions where the denominator is 100, we can remove the denominator and put the % sign.For example, the fraction 23/100 can be written a
5 min read
Algebra
Variable in MathsA variable is like a placeholder or a box that can hold different values. In math, it's often represented by a letter, like x or y. The value of a variable can change depending on the situation. For example, if you have the equation y = 2x + 3, the value of y depends on the value of x. So, if you ch
5 min read
Polynomials| Degree | Types | Properties and ExamplesPolynomials are mathematical expressions made up of variables (often represented by letters like x, y, etc.), constants (like numbers), and exponents (which are non-negative integers). These expressions are combined using addition, subtraction, and multiplication operations.A polynomial can have one
9 min read
CoefficientA coefficient is a number that multiplies a variable in a mathematical expression. It tells you how much of that variable you have. For example, in the term 5x, the coefficient is 5 — it means 5 times the variable x.Coefficients can be positive, negative, or zero. Algebraic EquationA coefficient is
8 min read
Algebraic IdentitiesAlgebraic Identities are fundamental equations in algebra where the left-hand side of the equation is always equal to the right-hand side, regardless of the values of the variables involved. These identities play a crucial role in simplifying algebraic computations and are essential for solving vari
14 min read
Properties of Algebraic OperationsAlgebraic operations are mathematical processes that involve the manipulation of numbers, variables, and symbols to produce new results or expressions. The basic algebraic operations are:Addition ( + ): The process of combining two or more numbers to get a sum. For example, 3 + 5 = 8.Subtraction (−)
3 min read
Geometry
Lines and AnglesLines and Angles are the basic terms used in geometry. They provide a base for understanding all the concepts of geometry. We define a line as a 1-D figure that can be extended to infinity in opposite directions, whereas an angle is defined as the opening created by joining two or more lines. An ang
9 min read
Geometric Shapes in MathsGeometric shapes are mathematical figures that represent the forms of objects in the real world. These shapes have defined boundaries, angles, and surfaces, and are fundamental to understanding geometry. Geometric shapes can be categorized into two main types based on their dimensions:2D Shapes (Two
2 min read
Area and Perimeter of Shapes | Formula and ExamplesArea and Perimeter are the two fundamental properties related to 2-dimensional shapes. Defining the size of the shape and the length of its boundary. By learning about the areas of 2D shapes, we can easily determine the surface areas of 3D bodies and the perimeter helps us to calculate the length of
10 min read
Surface Areas and VolumesSurface Area and Volume are two fundamental properties of a three-dimensional (3D) shape that help us understand and measure the space they occupy and their outer surfaces.Knowing how to determine surface area and volumes can be incredibly practical and handy in cases where you want to calculate the
10 min read
Points, Lines and PlanesPoints, Lines, and Planes are basic terms used in Geometry that have a specific meaning and are used to define the basis of geometry. We define a point as a location in 3-D or 2-D space that is represented using coordinates. We define a line as a geometrical figure that is extended in both direction
14 min read
Coordinate Axes and Coordinate Planes in 3D spaceIn a plane, we know that we need two mutually perpendicular lines to locate the position of a point. These lines are called coordinate axes of the plane and the plane is usually called the Cartesian plane. But in real life, we do not have such a plane. In real life, we need some extra information su
6 min read
Trigonometry & Vector Algebra
Trigonometric RatiosThere are three sides of a triangle Hypotenuse, Adjacent, and Opposite. The ratios between these sides based on the angle between them is called Trigonometric Ratio. The six trigonometric ratios are: sine (sin), cosine (cos), tangent (tan), cotangent (cot), cosecant (cosec), and secant (sec).As give
4 min read
Trigonometric Equations | Definition, Examples & How to SolveTrigonometric equations are mathematical expressions that involve trigonometric functions (such as sine, cosine, tangent, etc.) and are set equal to a value. The goal is to find the values of the variable (usually an angle) that satisfy the equation.For example, a simple trigonometric equation might
9 min read
Trigonometric IdentitiesTrigonometric identities play an important role in simplifying expressions and solving equations involving trigonometric functions. These identities, which include relationships between angles and sides of triangles, are widely used in fields like geometry, engineering, and physics. Some important t
10 min read
Trigonometric FunctionsTrigonometric Functions, often simply called trig functions, are mathematical functions that relate the angles of a right triangle to the ratios of the lengths of its sides.Trigonometric functions are the basic functions used in trigonometry and they are used for solving various types of problems in
6 min read
Inverse Trigonometric Functions | Definition, Formula, Types and Examples Inverse trigonometric functions are the inverse functions of basic trigonometric functions. In mathematics, inverse trigonometric functions are also known as arcus functions or anti-trigonometric functions. The inverse trigonometric functions are the inverse functions of basic trigonometric function
11 min read
Inverse Trigonometric IdentitiesInverse trigonometric functions are also known as arcus functions or anti-trigonometric functions. These functions are the inverse functions of basic trigonometric functions, i.e., sine, cosine, tangent, cosecant, secant, and cotangent. It is used to find the angles with any trigonometric ratio. Inv
9 min read
Calculus
Introduction to Differential CalculusDifferential calculus is a branch of calculus that deals with the study of rates of change of functions and the behaviour of these functions in response to infinitesimal changes in their independent variables.Some of the prerequisites for Differential Calculus include:Independent and Dependent Varia
6 min read
Limits in CalculusIn mathematics, a limit is a fundamental concept that describes the behaviour of a function or sequence as its input approaches a particular value. Limits are used in calculus to define derivatives, continuity, and integrals, and they are defined as the approaching value of the function with the inp
12 min read
Continuity of FunctionsContinuity of functions is an important unit of Calculus as it forms the base and it helps us further to prove whether a function is differentiable or not. A continuous function is a function which when drawn on a paper does not have a break. The continuity can also be proved using the concept of li
13 min read
DifferentiationDifferentiation in mathematics refers to the process of finding the derivative of a function, which involves determining the rate of change of a function with respect to its variables.In simple terms, it is a way of finding how things change. Imagine you're driving a car and looking at how your spee
2 min read
Differentiability of a Function | Class 12 MathsContinuity or continuous which means, "a function is continuous at its domain if its graph is a curve without breaks or jumps". A function is continuous at a point in its domain if its graph does not have breaks or jumps in the immediate neighborhood of the point. Continuity at a Point: A function f
11 min read
IntegrationIntegration, in simple terms, is a way to add up small pieces to find the total of something, especially when those pieces are changing or not uniform.Imagine you have a car driving along a road, and its speed changes over time. At some moments, it's going faster; at other moments, it's slower. If y
3 min read
Probability and Statistics
Basic Concepts of ProbabilityProbability is defined as the likelihood of the occurrence of any event. It is expressed as a number between 0 and 1, where 0 is the probability of an impossible event and 1 is the probability of a sure event.Concepts of Probability are used in various real life scenarios : Stock Market : Investors
7 min read
Bayes' TheoremBayes' Theorem is a mathematical formula used to determine the conditional probability of an event based on prior knowledge and new evidence. It adjusts probabilities when new information comes in and helps make better decisions in uncertain situations.Bayes' Theorem helps us update probabilities ba
13 min read
Probability Distribution - Function, Formula, TableA probability distribution is a mathematical function or rule that describes how the probabilities of different outcomes are assigned to the possible values of a random variable. It provides a way of modeling the likelihood of each outcome in a random experiment.While a Frequency Distribution shows
13 min read
Descriptive StatisticStatistics is the foundation of data science. Descriptive statistics are simple tools that help us understand and summarize data. They show the basic features of a dataset, like the average, highest and lowest values and how spread out the numbers are. It's the first step in making sense of informat
5 min read
What is Inferential Statistics?Inferential statistics is an important tool that allows us to make predictions and conclusions about a population based on sample data. Unlike descriptive statistics, which only summarize data, inferential statistics let us test hypotheses, make estimates, and measure the uncertainty about our predi
7 min read
Measures of Central Tendency in StatisticsCentral tendencies in statistics are numerical values that represent the middle or typical value of a dataset. Also known as averages, they provide a summary of the entire data, making it easier to understand the overall pattern or behavior. These values are useful because they capture the essence o
11 min read
Set TheorySet theory is a branch of mathematics that deals with collections of objects, called sets. A set is simply a collection of distinct elements, such as numbers, letters, or even everyday objects, that share a common property or rule.Example of SetsSome examples of sets include:A set of fruits: {apple,
3 min read
Practice