Windows Debugging with WinDbg
- 1. Low-Level Windows Debugging with WinDbg ARNO HUETTER
- 2. About the Author Arno Huetter Arno wrote his first lines of code on a Sinclair ZX80 in 1984. Over the years, he has been programming in C/C++, Java and C#, and also did quite some database development. Today he is Development Lead at Dynatrace (APM vendor).
- 4. The Unsung Hero of Debugging
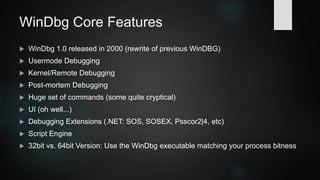
- 5. WinDbg Core Features WinDbg 1.0 released in 2000 (rewrite of previous WinDBG) Usermode Debugging Kernel/Remote Debugging Post-mortem Debugging Huge set of commands (some quite cryptical) UI (oh well...) Debugging Extensions (.NET: SOS, SOSEX, Psscor2|4, etc) Script Engine 32bit vs. 64bit Version: Use the WinDbg executable matching your process bitness
- 6. What about Visual Studio Debugger? Visual Studio Debugger? Easier to use Sufficient for many debugging problems Also supports remote, kernel and post-mortem debugging WinDbg helps on the really tough cases (and most interesting ones) For example, one might just have a function offset from an eventlog entry (no symbols), or some bytes from the stack, or a dump from an old binary without symbols, or... Problem might be not reproducible and only happening in production in border case scenario, or at Windows startup, in a driver, etc. WinDbg is well suited for post-mortem, can also connect over RS232, USB. Lightweight installation, WinDbg even runs from USB stick. WinDbg Extensions and Scripts provide powerful means, e.g. to analyze heap corruption, etc.
- 7. WinDbg Download Part of Windows SDK/WDK, choose Debugging Tools within SDK Download Installer https://msdn.microsoft.com/en- us/library/windows/hardware/ff551063%28v=vs.85%29.aspx
- 9. Set your Symbol Path
- 10. Demo 1: Finding a Memory Leak Enable allocation backtracking (gflags is part of Debugging Tools; be careful though, backtracking adds considerable runtime overhead) gflags /i plauscherl.exe +ust Display heap summary 0:001> !heap -s Heap Flags Reserv Commit Virt Free List UCR Virt Lock Fast (k) (k) (k) (k) length blocks cont. heap ----------------------------------------------------------------------------- 039c0000 08000002 16420 8520 16364 158 26 5 0 0 LFH 03c10000 08001002 60 12 60 3 2 1 0 0 -----------------------------------------------------------------------------
- 11. Finding a Memory Leak Display heap status by entry size 0:001> !heap -stat -h 039c0000 heap @ 039c0000 group-by: TOTSIZE max-display: 20 size #blocks total ( %) (percent of total busy bytes) fa0 158 - 14ff00 (97.12) 17d8 1 - 17d8 (0.43) 10d2 1 - 10d2 (0.30) 1000 1 - 1000 (0.29) 20 68 - d00 (0.23)
- 12. Finding a Memory Leak Filter by entry size 0:001> !heap -flt s fa0 _HEAP @ 39c0000 HEAP_ENTRY Size Prev Flags UserPtr UserSize - state 039d1190 01f7 0000 [00] 039d11a8 00fa0 - (busy) 039d2148 01f7 01f7 [00] 039d2160 00fa0 - (busy) 039d3100 01f7 01f7 [00] 039d3118 00fa0 - (busy) 039d40b8 01f7 01f7 [00] 039d40d0 00fa0 - (busy)
- 13. Finding a Memory Leak Inspect entry and get allocation backtrace 0:001> !heap -p -a 039d1190 address 039d1190 found in _HEAP @ 39c0000 HEAP_ENTRY Size Prev Flags UserPtr UserSize - state 039d1190 01f7 0000 [00] 039d11a8 00fa0 - (busy) 77b3cdb3 ntdll!RtlpCallInterceptRoutine+0x00000026 77af71f1 ntdll!RtlAllocateHeap+0x000461d1 73f3f7cb ucrtbase!malloc+0x0000002b d112d plauscherl!operator new+0x0000002c d1027 plauscherl!allocateStuff+0x00000027 d12f6 plauscherl!__scrt_common_main_seh+0x000000ff 77447c04 KERNEL32!BaseThreadInitThunk+0x00000024 77acad1f ntdll!__RtlUserThreadStart+0x0000002f
- 14. Demo 2: Analyzing Crash by Offset We might only have something like this eventlog entry Faulting application name: plauscherl.exe, version: 0.0.0.0, time stamp: 0x5669ec61 Faulting module name: plauscherl.exe, version: 0.0.0.0, time stamp: 0x5669ec61 Exception code: 0xc0000005 Fault offset: 0x00011a2e Simply attach WinDbg to .exe or .dll only windbg -z plauscherl.exe ModLoad: 00400000 00420000 plauscherl.exe
- 15. Analyzing Crash by Offset Disassemble at offset 0:000> uf 0x00411a2e plauscherl!doSomethingWrong [@ 25]: 25 00411a10 55 push ebp 25 00411a11 8bec mov ebp,esp 25 00411a13 81ecc0000000 sub esp,0C0h 25 00411a19 53 push ebx 25 00411a1a 56 push esi 25 00411a1b 57 push edi 25 00411a1c 8dbd40ffffff lea edi,[ebp-0C0h] 25 00411a22 b930000000 mov ecx,30h 25 00411a27 b8cccccccc mov eax,0CCCCCCCCh 25 00411a2c f3ab rep stos dword ptr es:[edi] 26 00411a2e c7050000000000000000 mov dword ptr ds:[0],0
- 16. Demo 3: Analyzing a Crashdump With dump file: Show stack of selected thread 0:000:x86> k # ChildEBP RetAddr 00 0100f97c 003d19e3 plauscherl!doSomethingWrong+0x1e 01 0100fa50 003d1b86 plauscherl!doSomething+0x23 02 0100fb24 003d238e plauscherl!main+0x76 03 0100fb38 003d21da plauscherl!invoke_main+0x1e 04 0100fb90 003d206d plauscherl!__scrt_common_main_seh+0x15a 05 0100fb98 003d23a8 plauscherl!__scrt_common_main+0xd 06 0100fba0 77447c04 plauscherl!mainCRTStartup+0x8 07 0100fbb4 77acad1f kernel32!BaseThreadInitThunk+0x24 08 0100fbfc 77acacea ntdll_77a70000!__RtlUserThreadStart+0x2f 09 0100fc0c 00000000 ntdll_77a70000!_RtlUserThreadStart+0x1b
- 17. Analyzing a Crashdump Or: Run full-fledged analysis 0:000:x86> !analyze –v CONTEXT: (.ecxr) eax=cccccccc ebx=7f14b000 ecx=00000000 edx=0ff4f4b8 esi=007efaa8 edi=007ef9cc eip=012a151e esp=007ef900 ebp=007ef9cc iopl=0 nv up ei pl nz na pe nc cs=0023 ss=002b ds=002b es=002b fs=0053 gs=002b efl=00010206 plauscherl!doSomethingWrong+0x1e: 012a151e c7050000000000000000 mov dword ptr ds:[0],0 ds:002b:00000000=???????? EXCEPTION_RECORD: (.exr -1) ExceptionAddress: 012a151e (plauscherl!doSomethingWrong+0x0000001e) ExceptionCode: c0000005 (Access violation) Attempt to write to address 00000000
- 18. Analyzing a Crashdump STACK_TEXT: 007ef9cc 012a1563 007efb74 007efaa8 7f14b000 plauscherl!doSomethingWrong+0x1e 007efaa0 012a160a 00000000 00000000 7f14b000 plauscherl!doSomething+0x23 007efb74 012a1bff 00000002 00bb3f98 00bb1f58 plauscherl!main+0x7a 007efbc4 012a1a2f 007efbd8 758c919f 7f14b000 plauscherl!__tmainCRTStartup+0x1bf 007efbcc 758c919f 7f14b000 007efc1c 77e6a8cb plauscherl!mainCRTStartup+0xf 007efbd8 77e6a8cb 7f14b000 b92e2b36 00000000 kernel32!BaseThreadInitThunk+0xe 007efc1c 77e6a8a1 ffffffff 77e5f67f 00000000 ntdll!__RtlUserThreadStart+0x20 007efc2c 00000000 012a1113 7f14b000 00000000 ntdll!_RtlUserThreadStart+0x1b FAULTING_SOURCE_FILE: d:etcplauscherlplauscherlplauscherl.cpp FAULTING_SOURCE_LINE_NUMBER: 26
- 19. Demo 4: Analyzing a .NET Deadlock Enter: SOS (Son Of Strike) .NET Debugging Extension Load SOS (part of every CLR) 0:008> .loadby sos clr 0:008> .cordll -ve -u -l Automatically loaded SOS Extension CLRDLL: Loaded DLL C:WindowsMicrosoft.NETFrameworkv4.0.30319mscordacwks.dll CLR DLL status: Loaded DLL C:WindowsMicrosoft.NETFrameworkv4.0.30319mscordacwks.dll Memdumps: Always use sos.dll / mscordacwks.dll from identical CLR (version / bitness). Latest WinDbg releases can load matching sos.dll from Microsoft symbol server.
- 20. Analyzing a .NET Deadlock View managed thread 0:004> !clrstack OS Thread Id: 0x1e70 (4) Child SP IP Call Site 056cf7dc 77aaca2c [GCFrame: 056cf7dc] 056cf8b4 77aaca2c [GCFrame: 056cf8b4] 056cf8d0 77aaca2c [HelperMethodFrame_1OBJ: 056cf8d0] System.Threading.Monitor.ReliableEnter(System.Object, Boolean ByRef) 056cf94c 7042a287 System.Threading.Monitor.Enter(System.Object, Boolean ByRef) 056cf95c 02ca0741 netplauscherl.Program.DoSomethingImportant() 056cf98c 02ca06bb netplauscherl.Program+c.b__4_0() 056cf998 70446274 System.Threading.ThreadHelper.ThreadStart_Context(System.Object) 056cf9a4 7042a417 System.Threading.ExecutionContext.RunInternal(System.Threading.ExecutionContext, System.Threading.ContextCallback, System.Object, Boolean) 056cfa10 7042a366 System.Threading.ExecutionContext.Run(System.Threading.ExecutionContext, System.Threading.ContextCallback, System.Object, Boolean) 056cfa24 7042a321 System.Threading.ExecutionContext.Run(System.Threading.ExecutionContext, System.Threading.ContextCallback, System.Object) 056cfa3c 704461fc System.Threading.ThreadHelper.ThreadStart() 056cfb80 73181396 [GCFrame: 056cfb80] 056cfd64 73181396 [DebuggerU2MCatchHandlerFrame: 056cfd64 ]
- 21. Analyzing a .NET Deadlock Check who owns the locks 0:004> !syncblk Index SyncBlock MonitorHeld Recursion Owning Thread Info SyncBlock Owner 3 011d3eac 3 1 011d37e8 1e70 4 031f3104 System.Object 4 011d3ee0 3 1 011d51f0 1864 5 031f3110 System.Object ----------------------------- Total 4 CCW 0 RCW 0 ComClassFactory 0 Free 0
- 23. Some WinDbg commands Go g Set breakpoint at address bp [Addr] Set breakpoint at symbol (pattern) bm SymPattern Set breakpoint on access ba [r|w|e] [Size] Addr
- 24. More WinDbg commands Display callstack for selected thread k Display local variables and parameters dv [/i /t /V /a /n /z] [Pattern] Display type dt [-n|y] [mod!]Name [-n|y] [Field] [Addr] -abcehioprsv 0:000> dt 0x0100297c MYTYPE1 +0x000 a : 22 +0x004 b : 43 '+' +0x006 c : 0x0 +0x008 d : 0x0 +0x00c gn : [6] 0x0
- 25. More WinDbg commands Display callstacks for all threads ~* k Dump all registers r Show process environment block !peb Display time consumption per thread !runaway Search memory for pattern s -[Flags][b|w|d|q|a|u] Range Pattern
- 26. Selected SOS commands Display managed callstack !CLRStack [-a] [-l] [-p] [-n] Display managed / unmanaged callstack for all threads (see: !DumpStack) !EEStack [-short] [-EE] Display IL associated with managed method !DumpIL <Managed DynamicMethod object> | <MethodDesc pointer> Heap object statistics !DumpHeap –stat Display object at specified address !DumpObj [-nofields] <object address>
- 27. Selected SOSEX commands Display deadlocks between SyncBlocks and/or ReaderWriterLocks !dlk [-d] Display GC roots for the specified object !mroot <ObjectAddr> [-all] Print a stack trace of managed and unmanaged frames !mk Search the managed heap for strings strings [ModuleAddress] [Options]
- 28. Selected PSSCOR commands Displays all objects on stack !DumpStackObjects Shows detailed info about running HttpRuntime (ASP.NET) !DumpHttpRuntime Save all .NET assemblies to local disk !SaveAllModules folderName Dump all exceptions found in heap (incl. callstacks) !dae Find managed MethodDesc and JITted code address !Name2EE mscorlib.dll System.String.ToString
- 29. For your Toolbox MS DebugDiag http://blogs.msdn.com/b/debugdiag/ Process-specific rules for crashes, perfcounters, memory usage, exceptions Creates full dumps, mini dumps, stack traces Built-in auto-analysis
- 30. MS DebugDiag
- 31. For your Toolbox SysInternals ProcDump https://technet.microsoft.com/en-us/sysinternals/dd996900.aspx Commandline tool for dump creation Can be event-triggered, e.g. CPU usage MS AppVerifier https://msdn.microsoft.com/en-us/library/ms220948(v=vs.90).aspx Runtime verification for native code, e.g. memory corruption
- 32. For your Toolbox VerySleepy http://www.codersnotes.com/sleepy/ CPU profiler Samples native callstacks, aggregates results over time
- 33. Online Resources Common WinDbg Commands (Thematically Grouped) http://windbg.info/doc/1-common-cmds.html SOS.dll (SOS Debugging Extension) https://msdn.microsoft.com/en-us/library/bb190764(v=vs.110).aspx "If broken it is, fix it you should" - Tess Ferrandez Blog https://blogs.msdn.microsoft.com/tess/ Software Diagnostics Institute http://www.dumpanalysis.org/
- 34. Books Hewardt, Pravat: “Advanced Windows Debugging” Vostokov, D.: “Memory Dump Analysis”
- 35. Thank you! Twitter: https://twitter.com/ArnoHu Blog: http://arnosoftwaredev.blogspot.com


![Finding a Memory Leak
Filter by entry size
0:001> !heap -flt s fa0
_HEAP @ 39c0000
HEAP_ENTRY Size Prev Flags UserPtr UserSize - state
039d1190 01f7 0000 [00] 039d11a8 00fa0 - (busy)
039d2148 01f7 01f7 [00] 039d2160 00fa0 - (busy)
039d3100 01f7 01f7 [00] 039d3118 00fa0 - (busy)
039d40b8 01f7 01f7 [00] 039d40d0 00fa0 - (busy)](https://image.slidesharecdn.com/windowsdebugging-151214173937/85/Windows-Debugging-with-WinDbg-12-320.jpg)
![Finding a Memory Leak
Inspect entry and get allocation backtrace
0:001> !heap -p -a 039d1190
address 039d1190 found in
_HEAP @ 39c0000
HEAP_ENTRY Size Prev Flags UserPtr UserSize - state
039d1190 01f7 0000 [00] 039d11a8 00fa0 - (busy)
77b3cdb3 ntdll!RtlpCallInterceptRoutine+0x00000026
77af71f1 ntdll!RtlAllocateHeap+0x000461d1
73f3f7cb ucrtbase!malloc+0x0000002b
d112d plauscherl!operator new+0x0000002c
d1027 plauscherl!allocateStuff+0x00000027
d12f6 plauscherl!__scrt_common_main_seh+0x000000ff
77447c04 KERNEL32!BaseThreadInitThunk+0x00000024
77acad1f ntdll!__RtlUserThreadStart+0x0000002f](https://image.slidesharecdn.com/windowsdebugging-151214173937/85/Windows-Debugging-with-WinDbg-13-320.jpg)

![Analyzing Crash by Offset
Disassemble at offset
0:000> uf 0x00411a2e
plauscherl!doSomethingWrong [@ 25]:
25 00411a10 55 push ebp
25 00411a11 8bec mov ebp,esp
25 00411a13 81ecc0000000 sub esp,0C0h
25 00411a19 53 push ebx
25 00411a1a 56 push esi
25 00411a1b 57 push edi
25 00411a1c 8dbd40ffffff lea edi,[ebp-0C0h]
25 00411a22 b930000000 mov ecx,30h
25 00411a27 b8cccccccc mov eax,0CCCCCCCCh
25 00411a2c f3ab rep stos dword ptr es:[edi]
26 00411a2e c7050000000000000000 mov dword ptr ds:[0],0](https://image.slidesharecdn.com/windowsdebugging-151214173937/85/Windows-Debugging-with-WinDbg-15-320.jpg)

![Analyzing a Crashdump
Or: Run full-fledged analysis
0:000:x86> !analyze –v
CONTEXT: (.ecxr)
eax=cccccccc ebx=7f14b000 ecx=00000000 edx=0ff4f4b8 esi=007efaa8 edi=007ef9cc
eip=012a151e esp=007ef900 ebp=007ef9cc iopl=0 nv up ei pl nz na pe nc
cs=0023 ss=002b ds=002b es=002b fs=0053 gs=002b efl=00010206
plauscherl!doSomethingWrong+0x1e:
012a151e c7050000000000000000 mov dword ptr ds:[0],0 ds:002b:00000000=????????
EXCEPTION_RECORD: (.exr -1)
ExceptionAddress: 012a151e (plauscherl!doSomethingWrong+0x0000001e)
ExceptionCode: c0000005 (Access violation)
Attempt to write to address 00000000](https://image.slidesharecdn.com/windowsdebugging-151214173937/85/Windows-Debugging-with-WinDbg-17-320.jpg)


![Analyzing a .NET Deadlock
View managed thread
0:004> !clrstack
OS Thread Id: 0x1e70 (4)
Child SP IP Call Site
056cf7dc 77aaca2c [GCFrame: 056cf7dc]
056cf8b4 77aaca2c [GCFrame: 056cf8b4]
056cf8d0 77aaca2c [HelperMethodFrame_1OBJ: 056cf8d0] System.Threading.Monitor.ReliableEnter(System.Object,
Boolean ByRef)
056cf94c 7042a287 System.Threading.Monitor.Enter(System.Object, Boolean ByRef)
056cf95c 02ca0741 netplauscherl.Program.DoSomethingImportant() 056cf98c 02ca06bb
netplauscherl.Program+c.b__4_0()
056cf998 70446274 System.Threading.ThreadHelper.ThreadStart_Context(System.Object)
056cf9a4 7042a417 System.Threading.ExecutionContext.RunInternal(System.Threading.ExecutionContext,
System.Threading.ContextCallback, System.Object, Boolean)
056cfa10 7042a366 System.Threading.ExecutionContext.Run(System.Threading.ExecutionContext,
System.Threading.ContextCallback, System.Object, Boolean)
056cfa24 7042a321 System.Threading.ExecutionContext.Run(System.Threading.ExecutionContext,
System.Threading.ContextCallback, System.Object)
056cfa3c 704461fc System.Threading.ThreadHelper.ThreadStart()
056cfb80 73181396 [GCFrame: 056cfb80]
056cfd64 73181396 [DebuggerU2MCatchHandlerFrame: 056cfd64 ]](https://image.slidesharecdn.com/windowsdebugging-151214173937/85/Windows-Debugging-with-WinDbg-20-320.jpg)


![Some WinDbg commands
Go
g
Set breakpoint at address
bp [Addr]
Set breakpoint at symbol (pattern)
bm SymPattern
Set breakpoint on access
ba [r|w|e] [Size] Addr](https://image.slidesharecdn.com/windowsdebugging-151214173937/85/Windows-Debugging-with-WinDbg-23-320.jpg)
![More WinDbg commands
Display callstack for selected thread
k
Display local variables and parameters
dv [/i /t /V /a /n /z] [Pattern]
Display type
dt [-n|y] [mod!]Name [-n|y] [Field] [Addr] -abcehioprsv
0:000> dt 0x0100297c MYTYPE1
+0x000 a : 22
+0x004 b : 43 '+'
+0x006 c : 0x0
+0x008 d : 0x0
+0x00c gn : [6] 0x0](https://image.slidesharecdn.com/windowsdebugging-151214173937/85/Windows-Debugging-with-WinDbg-24-320.jpg)
![More WinDbg commands
Display callstacks for all threads
~* k
Dump all registers
r
Show process environment block
!peb
Display time consumption per thread
!runaway
Search memory for pattern
s -[Flags][b|w|d|q|a|u] Range Pattern](https://image.slidesharecdn.com/windowsdebugging-151214173937/85/Windows-Debugging-with-WinDbg-25-320.jpg)
![Selected SOS commands
Display managed callstack
!CLRStack [-a] [-l] [-p] [-n]
Display managed / unmanaged callstack for all threads (see: !DumpStack)
!EEStack [-short] [-EE]
Display IL associated with managed method
!DumpIL <Managed DynamicMethod object> | <MethodDesc pointer>
Heap object statistics
!DumpHeap –stat
Display object at specified address
!DumpObj [-nofields] <object address>](https://image.slidesharecdn.com/windowsdebugging-151214173937/85/Windows-Debugging-with-WinDbg-26-320.jpg)
![Selected SOSEX commands
Display deadlocks between SyncBlocks and/or ReaderWriterLocks
!dlk [-d]
Display GC roots for the specified object
!mroot <ObjectAddr> [-all]
Print a stack trace of managed and unmanaged frames
!mk
Search the managed heap for strings
strings [ModuleAddress] [Options]](https://image.slidesharecdn.com/windowsdebugging-151214173937/85/Windows-Debugging-with-WinDbg-27-320.jpg)


