Cassandra Tools and Distributed Administration (Jeffrey Berger, Knewton) | C* Summit 2016
Download as PPTX, PDF1 like971 views

The document discusses tools and methodologies for managing Cassandra databases at Knewton, highlighting the importance of command-line tools and monitoring solutions such as 'cassandra-stat' and 'cassandra-tracing.' It emphasizes the benefits of using tools like Jolokia for metrics access and Ansible for distributed command execution, revealing the challenges of monitoring, scaling, and maintaining consistent configurations in a distributed environment. The presentation concludes by encouraging the exploration of Cassandra's extensive metrics and the utilization of automated processes to enhance efficiency.


![cassandra-tracing
© DataStax, All Rights Reserved. 27
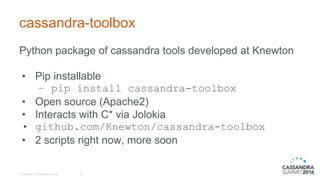
cqlsh:system_traces> select activity,source_elapsed from events WHERE session_id=UUID;
activity | source_elapsed
---------------------------------------------------------------+---------------
Parsing SELECT * FROM system.schema_columnfamilies | 21
Preparing statement | 31
Computing ranges to query | 73
Submitting range requests on 1 ranges with a concurrency of 1 | 88
Submitted 1 concurrent range requests covering 1 ranges | 96
Executing seq scan across 3 sstables for [min(-1), min(-1)] | 382
Read 7 live and 0 tombstone cells | 2057
Read 2 live and 0 tombstone cells | 2495
Read 1 live and 0 tombstone cells | 3066
Read 17 live and 32 tombstone cells | 16892
Read 7 live and 0 tombstone cells | 18757
Scanned 5 rows and matched 5 | 19172](https://image.slidesharecdn.com/jeffreyberger-cassandrasummit-160921232928/85/Cassandra-Tools-and-Distributed-Administration-Jeffrey-Berger-Knewton-C-Summit-2016-27-320.jpg)


![Distributed Arbitrary Commands
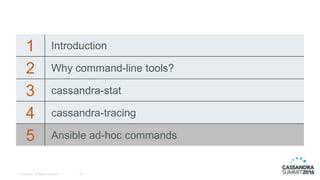
function dcmd(){
if [[ $# < 2 ]]; then
echo "USAGE dcmd <GROUP> <SHELL COMMAND>
Ex: dcmd qa-cass 'tail /var/log/cassandra/system.log'";
else
ansible "${1}" -i ips.txt -m shell -a "${2}" --sudo;
fi
}
© DataStax, All Rights Reserved. 33
Make a wrapper function - make it easy on your team!
dcmd = distributed command](https://image.slidesharecdn.com/jeffreyberger-cassandrasummit-160921232928/85/Cassandra-Tools-and-Distributed-Administration-Jeffrey-Berger-Knewton-C-Summit-2016-33-320.jpg)


Cassandra Tools and Distributed Administration (Jeffrey Berger, Knewton) | C* Summit 2016
- 1. Cassandra Tools and Distributed Administration Dr. Jeffrey Berger Lead Database Engineer Knewton
- 2. 1 Introduction 2 Why command-line tools? 3 cassandra-stat 4 cassandra-tracing 5 Ansible ad-hoc commands 2© DataStax, All Rights Reserved.
- 3. Knewton © DataStax, All Rights Reserved. 3 Leader in adaptive learning ● Partners with publishers and institutions in Europe, US, and Asia ● Provides unique recommendations to students based on previous behavior ● Advanced content ingestion, curation, and calibration ● Runs in AWS with many different storage backends ● Check us out: www.knewton.com/about/careers/
- 4. Cassandra at Knewton © DataStax, All Rights Reserved. 4 Cassandra is the main datastore at Knewton EU ProductionDevelopment US ProductionUser AcceptanceQA Clusters: 5 Nodes: 15 Clusters: 6 Nodes: 69 Clusters: 6 Nodes: 18 Clusters: 6 Nodes: 24 Clusters: 2 Nodes: 6 Clusters: 25 Nodes: 132
- 5. Cassandra Challenges © DataStax, All Rights Reserved. 5 • Monitoring – Historical measures are important • Triage – Immediate answers in a distributed system • Provisioning – Keep configurations consistent • Scaling – Elastically scale Cassandra 'out' or 'in'
- 6. Cassandra Challenges © DataStax, All Rights Reserved. 6 • Monitoring – Historical measures are important • Triage – Immediate answers in a distributed system • Provisioning – Keep configurations consistent • Scaling – Elastically scale Cassandra 'out' or 'in'
- 7. Solutions as Software © DataStax, All Rights Reserved. 7 If you magnify your surface area, magnify your tools ● Easy to use ● Fast and responsive ● Distributed
- 8. 1 Introduction 2 Why command-line tools? 3 cassandra-stat 4 cassandra-tracing 5 Ansible ad-hoc commands 8© DataStax, All Rights Reserved.
- 9. Why command line tools? © DataStax, All Rights Reserved. 9 Always consider the operator! Systems people like the command line! ● Few moving parts ● Local ● Immediate
- 10. Why not graphs? © DataStax, All Rights Reserved. 10 Graphs are great, I love graphs ● Not immediate ● Can be overloaded ● Remote ● Fixed metrics ● Averages rather than values
- 11. Why not nodetool? © DataStax, All Rights Reserved. 11 Nodetool is great..
- 12. Why not nodetool? © DataStax, All Rights Reserved. 12 Until it is time to cook dinner...
- 13. Jolokia ( jolokia.org ) © DataStax, All Rights Reserved. 13 Exposes JMX endpoints by HTTP • Open source (Apache2) • Lets you script with full access to JMX endpoints • Agent runs with cassandra • Lightweight, fast, easy to install
- 14. Installing Jolokia is painless © DataStax, All Rights Reserved. 14 2) Add this line to cassandra-env.sh # added to activate the jolokia agent JVM_OPTS="$JVM_OPTS -javaagent:/opt/cassandra/jolokia-jvm-agent.jar" (Or whatever the path is to your Jolokia JVM jar!) 1) Download the Jolokia JVM agent from their site / maven
- 15. What to do with Jolokia? © DataStax, All Rights Reserved. 15 Build some monitoring tools! • Use jconsole to find metrics you are interested in • Make some programs with your favorite language • Get the metrics from Jolokia to feed it Check out the tools we have already made!
- 16. cassandra-toolbox © DataStax, All Rights Reserved. 16 Python package of cassandra tools developed at Knewton • Pip installable – pip install cassandra-toolbox • Open source (Apache2) • Interacts with C* via Jolokia • github.com/Knewton/cassandra-toolbox • 2 scripts right now, more soon
- 17. 1 Introduction 2 Why command-line tools? 3 cassandra-stat 4 cassandra-tracing 5 Ansible ad-hoc commands 17© DataStax, All Rights Reserved.
- 18. cassandra-stat © DataStax, All Rights Reserved. 18 A real-time feed of Cassandra operations Like iostat for Cassandra • Interacts with Jolokia agent • Diffs metrics on a configurable time scale • Overall / Keyspace / CF granularity • Easy to use, easy to read
- 19. cassandra-stat © DataStax, All Rights Reserved. 19 $cassandra-stat Reads Writes Reads (99%) ms Writes (99%) ms Compactions Time ns 1 111 91.462 17.4 0 20:15:36 total 2 113 91.4 17.98 0 20:15:37 total 0 117 91.4 17.17 0 20:15:38 total 0 72 91.4 17.34 0 20:15:39 total 0 69 91.4 17.3 0 20:15:40 total *Not all fields shown Some metrics are summed across CFs and the difference from the last iteration reported Some report the maximum value from all CFs Some metrics are summed across CFs
- 20. cassandra-stat 20 metrics = [ { "metric_name": "ReadLatency", "metric_key": "Count", "display_name": "Reads", "sum": True, "diff": True, "nonzero": True }, ... ● Metrics are not hardcoded ● Easy to add/remove ● Flexible ○ sum ○ diff ○ nonzero ● Configuration is moving to a YAML file
- 21. cassandra-stat © DataStax, All Rights Reserved. 21 Benefits: • Traffic monitoring – Real time load can be read off easily • Performance debugging – All vital metrics are on a single line at each time • High granularity – Metrics every second • Diverse metrics – Metrics can be configured and read out immediately
- 22. 1 Introduction 2 Why command-line tools? 3 cassandra-stat 4 cassandra-tracing 5 Ansible ad-hoc commands 22© DataStax, All Rights Reserved.
- 23. cassandra-tracing © DataStax, All Rights Reserved. 23 Sampling a percent of all queries is a great tool* $nodetool settraceprobability 0.001 But if you ever queried the CFs in system_traces you might be bewildered.. * Don't set this percent too high!
- 24. cassandra-tracing © DataStax, All Rights Reserved. 24 cqlsh:system_traces> SELECT request,parameters FROM sessions LIMIT 4; request | parameters --------------------+--------------------------------------- Execute CQL3 query | {'consistency_level': 'LOCAL_ONE', 'page_size': '5000', 'query': 'SELECT * FROM test2 WHERE key=''XXXXXXXXXXXXXXXXX''', 'serial_consistency_level': 'SERIAL'} Execute CQL3 query | {'consistency_level': 'ONE', 'query': 'select cluster_name from system.local', 'serial_consistency_level': 'SERIAL'} Execute CQL3 query | {'consistency_level': 'ONE', 'query': 'select cluster_name from system.local', 'serial_consistency_level': 'SERIAL'} Execute CQL3 query | {'consistency_level': 'ONE', 'query': 'SELECT * FROM system.schema_columnfamilies', 'serial_consistency_level': 'SERIAL'}
- 25. cassandra-tracing © DataStax, All Rights Reserved. 25 cqlsh:system_traces> SELECT request,parameters FROM sessions LIMIT 4; request | parameters --------------------+--------------------------------------- Execute CQL3 query | {'consistency_level': 'LOCAL_ONE', 'page_size': '5000', 'query': 'SELECT * FROM test2 WHERE key=''XXXXXXXXXXXXXXXXX''', 'serial_consistency_level': 'SERIAL'} Execute CQL3 query | {'consistency_level': 'ONE', 'query': 'select cluster_name from system.local', 'serial_consistency_level': 'SERIAL'} Execute CQL3 query | {'consistency_level': 'ONE', 'query': 'select cluster_name from system.local', 'serial_consistency_level': 'SERIAL'} Execute CQL3 query | {'consistency_level': 'ONE', 'query': 'SELECT * FROM system.schema_columnfamilies', 'serial_consistency_level': 'SERIAL'}
- 26. cassandra-tracing © DataStax, All Rights Reserved. 26 $ cassandra-tracing `hostname -I ` 100% Complete: XXXXXXXXXXXXXXXXXXXXXXXXXXXXXXXXXXXXXXXXXXXXXXXX|100 Total skipped due to null duration: 0 Total skipped due to error: 0 175 sessions satisfying criteria. Showing 100 longest running results. Session Id Duration(us) Query UUID 19696 SELECT * FROM system.schema_columnfamilies UUID 20569 Executing single-partition query on ColumnFamilyA UUID 20905 SELECT * FROM system.schema_columnfamilies UUID 21056 Executing single-partition query on ColumnFamilyB UUID 21397 Executing single-partition query on ColumnFamilyB UUID 21992 Executing single-partition query on ColumnFamilyC ... Longest duration queries shown lastSession id allows introspection into individual operations in system_traces *Not all fields shown
- 27. cassandra-tracing © DataStax, All Rights Reserved. 27 cqlsh:system_traces> select activity,source_elapsed from events WHERE session_id=UUID; activity | source_elapsed ---------------------------------------------------------------+--------------- Parsing SELECT * FROM system.schema_columnfamilies | 21 Preparing statement | 31 Computing ranges to query | 73 Submitting range requests on 1 ranges with a concurrency of 1 | 88 Submitted 1 concurrent range requests covering 1 ranges | 96 Executing seq scan across 3 sstables for [min(-1), min(-1)] | 382 Read 7 live and 0 tombstone cells | 2057 Read 2 live and 0 tombstone cells | 2495 Read 1 live and 0 tombstone cells | 3066 Read 17 live and 32 tombstone cells | 16892 Read 7 live and 0 tombstone cells | 18757 Scanned 5 rows and matched 5 | 19172
- 28. cassandra-tracing © DataStax, All Rights Reserved. 28 Benefits: • High level view of traffic passing through the node – Does a single query type take a long time? – Are you hitting a lot of tombstones with a query type? – Index usage? Timeouts? • Meaningful introspection – Isolate the sessions that are interesting cases and spend your time on the queries driving up your %99.9.
- 29. 1 Introduction 2 Why command-line tools? 3 cassandra-stat 4 cassandra-tracing 5 Ansible ad-hoc commands 29© DataStax, All Rights Reserved.
- 30. Ansible (www.ansible.com) An agentless, open source, ssh-based, configuration management tool. We use it for backups / provisioning / distributed commands. Go check out: Cassandra backups and restorations using Ansible Joshua Wickman 4:10 PM – 4:45 PM Room 210B © DataStax, All Rights Reserved. 30
- 31. Ad Hoc commands Ad hoc commands are one-off command line processes ansible cassandra -i ips.txt -m shell -a "hostname" © DataStax, All Rights Reserved. 31 Yaml file of groups of ips Using the shell module Command to execute on the remote hostName of ip group to execute on IP List can be a script that returns the IPs, so it can tie into any inventory management
- 32. Ad Hoc commands Output looks like: 172.ip.ip.ip| success | rc=0 >> cassandra-i-962LMNOP 172.ip.ip.ip | success | rc=0 >> cassandra-i-dbfLMNOP 172.ip.ip.ip | success | rc=0 >> cassandra-i-450LMNOP © DataStax, All Rights Reserved. 32 Success or failure of command Return code of command Able to be piped through grep or other processes on your local machine
- 33. Distributed Arbitrary Commands function dcmd(){ if [[ $# < 2 ]]; then echo "USAGE dcmd <GROUP> <SHELL COMMAND> Ex: dcmd qa-cass 'tail /var/log/cassandra/system.log'"; else ansible "${1}" -i ips.txt -m shell -a "${2}" --sudo; fi } © DataStax, All Rights Reserved. 33 Make a wrapper function - make it easy on your team! dcmd = distributed command
- 34. Distributed Commands © DataStax, All Rights Reserved. 34 Benefits: • Get immediate status on distributed systems – Output reflects the current state • Execute operations on all nodes – If you need to bounce a whole cluster, this is great • Easy to see differences between node output – Cassandra is distributed so all nodes might not agree on the state of the cluster. It can be hard to find the dissenting node(s).
- 35. Distributed Nodetool Commands $dcmd qa-cass 'nodetool tpstats | egrep "AntiEntropy|Name"' 172.ip.ip.ip | success | rc=0 >> Pool Name Active Pending Completed Blocked All time blocked AntiEntropyStage 0 0 0 0 0 172.ip.ip.ip | success | rc=0 >> Pool Name Active Pending Completed Blocked All time blocked AntiEntropyStage 0 0 0 0 0 172.ip.ip.ip | success | rc=0 >> Pool Name Active Pending Completed Blocked All time blocked AntiEntropySessions 0 0 1536 0 0 AntiEntropyStage 0 0 126720 0 0 © DataStax, All Rights Reserved. 35
- 36. Conclusions ● Cassandra exposes a lot of metrics if you know where to find them - don't be afraid to dig them out! ● Programs can analyze bulk output a lot faster and better than people - save your time for the things programs aren't good at. ● Have distributed commands in your arsenal and don't be afraid to use them. © DataStax, All Rights Reserved. 36
- 37. Thank You