SlideShare a Scribd company logo
Gnocchi Numbers
(more) Benchmarking 2.1.x
Test Configuration
- 4 physical hosts
- CentOS 7.2.1511
- 24 physical cores (hyperthreaded), 256 GB memory
- 25 - 1TB disks, 10K RPM
- 1Gb network
- PostgreSQL 9.2.15 (single node)
- Shared with ceph and compute service
Default everything, except 300 connections vs 100(default)
- Ceph 10.2.2 (4 nodes, 1 monitoring, 3 OSD)
- 30 OSDs (1 TB disk), Journals share SSD, 2 replica, 2048 placement groups
- OSD nodes shared with (idle) compute service
- Gnocchi Master (~ June 3rd, 2016)
Host Configuration
- Host1
- OpenStack Controller Node (Ceilometer, Heat, Nova-stuff, Neutron, Cinder, Glance, Horizon)
- Ceph Monitoring service
- Gnocchi API
- Host2
- OpenStack Compute Node
- Ceph OSD node (10 OSDs)
- Host3
- Ceph OSD node (10 OSDs)
- Host4
- OpenStack Compute Node
- Ceph OSD node (10 OSDs)
- PostgreSQL
Testing Methodology
- Start 3 metricd services - 24 workers each
- POST 1000 generic resources spread across 20 workers, 20 metrics each.
- POST Every 10 minutes
- 1 minute granularity, 10 points/metric/request
- 20 000 metrics, medium archive policy
- 1 min for a day, 1 hr for a week, 1 day for a year, 8 aggregates each
Batch1 metricd details
- POST time (50 posts) - avg=10.8s (-65.5%), stdev=0.79
- Injection time - ~ 144 seconds
- Stats
- Per metric injection - avg=0.462s, min=0.235s, max=1.693s, stdev=0.174
- Average IO time - ~66% of _add_measures()
- Overhead - ~10.8% (~9.89% minus all IO once metric locked)
- Comparison to 20OSD w/ shared journal
- POST - 65.5% quicker
- Injection time - 27% quicker
Batch2 metricd details
- POST time (50 posts) - avg=30.6s, stdev=2.72
- Injection time - ~ 400 seconds
- Stats
- Per metric injection - avg=1.316s, min=0.286s, max=5.758s, stdev=0.844
- Average IO time - ~76.0% of _add_measures()
- Overhead - ~9.23% (~6.78% minus all IO once metric locked)
- Comparison to 20OSD w/ shared journal
- POST - 70% quicker
- Injection time - 28.4% quicker
Batch3 metricd details
- POST time (50 posts) - avg=30.2s, stdev=2.87
- Injection time - ~ 408 seconds
- Stats
- Per metric injection - avg=1.33s, min=0.285s, max=5.647s, stdev=0.824
- Average IO time - ~74.9% of _add_measures()
- Overhead - ~9.58% (~6.95% minus all IO once metric locked)
- Comparison to 20OSD w/ shared journal
- POST - 65.4% quicker
- Injection time - 26% quicker
Metric Processing Rate
Job Distribution
Gnocchi Contention
Estimated 37%
wasted on no op*
Estimated 13%
wasted on no op*
* based on assumption
each contention
wastes 1.6ms
Ceph Profile
Ceph Profile
- Read speed
- avg = 6727 kB/s (+32%)
- max = 28293 kB/s (+47%)
- stdev = 4185 (+69%)
- Write speed
- avg = 1565 kB/s (+36%)
- max = 8655 kB/s (+94%)
- stdev = 1262 (+65%)
- Operations
- avg = 8349 op/s (+36%)
- max = 31791 op/s (+62%)
- stdev = 5289 (+77%)
Difference compared to 20OSD, non-SSD deployment
Tuning Ceph
Hardware Configurations
- Ceph 10.2.2
- 30 OSDs (1 TB disk), Journals share SSD, 2 replica, 2048 placement groups
- OSD nodes shared with (idle) compute service
- Network File System
- 8 - 1TB 10K HDD, RAID0
- Separate host from metricd services
Ceph Hardware - Processing Rate
Ceph Test Configurations
‘Default’ (30OSD+JOURNAL SSD)
[osd]
osd journal size = 10000
osd pool default size = 3
osd pool default min size = 2
osd crush chooseleaf type = 1
8 Threads
[osd]
osd journal size = 10000
osd pool default size = 3
osd pool default min size = 2
osd crush chooseleaf type = 1
osd op threads = 8
filestore op threads = 8
journal max write entries = 50000
journal queue max ops = 50000
24 Threads
[osd]
osd journal size = 10000
osd pool default size = 3
osd pool default min size = 2
osd crush chooseleaf type = 1
osd op threads = 24
filestore op threads = 24
journal max write entries = 50000
journal queue max ops = 50000
36 Threads
[osd]
osd journal size = 10000
osd pool default size = 3
osd pool default min size = 2
osd crush chooseleaf type = 1
osd op threads = 36
filestore op threads = 36
journal max write entries = 50000
journal queue max ops = 50000
36 + fs queue
[osd]
osd journal size = 10000
osd pool default size = 3
osd pool default min size = 2
osd crush chooseleaf type = 1
osd op threads = 36
filestore op threads = 36
filestore queue max ops = 50000
filestore queue committing max ops = 50000
journal max write entries = 50000
journal queue max ops = 50000
Ceph Configurations - Metrics processed per 5s
Ceph Configurations - Processing Rate
Tuned vs Untuned
- Comparing Batch3 (36 + fs queue) vs Batch3 (default)
- POST time (50 posts) - avg=21.1s (-30.1%), stdev=0.904 (-68.5%)
- Injection time - ~ 199 seconds (-51.2%)
- Stats
- Per metric injection
- avg=0.596s(-55.2%)
- stdev=0.477(-42.1%)
- min=0.286s(+0%)
- max=9.12s (+38%)
- Overhead - ~15.2% (~14.1% minus all IO once metric locked)
- Consistent write performance between batches!
Ceph Profile
- Read speed
- avg = 10978 kB/s (+63%)
- max = 27104 kB/s (-4%)
- stdev = 5230 (+25%)
- Write speed
- avg = 2521 kB/s (+61%)
- max = 5304 kB/s (-39%)
- stdev = 994(-21%)
- Operations
- avg = 13534 op/s (+62%)
- max = 30398 op/s (-4%)
- stdev = 5739(+9%)
Difference compared to default 30OSD+SSD journal configuration using standard Ceph configurations
Gnocchi Design Tuning
Optimisation Opportunities
- Gnocchi has a lot of IO
- By default, over 25 reads and 25 writes for every single metric
- Serialising and deserialising each time
- Degradation as number of points grows (up to object split size)
- Needs to read in full object with related points, update, and write full object for each aggregate
even if updating one point out of thousands.
Current Serialisation
Simpler serialisation merged into master and
backported to 2.1
Effects of IO
Serialisation Format
Existing
{‘values’:{<timestamp>: float,
<timestamp>: float,
...
<timestamp>: float}}
- ~18B/point or ~10B/point (compressed)
- Not appendable
- Msgpack serialisation, super fast
Proposed
delimiter+float+delimiter+float+.
..+delimiter+float
- 9B/point (or much if compressed)
- Appendable
- Delimiter can be used to describe subsequent
bytes
- Timestamp computed by offset
- eg. Position 9 to 17 is data x seconds from
start
- Zero padding required if first point not start of split
- Handles compression much better
Comparing Serialisation Formats
Existing deserialisation needs to be sorted. It
is more comparable if factored in.
Looking to 3.x
- Testing larger datasets (a few thousand points/metric)
- Benchmarking new proposed format
- Study effects of alternative storage solutions
- Try to add in support for intermediary storage in memory

More Related Content

What's hot (20)

PDF
OpenTSDB for monitoring @ Criteo
Nathaniel Braun
 
PDF
Building a Fast, Resilient Time Series Store with Cassandra (Alex Petrov, Dat...
DataStax
 
PPTX
Cassandra Backups and Restorations Using Ansible (Joshua Wickman, Knewton) | ...
DataStax
 
PPTX
Update on OpenTSDB and AsyncHBase
HBaseCon
 
PDF
"Metrics: Where and How", Vsevolod Polyakov
Yulia Shcherbachova
 
PDF
Thanos - Prometheus on Scale
Bartłomiej Płotka
 
PDF
Мониторинг. Опять, rootconf 2016
Vsevolod Polyakov
 
PPTX
Metrics: where and how
Vsevolod Polyakov
 
PDF
Neo4j after 1 year in production
Andrew Nikishaev
 
PPTX
1404 app dev series - session 8 - monitoring & performance tuning
MongoDB
 
PPTX
CloudClustering: Toward a scalable machine learning toolkit for Windows Azure
Ankur Dave
 
PDF
InfluxDB IOx Tech Talks: The Impossible Dream: Easy-to-Use, Super Fast Softw...
InfluxData
 
PDF
MesosCon 2018
Pablo Delgado
 
PDF
Путь мониторинга 2.0 всё стало другим / Всеволод Поляков (Grammarly)
Ontico
 
PDF
Advanced Apache Cassandra Operations with JMX
zznate
 
PDF
Technology Updates of PG-Strom at Aug-2014 (PGUnconf@Tokyo)
Kohei KaiGai
 
PDF
Linux Cluster and Distributed Resource Manager
Hong ChangBum
 
PPTX
Всеволод Поляков (DevOps Team Lead в Grammarly)
Provectus
 
PPTX
Partner Webinar: MongoDB and Softlayer on Bare Metal: Stability, Performance,...
MongoDB
 
PPTX
Weather of the Century: Design and Performance
MongoDB
 
OpenTSDB for monitoring @ Criteo
Nathaniel Braun
 
Building a Fast, Resilient Time Series Store with Cassandra (Alex Petrov, Dat...
DataStax
 
Cassandra Backups and Restorations Using Ansible (Joshua Wickman, Knewton) | ...
DataStax
 
Update on OpenTSDB and AsyncHBase
HBaseCon
 
"Metrics: Where and How", Vsevolod Polyakov
Yulia Shcherbachova
 
Thanos - Prometheus on Scale
Bartłomiej Płotka
 
Мониторинг. Опять, rootconf 2016
Vsevolod Polyakov
 
Metrics: where and how
Vsevolod Polyakov
 
Neo4j after 1 year in production
Andrew Nikishaev
 
1404 app dev series - session 8 - monitoring & performance tuning
MongoDB
 
CloudClustering: Toward a scalable machine learning toolkit for Windows Azure
Ankur Dave
 
InfluxDB IOx Tech Talks: The Impossible Dream: Easy-to-Use, Super Fast Softw...
InfluxData
 
MesosCon 2018
Pablo Delgado
 
Путь мониторинга 2.0 всё стало другим / Всеволод Поляков (Grammarly)
Ontico
 
Advanced Apache Cassandra Operations with JMX
zznate
 
Technology Updates of PG-Strom at Aug-2014 (PGUnconf@Tokyo)
Kohei KaiGai
 
Linux Cluster and Distributed Resource Manager
Hong ChangBum
 
Всеволод Поляков (DevOps Team Lead в Grammarly)
Provectus
 
Partner Webinar: MongoDB and Softlayer on Bare Metal: Stability, Performance,...
MongoDB
 
Weather of the Century: Design and Performance
MongoDB
 

Similar to Gnocchi Profiling v2 (20)

PPTX
Ceph barcelona-v-1.2
Ranga Swami Reddy Muthumula
 
PPTX
ceph-barcelona-v-1.2
Ranga Swami Reddy Muthumula
 
PDF
Ceph Object Storage Performance Secrets and Ceph Data Lake Solution
Karan Singh
 
PPTX
Ceph Performance and Sizing Guide
Jose De La Rosa
 
PDF
Build an High-Performance and High-Durable Block Storage Service Based on Ceph
Rongze Zhu
 
PPTX
Ceph Day Chicago - Supermicro Ceph - Open SolutionsDefined by Workload
Ceph Community
 
PDF
Modeling, estimating, and predicting Ceph (Linux Foundation - Vault 2015)
Lars Marowsky-Brée
 
PDF
Ceph Performance on OpenStack - Barcelona Summit
Takehiro Kudou
 
PPTX
Your 1st Ceph cluster
Mirantis
 
PDF
AF Ceph: Ceph Performance Analysis and Improvement on Flash
Ceph Community
 
PPTX
Ceph Performance Profiling and Reporting
Ceph Community
 
PDF
Nick Fisk - low latency Ceph
ShapeBlue
 
PDF
Ceph: Open Source Storage Software Optimizations on Intel® Architecture for C...
Odinot Stanislas
 
PDF
Ambedded - how to build a true no single point of failure ceph cluster
inwin stack
 
PPTX
Ceph Day Chicago - Ceph Deployment at Target: Best Practices and Lessons Learned
Ceph Community
 
PDF
Ceph
Shravya Reddy
 
PDF
Ceph Day Amsterdam 2015: Measuring and predicting performance of Ceph clusters
Ceph Community
 
PDF
SUSE Storage: Sizing and Performance (Ceph)
Lars Marowsky-Brée
 
PPTX
Journey to Stability: Petabyte Ceph Cluster in OpenStack Cloud
Patrick McGarry
 
Ceph barcelona-v-1.2
Ranga Swami Reddy Muthumula
 
ceph-barcelona-v-1.2
Ranga Swami Reddy Muthumula
 
Ceph Object Storage Performance Secrets and Ceph Data Lake Solution
Karan Singh
 
Ceph Performance and Sizing Guide
Jose De La Rosa
 
Build an High-Performance and High-Durable Block Storage Service Based on Ceph
Rongze Zhu
 
Ceph Day Chicago - Supermicro Ceph - Open SolutionsDefined by Workload
Ceph Community
 
Modeling, estimating, and predicting Ceph (Linux Foundation - Vault 2015)
Lars Marowsky-Brée
 
Ceph Performance on OpenStack - Barcelona Summit
Takehiro Kudou
 
Your 1st Ceph cluster
Mirantis
 
AF Ceph: Ceph Performance Analysis and Improvement on Flash
Ceph Community
 
Ceph Performance Profiling and Reporting
Ceph Community
 
Nick Fisk - low latency Ceph
ShapeBlue
 
Ceph: Open Source Storage Software Optimizations on Intel® Architecture for C...
Odinot Stanislas
 
Ambedded - how to build a true no single point of failure ceph cluster
inwin stack
 
Ceph Day Chicago - Ceph Deployment at Target: Best Practices and Lessons Learned
Ceph Community
 
Ceph Day Amsterdam 2015: Measuring and predicting performance of Ceph clusters
Ceph Community
 
SUSE Storage: Sizing and Performance (Ceph)
Lars Marowsky-Brée
 
Journey to Stability: Petabyte Ceph Cluster in OpenStack Cloud
Patrick McGarry
 
Ad

Recently uploaded (20)

PDF
Peak of Data & AI Encore - Real-Time Insights & Scalable Editing with ArcGIS
Safe Software
 
PPTX
AVL ( audio, visuals or led ), technology.
Rajeshwri Panchal
 
PPTX
cloud computing vai.pptx for the project
vaibhavdobariyal79
 
PDF
GDG Cloud Munich - Intro - Luiz Carneiro - #BuildWithAI - July - Abdel.pdf
Luiz Carneiro
 
PPTX
Dev Dives: Automate, test, and deploy in one place—with Unified Developer Exp...
AndreeaTom
 
PDF
NewMind AI Weekly Chronicles – July’25, Week III
NewMind AI
 
PDF
The Future of Mobile Is Context-Aware—Are You Ready?
iProgrammer Solutions Private Limited
 
PDF
TrustArc Webinar - Navigating Data Privacy in LATAM: Laws, Trends, and Compli...
TrustArc
 
PDF
Per Axbom: The spectacular lies of maps
Nexer Digital
 
PPTX
Agentic AI in Healthcare Driving the Next Wave of Digital Transformation
danielle hunter
 
PPTX
Agile Chennai 18-19 July 2025 | Workshop - Enhancing Agile Collaboration with...
AgileNetwork
 
PDF
Presentation about Hardware and Software in Computer
snehamodhawadiya
 
PPTX
IT Runs Better with ThousandEyes AI-driven Assurance
ThousandEyes
 
PPTX
AI in Daily Life: How Artificial Intelligence Helps Us Every Day
vanshrpatil7
 
PDF
How Open Source Changed My Career by abdelrahman ismail
a0m0rajab1
 
PPTX
Applied-Statistics-Mastering-Data-Driven-Decisions.pptx
parmaryashparmaryash
 
PDF
State-Dependent Conformal Perception Bounds for Neuro-Symbolic Verification
Ivan Ruchkin
 
PDF
Researching The Best Chat SDK Providers in 2025
Ray Fields
 
PDF
Make GenAI investments go further with the Dell AI Factory
Principled Technologies
 
PDF
OFFOFFBOX™ – A New Era for African Film | Startup Presentation
ambaicciwalkerbrian
 
Peak of Data & AI Encore - Real-Time Insights & Scalable Editing with ArcGIS
Safe Software
 
AVL ( audio, visuals or led ), technology.
Rajeshwri Panchal
 
cloud computing vai.pptx for the project
vaibhavdobariyal79
 
GDG Cloud Munich - Intro - Luiz Carneiro - #BuildWithAI - July - Abdel.pdf
Luiz Carneiro
 
Dev Dives: Automate, test, and deploy in one place—with Unified Developer Exp...
AndreeaTom
 
NewMind AI Weekly Chronicles – July’25, Week III
NewMind AI
 
The Future of Mobile Is Context-Aware—Are You Ready?
iProgrammer Solutions Private Limited
 
TrustArc Webinar - Navigating Data Privacy in LATAM: Laws, Trends, and Compli...
TrustArc
 
Per Axbom: The spectacular lies of maps
Nexer Digital
 
Agentic AI in Healthcare Driving the Next Wave of Digital Transformation
danielle hunter
 
Agile Chennai 18-19 July 2025 | Workshop - Enhancing Agile Collaboration with...
AgileNetwork
 
Presentation about Hardware and Software in Computer
snehamodhawadiya
 
IT Runs Better with ThousandEyes AI-driven Assurance
ThousandEyes
 
AI in Daily Life: How Artificial Intelligence Helps Us Every Day
vanshrpatil7
 
How Open Source Changed My Career by abdelrahman ismail
a0m0rajab1
 
Applied-Statistics-Mastering-Data-Driven-Decisions.pptx
parmaryashparmaryash
 
State-Dependent Conformal Perception Bounds for Neuro-Symbolic Verification
Ivan Ruchkin
 
Researching The Best Chat SDK Providers in 2025
Ray Fields
 
Make GenAI investments go further with the Dell AI Factory
Principled Technologies
 
OFFOFFBOX™ – A New Era for African Film | Startup Presentation
ambaicciwalkerbrian
 
Ad

Gnocchi Profiling v2

  • 2. Test Configuration - 4 physical hosts - CentOS 7.2.1511 - 24 physical cores (hyperthreaded), 256 GB memory - 25 - 1TB disks, 10K RPM - 1Gb network - PostgreSQL 9.2.15 (single node) - Shared with ceph and compute service Default everything, except 300 connections vs 100(default) - Ceph 10.2.2 (4 nodes, 1 monitoring, 3 OSD) - 30 OSDs (1 TB disk), Journals share SSD, 2 replica, 2048 placement groups - OSD nodes shared with (idle) compute service - Gnocchi Master (~ June 3rd, 2016)
  • 3. Host Configuration - Host1 - OpenStack Controller Node (Ceilometer, Heat, Nova-stuff, Neutron, Cinder, Glance, Horizon) - Ceph Monitoring service - Gnocchi API - Host2 - OpenStack Compute Node - Ceph OSD node (10 OSDs) - Host3 - Ceph OSD node (10 OSDs) - Host4 - OpenStack Compute Node - Ceph OSD node (10 OSDs) - PostgreSQL
  • 4. Testing Methodology - Start 3 metricd services - 24 workers each - POST 1000 generic resources spread across 20 workers, 20 metrics each. - POST Every 10 minutes - 1 minute granularity, 10 points/metric/request - 20 000 metrics, medium archive policy - 1 min for a day, 1 hr for a week, 1 day for a year, 8 aggregates each
  • 5. Batch1 metricd details - POST time (50 posts) - avg=10.8s (-65.5%), stdev=0.79 - Injection time - ~ 144 seconds - Stats - Per metric injection - avg=0.462s, min=0.235s, max=1.693s, stdev=0.174 - Average IO time - ~66% of _add_measures() - Overhead - ~10.8% (~9.89% minus all IO once metric locked) - Comparison to 20OSD w/ shared journal - POST - 65.5% quicker - Injection time - 27% quicker
  • 6. Batch2 metricd details - POST time (50 posts) - avg=30.6s, stdev=2.72 - Injection time - ~ 400 seconds - Stats - Per metric injection - avg=1.316s, min=0.286s, max=5.758s, stdev=0.844 - Average IO time - ~76.0% of _add_measures() - Overhead - ~9.23% (~6.78% minus all IO once metric locked) - Comparison to 20OSD w/ shared journal - POST - 70% quicker - Injection time - 28.4% quicker
  • 7. Batch3 metricd details - POST time (50 posts) - avg=30.2s, stdev=2.87 - Injection time - ~ 408 seconds - Stats - Per metric injection - avg=1.33s, min=0.285s, max=5.647s, stdev=0.824 - Average IO time - ~74.9% of _add_measures() - Overhead - ~9.58% (~6.95% minus all IO once metric locked) - Comparison to 20OSD w/ shared journal - POST - 65.4% quicker - Injection time - 26% quicker
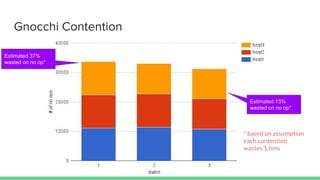
  • 10. Gnocchi Contention Estimated 37% wasted on no op* Estimated 13% wasted on no op* * based on assumption each contention wastes 1.6ms
  • 12. Ceph Profile - Read speed - avg = 6727 kB/s (+32%) - max = 28293 kB/s (+47%) - stdev = 4185 (+69%) - Write speed - avg = 1565 kB/s (+36%) - max = 8655 kB/s (+94%) - stdev = 1262 (+65%) - Operations - avg = 8349 op/s (+36%) - max = 31791 op/s (+62%) - stdev = 5289 (+77%) Difference compared to 20OSD, non-SSD deployment
  • 14. Hardware Configurations - Ceph 10.2.2 - 30 OSDs (1 TB disk), Journals share SSD, 2 replica, 2048 placement groups - OSD nodes shared with (idle) compute service - Network File System - 8 - 1TB 10K HDD, RAID0 - Separate host from metricd services
  • 15. Ceph Hardware - Processing Rate
  • 16. Ceph Hardware - Processing Rate
  • 17. Ceph Test Configurations ‘Default’ (30OSD+JOURNAL SSD) [osd] osd journal size = 10000 osd pool default size = 3 osd pool default min size = 2 osd crush chooseleaf type = 1 8 Threads [osd] osd journal size = 10000 osd pool default size = 3 osd pool default min size = 2 osd crush chooseleaf type = 1 osd op threads = 8 filestore op threads = 8 journal max write entries = 50000 journal queue max ops = 50000 24 Threads [osd] osd journal size = 10000 osd pool default size = 3 osd pool default min size = 2 osd crush chooseleaf type = 1 osd op threads = 24 filestore op threads = 24 journal max write entries = 50000 journal queue max ops = 50000 36 Threads [osd] osd journal size = 10000 osd pool default size = 3 osd pool default min size = 2 osd crush chooseleaf type = 1 osd op threads = 36 filestore op threads = 36 journal max write entries = 50000 journal queue max ops = 50000 36 + fs queue [osd] osd journal size = 10000 osd pool default size = 3 osd pool default min size = 2 osd crush chooseleaf type = 1 osd op threads = 36 filestore op threads = 36 filestore queue max ops = 50000 filestore queue committing max ops = 50000 journal max write entries = 50000 journal queue max ops = 50000
  • 18. Ceph Configurations - Metrics processed per 5s
  • 19. Ceph Configurations - Processing Rate
  • 20. Tuned vs Untuned - Comparing Batch3 (36 + fs queue) vs Batch3 (default) - POST time (50 posts) - avg=21.1s (-30.1%), stdev=0.904 (-68.5%) - Injection time - ~ 199 seconds (-51.2%) - Stats - Per metric injection - avg=0.596s(-55.2%) - stdev=0.477(-42.1%) - min=0.286s(+0%) - max=9.12s (+38%) - Overhead - ~15.2% (~14.1% minus all IO once metric locked) - Consistent write performance between batches!
  • 21. Ceph Profile - Read speed - avg = 10978 kB/s (+63%) - max = 27104 kB/s (-4%) - stdev = 5230 (+25%) - Write speed - avg = 2521 kB/s (+61%) - max = 5304 kB/s (-39%) - stdev = 994(-21%) - Operations - avg = 13534 op/s (+62%) - max = 30398 op/s (-4%) - stdev = 5739(+9%) Difference compared to default 30OSD+SSD journal configuration using standard Ceph configurations
  • 23. Optimisation Opportunities - Gnocchi has a lot of IO - By default, over 25 reads and 25 writes for every single metric - Serialising and deserialising each time - Degradation as number of points grows (up to object split size) - Needs to read in full object with related points, update, and write full object for each aggregate even if updating one point out of thousands.
  • 24. Current Serialisation Simpler serialisation merged into master and backported to 2.1
  • 26. Serialisation Format Existing {‘values’:{<timestamp>: float, <timestamp>: float, ... <timestamp>: float}} - ~18B/point or ~10B/point (compressed) - Not appendable - Msgpack serialisation, super fast Proposed delimiter+float+delimiter+float+. ..+delimiter+float - 9B/point (or much if compressed) - Appendable - Delimiter can be used to describe subsequent bytes - Timestamp computed by offset - eg. Position 9 to 17 is data x seconds from start - Zero padding required if first point not start of split - Handles compression much better
  • 27. Comparing Serialisation Formats Existing deserialisation needs to be sorted. It is more comparable if factored in.
  • 28. Looking to 3.x - Testing larger datasets (a few thousand points/metric) - Benchmarking new proposed format - Study effects of alternative storage solutions - Try to add in support for intermediary storage in memory