SlideShare a Scribd company logo
1 International Journal for Modern Trends in Science and Technology
Volume: 2 | Issue: 09 | September 2016 | ISSN: 2455-3778IJMTST
Optimal Placement and Sizing of Capacitor
and Distributed Generator in Radial
Distribution System
D. Ramakrishna1
| G. Vasu2
1, 2Department of Electrical and Electronics Engineering, Sanketika Vidya Parishad Engineering College,
Visakhapatnam.
Distribution Systems are growing large and being stretched too far, leading to higher system losses and
poor voltage regulation, the need for an efficient and effective distribution system has therefore become more
urgent and important. A distribution system connects consumers to the high-voltage transmission system.
Because of lower voltage, and hence higher current, the I2R loss in a distribution system is significantly high
compared to that in a high-voltage transmission system. The pressure of improving the overall efficiency of
power delivery has forced the power utilities to reduce the loss, especially at the distribution level. Loss
reduction initiatives in distribution systems have been activated due to the increasing cost of supplying
electricity, the shortage in fuel with ever-increasing cost to produce more power, and the global warming
concerns. The total system loss can be decreased by installing capacitor bank and distributed generation.
These two methods can also help maintaining the level of voltage and maintenance power factor. The direct
search algorithm is applied to minimize the loss in radial distribution systems.
KEYWORDS: Capacitor, Distributed Generator, Optimal Location, Radial Distribution
Copyright © 2016 International Journal for Modern Trends in Science and Technology
All rights reserved.
I. INTRODUCTION
Distribution system constitutes the link between
electricity utilities and consumers and their
revenue realization segment. For consumers, it
represents the face of the utility. The modern
distribution system begins as the primary circuit
leaves the sub-station and ends as the secondary
service enters the customer's meter socket by way
of service main. Distribution circuits serve many
types of customers. The voltage used is appropriate
for the shorter distance and varies from 230 to
about 33,000 volts depending on utility standard
practice, distance, and load to be served.
Distribution circuits are fed from a transformer
located in an electrical substation, where the
voltage is reduced from the high values used for
power transmission.
II. LOAD FLOW SOLUTION
Traditional transmission system load flow
methods Gauss-Siedel and Newton Raphson
techniques cannot be used for distribution systems
as R/X ratio is high. Network-Topology-Based
Three-Phase Load Flow for Distribution Systems is
used in this dissertation work.
The capacitor placement problem consists of
determining the optimal numbers, locations and
sizes of capacitor such that minimum yearly cost
due to power/energy losses and cost of capacitors
is achieved. In this dissertation work, optimal sizes
of the switched capacitors in terms of standard
sizes available in the market and their locations are
to be determined for maximum possible reduction
in the loss for radial distribution system. Standard
capacitor sizes available in the literature (in KVAR):
150, 300, 450, 600, 750, 900, 1050, 1200, 1350,
1500, 1650, 1800, 1950, 2100, 2250, 2400, 2550,
2700, 2850, 3000, 3150, 3300, 3450, 3600, 3750,
3900, 4050.
III. SOLUTION METHODOLOGY
In this dissertation work, Direct Search
Algorithm is used to determine the optimal sizes of
switched capacitors together with their optimal
locations in radial distribution systems so that
maximum possible reduction in losses is achieved.
The algorithm is used for radial distribution system
ABSTRACT
2 International Journal for Modern Trends in Science and Technology
Optimal Placement and Sizing of Capacitor and Distributed Generator in Radial Distribution System
with source bus as slack bus and all other load
buses as PQ buses. The algorithm is described in
following steps for deciding the optimal sizes of the
capacitors in terms of standard sizes available in
the market and their locations (only load buses).
1. Read the system data of the distribution
system. Run Base case load flow and determine
the total active power loss (Ploss) of the system.
2. Make Qload =0 by fully compensating all load
buses. Run the load flow. Determine Ploss. (This
is the minimum possible loss of the system to
be aimed at for determining optimal sizes and
locations of Capacitors.)
3. Make „n‟ number of capacitors of different sizes,
whose total is equal to or near Qtotal. Let m(k)
be the number of capacitor where k is ranging
from 1 to n.
4. Place first capacitor at each load bus in turn
and determine Ploss in each case. Identify the
location where system loss is minimum (Ploss(min)
) Repeat this procedure for other sizes of
capacitors. Now determine the minimum of
Ploss(min) and place the corresponding optimal
capacitor at the corresponding optimal
location.
5. Repeat Step-4 for optimal placement of
remaining capacitors till minimum possible
loss is achieved i.e. further placement of
capacitor will result in increase in the loss.
The sizing and sequencing of capacitors depend on
load pattern and can be adjudged by the expert
analyst.
IV. OPTIMAL DISTRIBUTED GENERATOR PLACEMENT
FOR LOSS REDUCTION
The share of distributed generators (DGs) in
power systems has been slowly increasing in the
last few years. DG placement can cause reduction
of power losses and improvement of voltage profile.
There are many reasons for using DG units such as
reduction of system harmonics, improvement of
power quality, improvement of reliability of
systems, improvement of voltage profile and
avoiding of investment in infrastructure of
distribution and transmission networks.
Distributed Generators can be divided into four
types, namely
a) Type-1 DG: It injects both real and reactive
power into the system. Power factor (PFDG)
of the DG is 0 < PFDG < 1. Synchronous
Generator is an example of Type-1 DG.
b) Type-2 DG: It is capable of injecting real
power but consumes reactive power from
the system. Power factor is given by 0 <
PFDG < 1. Induction Generator based in
Wind Turbine Generator System comes
under Type-2 DG.
c) Type-3 DG: This type of DG injects real
power only. Power factor for Type-3 DG is 1.
Solar PV System is an example of Type-3
DG.
d) Type-4 DG: It is capable of injecting reactive
power only. Power factor is 0 for this type of
DG. An example for Type-4 DG is
Synchronous Compensator.
V. PROBLEM FORMULATION
The optimum DG allocation can be treated as
optimum active power compensation, like
capacitor allocation for reactive power
compensation. DG allocation studies are relatively
new, unlike capacitor allocation. The objective
function here is to find the optimal sizes of the DGs
(type-2 & Type-3) in terms of standard sizes
available in the market and their locations so as to
minimize the system loss and improve voltage
profile.
A. Power Factor Selection for DG
Type- 2 DGs injects real power into the system
but consumes reactive power from the system. The
power factor of the Type- 2 DG is 0 < PFDG < 1. To
find the optimal power factor of DG for a given
radial distribution system, fast approach is
implemented. According to this approach the
power factor of combined total load of the system
(PFD) can be expressed by (1)
PFD =
PD
(PD
2
+ QD
2
)
Where, PD = PDi
N
i=1
QD = QDi
N
i=1
The “possible minimum” total loss can be
achieved if the power factor of DG (PFDG) is quickly
selected to be equal to that of the total load (PFD).
That can be expressed by (2)
PFDG = PFD
For Type-3 DG, power factor is always 1.
B. Solution Methodology
The same Direct Search Algorithm is used again to
determine the optimal sizes of DG (Type-2 and
3 International Journal for Modern Trends in Science and Technology
Volume: 2 | Issue: 09 | September 2016 | ISSN: 2455-3778IJMTST
Type-3) together with their optimal locations in
radial distribution systems so that maximum
possible reduction in losses is achieved. The
algorithm is used for radial distribution system
with source bus as slack bus and all other load
buses as PQ buses. In case of Type-2 DG reactive
power consumed from the system is also taken into
consideration.
C. Case Studies, Results and Analysis
The Direct Search Algorithm is used for
determining the optimal location together with the
sizes of Capacitor and DG for loss reduction in the
radial distribution system. The algorithm is
implemented on 15, 33 and 69 - Bus System. For
all the test systems, first individual capacitor and
DG (Type-2 and Type-3) placement is done. DG
placement along with capacitor is also presented
for all the three test systems.
D. Case Study 1: 15 Bus System
This case study is on 15-Bus Radial Distribution
System which consists of 15 buses and 14
branches. All the buses are load buses except one
slack bus. The total active and reactive power
demand of the system is 1266.4 kW and 1251.1
kVAr respectively. 61.80 kW is the base case active
power loss of the system.
Fig.1 Flowchart for DG Placement using Direct Search
Algorithm
Case Study 1 (A): Optimal Placement of
Capacitor:
Table 1: Results of Optimal Capacitor Placement in15-Bus
System
S.No.
Optimal
Capacitor
Size (KVAr)
Optimal
Location
(Bus No.)
Minimum Power Loss
after Optimal Capacitor
placement (kW)
1 300 4 48.19
2 300 11 39.12
3 300 6 32.48
4 150 15 30.98
5 150 9 30.30
Case Study 1 (B): Optimal Placement of Type-3
DG
Table 2: Results of Optimal Placement of Type-3 DG in 15-
Bus System
S.No.
Optimal DG
Size (kW)
Optimal
Location
(Bus No.)
Minimum Power
Loss after Optimal
Placement of
DG (kW)
1 500 4 42.86
2 500 6 34.56
3 100 12 32.80
4 100 11 32.13
Case Study 1 (C): Optimal Placement of
Capacitor A=and Type-3 DG
Table3: Results of Optimal Capacitor and Type-3 DG
Placement in 15- Bus System
S. No.
Optimal DG
Size
(kW)
Optimal
Location
(Bus No.)
Minimum Power Loss
after Optimal Placement
of DG (kW)
1 500 4 12.43
2 500 6 4.57
3 100 12 2.92
4 100 11 2.29
Case Study 1 (D): Optimal Placement of Type-2
DG
Table 4: Reactive Power Consumed by various sizes of DGs
at 0.7 p.f.
S.No.
Real Power
Injected by DG
(Type-2) (kW)
Reactive Power
Consumed by DG
(Type-2) (KVAr)
KVA Rating
of DG
(Type-2)
1 1000 1020.20 1428.57
2 500 510.048 714.24
3 300 306.024 428.54
4 200 204.02 285.69
5 100 102 142.85
Table 5: Optimal Placement of Type-2 DG on 15- Bus
System using Direct Search Algorithm
4 International Journal for Modern Trends in Science and Technology
Optimal Placement and Sizing of Capacitor and Distributed Generator in Radial Distribution System
S.No.
Optimal DG
Size (Type-2)
(kW)
Optimal
Location
(Bus No.)
Minimum Power Loss
after Optimal
Placement of DG (kW)
1 500 2 68.66
Case Study 1 (E): Optimal Placement of
Capacitor And Type-2 DG
Table 6: Results of Optimal Placement of Capacitor and
Type-2 DG in 15- Bus System
S.No.
Optimal
DG Size
(kW)
Optimal
Location
(Bus No.)
Minimum Power Loss
after optimal placement
of DG (kW)
1 500 3 19.70
2 100 6 18.73
Analysis of Results of Case Study On 15-Bus
System
Analysis of results of 15-Bus System for the
different cases is presented below.
(i) Optimal Placement of Capacitor: The
minimum active power loss obtained after
making reactive power load demand of the
system equal to zero (i.e., at all load buses,
Qload =0) is 29.38 kW. This is the minimum
possible loss that should be aimed at. Direct
Search Algorithm gave 30.30 kW as the
minimum loss after optimal placement of
capacitor. It can be observed that, the loss
obtained after optimal placement of capacitor
is very much nearer to the minimum possible
loss of the system. There is a reduction of
31.50 kW (50.97%) in the active power loss
when compared to the base case value. The
optimal sizes of capacitors obtained using the
algorithm is 300 and 150 kVAr. Bus number 4,
11, 6, 15 and 9 are the optimal locations for
capacitor placement.
(ii) Optimal Placement of Type-3 DG: Table 2
shows the optimum location, corresponding
optimum size and total power loss with the
corresponding size of the DG (Type-3). The
minimum loss obtained after DG placement is
32.13 kW i.e., a reduction of 48.01% in the
loss when compared to the base case loss of
the system. Any further placement of DG will
start to increase the losses and it is likely that
it may overshoot the losses of the base case.
Also notice that location of DG plays an
important role in minimizing the losses.
(iii) Optimal Placement of Capacitor and Type-3
DG: Above two cases presents the minimum
possible loss that can be obtained after
optimal placement of capacitor and DG
(Type-3), individually. In this case capacitors
and DGs are placed together to obtained
further reduction in the losses. First optimal
placement of the capacitors is done (as shown
in Table 1) and then DGs are placed optimally
to achieve further reduction in the loss (Table
3).2.29 kW is the minimum loss achieved after
optimal placement of C & DG (Type-3). The
active power loss is reduced by a staggering
figure of 96.29%. It can be noticed from Fig.
4.1 that the bus voltage profile has improved
significantly (above 0.99 p.u. at all the buses)
when compared to base case voltages.
(iv) Optimal Placement of Type-2 DG: The
optimal power factor of DG (Type-2) for 15-Bus
System is 0.7. From Table 5, it can be noticed
that there is no reduction in loss; instead the
loss has increased to 68.99 kW from its base
case value of 61.80 kW. This is true for any
size of DG. The reason is consumption of
reactive power by the DG from the system. At
0.7 power factor, DG is consuming more
reactive power from the system when
compared to the active power injected by the
DG. So it can be concluded that Type-2 DG is
not suitable for smaller distribution system
with lower power factor.
(v) Optimal Placement of Capacitor and Type-2
DG: Here also first capacitors are placed and
then optimal placement of DG is done. Table 6
shows the results of optimal placement of DG
after the optimal capacitor placement. 18.73
kW is the minimum loss achieved after the
optimal placement of C & DG (Type-2). There
is a reduction of 69.69% in the active power
loss. Better voltage profile is observed when
compared to the base case.
E. Case Study 2: 33-Bus System
It is a radial distribution system, with the total
load of 3715 kW and 2300 kVAr, having 33 buses
and 32 branches. All the buses are load buses
except first bus as slack bus. 210.75 kW is the
base case active power loss of the system.
Table 7: Reactive Power Consumed by various sizes of DGs
at 0.85 p.f.
5 International Journal for Modern Trends in Science and Technology
Volume: 2 | Issue: 09 | September 2016 | ISSN: 2455-3778IJMTST
S.No.
Real Power
Injected by
DG
(Type-2) (kW)
Reactive Power
Consumed by
DG
(Type-2) (KVAr)
KVA Rating
of DG
(Type-2)
1 1000 619.74 1176.47
2 500 309.87 588.235
3 300 185.92 352.94
4 200 123.95 235.29
5 100 61.97 117.647
Case Study 2 (A): Optimal Placement of
Capacitor
Table 8: Results of Optimal Capacitor Placement in 33-Bus
System
Case Study 2 (B): Optimal Placement of Type-3
DG
Table 9: Results of Optimal Type-3 DG Placement in
33-Bus System
S. No.
Optimal
DG
Size (kW)
Optimal
Location
(Bus No.)
Minimum Power
Loss after optimal
placement
of DG (kW)
1 1000 12 129.66
2 1000 30 88.57
3 500 25 77.95
4 300 24 75.28
5 200 21 74.26
6 200 4 73.57
7 100 23 73.36
8 100 7 73.24
9 100 22 73.15
10 100 2 73.13
Case Study 2 (C): Optimal Placement of
Capacitor and Type-3 DG
Table 10: Results of Optimal Placement of Capacitor and
Type-3 DG in 33-Bus System
S. No.
Optimal
DG
Size (kW)
Optimal
Location
(Bus No.)
Minimum Power Loss
after optimal placement
of DG (kW)
1 1000 12 62.46
2 1000 30 24.24
3 500 25 13.74
4 500 24 10.58
5 100 22 9.92
6 100 21 9.57
7 100 5 9.30
8 100 4 9.17
9 100 20
Case Study 2 (D): Optimal Placement of Type-2
DG
Table 11: Results of Optimal Placement of Type-2 DG in
33-Bus System
S. No.
Optimal
DG
Size (kW)
Optimal
Location
(Bus No.)
Minimum Power Loss
after optimal
placement
of DG (kW)
1 500 12 186.28
2 500 24 179.94
3 300 31 176.32
4 100 21 175.92
5 100 25 175.84
Case Study 2 (E): Optimal Placement of
Capacitor And Type-2 DG
Table 12: Results of Optimal Placement of Capacitor and
Type-2 DG in 33-Bus System
S.No.
Optimal
DG
Size (kW)
Optimal
Location
(Bus No.)
Minimum Power Loss
after optimal
placement
of DG (kW)
1 1000 9 79.18
2 500 32 58.88
S. No.
Optimal
Capacitor
Size (KVAr)
Optimal
Location
(Bus No.)
Minimum Power Loss
after placing the
Capacitors in turn
(kW)
1 300 32 185.07
2 300 30 167.24
3 300 14 153.29
4 300 30 145.60
5 300 25 142.09
6 300 6 139.81
7 150 24 139.40
8 150 21 139.18
9 150 4 139.06
6 International Journal for Modern Trends in Science and Technology
Optimal Placement and Sizing of Capacitor and Distributed Generator in Radial Distribution System
3 500 25 49.86
4 200 21 48.93
5 200 24 48.17
6 100 28 48.01
7 100 19 47.99
FIGURE
Analysis of Results Of Case Study on 33-Bus
System
Analysis of results of 33-Bus System for the
different cases is presented below.
(i) Optimal Placement of Capacitor: The
minimum active power loss obtained after
making reactive power load demand of the
system equal to zero (i.e., at all load buses,
Qload =0) is 138.4 kW. This is the minimum
possible loss that should be aimed at. Direct
Search Algorithm gave 139.06 kW as the
minimum loss after optimal placement of
capacitor. It can be observed that, the loss
obtained after optimal placement of capacitor
is very much nearer to the minimum possible
loss of the system. There is a reduction of
71.69 kW (34.016%) in the active power loss
when compared to the base case value. The
optimal sizes of capacitors obtained using the
algorithm is 300 and 150 kVAr. Bus number
32, 30, 14, 25, 6, 24, 21 and 4 are the optimal
locations for capacitor placement.
(ii) Optimal Placement of Type-3 DG: Table 8
shows the optimum location, corresponding
optimum size and total power loss with the
corresponding size of the DG (Type-3). The
minimum loss obtained after DG placement is
73.13 kW i.e., a reduction of 65.30% in the
loss when compared to the base case loss of
the system. Any further placement of DG will
start to increase the losses and it is likely that
it may overshoot the losses of the base case.
Also notice that location of DG plays an
important role in minimizing the losses.
(iii) Optimal Placement of Capacitor and Type-3
DG: Above two cases presents the minimum
possible loss that can be obtained after
optimal placement of capacitor and DG
(Type-3), individually. In this case capacitors
and DGs are placed together to obtained
further reduction in the losses. First optimal
placement of the capacitors is done (as shown
in Table 7) and then DGs are placed optimally
to achieve further reduction in the loss (Table
9). 9.08 kW is the minimum loss achieved after
optimal placement of C & DG (Type-3). The
active power loss is reduced by a staggering
figure of 95.69%. It can be noticed from Fig.
4.2 that the bus voltage profile has improved
significantly (above 0.99 p.u. at all the buses)
when compared to base case voltages.
(iv) Optimal Placement of Type-2 DG: The
optimal power factor of DG (Type-2) for 33-Bus
System is 0.85. The minimum loss obtained
after DG placement is 175.82 kW i.e., a
reduction of 16.57% in the loss when
compared to the base case loss of the system.
Any further placement of DG is going to
increase the loss. It can be noticed that Type-3
DG placement gives better loss reduction
when compared to Type-2 DG.
(v) Optimal Placement of Capacitor and Type-2
DG: Here also first capacitors are placed and
then optimal placement of DG is done. Table
4.12 shows the results of optimal placement of
DG after the optimal capacitor placement.
47.99 kW is the minimum loss achieved after
the optimal placement of C & DG (Type-2).
There is a reduction of 77.23% in the active
power loss. Better voltage profile is observed
when compared to the base case.
VI. COST ANALYSIS FOR 15-BUS SYSTEM
Detailed cost analysis for 15-bus system is
presented in this section. Average energy cost is
calculated as Rs. 5.88 per kWh. Three load levels
are considered. They are 160%, 100% and 50%
load levels. Three load levels and load duration
time data for the system is given in Table 13.
Table 13: Load Level and Load Duration
Load level 0.5 (Light) 1.0 (Normal) 1.6 (Peak)
Duration in a
Day (hr) 5 12 7
Cost Analysis with Capacitor Placement Only
Cost analysis with optimal capacitor placement is
presented here. The cost of capacitor is taken as
Rs. 379 per KVAr (market survey). The total cost of
the capacitor is Rs. 4, 54,800.
7 International Journal for Modern Trends in Science and Technology
Volume: 2 | Issue: 09 | September 2016 | ISSN: 2455-3778IJMTST
Table 14: Comparison of results with and without Capacitor
Placement
Load
Level
Power Loss
Before
Capacitor
Placement
(kW)
Power
Loss after
Capacitor
Placemen
t (kW)
Energy Loss
Cost before
Capacitor
Placement (Rs.)
Energy Loss
Cost after
Capacitor
Placement
(Rs.)
Light
(0.5)
14.70 7.38 1,57,745.7 79,194.78
Nomi
nal
(1.0)
61.80 30.30 15,91,621.92 7,80,358.32
Peak
(1.6)
168.91 93.71 25,37,602.494 14,07,842.814
Total
Cost
42,86,970.114 22,67,395.914
Annual Net Saving = Rs. 24,74,374.2
Table 14 shows the power loss and annual
energy loss cost for each loading condition. The
annual net saving is obtained by subtracting total
cost of capacitor and annual total energy loss cost
after capacitor placement from annual total energy
loss cost before capacitor placement.
Cost Analysis for C & DG (Type-2) Placement
Induction generator based Wind Energy System
(Type-2 DG) is optimally placed together with
switched capacitor. The total size of the DG and
capacitor is 600 kW 1200 kVAr respectively. A
comparison of results, with and without C & DG
(Type-2) placement, is presented in table 15 for
various loading condition.
Table 15: Comparison of results with and without C & DG
(Type-2) Placement
Load
Level
Power
Loss after
C & DG (
Type-2)
Placemen
t (kW)
Power
Loss after
C & DG (
Type-2)
Placemen
t (kW)
Energy Loss
Cost before
C & DG
(Type-2)
Placement
(Rs.)
Energy Loss
Cost after
C & DG
(Type-2)
Placement
(Rs.)
Light
(0.5)
14.70 4.14 1,57,745.7 44,426.34
Nominal
(1.0)
61.80 18.73 15,91,621.92 4,82,379.912
Peak
(1.6)
168.91 81.71
25,37,602.49
4
12,27,562.01
4
Total
Energy
Loss
Cost
(Annual
)
42,86,970.11
4
17,54,368.26
6
Calculation of Capital Return
Calculation of capital return is done as below:
• Energy Cost = Rs. 5.88/kWh
• Cost of Capacitor = Rs. 379/KVAr
• Total capital Cost of Wind Energy System
(Type-2 DG) = Rs. 5.5 Cr/ MW
• Energy Cost of Wind Energy System = Rs.
4/kWh
• Total Cost of DG installation ( CDG ) =
0.6*5.5*10^7 = Rs.3,30,00,000
• Total Cost of Capacitor installation ( CCap )
= Rs. 4,54,800
Before C & DG placement, active power supplied
from slack bus is 1288.2 kW and after C & DG
placement is 1245.15 kW. Difference between
these two quantities is 43.05 kW. The profit of this
power release is calculated as follow:
• Profit from the release of power (Annually)
= 43.05*5.88*365*24
= Rs. 22,17,453.84
Now the total cost is calculated as follows:
• Total Cost after C& DG placement = CDG +
CCap + Annual Energy Loss Cost after
C & DG (Type-2) placement - Profit from the
release of power
= Rs. 3,29,91,714.426
• Capital Return Period Years =
Total Cost after C& DG placement
Annual Energy Loss Cost before C & DG placement
= 3, 29, 91,714.426 / 42, 86,970.114
= 7.69 Years
So the capital cost can be recovered in
approximately 8 years. After this period the utility
will get a net saving of Rs. 25,32,601.85 annually.
Cost Analysis for C & Dg (Type-3) Placement
Solar photo voltaic system (Type-3 DG) is
optimally placed together with switched capacitor.
The total size of the DG and capacitor is 1200 kW
1200 kVAr respectively. A comparison of results,
with and without C & DG (Type-3) placement, is
presented in table 16 for various loading condition.
Table 16: Comparison of results with and without C & DG
(Type-3) Placement
Load
Level
Power
Loss
after
C & DG (
Type-3)
Placeme
nt (kW)
Power
Loss
after
C & DG (
Type-3)
Placeme
nt (kW)
Energy
Loss Cost
before
C & DG
(Type-3)
Placement
(Rs.)
Energy
Loss Cost
after
C & DG
(Type-3)
Placement
(Rs.)
Light
(0.5)
14.70 1.75 1,57,745.7 18,779.25
Nomin
al (1.0)
61.80 2.29
15,91,621.9
2
58,977.576
Peak
(1.6)
168.91 25.81
25,37,602.4
94
71,483.892
2
Total
Energ
y Loss
Cost
(Annu
al)
42,86,970.
114
1,49,240.7
182
8 International Journal for Modern Trends in Science and Technology
Optimal Placement and Sizing of Capacitor and Distributed Generator in Radial Distribution System
Calculation of Capital Return
Calculation of capital return is done as below:
• Energy Cost = Rs. 5.88/kWh
• Cost of Capacitor = Rs. 379/KVAr
• Total capital Cost of Solar Photo Voltaic
System = Rs. 7.97 Cr/ MW
• Energy Cost of Solar Power = Rs.
6.49/kWh
• Total Cost of DG installation ( CDG ) = 1.2
*7.97*10^7 = Rs. 9,56,40,000
• Total Cost of Capacitor installation ( CCap )
= Rs. 4,54,800
Before C & DG placement, active power
supplied from slack bus is 1288.2 kW and after C &
DG placement is 1228.69 kW. Difference between
these two quantities is 59.51 kW.
The profit of this power release is calculated as
follow:
• Profit from the release of power (Annually)
= 59.51*5.88*365*24
= Rs. 30,65,288.68
Now the total cost is calculated as follows:
• Total Cost after C& DG placement = CDG +
CCap + Annual Energy Loss Cost after
C & DG (Type-2) placement - Profit from the
release of power
= Rs. 9,31,78,752.0382
•
Capital Return Period Years =
Total Cost after C& DG placement
Annual Energy Loss Cost before C & DG placement
= 9,31,78,752.0382 / 42,86,970.114
= 21.75 Years
So the capital cost can be recovered in
approximately 22 years.
Cost Analysis for 33-Bus System
Cost Analysis with Capacitor Placement Only
2250 kVAr is the total size of capacitor used for
loss reduction in the 33-bus system. The total cost
of the capacitor came out to be Rs. 8,52,750. Table
5.5 shows the comparison between power loss and
annual energy loss cost before and after placement
of capacitor for all the given loading condition. An
annual net saving of Rs. 41,81,119.176 is
obtained.
Table 17: Comparison of results with and without Capacitor
Placement
Load
Level
Power
Loss
Before
Capacitor
Placement
(kW)
Power
Loss
after
Capacitor
Placement
(kW)
Energy Loss
Cost before
Capacitor
Placement (Rs.)
Energy Loss
Cost after
Capacitor
Placement
(Rs.)
Light
(0.5)
48.76 32.77 5,23,243.56
3,51,654.8
7
Nominal
(1.0)
210.75 139.06 54,27,739.8
35,81,406.
864
Peak
(1.6)
602.12 401.37 90,45,889.608
60,29,942.
058
Total 1,49,96,872.968 99,63,003.
Cost 792
Annual Net Saving = Rs. 41,81,119.176
Cost Analysis for C & DG (Type-2) Placement
Induction generator based Wind Energy System
(Type-2 DG) is optimally placed together with
switched capacitor. The total size of the DG and
capacitor is 2600 kW 2250 kVAr respectively. A
comparison of results, with and without C & DG
(Type-2) placement, is presented in table 18 for
various loading condition.
Table 18: Comparison of results with and without C & DG
(Type-2) Placement
Load
Level
Power
Loss after
C & DG (
Type-2)
Placement
(kW)
Power
Loss after
C & DG (
Type-2)
Placement
(kW)
Energy Loss
Cost before
C & DG
(Type-2)
Placement
(Rs.)
Energy Loss
Cost after
C & DG
(Type-2)
Placement
(Rs.)
Light
(0.5)
14.70 4.14 1,57,745.7 44,426.34
Nominal
(1.0)
61.80 18.73 15,91,621.92 4,82,379.912
Peak
(1.6)
168.91 81.71 25,37,602.494 12,27,562.014
Total
Energy
Loss Cost
(Annual)
42,86,970.114 17,54,368.266
Calculation of Capital Return
Calculation of capital return is done as below:
• Energy Cost = Rs. 5.88/kWh
• Cost of Capacitor = Rs. 379/KVAr
• Total capital Cost of Wind Energy System
(Type-2 DG) = Rs. 5.5 Cr/ MW
• Energy Cost of Wind Energy System
= Rs. 4/kWh
• Total Cost of DG installation ( CDG )
= 2.6*5.5*10^7 = Rs.14,30,00,000
• Total Cost of Capacitor installation ( CCap )
= Rs. 8,52,750
Before C & DG placement, active power
supplied from slack bus is 3925.75 kW and after C
& DG placement is 3762.99 kW. Difference
between these two quantities is 162.76 kW.
The profit of this power release is calculated as
follow:
• Profit from the release of power (Annually)
= 162.76*5.88*365*24
= Rs. 83,83,572.288
Now the total cost is calculated as follows:
• Total Cost after C& DG placement = CDG +
CCap + Annual Energy Loss Cost after
C & DG (Type-2) placement - Profit from the
release of power
= Rs. 14,06,19,735.78
•
Capital Return Period Years =
Total Cost after C& DG placement
Annual Energy Loss Cost before C & DG placement
9 International Journal for Modern Trends in Science and Technology
Volume: 2 | Issue: 09 | September 2016 | ISSN: 2455-3778IJMTST
= 14,06,19,735.782 / 1,49,96,872.968
= 9.37 Years
So the capital cost can be recovered in
approximately 9.5 years. After this period the
utility will get a net saving of Rs. 98,46,314.898
annually.
Cost Analysis for C & DG (Type-3) Placement
Solar photo voltaic system (Type-3 DG) is
optimally placed together with switched capacitor.
The total size of the DG and capacitor is 3500 kW
2250 kVAr respectively. A comparison of results,
with and without C & DG (Type-3) placement, is
presented in table 19 for various loading condition.
Calculation of Capital Return
Calculation of capital return is done as below:
• Energy Cost = Rs. 5.88/kWh
• Cost of Capacitor = Rs. 379/KVAr
• Total capital Cost of Solar Photo Voltaic
System = Rs. 7.97 Cr/ MW
• Energy Cost of Solar Power
= Rs. 6.49/kWh
• Total Cost of DG installation ( CDG )
= 3.5*7.97*10^7 = Rs. 27,89,50,000
• Total Cost of Capacitor installation ( CCap )
= Rs. 8,52,750
Table 19: Comparison of results with and without C & DG
(Type-3) Placement
Load
Level
Power
Loss after
C & DG (
Type-3)
Placement
(kW)
Power
Loss after
C & DG (
Type-3)
Placement
(kW)
Energy Loss
Cost before
C & DG (Type-3)
Placement
(Rs.)
Energy
Loss Cost
after
C & DG
(Type-3)
Placemen
t (Rs.)
Light
(0.5)
48.76 2.34 5,23,243.56 25,110.54
Nominal
(1.0)
210.75 9.08 54,27,739.8
2,33,849.
952
Peak
(1.6)
602.12 76.76 90,45,889.608
11,53,196
.184
Total
Energy
Loss
Cost
(Annual)
1,49,96,872.968
14,12,156
.676
Before C & DG placement, active power supplied
from slack bus is 3925.75 kW and after C & DG
placement is 3724.08 kW. Difference between
these two quantities is 201.67 kW.
The profit of this power release is calculated as
follow:
• Profit from the release of power (Annually)
= 201.67*5.88*365*24
= Rs. 1,03,87,779.7
Now the total cost is calculated as follows:
• Total Cost after C& DG placement = CDG +
CCap + Annual Energy Loss Cost after
C & DG (Type-2) placement - Profit from
the release of power
= Rs. 27,08,27,126.976
•
Capital Return Period Years =
Total Cost after C& DG placement
Annual Energy Loss Cost before C & DG placement
= 27,08,27,126.976 / 1,49,96,872.968
= 18.05 Years
So the capital cost can be recovered in
approximately 18 years.
Cost Analysis Limitations
Following are the limitation of cost analysis
presented in this dissertation work:
1. Cost function is not included in the
objective function while determining the
optimal size of capacitor and DG. The main
objective is to minimize the loss without
considering the cost.
2. Cost analysis is done only on the basis of
loss reduction. Other monetary benefits
obtained by installation of DGs are not
included.
3. Urban feeder with only domestic, industrial
and commercial load is considered in this
work. Hence the energy cost is calculated
by taking average of per unit cost of above
three loads.
VII. CONCLUSION
In this work, Direct Search Algorithm is
implemented to determine the optimal sizes of
Capacitors and DGs along with their optimal
locations for loss reduction in the Radial
Distribution Systems. Switched Capacitor, Type-2
and Type-3 DGs are considered for loss reduction.
Case studies are carried out on three standard test
systems: 15-bus system, 33-Bus System and
69-Bus System. It is observed that there is a
highest reduction in the real power loss along with
improvement in the voltage profile of the
distribution systems when both Capacitors and
DGs are used. Type-3 DG gives much reduction in
loss compared to Type-2 DG, individually or along
with Capacitor placement. With respect to base
case power loss, there is a reduction of 96.29%,
95.69% and 96.76% in the power loss for 15-Bus
System, 33-Bus System and 69-Bus System
10 International Journal for Modern Trends in Science and Technology
Optimal Placement and Sizing of Capacitor and Distributed Generator in Radial Distribution System
respectively after placing Capacitors and Type-3
DGs and a reduction of 69.69%, 77.23% and
82.50% respectively with Capacitors and Type-2
DGs. Cost analysis of Capacitor and DG Placement
is done for all the three standard test systems. Net
saving is obtained when only capacitors are used
for loss reduction. Because of high initial cost of
installation, capital return period for Type-3 DG is
more when compared to Type-2 DG. Hence it is
concluded that loss reduction is achieved either
through Capacitor or DG placement but highest
reduction is obtained by combination of both.
REFERENCES
[1] M. Ramalinga Raju, K.V.S. Ramachandra Murthy, K.
Ravindra, “Direct search algorithm for capacitive
compensation in radial distribution systems”,
Elsevier, Electrical Power and Energy Systems, Vol.
42, pp.24–30, May 2012.
[2] M.H.Haque, “Capacitor placement in radial
distribution systems for loss reduction”, IEEE Proc. -
Gener. Transm. Distrib.,Vol. 146, No. 5, pp.
501-505, September 1999 .
[3] Jen-Hao Teng, “A Network-Topology-based
Three-Phase Load Flow for Distribution Systems”,
Proc. Natl. Sci. Counc. ROC (A), Vol. 24, pp.
259-264, April 2000.
[4] Naresh Acharya, Pukar Mahat, N. Mithulananthan,
“An analytical approach for DG allocation in primary
distribution network”, Elsevier, Electrical Power and
Energy Systems, Vol. 28, pp.669-678, May 2006.
[5] K. Prakash, Member, IEEE, and M. Sydulu, “Particle
Swarm Optimization Based Capacitor Placement on
Radial Distribution Systems”, IEEE Conference-
2007.
[6] T.S.Abdel-Salam, Student Member K Y.Chikhani,
Senior Member R.HACKAM, Fellow, “A New
Technique for Loss Reduction using Compensating
Capacitors Applied to distribution Systems with
varying Load Condition”, IEEE Transactions on
Power Delivery, Vol. 9, No. 2, pp. 819-827, April
1994.
[7] Ivo Chaves da Silva, Jr., Sandoval Carneiro, Jr.,
Edimar José de Oliveira, Jeferson de Souza Costa,
José Luiz Rezende Pereira, Member, IEEE, and Paulo
Augusto Nepomuceno Garcia, “A Heuristic
Constructive Algorithm for Capacitor Placement on
Distribution Systems”, IEEE Transactions on Power
Systems, Vol. 23, No. 4, pp. 1619-1626, November
2008.
[8] M. Ettehadi, Student Member, IEEE, H.Ghasemi,
Senior Member, IEEE, and S. Vaez-Zadeh, Senior
Member, IEEE, “Voltage Stability-Based DG
Placement in Distribution Networks”,IEEE
Transactions on Power Delivery, Vol. 28, No. 1, pp.
171-178, January 2013.
[9] Caisheng Wang, Student Member, IEEE, and M.
Hashem Nehrir, Senior Member, IEEE, “Analytical
Approaches for Optimal Placement of Distributed
Generation Sources in Power Systems”, IEEE
Transactions on Power Systems, Vol. 19, No. 4, pp.
2068-2076, November 2004.
[10]Dan Zhu, Robert P. Broadwater, Member, IEEE,
Kwa-Sur Tam, Senior Member, IEEE, Rich Seguin,
Member, IEEE, and Haukur Asgeirsson, Member,
IEEE, “Impact of DG Placement on Reliability and
Efficiency with Time-Varying Loads”, IEEE
Transactions on Power Systems, Vol. 21, No. 1, pp.
419-427, February 2006.
[11]Hasan Hedayati, S. A. Nabaviniaki, and Adel
Akbarimajd, “A Method for Placement of DG Units in
Distribution Networks”, IEEE Transactions on Power
Delivery, Vol. 23, No. 3, pp. 1620-1628, July 2008.

More Related Content

What's hot (20)

PPTX
Design and Analysis of DC-DC Bidirectional Converter for Vehicle to Grid Appl...
PranayJagtap5
 
PPTX
Ppt of 132kv gss sitapura jaipur
kishankky
 
PPTX
ppt on inveters
Urvashi Khandelwal
 
PDF
Report Automatic led emergency light
Vatsal N Shah
 
PDF
Introduction to Power Quality Problems
SUNYANI TECHNICAL UNIVERSITY
 
PPTX
POWER SYSTEM PLANNING AND DESIGN. DESIGN OF EHV TRANSMISSION LINES & BUNDLED ...
Jobin Abraham
 
PPTX
COGGING & CRAWLING IN INDUCTION MOTOR
ELECTRICAL ENGINEERING BY ASHUTOSH
 
DOC
Internship doc 33 11 kv substation
Madeen Kumar
 
PPTX
Analog multimeter and ohmmeter
Rahul Ranjan
 
PPTX
Traction motor
Rajneesh Budania
 
PPTX
Wireless Charging of Electric Vehicles
Pritam Kumar Singh
 
PDF
Power system protection_lecture_notes
lcm3766l
 
PPT
Solar charge controller
Siya Agarwal
 
PPTX
Electric traction
Dipak Meher
 
PPTX
Electric traction system
AmitKumar6931
 
PPTX
Presentation about transformer and its types
M Tahir Shaheen
 
PPTX
Parallel Inverter
Smit Shah
 
PPTX
Computer aided design of electrical machine
Asif Jamadar
 
PDF
final year project report
Anuj Kumar
 
PPTX
dstatcom
satish srisailapu
 
Design and Analysis of DC-DC Bidirectional Converter for Vehicle to Grid Appl...
PranayJagtap5
 
Ppt of 132kv gss sitapura jaipur
kishankky
 
ppt on inveters
Urvashi Khandelwal
 
Report Automatic led emergency light
Vatsal N Shah
 
Introduction to Power Quality Problems
SUNYANI TECHNICAL UNIVERSITY
 
POWER SYSTEM PLANNING AND DESIGN. DESIGN OF EHV TRANSMISSION LINES & BUNDLED ...
Jobin Abraham
 
COGGING & CRAWLING IN INDUCTION MOTOR
ELECTRICAL ENGINEERING BY ASHUTOSH
 
Internship doc 33 11 kv substation
Madeen Kumar
 
Analog multimeter and ohmmeter
Rahul Ranjan
 
Traction motor
Rajneesh Budania
 
Wireless Charging of Electric Vehicles
Pritam Kumar Singh
 
Power system protection_lecture_notes
lcm3766l
 
Solar charge controller
Siya Agarwal
 
Electric traction
Dipak Meher
 
Electric traction system
AmitKumar6931
 
Presentation about transformer and its types
M Tahir Shaheen
 
Parallel Inverter
Smit Shah
 
Computer aided design of electrical machine
Asif Jamadar
 
final year project report
Anuj Kumar
 

Viewers also liked (20)

PDF
Final paperenhancing distribution system through the use of real time etherne...
Genc Gjergjani
 
PDF
Monitoring and analysis of reliaibility of electrical distribution system
IAEME Publication
 
PDF
Lab view study of electrical power distribution system
eSAT Publishing House
 
PDF
A Flexible AC Distribution System for a Microgrid with a Photovoltaic System ...
IJMTST Journal
 
PDF
Performance Analysis of MIMO Equalization Techniques with Highly Efficient Ch...
IJMTST Journal
 
PDF
Effective Identification of Packet Droppers and Modifiers in Wireless Sensor ...
IJMTST Journal
 
PDF
Using Homomorphism Linear Signature Auditing Detection of Routing Packet Drop...
IJMTST Journal
 
PDF
Captiosus Voting System
IJMTST Journal
 
PDF
Recognition by Using Image Processing for Different Size Distribution Schemes
IJMTST Journal
 
PDF
Easy Mobile Cable Management System Using Android Application
IJMTST Journal
 
PDF
Secure & Energy Efficient Scheme against Denial-of-Sleep Attack in WSN
IJMTST Journal
 
PDF
Artificial Neural Network Based Closed Loop Control of Multilevel Inverter
IJMTST Journal
 
PDF
Healthcare Monitoring System by using iSense Device& IOT Platform
IJMTST Journal
 
PDF
SPCHS Construction for Expeditious Keyword Search in Cipher Text
IJMTST Journal
 
PDF
A Three Phase AC-AC ZCS Resonant Converter for Induction Heating
IJMTST Journal
 
PDF
Securing the Data Communication between the Neighboring Sensor Nodes using Bi...
IJMTST Journal
 
PDF
Filter Based Solar Power Generation System with a Seven Level Inverter
IJMTST Journal
 
PDF
An FPGA Based Floating Point Arithmetic Unit Using Verilog
IJMTST Journal
 
PDF
Implementation of a Voltage Multiplier based on High Step-up Converter using FLC
IJMTST Journal
 
PDF
A Three Phase D-STATCOM to Compensate AC and DC loads by using Fuzzy Logic DC...
IJMTST Journal
 
Final paperenhancing distribution system through the use of real time etherne...
Genc Gjergjani
 
Monitoring and analysis of reliaibility of electrical distribution system
IAEME Publication
 
Lab view study of electrical power distribution system
eSAT Publishing House
 
A Flexible AC Distribution System for a Microgrid with a Photovoltaic System ...
IJMTST Journal
 
Performance Analysis of MIMO Equalization Techniques with Highly Efficient Ch...
IJMTST Journal
 
Effective Identification of Packet Droppers and Modifiers in Wireless Sensor ...
IJMTST Journal
 
Using Homomorphism Linear Signature Auditing Detection of Routing Packet Drop...
IJMTST Journal
 
Captiosus Voting System
IJMTST Journal
 
Recognition by Using Image Processing for Different Size Distribution Schemes
IJMTST Journal
 
Easy Mobile Cable Management System Using Android Application
IJMTST Journal
 
Secure & Energy Efficient Scheme against Denial-of-Sleep Attack in WSN
IJMTST Journal
 
Artificial Neural Network Based Closed Loop Control of Multilevel Inverter
IJMTST Journal
 
Healthcare Monitoring System by using iSense Device& IOT Platform
IJMTST Journal
 
SPCHS Construction for Expeditious Keyword Search in Cipher Text
IJMTST Journal
 
A Three Phase AC-AC ZCS Resonant Converter for Induction Heating
IJMTST Journal
 
Securing the Data Communication between the Neighboring Sensor Nodes using Bi...
IJMTST Journal
 
Filter Based Solar Power Generation System with a Seven Level Inverter
IJMTST Journal
 
An FPGA Based Floating Point Arithmetic Unit Using Verilog
IJMTST Journal
 
Implementation of a Voltage Multiplier based on High Step-up Converter using FLC
IJMTST Journal
 
A Three Phase D-STATCOM to Compensate AC and DC loads by using Fuzzy Logic DC...
IJMTST Journal
 
Ad

Similar to Optimal Placement and Sizing of Capacitor and Distributed Generator in RadialDistribution System (20)

PDF
Jh3516001603
IJERA Editor
 
PDF
Review on Optimal Allocation of Capacitor in Radial Distribution System
IRJET Journal
 
PDF
IRJET- Comparative Study of Radial and Ring Type Distribution System
IRJET Journal
 
PDF
11.power loss reduction in radial distribution system by using plant growth s...
Alexander Decker
 
PDF
Power loss reduction in radial distribution system by using plant growth simu...
Alexander Decker
 
PDF
A010430108
IOSR Journals
 
PDF
An analytical approach for optimal placement of combined dg and capacitor in ...
IAEME Publication
 
PDF
Optimizing location and size of capacitors for power loss reduction in radial...
TELKOMNIKA JOURNAL
 
DOC
Optimal Capacitor Placement for Improving Electrical Performance in distribut...
AmmarHakami
 
PDF
Presentation on optimal placement of transformer in a radial distribution net...
samtechyaounde
 
PDF
[IJET-V1I4P9] Author :Su Hlaing Win
IJET - International Journal of Engineering and Techniques
 
PPT
Distributed generation placement
Satish Kansal
 
PDF
Reactive power compensation in radial distribution system
ENGTawfigAlmaliky
 
PDF
Optimum reactive power compensation for distribution system using dolphin alg...
IJECEIAES
 
PDF
40220140503002
IAEME Publication
 
PDF
Optimal Placement of DG for Loss Reduction and Voltage Sag Mitigation in Radi...
IDES Editor
 
PDF
Performance Improvement of the Radial Distribution System by using Switched C...
idescitation
 
PDF
Optimal Siting And Sizing Of Distributed Generation For Radial Distribution S...
inventy
 
PDF
Optimal Capacitor Placement in Distribution System using Fuzzy Techniques
IDES Editor
 
PDF
IJCER (www.ijceronline.com) International Journal of computational Engineerin...
ijceronline
 
Jh3516001603
IJERA Editor
 
Review on Optimal Allocation of Capacitor in Radial Distribution System
IRJET Journal
 
IRJET- Comparative Study of Radial and Ring Type Distribution System
IRJET Journal
 
11.power loss reduction in radial distribution system by using plant growth s...
Alexander Decker
 
Power loss reduction in radial distribution system by using plant growth simu...
Alexander Decker
 
A010430108
IOSR Journals
 
An analytical approach for optimal placement of combined dg and capacitor in ...
IAEME Publication
 
Optimizing location and size of capacitors for power loss reduction in radial...
TELKOMNIKA JOURNAL
 
Optimal Capacitor Placement for Improving Electrical Performance in distribut...
AmmarHakami
 
Presentation on optimal placement of transformer in a radial distribution net...
samtechyaounde
 
Distributed generation placement
Satish Kansal
 
Reactive power compensation in radial distribution system
ENGTawfigAlmaliky
 
Optimum reactive power compensation for distribution system using dolphin alg...
IJECEIAES
 
40220140503002
IAEME Publication
 
Optimal Placement of DG for Loss Reduction and Voltage Sag Mitigation in Radi...
IDES Editor
 
Performance Improvement of the Radial Distribution System by using Switched C...
idescitation
 
Optimal Siting And Sizing Of Distributed Generation For Radial Distribution S...
inventy
 
Optimal Capacitor Placement in Distribution System using Fuzzy Techniques
IDES Editor
 
IJCER (www.ijceronline.com) International Journal of computational Engineerin...
ijceronline
 
Ad

Recently uploaded (20)

PPTX
Fluid statistics and Numerical on pascal law
Ravindra Kolhe
 
PDF
POWER PLANT ENGINEERING (R17A0326).pdf..
haneefachosa123
 
PDF
SMART HOME AUTOMATION PPT BY - SHRESTH SUDHIR KOKNE
SHRESTHKOKNE
 
PDF
1_ISO Certifications by Indian Industrial Standards Organisation.pdf
muhammad2010960
 
PDF
Geothermal Heat Pump ppt-SHRESTH S KOKNE
SHRESTHKOKNE
 
PPTX
GitHub_Copilot_Basics...........................pptx
ssusera13041
 
PPTX
Unit II: Meteorology of Air Pollution and Control Engineering:
sundharamm
 
PDF
th International conference on Big Data, Machine learning and Applications (B...
Zac Darcy
 
PDF
MRI Tool Kit E2I0500BC Plus Presentation
Ing. Ph. J. Daum GmbH & Co. KG
 
PDF
July 2025 - Top 10 Read Articles in Network Security & Its Applications.pdf
IJNSA Journal
 
PPTX
Smart_Cities_IoT_Integration_Presentation.pptx
YashBhisade1
 
PDF
SE_Syllabus_NEP_Computer Science and Engineering ( IOT and Cyber Security Inc...
krshewale
 
PPTX
ENSA_Module_8.pptx_nice_ipsec_presentation
RanaMukherjee24
 
PDF
mosfet introduction engg topic for students.pdf
trsureshkumardata
 
PDF
Comparative Analysis of the Use of Iron Ore Concentrate with Different Binder...
msejjournal
 
PDF
ADVXAI IN MALWARE ANALYSIS FRAMEWORK: BALANCING EXPLAINABILITY WITH SECURITY
ijscai
 
PPTX
00-ClimateChangeImpactCIAProcess_PPTon23.12.2024-ByDr.VijayanGurumurthyIyer1....
praz3
 
PDF
MOBILE AND WEB BASED REMOTE BUSINESS MONITORING SYSTEM
ijait
 
PDF
LEARNING CROSS-LINGUAL WORD EMBEDDINGS WITH UNIVERSAL CONCEPTS
kjim477n
 
PPTX
Cyclic_Redundancy_Check_Presentation.pptx
alhjranyblalhmwdbdal
 
Fluid statistics and Numerical on pascal law
Ravindra Kolhe
 
POWER PLANT ENGINEERING (R17A0326).pdf..
haneefachosa123
 
SMART HOME AUTOMATION PPT BY - SHRESTH SUDHIR KOKNE
SHRESTHKOKNE
 
1_ISO Certifications by Indian Industrial Standards Organisation.pdf
muhammad2010960
 
Geothermal Heat Pump ppt-SHRESTH S KOKNE
SHRESTHKOKNE
 
GitHub_Copilot_Basics...........................pptx
ssusera13041
 
Unit II: Meteorology of Air Pollution and Control Engineering:
sundharamm
 
th International conference on Big Data, Machine learning and Applications (B...
Zac Darcy
 
MRI Tool Kit E2I0500BC Plus Presentation
Ing. Ph. J. Daum GmbH & Co. KG
 
July 2025 - Top 10 Read Articles in Network Security & Its Applications.pdf
IJNSA Journal
 
Smart_Cities_IoT_Integration_Presentation.pptx
YashBhisade1
 
SE_Syllabus_NEP_Computer Science and Engineering ( IOT and Cyber Security Inc...
krshewale
 
ENSA_Module_8.pptx_nice_ipsec_presentation
RanaMukherjee24
 
mosfet introduction engg topic for students.pdf
trsureshkumardata
 
Comparative Analysis of the Use of Iron Ore Concentrate with Different Binder...
msejjournal
 
ADVXAI IN MALWARE ANALYSIS FRAMEWORK: BALANCING EXPLAINABILITY WITH SECURITY
ijscai
 
00-ClimateChangeImpactCIAProcess_PPTon23.12.2024-ByDr.VijayanGurumurthyIyer1....
praz3
 
MOBILE AND WEB BASED REMOTE BUSINESS MONITORING SYSTEM
ijait
 
LEARNING CROSS-LINGUAL WORD EMBEDDINGS WITH UNIVERSAL CONCEPTS
kjim477n
 
Cyclic_Redundancy_Check_Presentation.pptx
alhjranyblalhmwdbdal
 

Optimal Placement and Sizing of Capacitor and Distributed Generator in RadialDistribution System

  • 1. 1 International Journal for Modern Trends in Science and Technology Volume: 2 | Issue: 09 | September 2016 | ISSN: 2455-3778IJMTST Optimal Placement and Sizing of Capacitor and Distributed Generator in Radial Distribution System D. Ramakrishna1 | G. Vasu2 1, 2Department of Electrical and Electronics Engineering, Sanketika Vidya Parishad Engineering College, Visakhapatnam. Distribution Systems are growing large and being stretched too far, leading to higher system losses and poor voltage regulation, the need for an efficient and effective distribution system has therefore become more urgent and important. A distribution system connects consumers to the high-voltage transmission system. Because of lower voltage, and hence higher current, the I2R loss in a distribution system is significantly high compared to that in a high-voltage transmission system. The pressure of improving the overall efficiency of power delivery has forced the power utilities to reduce the loss, especially at the distribution level. Loss reduction initiatives in distribution systems have been activated due to the increasing cost of supplying electricity, the shortage in fuel with ever-increasing cost to produce more power, and the global warming concerns. The total system loss can be decreased by installing capacitor bank and distributed generation. These two methods can also help maintaining the level of voltage and maintenance power factor. The direct search algorithm is applied to minimize the loss in radial distribution systems. KEYWORDS: Capacitor, Distributed Generator, Optimal Location, Radial Distribution Copyright © 2016 International Journal for Modern Trends in Science and Technology All rights reserved. I. INTRODUCTION Distribution system constitutes the link between electricity utilities and consumers and their revenue realization segment. For consumers, it represents the face of the utility. The modern distribution system begins as the primary circuit leaves the sub-station and ends as the secondary service enters the customer's meter socket by way of service main. Distribution circuits serve many types of customers. The voltage used is appropriate for the shorter distance and varies from 230 to about 33,000 volts depending on utility standard practice, distance, and load to be served. Distribution circuits are fed from a transformer located in an electrical substation, where the voltage is reduced from the high values used for power transmission. II. LOAD FLOW SOLUTION Traditional transmission system load flow methods Gauss-Siedel and Newton Raphson techniques cannot be used for distribution systems as R/X ratio is high. Network-Topology-Based Three-Phase Load Flow for Distribution Systems is used in this dissertation work. The capacitor placement problem consists of determining the optimal numbers, locations and sizes of capacitor such that minimum yearly cost due to power/energy losses and cost of capacitors is achieved. In this dissertation work, optimal sizes of the switched capacitors in terms of standard sizes available in the market and their locations are to be determined for maximum possible reduction in the loss for radial distribution system. Standard capacitor sizes available in the literature (in KVAR): 150, 300, 450, 600, 750, 900, 1050, 1200, 1350, 1500, 1650, 1800, 1950, 2100, 2250, 2400, 2550, 2700, 2850, 3000, 3150, 3300, 3450, 3600, 3750, 3900, 4050. III. SOLUTION METHODOLOGY In this dissertation work, Direct Search Algorithm is used to determine the optimal sizes of switched capacitors together with their optimal locations in radial distribution systems so that maximum possible reduction in losses is achieved. The algorithm is used for radial distribution system ABSTRACT
  • 2. 2 International Journal for Modern Trends in Science and Technology Optimal Placement and Sizing of Capacitor and Distributed Generator in Radial Distribution System with source bus as slack bus and all other load buses as PQ buses. The algorithm is described in following steps for deciding the optimal sizes of the capacitors in terms of standard sizes available in the market and their locations (only load buses). 1. Read the system data of the distribution system. Run Base case load flow and determine the total active power loss (Ploss) of the system. 2. Make Qload =0 by fully compensating all load buses. Run the load flow. Determine Ploss. (This is the minimum possible loss of the system to be aimed at for determining optimal sizes and locations of Capacitors.) 3. Make „n‟ number of capacitors of different sizes, whose total is equal to or near Qtotal. Let m(k) be the number of capacitor where k is ranging from 1 to n. 4. Place first capacitor at each load bus in turn and determine Ploss in each case. Identify the location where system loss is minimum (Ploss(min) ) Repeat this procedure for other sizes of capacitors. Now determine the minimum of Ploss(min) and place the corresponding optimal capacitor at the corresponding optimal location. 5. Repeat Step-4 for optimal placement of remaining capacitors till minimum possible loss is achieved i.e. further placement of capacitor will result in increase in the loss. The sizing and sequencing of capacitors depend on load pattern and can be adjudged by the expert analyst. IV. OPTIMAL DISTRIBUTED GENERATOR PLACEMENT FOR LOSS REDUCTION The share of distributed generators (DGs) in power systems has been slowly increasing in the last few years. DG placement can cause reduction of power losses and improvement of voltage profile. There are many reasons for using DG units such as reduction of system harmonics, improvement of power quality, improvement of reliability of systems, improvement of voltage profile and avoiding of investment in infrastructure of distribution and transmission networks. Distributed Generators can be divided into four types, namely a) Type-1 DG: It injects both real and reactive power into the system. Power factor (PFDG) of the DG is 0 < PFDG < 1. Synchronous Generator is an example of Type-1 DG. b) Type-2 DG: It is capable of injecting real power but consumes reactive power from the system. Power factor is given by 0 < PFDG < 1. Induction Generator based in Wind Turbine Generator System comes under Type-2 DG. c) Type-3 DG: This type of DG injects real power only. Power factor for Type-3 DG is 1. Solar PV System is an example of Type-3 DG. d) Type-4 DG: It is capable of injecting reactive power only. Power factor is 0 for this type of DG. An example for Type-4 DG is Synchronous Compensator. V. PROBLEM FORMULATION The optimum DG allocation can be treated as optimum active power compensation, like capacitor allocation for reactive power compensation. DG allocation studies are relatively new, unlike capacitor allocation. The objective function here is to find the optimal sizes of the DGs (type-2 & Type-3) in terms of standard sizes available in the market and their locations so as to minimize the system loss and improve voltage profile. A. Power Factor Selection for DG Type- 2 DGs injects real power into the system but consumes reactive power from the system. The power factor of the Type- 2 DG is 0 < PFDG < 1. To find the optimal power factor of DG for a given radial distribution system, fast approach is implemented. According to this approach the power factor of combined total load of the system (PFD) can be expressed by (1) PFD = PD (PD 2 + QD 2 ) Where, PD = PDi N i=1 QD = QDi N i=1 The “possible minimum” total loss can be achieved if the power factor of DG (PFDG) is quickly selected to be equal to that of the total load (PFD). That can be expressed by (2) PFDG = PFD For Type-3 DG, power factor is always 1. B. Solution Methodology The same Direct Search Algorithm is used again to determine the optimal sizes of DG (Type-2 and
  • 3. 3 International Journal for Modern Trends in Science and Technology Volume: 2 | Issue: 09 | September 2016 | ISSN: 2455-3778IJMTST Type-3) together with their optimal locations in radial distribution systems so that maximum possible reduction in losses is achieved. The algorithm is used for radial distribution system with source bus as slack bus and all other load buses as PQ buses. In case of Type-2 DG reactive power consumed from the system is also taken into consideration. C. Case Studies, Results and Analysis The Direct Search Algorithm is used for determining the optimal location together with the sizes of Capacitor and DG for loss reduction in the radial distribution system. The algorithm is implemented on 15, 33 and 69 - Bus System. For all the test systems, first individual capacitor and DG (Type-2 and Type-3) placement is done. DG placement along with capacitor is also presented for all the three test systems. D. Case Study 1: 15 Bus System This case study is on 15-Bus Radial Distribution System which consists of 15 buses and 14 branches. All the buses are load buses except one slack bus. The total active and reactive power demand of the system is 1266.4 kW and 1251.1 kVAr respectively. 61.80 kW is the base case active power loss of the system. Fig.1 Flowchart for DG Placement using Direct Search Algorithm Case Study 1 (A): Optimal Placement of Capacitor: Table 1: Results of Optimal Capacitor Placement in15-Bus System S.No. Optimal Capacitor Size (KVAr) Optimal Location (Bus No.) Minimum Power Loss after Optimal Capacitor placement (kW) 1 300 4 48.19 2 300 11 39.12 3 300 6 32.48 4 150 15 30.98 5 150 9 30.30 Case Study 1 (B): Optimal Placement of Type-3 DG Table 2: Results of Optimal Placement of Type-3 DG in 15- Bus System S.No. Optimal DG Size (kW) Optimal Location (Bus No.) Minimum Power Loss after Optimal Placement of DG (kW) 1 500 4 42.86 2 500 6 34.56 3 100 12 32.80 4 100 11 32.13 Case Study 1 (C): Optimal Placement of Capacitor A=and Type-3 DG Table3: Results of Optimal Capacitor and Type-3 DG Placement in 15- Bus System S. No. Optimal DG Size (kW) Optimal Location (Bus No.) Minimum Power Loss after Optimal Placement of DG (kW) 1 500 4 12.43 2 500 6 4.57 3 100 12 2.92 4 100 11 2.29 Case Study 1 (D): Optimal Placement of Type-2 DG Table 4: Reactive Power Consumed by various sizes of DGs at 0.7 p.f. S.No. Real Power Injected by DG (Type-2) (kW) Reactive Power Consumed by DG (Type-2) (KVAr) KVA Rating of DG (Type-2) 1 1000 1020.20 1428.57 2 500 510.048 714.24 3 300 306.024 428.54 4 200 204.02 285.69 5 100 102 142.85 Table 5: Optimal Placement of Type-2 DG on 15- Bus System using Direct Search Algorithm
  • 4. 4 International Journal for Modern Trends in Science and Technology Optimal Placement and Sizing of Capacitor and Distributed Generator in Radial Distribution System S.No. Optimal DG Size (Type-2) (kW) Optimal Location (Bus No.) Minimum Power Loss after Optimal Placement of DG (kW) 1 500 2 68.66 Case Study 1 (E): Optimal Placement of Capacitor And Type-2 DG Table 6: Results of Optimal Placement of Capacitor and Type-2 DG in 15- Bus System S.No. Optimal DG Size (kW) Optimal Location (Bus No.) Minimum Power Loss after optimal placement of DG (kW) 1 500 3 19.70 2 100 6 18.73 Analysis of Results of Case Study On 15-Bus System Analysis of results of 15-Bus System for the different cases is presented below. (i) Optimal Placement of Capacitor: The minimum active power loss obtained after making reactive power load demand of the system equal to zero (i.e., at all load buses, Qload =0) is 29.38 kW. This is the minimum possible loss that should be aimed at. Direct Search Algorithm gave 30.30 kW as the minimum loss after optimal placement of capacitor. It can be observed that, the loss obtained after optimal placement of capacitor is very much nearer to the minimum possible loss of the system. There is a reduction of 31.50 kW (50.97%) in the active power loss when compared to the base case value. The optimal sizes of capacitors obtained using the algorithm is 300 and 150 kVAr. Bus number 4, 11, 6, 15 and 9 are the optimal locations for capacitor placement. (ii) Optimal Placement of Type-3 DG: Table 2 shows the optimum location, corresponding optimum size and total power loss with the corresponding size of the DG (Type-3). The minimum loss obtained after DG placement is 32.13 kW i.e., a reduction of 48.01% in the loss when compared to the base case loss of the system. Any further placement of DG will start to increase the losses and it is likely that it may overshoot the losses of the base case. Also notice that location of DG plays an important role in minimizing the losses. (iii) Optimal Placement of Capacitor and Type-3 DG: Above two cases presents the minimum possible loss that can be obtained after optimal placement of capacitor and DG (Type-3), individually. In this case capacitors and DGs are placed together to obtained further reduction in the losses. First optimal placement of the capacitors is done (as shown in Table 1) and then DGs are placed optimally to achieve further reduction in the loss (Table 3).2.29 kW is the minimum loss achieved after optimal placement of C & DG (Type-3). The active power loss is reduced by a staggering figure of 96.29%. It can be noticed from Fig. 4.1 that the bus voltage profile has improved significantly (above 0.99 p.u. at all the buses) when compared to base case voltages. (iv) Optimal Placement of Type-2 DG: The optimal power factor of DG (Type-2) for 15-Bus System is 0.7. From Table 5, it can be noticed that there is no reduction in loss; instead the loss has increased to 68.99 kW from its base case value of 61.80 kW. This is true for any size of DG. The reason is consumption of reactive power by the DG from the system. At 0.7 power factor, DG is consuming more reactive power from the system when compared to the active power injected by the DG. So it can be concluded that Type-2 DG is not suitable for smaller distribution system with lower power factor. (v) Optimal Placement of Capacitor and Type-2 DG: Here also first capacitors are placed and then optimal placement of DG is done. Table 6 shows the results of optimal placement of DG after the optimal capacitor placement. 18.73 kW is the minimum loss achieved after the optimal placement of C & DG (Type-2). There is a reduction of 69.69% in the active power loss. Better voltage profile is observed when compared to the base case. E. Case Study 2: 33-Bus System It is a radial distribution system, with the total load of 3715 kW and 2300 kVAr, having 33 buses and 32 branches. All the buses are load buses except first bus as slack bus. 210.75 kW is the base case active power loss of the system. Table 7: Reactive Power Consumed by various sizes of DGs at 0.85 p.f.
  • 5. 5 International Journal for Modern Trends in Science and Technology Volume: 2 | Issue: 09 | September 2016 | ISSN: 2455-3778IJMTST S.No. Real Power Injected by DG (Type-2) (kW) Reactive Power Consumed by DG (Type-2) (KVAr) KVA Rating of DG (Type-2) 1 1000 619.74 1176.47 2 500 309.87 588.235 3 300 185.92 352.94 4 200 123.95 235.29 5 100 61.97 117.647 Case Study 2 (A): Optimal Placement of Capacitor Table 8: Results of Optimal Capacitor Placement in 33-Bus System Case Study 2 (B): Optimal Placement of Type-3 DG Table 9: Results of Optimal Type-3 DG Placement in 33-Bus System S. No. Optimal DG Size (kW) Optimal Location (Bus No.) Minimum Power Loss after optimal placement of DG (kW) 1 1000 12 129.66 2 1000 30 88.57 3 500 25 77.95 4 300 24 75.28 5 200 21 74.26 6 200 4 73.57 7 100 23 73.36 8 100 7 73.24 9 100 22 73.15 10 100 2 73.13 Case Study 2 (C): Optimal Placement of Capacitor and Type-3 DG Table 10: Results of Optimal Placement of Capacitor and Type-3 DG in 33-Bus System S. No. Optimal DG Size (kW) Optimal Location (Bus No.) Minimum Power Loss after optimal placement of DG (kW) 1 1000 12 62.46 2 1000 30 24.24 3 500 25 13.74 4 500 24 10.58 5 100 22 9.92 6 100 21 9.57 7 100 5 9.30 8 100 4 9.17 9 100 20 Case Study 2 (D): Optimal Placement of Type-2 DG Table 11: Results of Optimal Placement of Type-2 DG in 33-Bus System S. No. Optimal DG Size (kW) Optimal Location (Bus No.) Minimum Power Loss after optimal placement of DG (kW) 1 500 12 186.28 2 500 24 179.94 3 300 31 176.32 4 100 21 175.92 5 100 25 175.84 Case Study 2 (E): Optimal Placement of Capacitor And Type-2 DG Table 12: Results of Optimal Placement of Capacitor and Type-2 DG in 33-Bus System S.No. Optimal DG Size (kW) Optimal Location (Bus No.) Minimum Power Loss after optimal placement of DG (kW) 1 1000 9 79.18 2 500 32 58.88 S. No. Optimal Capacitor Size (KVAr) Optimal Location (Bus No.) Minimum Power Loss after placing the Capacitors in turn (kW) 1 300 32 185.07 2 300 30 167.24 3 300 14 153.29 4 300 30 145.60 5 300 25 142.09 6 300 6 139.81 7 150 24 139.40 8 150 21 139.18 9 150 4 139.06
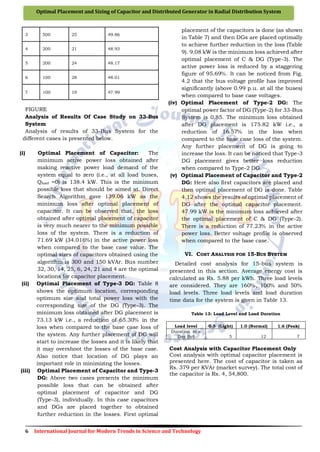
  • 6. 6 International Journal for Modern Trends in Science and Technology Optimal Placement and Sizing of Capacitor and Distributed Generator in Radial Distribution System 3 500 25 49.86 4 200 21 48.93 5 200 24 48.17 6 100 28 48.01 7 100 19 47.99 FIGURE Analysis of Results Of Case Study on 33-Bus System Analysis of results of 33-Bus System for the different cases is presented below. (i) Optimal Placement of Capacitor: The minimum active power loss obtained after making reactive power load demand of the system equal to zero (i.e., at all load buses, Qload =0) is 138.4 kW. This is the minimum possible loss that should be aimed at. Direct Search Algorithm gave 139.06 kW as the minimum loss after optimal placement of capacitor. It can be observed that, the loss obtained after optimal placement of capacitor is very much nearer to the minimum possible loss of the system. There is a reduction of 71.69 kW (34.016%) in the active power loss when compared to the base case value. The optimal sizes of capacitors obtained using the algorithm is 300 and 150 kVAr. Bus number 32, 30, 14, 25, 6, 24, 21 and 4 are the optimal locations for capacitor placement. (ii) Optimal Placement of Type-3 DG: Table 8 shows the optimum location, corresponding optimum size and total power loss with the corresponding size of the DG (Type-3). The minimum loss obtained after DG placement is 73.13 kW i.e., a reduction of 65.30% in the loss when compared to the base case loss of the system. Any further placement of DG will start to increase the losses and it is likely that it may overshoot the losses of the base case. Also notice that location of DG plays an important role in minimizing the losses. (iii) Optimal Placement of Capacitor and Type-3 DG: Above two cases presents the minimum possible loss that can be obtained after optimal placement of capacitor and DG (Type-3), individually. In this case capacitors and DGs are placed together to obtained further reduction in the losses. First optimal placement of the capacitors is done (as shown in Table 7) and then DGs are placed optimally to achieve further reduction in the loss (Table 9). 9.08 kW is the minimum loss achieved after optimal placement of C & DG (Type-3). The active power loss is reduced by a staggering figure of 95.69%. It can be noticed from Fig. 4.2 that the bus voltage profile has improved significantly (above 0.99 p.u. at all the buses) when compared to base case voltages. (iv) Optimal Placement of Type-2 DG: The optimal power factor of DG (Type-2) for 33-Bus System is 0.85. The minimum loss obtained after DG placement is 175.82 kW i.e., a reduction of 16.57% in the loss when compared to the base case loss of the system. Any further placement of DG is going to increase the loss. It can be noticed that Type-3 DG placement gives better loss reduction when compared to Type-2 DG. (v) Optimal Placement of Capacitor and Type-2 DG: Here also first capacitors are placed and then optimal placement of DG is done. Table 4.12 shows the results of optimal placement of DG after the optimal capacitor placement. 47.99 kW is the minimum loss achieved after the optimal placement of C & DG (Type-2). There is a reduction of 77.23% in the active power loss. Better voltage profile is observed when compared to the base case. VI. COST ANALYSIS FOR 15-BUS SYSTEM Detailed cost analysis for 15-bus system is presented in this section. Average energy cost is calculated as Rs. 5.88 per kWh. Three load levels are considered. They are 160%, 100% and 50% load levels. Three load levels and load duration time data for the system is given in Table 13. Table 13: Load Level and Load Duration Load level 0.5 (Light) 1.0 (Normal) 1.6 (Peak) Duration in a Day (hr) 5 12 7 Cost Analysis with Capacitor Placement Only Cost analysis with optimal capacitor placement is presented here. The cost of capacitor is taken as Rs. 379 per KVAr (market survey). The total cost of the capacitor is Rs. 4, 54,800.
  • 7. 7 International Journal for Modern Trends in Science and Technology Volume: 2 | Issue: 09 | September 2016 | ISSN: 2455-3778IJMTST Table 14: Comparison of results with and without Capacitor Placement Load Level Power Loss Before Capacitor Placement (kW) Power Loss after Capacitor Placemen t (kW) Energy Loss Cost before Capacitor Placement (Rs.) Energy Loss Cost after Capacitor Placement (Rs.) Light (0.5) 14.70 7.38 1,57,745.7 79,194.78 Nomi nal (1.0) 61.80 30.30 15,91,621.92 7,80,358.32 Peak (1.6) 168.91 93.71 25,37,602.494 14,07,842.814 Total Cost 42,86,970.114 22,67,395.914 Annual Net Saving = Rs. 24,74,374.2 Table 14 shows the power loss and annual energy loss cost for each loading condition. The annual net saving is obtained by subtracting total cost of capacitor and annual total energy loss cost after capacitor placement from annual total energy loss cost before capacitor placement. Cost Analysis for C & DG (Type-2) Placement Induction generator based Wind Energy System (Type-2 DG) is optimally placed together with switched capacitor. The total size of the DG and capacitor is 600 kW 1200 kVAr respectively. A comparison of results, with and without C & DG (Type-2) placement, is presented in table 15 for various loading condition. Table 15: Comparison of results with and without C & DG (Type-2) Placement Load Level Power Loss after C & DG ( Type-2) Placemen t (kW) Power Loss after C & DG ( Type-2) Placemen t (kW) Energy Loss Cost before C & DG (Type-2) Placement (Rs.) Energy Loss Cost after C & DG (Type-2) Placement (Rs.) Light (0.5) 14.70 4.14 1,57,745.7 44,426.34 Nominal (1.0) 61.80 18.73 15,91,621.92 4,82,379.912 Peak (1.6) 168.91 81.71 25,37,602.49 4 12,27,562.01 4 Total Energy Loss Cost (Annual ) 42,86,970.11 4 17,54,368.26 6 Calculation of Capital Return Calculation of capital return is done as below: • Energy Cost = Rs. 5.88/kWh • Cost of Capacitor = Rs. 379/KVAr • Total capital Cost of Wind Energy System (Type-2 DG) = Rs. 5.5 Cr/ MW • Energy Cost of Wind Energy System = Rs. 4/kWh • Total Cost of DG installation ( CDG ) = 0.6*5.5*10^7 = Rs.3,30,00,000 • Total Cost of Capacitor installation ( CCap ) = Rs. 4,54,800 Before C & DG placement, active power supplied from slack bus is 1288.2 kW and after C & DG placement is 1245.15 kW. Difference between these two quantities is 43.05 kW. The profit of this power release is calculated as follow: • Profit from the release of power (Annually) = 43.05*5.88*365*24 = Rs. 22,17,453.84 Now the total cost is calculated as follows: • Total Cost after C& DG placement = CDG + CCap + Annual Energy Loss Cost after C & DG (Type-2) placement - Profit from the release of power = Rs. 3,29,91,714.426 • Capital Return Period Years = Total Cost after C& DG placement Annual Energy Loss Cost before C & DG placement = 3, 29, 91,714.426 / 42, 86,970.114 = 7.69 Years So the capital cost can be recovered in approximately 8 years. After this period the utility will get a net saving of Rs. 25,32,601.85 annually. Cost Analysis for C & Dg (Type-3) Placement Solar photo voltaic system (Type-3 DG) is optimally placed together with switched capacitor. The total size of the DG and capacitor is 1200 kW 1200 kVAr respectively. A comparison of results, with and without C & DG (Type-3) placement, is presented in table 16 for various loading condition. Table 16: Comparison of results with and without C & DG (Type-3) Placement Load Level Power Loss after C & DG ( Type-3) Placeme nt (kW) Power Loss after C & DG ( Type-3) Placeme nt (kW) Energy Loss Cost before C & DG (Type-3) Placement (Rs.) Energy Loss Cost after C & DG (Type-3) Placement (Rs.) Light (0.5) 14.70 1.75 1,57,745.7 18,779.25 Nomin al (1.0) 61.80 2.29 15,91,621.9 2 58,977.576 Peak (1.6) 168.91 25.81 25,37,602.4 94 71,483.892 2 Total Energ y Loss Cost (Annu al) 42,86,970. 114 1,49,240.7 182
  • 8. 8 International Journal for Modern Trends in Science and Technology Optimal Placement and Sizing of Capacitor and Distributed Generator in Radial Distribution System Calculation of Capital Return Calculation of capital return is done as below: • Energy Cost = Rs. 5.88/kWh • Cost of Capacitor = Rs. 379/KVAr • Total capital Cost of Solar Photo Voltaic System = Rs. 7.97 Cr/ MW • Energy Cost of Solar Power = Rs. 6.49/kWh • Total Cost of DG installation ( CDG ) = 1.2 *7.97*10^7 = Rs. 9,56,40,000 • Total Cost of Capacitor installation ( CCap ) = Rs. 4,54,800 Before C & DG placement, active power supplied from slack bus is 1288.2 kW and after C & DG placement is 1228.69 kW. Difference between these two quantities is 59.51 kW. The profit of this power release is calculated as follow: • Profit from the release of power (Annually) = 59.51*5.88*365*24 = Rs. 30,65,288.68 Now the total cost is calculated as follows: • Total Cost after C& DG placement = CDG + CCap + Annual Energy Loss Cost after C & DG (Type-2) placement - Profit from the release of power = Rs. 9,31,78,752.0382 • Capital Return Period Years = Total Cost after C& DG placement Annual Energy Loss Cost before C & DG placement = 9,31,78,752.0382 / 42,86,970.114 = 21.75 Years So the capital cost can be recovered in approximately 22 years. Cost Analysis for 33-Bus System Cost Analysis with Capacitor Placement Only 2250 kVAr is the total size of capacitor used for loss reduction in the 33-bus system. The total cost of the capacitor came out to be Rs. 8,52,750. Table 5.5 shows the comparison between power loss and annual energy loss cost before and after placement of capacitor for all the given loading condition. An annual net saving of Rs. 41,81,119.176 is obtained. Table 17: Comparison of results with and without Capacitor Placement Load Level Power Loss Before Capacitor Placement (kW) Power Loss after Capacitor Placement (kW) Energy Loss Cost before Capacitor Placement (Rs.) Energy Loss Cost after Capacitor Placement (Rs.) Light (0.5) 48.76 32.77 5,23,243.56 3,51,654.8 7 Nominal (1.0) 210.75 139.06 54,27,739.8 35,81,406. 864 Peak (1.6) 602.12 401.37 90,45,889.608 60,29,942. 058 Total 1,49,96,872.968 99,63,003. Cost 792 Annual Net Saving = Rs. 41,81,119.176 Cost Analysis for C & DG (Type-2) Placement Induction generator based Wind Energy System (Type-2 DG) is optimally placed together with switched capacitor. The total size of the DG and capacitor is 2600 kW 2250 kVAr respectively. A comparison of results, with and without C & DG (Type-2) placement, is presented in table 18 for various loading condition. Table 18: Comparison of results with and without C & DG (Type-2) Placement Load Level Power Loss after C & DG ( Type-2) Placement (kW) Power Loss after C & DG ( Type-2) Placement (kW) Energy Loss Cost before C & DG (Type-2) Placement (Rs.) Energy Loss Cost after C & DG (Type-2) Placement (Rs.) Light (0.5) 14.70 4.14 1,57,745.7 44,426.34 Nominal (1.0) 61.80 18.73 15,91,621.92 4,82,379.912 Peak (1.6) 168.91 81.71 25,37,602.494 12,27,562.014 Total Energy Loss Cost (Annual) 42,86,970.114 17,54,368.266 Calculation of Capital Return Calculation of capital return is done as below: • Energy Cost = Rs. 5.88/kWh • Cost of Capacitor = Rs. 379/KVAr • Total capital Cost of Wind Energy System (Type-2 DG) = Rs. 5.5 Cr/ MW • Energy Cost of Wind Energy System = Rs. 4/kWh • Total Cost of DG installation ( CDG ) = 2.6*5.5*10^7 = Rs.14,30,00,000 • Total Cost of Capacitor installation ( CCap ) = Rs. 8,52,750 Before C & DG placement, active power supplied from slack bus is 3925.75 kW and after C & DG placement is 3762.99 kW. Difference between these two quantities is 162.76 kW. The profit of this power release is calculated as follow: • Profit from the release of power (Annually) = 162.76*5.88*365*24 = Rs. 83,83,572.288 Now the total cost is calculated as follows: • Total Cost after C& DG placement = CDG + CCap + Annual Energy Loss Cost after C & DG (Type-2) placement - Profit from the release of power = Rs. 14,06,19,735.78 • Capital Return Period Years = Total Cost after C& DG placement Annual Energy Loss Cost before C & DG placement
  • 9. 9 International Journal for Modern Trends in Science and Technology Volume: 2 | Issue: 09 | September 2016 | ISSN: 2455-3778IJMTST = 14,06,19,735.782 / 1,49,96,872.968 = 9.37 Years So the capital cost can be recovered in approximately 9.5 years. After this period the utility will get a net saving of Rs. 98,46,314.898 annually. Cost Analysis for C & DG (Type-3) Placement Solar photo voltaic system (Type-3 DG) is optimally placed together with switched capacitor. The total size of the DG and capacitor is 3500 kW 2250 kVAr respectively. A comparison of results, with and without C & DG (Type-3) placement, is presented in table 19 for various loading condition. Calculation of Capital Return Calculation of capital return is done as below: • Energy Cost = Rs. 5.88/kWh • Cost of Capacitor = Rs. 379/KVAr • Total capital Cost of Solar Photo Voltaic System = Rs. 7.97 Cr/ MW • Energy Cost of Solar Power = Rs. 6.49/kWh • Total Cost of DG installation ( CDG ) = 3.5*7.97*10^7 = Rs. 27,89,50,000 • Total Cost of Capacitor installation ( CCap ) = Rs. 8,52,750 Table 19: Comparison of results with and without C & DG (Type-3) Placement Load Level Power Loss after C & DG ( Type-3) Placement (kW) Power Loss after C & DG ( Type-3) Placement (kW) Energy Loss Cost before C & DG (Type-3) Placement (Rs.) Energy Loss Cost after C & DG (Type-3) Placemen t (Rs.) Light (0.5) 48.76 2.34 5,23,243.56 25,110.54 Nominal (1.0) 210.75 9.08 54,27,739.8 2,33,849. 952 Peak (1.6) 602.12 76.76 90,45,889.608 11,53,196 .184 Total Energy Loss Cost (Annual) 1,49,96,872.968 14,12,156 .676 Before C & DG placement, active power supplied from slack bus is 3925.75 kW and after C & DG placement is 3724.08 kW. Difference between these two quantities is 201.67 kW. The profit of this power release is calculated as follow: • Profit from the release of power (Annually) = 201.67*5.88*365*24 = Rs. 1,03,87,779.7 Now the total cost is calculated as follows: • Total Cost after C& DG placement = CDG + CCap + Annual Energy Loss Cost after C & DG (Type-2) placement - Profit from the release of power = Rs. 27,08,27,126.976 • Capital Return Period Years = Total Cost after C& DG placement Annual Energy Loss Cost before C & DG placement = 27,08,27,126.976 / 1,49,96,872.968 = 18.05 Years So the capital cost can be recovered in approximately 18 years. Cost Analysis Limitations Following are the limitation of cost analysis presented in this dissertation work: 1. Cost function is not included in the objective function while determining the optimal size of capacitor and DG. The main objective is to minimize the loss without considering the cost. 2. Cost analysis is done only on the basis of loss reduction. Other monetary benefits obtained by installation of DGs are not included. 3. Urban feeder with only domestic, industrial and commercial load is considered in this work. Hence the energy cost is calculated by taking average of per unit cost of above three loads. VII. CONCLUSION In this work, Direct Search Algorithm is implemented to determine the optimal sizes of Capacitors and DGs along with their optimal locations for loss reduction in the Radial Distribution Systems. Switched Capacitor, Type-2 and Type-3 DGs are considered for loss reduction. Case studies are carried out on three standard test systems: 15-bus system, 33-Bus System and 69-Bus System. It is observed that there is a highest reduction in the real power loss along with improvement in the voltage profile of the distribution systems when both Capacitors and DGs are used. Type-3 DG gives much reduction in loss compared to Type-2 DG, individually or along with Capacitor placement. With respect to base case power loss, there is a reduction of 96.29%, 95.69% and 96.76% in the power loss for 15-Bus System, 33-Bus System and 69-Bus System
  • 10. 10 International Journal for Modern Trends in Science and Technology Optimal Placement and Sizing of Capacitor and Distributed Generator in Radial Distribution System respectively after placing Capacitors and Type-3 DGs and a reduction of 69.69%, 77.23% and 82.50% respectively with Capacitors and Type-2 DGs. Cost analysis of Capacitor and DG Placement is done for all the three standard test systems. Net saving is obtained when only capacitors are used for loss reduction. Because of high initial cost of installation, capital return period for Type-3 DG is more when compared to Type-2 DG. Hence it is concluded that loss reduction is achieved either through Capacitor or DG placement but highest reduction is obtained by combination of both. REFERENCES [1] M. Ramalinga Raju, K.V.S. Ramachandra Murthy, K. Ravindra, “Direct search algorithm for capacitive compensation in radial distribution systems”, Elsevier, Electrical Power and Energy Systems, Vol. 42, pp.24–30, May 2012. [2] M.H.Haque, “Capacitor placement in radial distribution systems for loss reduction”, IEEE Proc. - Gener. Transm. Distrib.,Vol. 146, No. 5, pp. 501-505, September 1999 . [3] Jen-Hao Teng, “A Network-Topology-based Three-Phase Load Flow for Distribution Systems”, Proc. Natl. Sci. Counc. ROC (A), Vol. 24, pp. 259-264, April 2000. [4] Naresh Acharya, Pukar Mahat, N. Mithulananthan, “An analytical approach for DG allocation in primary distribution network”, Elsevier, Electrical Power and Energy Systems, Vol. 28, pp.669-678, May 2006. [5] K. Prakash, Member, IEEE, and M. Sydulu, “Particle Swarm Optimization Based Capacitor Placement on Radial Distribution Systems”, IEEE Conference- 2007. [6] T.S.Abdel-Salam, Student Member K Y.Chikhani, Senior Member R.HACKAM, Fellow, “A New Technique for Loss Reduction using Compensating Capacitors Applied to distribution Systems with varying Load Condition”, IEEE Transactions on Power Delivery, Vol. 9, No. 2, pp. 819-827, April 1994. [7] Ivo Chaves da Silva, Jr., Sandoval Carneiro, Jr., Edimar José de Oliveira, Jeferson de Souza Costa, José Luiz Rezende Pereira, Member, IEEE, and Paulo Augusto Nepomuceno Garcia, “A Heuristic Constructive Algorithm for Capacitor Placement on Distribution Systems”, IEEE Transactions on Power Systems, Vol. 23, No. 4, pp. 1619-1626, November 2008. [8] M. Ettehadi, Student Member, IEEE, H.Ghasemi, Senior Member, IEEE, and S. Vaez-Zadeh, Senior Member, IEEE, “Voltage Stability-Based DG Placement in Distribution Networks”,IEEE Transactions on Power Delivery, Vol. 28, No. 1, pp. 171-178, January 2013. [9] Caisheng Wang, Student Member, IEEE, and M. Hashem Nehrir, Senior Member, IEEE, “Analytical Approaches for Optimal Placement of Distributed Generation Sources in Power Systems”, IEEE Transactions on Power Systems, Vol. 19, No. 4, pp. 2068-2076, November 2004. [10]Dan Zhu, Robert P. Broadwater, Member, IEEE, Kwa-Sur Tam, Senior Member, IEEE, Rich Seguin, Member, IEEE, and Haukur Asgeirsson, Member, IEEE, “Impact of DG Placement on Reliability and Efficiency with Time-Varying Loads”, IEEE Transactions on Power Systems, Vol. 21, No. 1, pp. 419-427, February 2006. [11]Hasan Hedayati, S. A. Nabaviniaki, and Adel Akbarimajd, “A Method for Placement of DG Units in Distribution Networks”, IEEE Transactions on Power Delivery, Vol. 23, No. 3, pp. 1620-1628, July 2008.