SlideShare a Scribd company logo
1
Hands-on Lab: How to Unleash Your Storage
Performance by Using NVM Express™ Based
PCI Express® Solid-State Drives
Andrey Kudryavtsev – SSD Solution Architect, Intel Corporation
Zhdan Bybin – Application Engineer, Intel Corporation
SSDL001
2
Agenda
• What is NVM Express™ (NVMe) ?
• How do I know my NVM Express drive is working?
• How do I measure performance of my NVM Express drive?
• Wow! I have 2 NVMe drives in my system! Now how do I RAID those?
• How can I monitor NVMe performance and debug application
performance issues?
• Alright, I will get a NVM Express drive. How can I make sure it will have
enough endurance?
• Bonus: How to over-provision the drive?
• Bonus #2: I only use Windows®! Which tool to use in this OS?
3
What is the name of new exciting memory
technology which Intel® and Micron® have recently
introduced?
• 1) 4D MegaNAND™
• 2) 3D Crossbow™
• 3) 3D XPoint™
4
What is NVM Express™ (NVMe)?
5
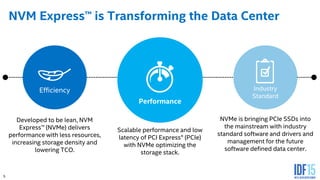
NVM Express™ is Transforming the Data Center
Efficiency Industry
Standard
Performance
Developed to be lean, NVM
Express™ (NVMe) delivers
performance with less resources,
increasing storage density and
lowering TCO.
Scalable performance and low
latency of PCI Express® (PCIe)
with NVMe optimizing the
storage stack.
NVMe is bringing PCIe SSDs into
the mainstream with industry
standard software and drivers and
management for the future
software defined data center.
6
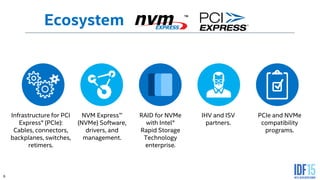
Ecosystem
Infrastructure for PCI
Express® (PCIe):
Cables, connectors,
backplanes, switches,
retimers.
NVM Express™
(NVMe) Software,
drivers, and
management.
RAID for NVMe
with Intel®
Rapid Storage
Technology
enterprise.
IHV and ISV
partners.
PCIe and NVMe
compatibility
programs.
TM
7
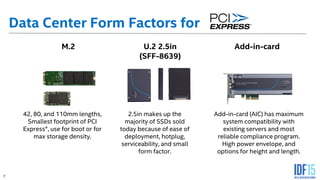
Data Center Form Factors for
42, 80, and 110mm lengths,
Smallest footprint of PCI
Express®, use for boot or for
max storage density.
2.5in makes up the
majority of SSDs sold
today because of ease of
deployment, hotplug,
serviceability, and small
form factor.
M.2 Add-in-cardU.2 2.5in
(SFF-8639)
Add-in-card (AIC) has maximum
system compatibility with
existing servers and most
reliable compliance program.
High power envelope, and
options for height and length.
8
How do I Know My NVM Express™ Drive is Working?
9
NVM Express™
Driver Ecosystem
Native / in-box
6.5 | 7.0
SLES 11 SP3
SLES 12
Install NVMe driver
ESXi 5.5
13 | 14
Windows 8.1
Linux* NVMe Express™ (NVMe) driver is
open source
10
1. Check if Intel PCI Express® SSD is listed among devices:
a) ‘lspci -nn | grep 0953’ or ‘lspci | grep memory’
2. Check if driver is loaded and which version it is:
b) ‘lsmod | grep nvme’
c) ‘modinfo nvme’
3. Check if controller and
namespaces are visible in
devices list:
c) ‘ls /dev/nvm*’
Controller: nvmeX ;
Namespaces: nvmeXnY
I Do Not See the Drive in the System!
Step 1: First Simple Failure Analysis Steps
Log in: root
Password: password
11
Step 2: Check LEDs
LED Placement & Functionality
• Four LED indicators are available on the AIC, visible through the IO bracket
• The LEDs will indicate:
- Drive activity (yellow, blink rate proportional to workload)
- Drive failed (red)
- Drive operating in a defective state (yellow)
 Tied to critical warnings in NVM Express™ Health Log:
1. Available spare memory has fallen below specified threshold
2. Temperature has exceeded critical temperature
3. Reliability of the device has degraded
4. Volatile memory backup circuit test has failed
5. Device has become read-only
- Drive healthy (green)
From top to bottom:
LED1. Activity (yellow)
LED 2. Failed (red)
LED 3. Defect (yellow)
LED 4. Healthy (green)
1
2
3
4
2.5” SFF (U.2) - Pin 11 Activity Functionality
1. When idle or no IO activity, logic level on this pin is low (LED ON)
2. When there is IO activity, pin puts out a 250ms High, 250ms low signal
3. When drive is formatting, pin toggles at 250ms High, 250ms low signal
12
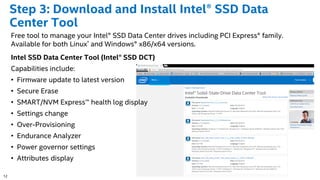
Step 3: Download and Install Intel® SSD Data
Center Tool
Free tool to manage your Intel® SSD Data Center drives including PCI Express® family.
Available for both Linux* and Windows® x86/x64 versions.
Intel SSD Data Center Tool (Intel® SSD DCT)
Capabilities include:
• Firmware update to latest version
• Secure Erase
• SMART/NVM Express™ health log display
• Settings change
• Over-Provisioning
• Endurance Analyzer
• Power governor settings
• Attributes display
13
Step 4: Check Device Status with Intel® SSD Data
Center Tool
Show all supported Intel® SSDs in the system:
isdct show -intelssd
Check attributes available for your NVM Express™ (NVMe) based SSD
# isdct show -all -intelssd
Check NVMe Health Log (SMART)
# isdct show -sensor -intelssd 1
Start endurance analyzer (reset Timed Workload Indicator counters)
# isdct set –intelssd 1 EnduranceAnalyzer=reset
14
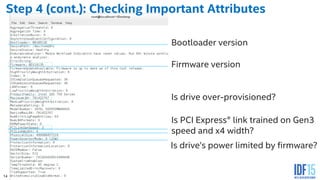
Step 4 (cont.): Checking Important Attributes
Bootloader version
Firmware version
Is drive over-provisioned?
Is PCI Express® link trained on Gen3
speed and x4 width?
Is drive’s power limited by firmware?
15
How do I Measure Performance of My
NVM Express™ Drive?
16
Solid-State Storage Drive States
Drive states
• Fresh out of box
- All space on the drive is free and has not been written to
- A Secure Erase will return a drive to FOB
- SSDs will perform best in FOB since new data being written goes into next available
free space
• Transition
- Amount of time in transition state is dependent on available free space and write
history, previous workloads (pre-conditioning), and current workload pattern
• Steady State
- Desired state to properly measure and report solid state storage performance! This is
typically worst case performance which is important for the data center.
16
17
Methodology
• Drive Prep Process
- A basic method would be to secure erase and sequentially write the entire drive. Steady State is
achieved much faster as opposed to writing 4K random data to an empty drive, and the transition
stage would look different.
• Testing Order
- The order you run tests can heavily influence the final results. For example reading sequentially over
random written data can drop performance. The impact will be different depending on what SSD is
being tested.
• Test Time / Average Time
- Depending on the architecture random writes (or writes in general) can take much longer to reach
stability than other results
• Test Span
- A full drive test will generally perform worse than a test over a small region. Most SSDs use unwritten
LBAs as spare area until they are written to. Intel® SSD Data Center Series are tested on 100% LBA
span.
17
18
Solid-State Storage Performance
FOB
Transition
Steady State
Typical test flow
1) Purge Device: Secure
Erase to return drive to
FOB.
2) Run workload independent
preconditioning: Full span
sequential write.
3) Run test: 4k random write,
Queue Depth 32, span
100%.
4) Record results: Measure
during steady state only!
Be sure to include
information about test
system hardware, software,
and device under test.
IOPS over Time
19
Storage Performance Metrics
• Bandwidth (Often MBps)
- This is commonly measured in megabytes per second. Calculated by the IOPS multiplied by the
block size. Bound by the storage interface (example: 6Gbps SATA* max theoretical throughput is
600MBps).
• IOPS, Input Output operations Per Second
- The number of I/O packets that can be transferred per sec; packet sizes can range from 512B to 4MB.
IOPS data over time you can really start to paint a picture of what is happening on the drive.
Traditionally you would focus on a single average number, but enterprise workloads demand strict
stability requirements as well. A new focus is comparing the mean to min on a per second basis
(performance consistency).
• Latency/QoS (Quality of Service)
- Latency is in many way related to IOPS. Each command sent takes a period of time to service and
return (latency, sometimes called the service time). QoS focuses on the worst outliers in latency over
a period of time. In general this is most important for enterprise applications but is applicable to
client in extreme cases (a drive timeout is in many ways just a really bad QoS event).
There is no such thing as too much detail in a system report
20
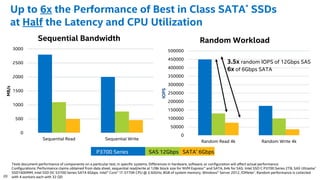
0
500
1000
1500
2000
2500
3000
Sequential Read Sequential Write
MB/s
Sequential Bandwidth
0
50000
100000
150000
200000
250000
300000
350000
400000
450000
500000
Random Read 4k Random Write 4k
IOPS
Random Workload
P3700 Series SAS 12Gbps SATA* 6Gbps
3.5x random IOPS of 12Gbps SAS
6x of 6Gbps SATA
Tests document performance of components on a particular test, in specific systems. Differences in hardware, software, or configuration will affect actual performance.
Configurations: Performance claims obtained from data sheet, sequential read/write at 128k block size for NVM Express™ and SATA, 64k for SAS. Intel SSD C P3700 Series 2TB, SAS Ultrastar*
SSD1600MM, Intel SSD DC S3700 Series SATA 6Gbps. Intel® Core™ i7-3770K CPU @ 3.50GHz, 8GB of system memory, Windows® Server 2012, IOMeter*. Random performance is collected
with 4 workers each with 32 QD
Up to 6x the Performance of Best in Class SATA* SSDs
at Half the Latency and CPU Utilization
21
FIO
• FIO is an open-source, flexible IO
measuring tool which supports
multiple threads, various queue depths
and many other parameters
• FIO is an industry standard tool for
measuring storage performance in
Linux*
• There are 3 ways to run FIO:
- script file (.4krr.sh)
- job/ini file (fio 4krr.ini)
- old school command line
(fio --name=test1 --filename=/x –-size=10G --
ioengine=libaio --direct=1 –numjobs=1……. )
Block size
Workload type
Queue depth
Number of queues
Drive span
Not utilizing DRAM for
random LBA addresses map
Enable direct access
22
Examples of FIO ini Files for Sequential and Random
Workloads
[global]
name=Random_Read_test1
filename=/dev/nvme0n1
ioengine=libaio
direct=1
bs=4k
rw=randread
iodepth=32
numjobs=8
buffered=0
size=100%
runtime=60
time_based
randrepeat=0
Norandommap
refill_buffers
Optimal Queue_Depth * Number_of_queues for Intel® NVM Express™ drives = 128.
For best random performance create Number_of_queues = Number_of_logical_cores with total QD=128
(8 queues each QD=16, 32 queues each QD=4, etc)
For best sequential performance create 1 Queue (thread) with QD=128
[global]
name=Seq_Write_test2
filename=/dev/nvme0n1
ioengine=libaio
direct=1
bs=128k
rw=write
iodepth=128
numjobs=1
buffered=0
size=100%
runtime=60
time_based
randrepeat=0
Norandommap
refill_buffers
Random Sequential
23
Linux* Performance Testing of a Single NVM Express™ Drive
Exercise: Open 2 terminal windows
• # fio /idf/4krr.ini in 1st terminal window
• # iostat –c –d –x –t –m /dev/nvme0n1 1 in 2nd terminal window (this will show CPU usage)
Step 5: Measure performance using FIO, iostat and performance counters
Latency statistics
Latency percentiles
Queue Depth percentiles
Drive IO statistics
IO statistics
24
Wow! I have 2 NVM Express™ Drives in My
System! Now How do I RAID Those?
25
0
20
40
60
80
100
120
4 x SAS SSDs 4 x NVMe U.2 SSDs
3x faster than a RAID Card in RAID 5
Intel® Rapid Storage Technology
for Enterprise (Intel® RSTe)
NVM Express™ (NVMe) SSDs
directly connected to processor
NVMe SSDs using
RSTe on CPU
SAS SSDs using
RAID Card
IOPs (K)
Test configuration- Intel GZ2600 Server, dual socket Intel® Xeon® E5-2699 v3, 32GB DDR4 RAM, Hardware RAID controller. Operating System: Microsoft Windows Server 2012 R2. Configuration 1- 12G SAS . 4ea (
Seagate* 1200 SSD ST800FM0043 SSDs-800GB in RAID5 (LSI MegaRAID SAS-3 3108 Controller). Configuration 2 – NVMe-RSTe 4ea (Intel® DC P3700 800GB SSD) in RAID5 array. Intel RSTe 4.3 BETA software. Tests
document performance of components on a particular test, in specific systems. Differences in hardware, software, or configuration will affect actual performance.
NVM Express™ RAID with Intel® Rapid Storage
Technology for Enterprise
26
Step 6: Create an Intel® RSTe RAID Volume
The lab system already has latest version of mdadm included in the Linux* kernel and
Intel® Matrix Storage Manager software option can be used
1. Create a container:
# mdadm -C /dev/md/imsm /dev/nvme0n1 /dev/nvme1n1 –n 2 –e imsm -f
2. Create a RAID 0 volume within the container:
# mdadm -C /dev/md0 /dev/md/imsm –n 2 –l 0 –c 128 -f
3. Create a partition on RAID 0 volume:
# parted /dev/md0 mklabel gpt
# parted /dev/md0 mkpart primary 2097152B 100%
4. Create an xfs filesystem on the RAID volume:
# mkfs.xfs -K /dev/md0p1 -f
# is the root shell prompt and not part of the command. Also all commands must be run as root (administrator).
Intel® Rapid Storage Technology enterprise (Intel® RSTe)
27
Step 7: Create and Mount Partition
27
5. Verify partition creation
# parted /dev/md0 print
6. Mount the file system on the RAID volume:
# mkdir /mnt/myraid/
# mount -o noatime,nodiratime,nobarrier /dev/md0p1 /mnt/myraid
noatime - not recording last file
access time
nodirtime - not recording last directory
access time
nobarrier - no flush cache commands
7. Show the container and RAID volume
# cat /proc/mdstat
Intel® Rapid Storage Technology enterprise (Intel® RSTe)
28
Linux* Performance Testing of RSTe RAID’d drive
• Measuring performance with ‘fio’ over file system
# fio /idf/md4krr.ini
Please note that FIO will create test files under the directory specified here:
“Directory=/mnt/myraid”
Number of files will match number of jobs for this ini file
• Alternate way for creating test files – using ‘dd’ on a test partition with file system
# dd if=/dev/zero of=/mnt/myraid/testfile bs=1M count=16384
Step 8: Measure performance of NVMe RAID volume
29
How Can I Monitor NVM Express™
Performance and Debug Application
Performance Issues ?
30
FIO Visualizer Tool
Unique features include:
• Single GUI for FIO tool, de facto standard
benchmark tool for Linux*
• Real time. The data gathers by assigned
time intervals and immediately displays
on graphs.
• Monitors IOPS, bandwidth, latency for
reads and writes
• Customizable layout. User defines which
parameter needs to be monitored.
• Multithread / multi jobs support makes a
value for NVM Express™ SSD
benchmarking
• Workload manager for FIO settings.
Comes with base workload settings used
in all Intel® SSD datasheets.
31
Step 9: Measure Performance Using FIO
Visualizer and ioprof
• For this step we will be using pre-defined
ini file /idf/8kmix.ini which represents
semi-random customer workload with
following parameters:
- mix of reads and writes
- 8KB access
- addition of random block every 8
consecutive blocks
- QD=8
- 4 threads on 2 GB disk span each:
32
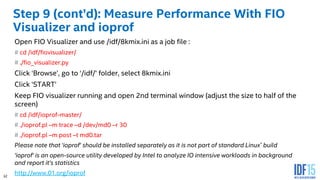
Step 9 (cont’d): Measure Performance With FIO
Visualizer and ioprof
Open FIO Visualizer and use /idf/8kmix.ini as a job file :
# cd /idf/fiovisualizer/
# ./fio_visualizer.py
Click ‘Browse’, go to ‘/idf/’ folder, select 8kmix.ini
Click ‘START’
Keep FIO visualizer running and open 2nd terminal window (adjust the size to half of the
screen)
# cd /idf/ioprof-master/
# ./ioprof.pl –m trace –d /dev/md0 –r 30
# ./ioprof.pl –m post –t md0.tar
Please note that ‘ioprof’ should be installed separately as it is not part of standard Linux* build
‘ioprof’ is an open-source utility developed by Intel to analyze IO intensive workloads in background
and report it’s statistics
http://www.01.org/ioprof
33
Real-Time Monitoring of NVM Express™ Queues
• It is possible to monitor IO utilization on the RAID level and device level via iostat,
which is a standard Linux* tool for any block device
• Starting with kernel 3.19 NVM Express™ (NVMe) driver reporting has been
expanded. This includes performance counters under
/sys/block/<nvmeXnY>/mq
• Performance counters provide detailed information per NVMe queue
md0
nvme0n1 nvme1n1
RAID level
NVMe device
Queues
/sys/block/<nvmeXnY>/mq
iostat
iostat
34
Step 10: Real-time Monitoring of NVM Express™ Queues
• Open new terminal window and run the command:
# cat /sys/block/nvme0n1/mq/X/tags (where X = queue number)
In this case:
nr_tags - nr_free = 21 → Represents number of submitted IO’s waiting in the
submission queue 0
Please note that the number of queue pairs in NVM Express™ driver is equal to
number of logical CPU cores in the system but cannot exceed 31.
35
Step 11: Analyzing ioprof Results
IO distribution by block
size and R/W type
IO “Heat” map
36
Intel® Cache Acceleration Software: Accelerate Your Data Center
Primary Storage
SAN, NAS
Network
FC, iSCSI
Intel CAS copies hot data from back-end storage
or local HDD storage to the compute node
Intel® CAS Accelerates Existing Applications by Addressing Storage I/O Bottlenecks
Without Application or Storage Modifications
Usage Model
Intel® Cache Acceleration Software
(Intel® CAS) within a Compute Node
Features Benefits
Ease of Use • Installed & Configured in <10min
• Application acceleration with no modification to the
application or storage back-end
Performance Intel CAS & Intel® SSD Delivers Gains vs HDD Solution up
to:
• 1400X IOPS1, 57X OLAP2, 3X OLTP2
• 5X the Database Transaction throughput
• 30X the Virtualization I/O throughput
• 12X the Microsoft Exchange* Throughput
Flexible &
Tuning
• Several Caching policies and options
- Warm cache (pinning) for proactive caching
- File/block based caching w/ selective policies
- Mapping to SSD or System Memory
• Broad OS Support (Linux* & Windows®)
• Virtualization Support (VM, XEN*, KVM, Microsoft*)
• Operates on any SSD, optimized for Intel SSD DC
Robust
Solution
• Intel validated and optimized for Intel SSDs
Intel CAS Features & Benefits
1.Configuration used: Intel® Server model 2600GZ (codename Grizzly Pass); Dual Intel® E5-2680 processor (2.7GHz), 32GB memory; Seagate* ST1000NC000 SATA HDD Microsoft Windows 2012R2 SP1, Intel SSD DC
P3700 -800GB, Intel® CAS 2.6 release, L2 cache on ; IOmeter 10.22.2009 ; 4K Random Read test; 8-queue depth x 8 workers 2. Configuration used: Intel® Server model 2600GZ (codename Grizzly Pass); Dual Intel Xeon
E5-2680 processor (2.7GHz), 96GB DDR3, VMware* 5.5, Intel® SSD DC P3700 -800GB, Intel® CAS 2.6,, L2 cache off, 8xSeagate 146GB SAS In RAID5,VMs: Microsoft Server 2008R2, 8GB, 2 Cores, IOMeter workloads:
Media Player ,Exchange Server, Web Server, 4K OLTP using QD4.1 Worker
DAS (JBOD)
37
Intel® Cache Acceleration Software Publicly Available
Information
Download & Start an Evaluation Today!
Software Downloads:
• Intel® I/O Assessment Tool – How Intel® Cache
Acceleration Software (Intel® CAS) can benefit you
• 30-Day Trial Software - Try Before You Buy¹
• Click through to purchase
• Overview Videos & Documents:
• Intel Caching Explained Animation
• Introduction to Intel CAS
• Intel CAS Product Brief
• Intel CAS Solution Brief
Case Studies and Briefs:
• Accelerating Business Analytics with Intel
CAS and Intel® Solid-State Drives
• Accelerating Analysis and Simulation with
Intel CAS and Intel Solid-State Drives
• Accelerating MySQL* Database Performance
with Intel CAS and Intel Solid-State Drives
• 3rd Party Performance Analysis Case Studies
• & more coming!
37
Publicly Available Resources Intel.com: www.intel.com/cas
Contact Intel Authorized Distributors and Resellers for current promotional programs
*Other names and brands may be claimed as the property of others
¹Please see additional information at: intel.com/cas
38
Step 12: Deleting RAID Configuration
• Un-mounting the drive
# umount /mnt/myraid
• Stopping RAID
# mdadm --stop /dev/md0
# mdadm --stop /dev/md/imsm
• Deleting meta-data
# mdadm --zero-superblock /dev/nvme0n1
# mdadm --zero-superblock /dev/nvme1n1
39
Alright, I Will get an NVM Express™ Drive.
How can I Make Sure it Will Have Enough
Endurance?
40
Step 13: Calculating Endurance of an Intel® SSD
In the beginning of the lab we reset Timed Workload SMART attributes by using following
command:
# isdct set –intelssd 1 EnduranceAnalyzer=reset
To check Endurance Analyzer result, issue following command:
# isdct show –a –intelssd 0
Look for “EnduranceAnalyzer”
Please note that in order for calculation to be valid, after reset workload should be
applied minimum for 60 min and so media would wear out for at least 0.01%
Intel Data-Center SSD Endurance is
calculated for workload specified in
JESD-219 standard: 100% write, 100%
drive span, 100% random, mixed
blocks size with 67% being 4KB
41
Bonus: How to Over-provision the Drive?
42
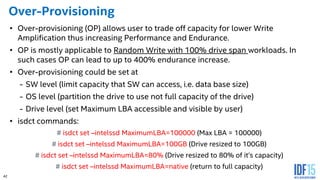
Over-Provisioning
• Over-provisioning (OP) allows user to trade off capacity for lower Write
Amplification thus increasing Performance and Endurance.
• OP is mostly applicable to Random Write with 100% drive span workloads. In
such cases OP can lead to up to 400% endurance increase.
• Over-provisioning could be set at
- SW level (limit capacity that SW can access, i.e. data base size)
- OS level (partition the drive to use not full capacity of the drive)
- Drive level (set Maximum LBA accessible and visible by user)
• isdct commands:
# isdct set –intelssd MaximumLBA=100000 (Max LBA = 100000)
# isdct set –intelssd MaximumLBA=100GB (Drive resized to 100GB)
# isdct set –intelssd MaximumLBA=80% (Drive resized to 80% of it’s capacity)
# isdct set –intelssd MaximumLBA=native (return to full capacity)
43
Bonus #2: I only use Windows*! Which tool
to use in this OS?
44
Testing with IOmeter* 1.1
NEW Features (in ver. 1.1)
• Record last update results to file
- Latency buckets collected
- Frequency dropdown menu
• Transfer size aligned patterns added
• Added option to align transfers to the
request size boundary
• Allows changing data pattern
- Compressible (Repeating Bytes)
- Partially-compressible
(Pseudo-Random)
- Incompressible (Full Random)
• Transfer size aligned patterns added
• Added option to align transfers to the
request size boundary
45
46
Additional Sources of Information
• A PDF of this presentation is available from our Technical Session
Catalog: www.intel.com/idfsessionsSF. This URL is also printed on the
top of Session Agenda Pages in the Pocket Guide.
• Demos in the showcase – Intel® Solid State Drive Pavilion
• Additional info in the Intel SSD Pavilion
• More web based info: www.intel.com/ssd
47
Other Technical Sessions
Session ID Title Day Time Room
SSDL001/R
Hands-on Lab: How to Unleash Your Storage Performance by Using NVM
Express* based PCI Express* Solid-State Drives
Wed 1:15; 4:00 2010
SSDC001
Tech Chat: Benchmarking Data Center Solid-State Drives – Insights Into
Industry-Leading NVM Express* SSD Performance Metrics
Thurs 9:30 Thurs
Tech Chat
Station 1
SSDC002
Tech Chat: Insights into Intel® Solid-State Drives Data Retention and
Endurance
Thurs 9:30 Thurs
Tech Chat
Station 2
SSDC003
Tech Chat: NVM Express* Features for High Availability and Storage Eco-
System
Wed and
Thurs
10:30 Wed
9:30 Thurs
Tech Chat
Station 3
SSDS004 The Future of Storage Security Thurs 1:00 2006
SSDS005
New Software Capabilities and Experiences Through Innovation in Storage
Architecture
Thurs 2:15 2006
48
Legal Notices and Disclaimers
Intel technologies’ features and benefits depend on system configuration and may require enabled hardware, software or service activation. Learn more at intel.com,
or from the OEM or retailer.
No computer system can be absolutely secure.
Tests document performance of components on a particular test, in specific systems. Differences in hardware, software, or configuration will affect actual
performance. Consult other sources of information to evaluate performance as you consider your purchase. For more complete information about performance and
benchmark results, visit http://www.intel.com/performance.
Cost reduction scenarios described are intended as examples of how a given Intel-based product, in the specified circumstances and configurations, may affect future
costs and provide cost savings. Circumstances will vary. Intel does not guarantee any costs or cost reduction.
This document contains information on products, services and/or processes in development. All information provided here is subject to change without notice.
Contact your Intel representative to obtain the latest forecast, schedule, specifications and roadmaps.
Statements in this document that refer to Intel’s plans and expectations for the quarter, the year, and the future, are forward-looking statements that involve a
number of risks and uncertainties. A detailed discussion of the factors that could affect Intel’s results and plans is included in Intel’s SEC filings, including the annual
report on Form 10-K.
The products described may contain design defects or errors known as errata which may cause the product to deviate from published specifications. Current
characterized errata are available on request.
No license (express or implied, by estoppel or otherwise) to any intellectual property rights is granted by this document.
Intel does not control or audit third-party benchmark data or the web sites referenced in this document. You should visit the referenced web site and confirm whether
referenced data are accurate.
Intel, Core, Xeon, and the Intel logo are trademarks of Intel Corporation in the United States and other countries.
*Other names and brands may be claimed as the property of others.
© 2015 Intel Corporation.
49
Risk FactorsThe above statements and any others in this document that refer to plans and expectations for the second quarter, the year and the future are forward-
looking statements that involve a number of risks and uncertainties. Words such as "anticipates," "expects," "intends," "plans," "believes," "seeks,"
"estimates," "may," "will," "should" and their variations identify forward-looking statements. Statements that refer to or are based on projections, uncertain
events or assumptions also identify forward-looking statements. Many factors could affect Intel's actual results, and variances from Intel's current
expectations regarding such factors could cause actual results to differ materially from those expressed in these forward-looking statements. Intel
presently considers the following to be important factors that could cause actual results to differ materially from the company's expectations. Demand for
Intel's products is highly variable and could differ from expectations due to factors including changes in business and economic conditions; consumer
confidence or income levels; the introduction, availability and market acceptance of Intel's products, products used together with Intel products and
competitors' products; competitive and pricing pressures, including actions taken by competitors; supply constraints and other disruptions affecting
customers; changes in customer order patterns including order cancellations; and changes in the level of inventory at customers. Intel's gross margin
percentage could vary significantly from expectations based on capacity utilization; variations in inventory valuation, including variations related to the
timing of qualifying products for sale; changes in revenue levels; segment product mix; the timing and execution of the manufacturing ramp and associated
costs; excess or obsolete inventory; changes in unit costs; defects or disruptions in the supply of materials or resources; and product manufacturing
quality/yields. Variations in gross margin may also be caused by the timing of Intel product introductions and related expenses, including marketing
expenses, and Intel's ability to respond quickly to technological developments and to introduce new products or incorporate new features into existing
products, which may result in restructuring and asset impairment charges. Intel's results could be affected by adverse economic, social, political and
physical/infrastructure conditions in countries where Intel, its customers or its suppliers operate, including military conflict and other security risks, natural
disasters, infrastructure disruptions, health concerns and fluctuations in currency exchange rates. Results may also be affected by the formal or informal
imposition by countries of new or revised export and/or import and doing-business regulations, which could be changed without prior notice. Intel
operates in highly competitive industries and its operations have high costs that are either fixed or difficult to reduce in the short term. The amount, timing
and execution of Intel's stock repurchase program could be affected by changes in Intel's priorities for the use of cash, such as operational spending,
capital spending, acquisitions, and as a result of changes to Intel's cash flows or changes in tax laws. Product defects or errata (deviations from published
specifications) may adversely impact our expenses, revenues and reputation. Intel's results could be affected by litigation or regulatory matters involving
intellectual property, stockholder, consumer, antitrust, disclosure and other issues. An unfavorable ruling could include monetary damages or an
injunction prohibiting Intel from manufacturing or selling one or more products, precluding particular business practices, impacting Intel's ability to design
its products, or requiring other remedies such as compulsory licensing of intellectual property. Intel's results may be affected by the timing of closing of
acquisitions, divestitures and other significant transactions. A detailed discussion of these and other factors that could affect Intel's results is included in
Intel's SEC filings, including the company's most recent reports on Form 10-Q, Form 10-K and earnings release.
Rev. 4/14/15

More Related Content

What's hot (20)

PPTX
VxRail Appliance - Modernize your infrastructure and accelerate IT transforma...
Maichino Sepede
 
PDF
Apache Spark Overview
Vadim Y. Bichutskiy
 
PPTX
Hyperconverged Infrastructure, It's the Future
Howard Marks
 
PDF
OSMC 2022 | VictoriaMetrics: scaling to 100 million metrics per second by Ali...
NETWAYS
 
PDF
Microservices - Death of the Enterprise Service Bus (ESB)? (Update 2016)
Kai Wähner
 
PDF
Cloud Computing Using OpenStack
Bangladesh Network Operators Group
 
PDF
Best Practices for Streaming IoT Data with MQTT and Apache Kafka®
confluent
 
PPTX
What Is Apache Spark? | Introduction To Apache Spark | Apache Spark Tutorial ...
Simplilearn
 
PDF
Red Hat OpenShift Container Platform Overview
James Falkner
 
PDF
Docker Swarm 0.2.0
Docker, Inc.
 
PPTX
Containers and Docker
Damian T. Gordon
 
PPTX
Docker Kubernetes Istio
Araf Karsh Hamid
 
PPTX
Effective terraform
Calvin French-Owen
 
PDF
Apache Kafka Streams + Machine Learning / Deep Learning
Kai Wähner
 
PDF
Introduction to IBM Spectrum Scale and Its Use in Life Science
Sandeep Patil
 
PPTX
Grafana
NoelMc Grath
 
PDF
What Is OpenStack | OpenStack Tutorial For Beginners | OpenStack Training | E...
Edureka!
 
PDF
The Rise Of Event Streaming – Why Apache Kafka Changes Everything
Kai Wähner
 
PPTX
Ceph Introduction 2017
Karan Singh
 
PDF
Kubernetes Basics
Eueung Mulyana
 
VxRail Appliance - Modernize your infrastructure and accelerate IT transforma...
Maichino Sepede
 
Apache Spark Overview
Vadim Y. Bichutskiy
 
Hyperconverged Infrastructure, It's the Future
Howard Marks
 
OSMC 2022 | VictoriaMetrics: scaling to 100 million metrics per second by Ali...
NETWAYS
 
Microservices - Death of the Enterprise Service Bus (ESB)? (Update 2016)
Kai Wähner
 
Cloud Computing Using OpenStack
Bangladesh Network Operators Group
 
Best Practices for Streaming IoT Data with MQTT and Apache Kafka®
confluent
 
What Is Apache Spark? | Introduction To Apache Spark | Apache Spark Tutorial ...
Simplilearn
 
Red Hat OpenShift Container Platform Overview
James Falkner
 
Docker Swarm 0.2.0
Docker, Inc.
 
Containers and Docker
Damian T. Gordon
 
Docker Kubernetes Istio
Araf Karsh Hamid
 
Effective terraform
Calvin French-Owen
 
Apache Kafka Streams + Machine Learning / Deep Learning
Kai Wähner
 
Introduction to IBM Spectrum Scale and Its Use in Life Science
Sandeep Patil
 
Grafana
NoelMc Grath
 
What Is OpenStack | OpenStack Tutorial For Beginners | OpenStack Training | E...
Edureka!
 
The Rise Of Event Streaming – Why Apache Kafka Changes Everything
Kai Wähner
 
Ceph Introduction 2017
Karan Singh
 
Kubernetes Basics
Eueung Mulyana
 

Similar to Hands-on Lab: How to Unleash Your Storage Performance by Using NVM Express™ Based PCI Express® Solid-State Drives (20)

PDF
NVMe_Infrastructure_final1.pdf
IrfanBroadband
 
PDF
Overcoming Scaling Challenges in MongoDB Deployments with SSD
MongoDB
 
PDF
Intel and DataStax: 3D XPoint and NVME Technology Cassandra Storage Comparison
DataStax Academy
 
PDF
Z109889 z4 r-storage-dfsms-vegas-v1910b
Tony Pearson
 
PDF
S104878 nvme-revolution-jburg-v1809b
Tony Pearson
 
PDF
Z109889 z4 r-storage-dfsms-jburg-v1909d
Tony Pearson
 
PDF
Z4R: Intro to Storage and DFSMS for z/OS
Tony Pearson
 
PDF
SSD & HDD Performance Testing with TKperf
Werner Fischer
 
PDF
NVMe over Fibre Channel Introduction
Calvin Zito
 
PDF
Considerations for Testing All-Flash Array Performance
EMC
 
PDF
Benchmarking Performance: Benefits of PCIe NVMe SSDs for Client Workloads
Samsung Business USA
 
PPTX
Webinar: The Bifurcation of the Flash Market
Storage Switzerland
 
PPTX
IO Dubi Lebel
sqlserver.co.il
 
PDF
Presentation database on flash
xKinAnx
 
PDF
Deep Dive On Intel Optane SSDs And New Server Platforms
NEXTtour
 
PPT
Ds8000 Practical Performance Analysis P04 20060718
brettallison
 
PDF
Next-Gen Storage Solutions: A Deep Dive into SSDs and NVMe
ETechBuy.com
 
PPT
Open Ware Ramsan Dram Ssd
Sidnir Vieira
 
PDF
AsawariKhedkar_SSD_HDD_Comparison
Asawari Khedkar
 
PPTX
Webinar: How NVMe Will Change Flash Storage
Storage Switzerland
 
NVMe_Infrastructure_final1.pdf
IrfanBroadband
 
Overcoming Scaling Challenges in MongoDB Deployments with SSD
MongoDB
 
Intel and DataStax: 3D XPoint and NVME Technology Cassandra Storage Comparison
DataStax Academy
 
Z109889 z4 r-storage-dfsms-vegas-v1910b
Tony Pearson
 
S104878 nvme-revolution-jburg-v1809b
Tony Pearson
 
Z109889 z4 r-storage-dfsms-jburg-v1909d
Tony Pearson
 
Z4R: Intro to Storage and DFSMS for z/OS
Tony Pearson
 
SSD & HDD Performance Testing with TKperf
Werner Fischer
 
NVMe over Fibre Channel Introduction
Calvin Zito
 
Considerations for Testing All-Flash Array Performance
EMC
 
Benchmarking Performance: Benefits of PCIe NVMe SSDs for Client Workloads
Samsung Business USA
 
Webinar: The Bifurcation of the Flash Market
Storage Switzerland
 
IO Dubi Lebel
sqlserver.co.il
 
Presentation database on flash
xKinAnx
 
Deep Dive On Intel Optane SSDs And New Server Platforms
NEXTtour
 
Ds8000 Practical Performance Analysis P04 20060718
brettallison
 
Next-Gen Storage Solutions: A Deep Dive into SSDs and NVMe
ETechBuy.com
 
Open Ware Ramsan Dram Ssd
Sidnir Vieira
 
AsawariKhedkar_SSD_HDD_Comparison
Asawari Khedkar
 
Webinar: How NVMe Will Change Flash Storage
Storage Switzerland
 
Ad

More from Odinot Stanislas (20)

PDF
Silicon Photonics and datacenter
Odinot Stanislas
 
PDF
Using a Field Programmable Gate Array to Accelerate Application Performance
Odinot Stanislas
 
PDF
SDN/NFV: Service Chaining
Odinot Stanislas
 
PDF
Ceph: Open Source Storage Software Optimizations on Intel® Architecture for C...
Odinot Stanislas
 
PDF
SNIA : Swift Object Storage adding EC (Erasure Code)
Odinot Stanislas
 
PDF
PCI Express* based Storage: Data Center NVM Express* Platform Topologies
Odinot Stanislas
 
PDF
Bare-metal, Docker Containers, and Virtualization: The Growing Choices for Cl...
Odinot Stanislas
 
PDF
Software Defined Storage - Open Framework and Intel® Architecture Technologies
Odinot Stanislas
 
PDF
Virtualizing the Network to enable a Software Defined Infrastructure (SDI)
Odinot Stanislas
 
PDF
Accelerate the SDN with Intel ONP
Odinot Stanislas
 
PDF
Moving to PCI Express based SSD with NVM Express
Odinot Stanislas
 
PDF
Intel Cloud Builder : Siveo
Odinot Stanislas
 
PDF
Configuration and deployment guide for SWIFT on Intel Architecture
Odinot Stanislas
 
PDF
Intel IT Open Cloud - What's under the Hood and How do we Drive it?
Odinot Stanislas
 
PDF
Configuration and Deployment Guide For Memcached on Intel® Architecture
Odinot Stanislas
 
PDF
Améliorer OpenStack avec les technologies Intel
Odinot Stanislas
 
PDF
Scale-out Storage on Intel® Architecture Based Platforms: Characterizing and ...
Odinot Stanislas
 
PDF
Big Data and Intel® Intelligent Systems Solution for Intelligent transportation
Odinot Stanislas
 
PDF
Big Data Solutions for Healthcare
Odinot Stanislas
 
PDF
Protect Your Big Data with Intel<sup>®</sup> Xeon<sup>®</sup> Processors a..
Odinot Stanislas
 
Silicon Photonics and datacenter
Odinot Stanislas
 
Using a Field Programmable Gate Array to Accelerate Application Performance
Odinot Stanislas
 
SDN/NFV: Service Chaining
Odinot Stanislas
 
Ceph: Open Source Storage Software Optimizations on Intel® Architecture for C...
Odinot Stanislas
 
SNIA : Swift Object Storage adding EC (Erasure Code)
Odinot Stanislas
 
PCI Express* based Storage: Data Center NVM Express* Platform Topologies
Odinot Stanislas
 
Bare-metal, Docker Containers, and Virtualization: The Growing Choices for Cl...
Odinot Stanislas
 
Software Defined Storage - Open Framework and Intel® Architecture Technologies
Odinot Stanislas
 
Virtualizing the Network to enable a Software Defined Infrastructure (SDI)
Odinot Stanislas
 
Accelerate the SDN with Intel ONP
Odinot Stanislas
 
Moving to PCI Express based SSD with NVM Express
Odinot Stanislas
 
Intel Cloud Builder : Siveo
Odinot Stanislas
 
Configuration and deployment guide for SWIFT on Intel Architecture
Odinot Stanislas
 
Intel IT Open Cloud - What's under the Hood and How do we Drive it?
Odinot Stanislas
 
Configuration and Deployment Guide For Memcached on Intel® Architecture
Odinot Stanislas
 
Améliorer OpenStack avec les technologies Intel
Odinot Stanislas
 
Scale-out Storage on Intel® Architecture Based Platforms: Characterizing and ...
Odinot Stanislas
 
Big Data and Intel® Intelligent Systems Solution for Intelligent transportation
Odinot Stanislas
 
Big Data Solutions for Healthcare
Odinot Stanislas
 
Protect Your Big Data with Intel<sup>®</sup> Xeon<sup>®</sup> Processors a..
Odinot Stanislas
 
Ad

Recently uploaded (20)

PDF
How Startups Are Growing Faster with App Developers in Australia.pdf
India App Developer
 
PDF
Using FME to Develop Self-Service CAD Applications for a Major UK Police Force
Safe Software
 
PDF
CIFDAQ Token Spotlight for 9th July 2025
CIFDAQ
 
PDF
Empower Inclusion Through Accessible Java Applications
Ana-Maria Mihalceanu
 
PPTX
"Autonomy of LLM Agents: Current State and Future Prospects", Oles` Petriv
Fwdays
 
PDF
CIFDAQ Market Wrap for the week of 4th July 2025
CIFDAQ
 
PPTX
Designing Production-Ready AI Agents
Kunal Rai
 
PDF
Building Real-Time Digital Twins with IBM Maximo & ArcGIS Indoors
Safe Software
 
PPTX
Future Tech Innovations 2025 – A TechLists Insight
TechLists
 
PDF
Achieving Consistent and Reliable AI Code Generation - Medusa AI
medusaaico
 
PPTX
AI Penetration Testing Essentials: A Cybersecurity Guide for 2025
defencerabbit Team
 
PDF
Go Concurrency Real-World Patterns, Pitfalls, and Playground Battles.pdf
Emily Achieng
 
PDF
Exolore The Essential AI Tools in 2025.pdf
Srinivasan M
 
PDF
IoT-Powered Industrial Transformation – Smart Manufacturing to Connected Heal...
Rejig Digital
 
PDF
Advancing WebDriver BiDi support in WebKit
Igalia
 
PDF
"Beyond English: Navigating the Challenges of Building a Ukrainian-language R...
Fwdays
 
PDF
“NPU IP Hardware Shaped Through Software and Use-case Analysis,” a Presentati...
Edge AI and Vision Alliance
 
PPTX
OpenID AuthZEN - Analyst Briefing July 2025
David Brossard
 
PDF
Newgen 2022-Forrester Newgen TEI_13 05 2022-The-Total-Economic-Impact-Newgen-...
darshakparmar
 
PDF
Jak MŚP w Europie Środkowo-Wschodniej odnajdują się w świecie AI
dominikamizerska1
 
How Startups Are Growing Faster with App Developers in Australia.pdf
India App Developer
 
Using FME to Develop Self-Service CAD Applications for a Major UK Police Force
Safe Software
 
CIFDAQ Token Spotlight for 9th July 2025
CIFDAQ
 
Empower Inclusion Through Accessible Java Applications
Ana-Maria Mihalceanu
 
"Autonomy of LLM Agents: Current State and Future Prospects", Oles` Petriv
Fwdays
 
CIFDAQ Market Wrap for the week of 4th July 2025
CIFDAQ
 
Designing Production-Ready AI Agents
Kunal Rai
 
Building Real-Time Digital Twins with IBM Maximo & ArcGIS Indoors
Safe Software
 
Future Tech Innovations 2025 – A TechLists Insight
TechLists
 
Achieving Consistent and Reliable AI Code Generation - Medusa AI
medusaaico
 
AI Penetration Testing Essentials: A Cybersecurity Guide for 2025
defencerabbit Team
 
Go Concurrency Real-World Patterns, Pitfalls, and Playground Battles.pdf
Emily Achieng
 
Exolore The Essential AI Tools in 2025.pdf
Srinivasan M
 
IoT-Powered Industrial Transformation – Smart Manufacturing to Connected Heal...
Rejig Digital
 
Advancing WebDriver BiDi support in WebKit
Igalia
 
"Beyond English: Navigating the Challenges of Building a Ukrainian-language R...
Fwdays
 
“NPU IP Hardware Shaped Through Software and Use-case Analysis,” a Presentati...
Edge AI and Vision Alliance
 
OpenID AuthZEN - Analyst Briefing July 2025
David Brossard
 
Newgen 2022-Forrester Newgen TEI_13 05 2022-The-Total-Economic-Impact-Newgen-...
darshakparmar
 
Jak MŚP w Europie Środkowo-Wschodniej odnajdują się w świecie AI
dominikamizerska1
 

Hands-on Lab: How to Unleash Your Storage Performance by Using NVM Express™ Based PCI Express® Solid-State Drives

  • 1. 1 Hands-on Lab: How to Unleash Your Storage Performance by Using NVM Express™ Based PCI Express® Solid-State Drives Andrey Kudryavtsev – SSD Solution Architect, Intel Corporation Zhdan Bybin – Application Engineer, Intel Corporation SSDL001
  • 2. 2 Agenda • What is NVM Express™ (NVMe) ? • How do I know my NVM Express drive is working? • How do I measure performance of my NVM Express drive? • Wow! I have 2 NVMe drives in my system! Now how do I RAID those? • How can I monitor NVMe performance and debug application performance issues? • Alright, I will get a NVM Express drive. How can I make sure it will have enough endurance? • Bonus: How to over-provision the drive? • Bonus #2: I only use Windows®! Which tool to use in this OS?
  • 3. 3 What is the name of new exciting memory technology which Intel® and Micron® have recently introduced? • 1) 4D MegaNAND™ • 2) 3D Crossbow™ • 3) 3D XPoint™
  • 4. 4 What is NVM Express™ (NVMe)?
  • 5. 5 NVM Express™ is Transforming the Data Center Efficiency Industry Standard Performance Developed to be lean, NVM Express™ (NVMe) delivers performance with less resources, increasing storage density and lowering TCO. Scalable performance and low latency of PCI Express® (PCIe) with NVMe optimizing the storage stack. NVMe is bringing PCIe SSDs into the mainstream with industry standard software and drivers and management for the future software defined data center.
  • 6. 6 Ecosystem Infrastructure for PCI Express® (PCIe): Cables, connectors, backplanes, switches, retimers. NVM Express™ (NVMe) Software, drivers, and management. RAID for NVMe with Intel® Rapid Storage Technology enterprise. IHV and ISV partners. PCIe and NVMe compatibility programs. TM
  • 7. 7 Data Center Form Factors for 42, 80, and 110mm lengths, Smallest footprint of PCI Express®, use for boot or for max storage density. 2.5in makes up the majority of SSDs sold today because of ease of deployment, hotplug, serviceability, and small form factor. M.2 Add-in-cardU.2 2.5in (SFF-8639) Add-in-card (AIC) has maximum system compatibility with existing servers and most reliable compliance program. High power envelope, and options for height and length.
  • 8. 8 How do I Know My NVM Express™ Drive is Working?
  • 9. 9 NVM Express™ Driver Ecosystem Native / in-box 6.5 | 7.0 SLES 11 SP3 SLES 12 Install NVMe driver ESXi 5.5 13 | 14 Windows 8.1 Linux* NVMe Express™ (NVMe) driver is open source
  • 10. 10 1. Check if Intel PCI Express® SSD is listed among devices: a) ‘lspci -nn | grep 0953’ or ‘lspci | grep memory’ 2. Check if driver is loaded and which version it is: b) ‘lsmod | grep nvme’ c) ‘modinfo nvme’ 3. Check if controller and namespaces are visible in devices list: c) ‘ls /dev/nvm*’ Controller: nvmeX ; Namespaces: nvmeXnY I Do Not See the Drive in the System! Step 1: First Simple Failure Analysis Steps Log in: root Password: password
  • 11. 11 Step 2: Check LEDs LED Placement & Functionality • Four LED indicators are available on the AIC, visible through the IO bracket • The LEDs will indicate: - Drive activity (yellow, blink rate proportional to workload) - Drive failed (red) - Drive operating in a defective state (yellow)  Tied to critical warnings in NVM Express™ Health Log: 1. Available spare memory has fallen below specified threshold 2. Temperature has exceeded critical temperature 3. Reliability of the device has degraded 4. Volatile memory backup circuit test has failed 5. Device has become read-only - Drive healthy (green) From top to bottom: LED1. Activity (yellow) LED 2. Failed (red) LED 3. Defect (yellow) LED 4. Healthy (green) 1 2 3 4 2.5” SFF (U.2) - Pin 11 Activity Functionality 1. When idle or no IO activity, logic level on this pin is low (LED ON) 2. When there is IO activity, pin puts out a 250ms High, 250ms low signal 3. When drive is formatting, pin toggles at 250ms High, 250ms low signal
  • 12. 12 Step 3: Download and Install Intel® SSD Data Center Tool Free tool to manage your Intel® SSD Data Center drives including PCI Express® family. Available for both Linux* and Windows® x86/x64 versions. Intel SSD Data Center Tool (Intel® SSD DCT) Capabilities include: • Firmware update to latest version • Secure Erase • SMART/NVM Express™ health log display • Settings change • Over-Provisioning • Endurance Analyzer • Power governor settings • Attributes display
  • 13. 13 Step 4: Check Device Status with Intel® SSD Data Center Tool Show all supported Intel® SSDs in the system: isdct show -intelssd Check attributes available for your NVM Express™ (NVMe) based SSD # isdct show -all -intelssd Check NVMe Health Log (SMART) # isdct show -sensor -intelssd 1 Start endurance analyzer (reset Timed Workload Indicator counters) # isdct set –intelssd 1 EnduranceAnalyzer=reset
  • 14. 14 Step 4 (cont.): Checking Important Attributes Bootloader version Firmware version Is drive over-provisioned? Is PCI Express® link trained on Gen3 speed and x4 width? Is drive’s power limited by firmware?
  • 15. 15 How do I Measure Performance of My NVM Express™ Drive?
  • 16. 16 Solid-State Storage Drive States Drive states • Fresh out of box - All space on the drive is free and has not been written to - A Secure Erase will return a drive to FOB - SSDs will perform best in FOB since new data being written goes into next available free space • Transition - Amount of time in transition state is dependent on available free space and write history, previous workloads (pre-conditioning), and current workload pattern • Steady State - Desired state to properly measure and report solid state storage performance! This is typically worst case performance which is important for the data center. 16
  • 17. 17 Methodology • Drive Prep Process - A basic method would be to secure erase and sequentially write the entire drive. Steady State is achieved much faster as opposed to writing 4K random data to an empty drive, and the transition stage would look different. • Testing Order - The order you run tests can heavily influence the final results. For example reading sequentially over random written data can drop performance. The impact will be different depending on what SSD is being tested. • Test Time / Average Time - Depending on the architecture random writes (or writes in general) can take much longer to reach stability than other results • Test Span - A full drive test will generally perform worse than a test over a small region. Most SSDs use unwritten LBAs as spare area until they are written to. Intel® SSD Data Center Series are tested on 100% LBA span. 17
  • 18. 18 Solid-State Storage Performance FOB Transition Steady State Typical test flow 1) Purge Device: Secure Erase to return drive to FOB. 2) Run workload independent preconditioning: Full span sequential write. 3) Run test: 4k random write, Queue Depth 32, span 100%. 4) Record results: Measure during steady state only! Be sure to include information about test system hardware, software, and device under test. IOPS over Time
  • 19. 19 Storage Performance Metrics • Bandwidth (Often MBps) - This is commonly measured in megabytes per second. Calculated by the IOPS multiplied by the block size. Bound by the storage interface (example: 6Gbps SATA* max theoretical throughput is 600MBps). • IOPS, Input Output operations Per Second - The number of I/O packets that can be transferred per sec; packet sizes can range from 512B to 4MB. IOPS data over time you can really start to paint a picture of what is happening on the drive. Traditionally you would focus on a single average number, but enterprise workloads demand strict stability requirements as well. A new focus is comparing the mean to min on a per second basis (performance consistency). • Latency/QoS (Quality of Service) - Latency is in many way related to IOPS. Each command sent takes a period of time to service and return (latency, sometimes called the service time). QoS focuses on the worst outliers in latency over a period of time. In general this is most important for enterprise applications but is applicable to client in extreme cases (a drive timeout is in many ways just a really bad QoS event). There is no such thing as too much detail in a system report
  • 20. 20 0 500 1000 1500 2000 2500 3000 Sequential Read Sequential Write MB/s Sequential Bandwidth 0 50000 100000 150000 200000 250000 300000 350000 400000 450000 500000 Random Read 4k Random Write 4k IOPS Random Workload P3700 Series SAS 12Gbps SATA* 6Gbps 3.5x random IOPS of 12Gbps SAS 6x of 6Gbps SATA Tests document performance of components on a particular test, in specific systems. Differences in hardware, software, or configuration will affect actual performance. Configurations: Performance claims obtained from data sheet, sequential read/write at 128k block size for NVM Express™ and SATA, 64k for SAS. Intel SSD C P3700 Series 2TB, SAS Ultrastar* SSD1600MM, Intel SSD DC S3700 Series SATA 6Gbps. Intel® Core™ i7-3770K CPU @ 3.50GHz, 8GB of system memory, Windows® Server 2012, IOMeter*. Random performance is collected with 4 workers each with 32 QD Up to 6x the Performance of Best in Class SATA* SSDs at Half the Latency and CPU Utilization
  • 21. 21 FIO • FIO is an open-source, flexible IO measuring tool which supports multiple threads, various queue depths and many other parameters • FIO is an industry standard tool for measuring storage performance in Linux* • There are 3 ways to run FIO: - script file (.4krr.sh) - job/ini file (fio 4krr.ini) - old school command line (fio --name=test1 --filename=/x –-size=10G -- ioengine=libaio --direct=1 –numjobs=1……. ) Block size Workload type Queue depth Number of queues Drive span Not utilizing DRAM for random LBA addresses map Enable direct access
  • 22. 22 Examples of FIO ini Files for Sequential and Random Workloads [global] name=Random_Read_test1 filename=/dev/nvme0n1 ioengine=libaio direct=1 bs=4k rw=randread iodepth=32 numjobs=8 buffered=0 size=100% runtime=60 time_based randrepeat=0 Norandommap refill_buffers Optimal Queue_Depth * Number_of_queues for Intel® NVM Express™ drives = 128. For best random performance create Number_of_queues = Number_of_logical_cores with total QD=128 (8 queues each QD=16, 32 queues each QD=4, etc) For best sequential performance create 1 Queue (thread) with QD=128 [global] name=Seq_Write_test2 filename=/dev/nvme0n1 ioengine=libaio direct=1 bs=128k rw=write iodepth=128 numjobs=1 buffered=0 size=100% runtime=60 time_based randrepeat=0 Norandommap refill_buffers Random Sequential
  • 23. 23 Linux* Performance Testing of a Single NVM Express™ Drive Exercise: Open 2 terminal windows • # fio /idf/4krr.ini in 1st terminal window • # iostat –c –d –x –t –m /dev/nvme0n1 1 in 2nd terminal window (this will show CPU usage) Step 5: Measure performance using FIO, iostat and performance counters Latency statistics Latency percentiles Queue Depth percentiles Drive IO statistics IO statistics
  • 24. 24 Wow! I have 2 NVM Express™ Drives in My System! Now How do I RAID Those?
  • 25. 25 0 20 40 60 80 100 120 4 x SAS SSDs 4 x NVMe U.2 SSDs 3x faster than a RAID Card in RAID 5 Intel® Rapid Storage Technology for Enterprise (Intel® RSTe) NVM Express™ (NVMe) SSDs directly connected to processor NVMe SSDs using RSTe on CPU SAS SSDs using RAID Card IOPs (K) Test configuration- Intel GZ2600 Server, dual socket Intel® Xeon® E5-2699 v3, 32GB DDR4 RAM, Hardware RAID controller. Operating System: Microsoft Windows Server 2012 R2. Configuration 1- 12G SAS . 4ea ( Seagate* 1200 SSD ST800FM0043 SSDs-800GB in RAID5 (LSI MegaRAID SAS-3 3108 Controller). Configuration 2 – NVMe-RSTe 4ea (Intel® DC P3700 800GB SSD) in RAID5 array. Intel RSTe 4.3 BETA software. Tests document performance of components on a particular test, in specific systems. Differences in hardware, software, or configuration will affect actual performance. NVM Express™ RAID with Intel® Rapid Storage Technology for Enterprise
  • 26. 26 Step 6: Create an Intel® RSTe RAID Volume The lab system already has latest version of mdadm included in the Linux* kernel and Intel® Matrix Storage Manager software option can be used 1. Create a container: # mdadm -C /dev/md/imsm /dev/nvme0n1 /dev/nvme1n1 –n 2 –e imsm -f 2. Create a RAID 0 volume within the container: # mdadm -C /dev/md0 /dev/md/imsm –n 2 –l 0 –c 128 -f 3. Create a partition on RAID 0 volume: # parted /dev/md0 mklabel gpt # parted /dev/md0 mkpart primary 2097152B 100% 4. Create an xfs filesystem on the RAID volume: # mkfs.xfs -K /dev/md0p1 -f # is the root shell prompt and not part of the command. Also all commands must be run as root (administrator). Intel® Rapid Storage Technology enterprise (Intel® RSTe)
  • 27. 27 Step 7: Create and Mount Partition 27 5. Verify partition creation # parted /dev/md0 print 6. Mount the file system on the RAID volume: # mkdir /mnt/myraid/ # mount -o noatime,nodiratime,nobarrier /dev/md0p1 /mnt/myraid noatime - not recording last file access time nodirtime - not recording last directory access time nobarrier - no flush cache commands 7. Show the container and RAID volume # cat /proc/mdstat Intel® Rapid Storage Technology enterprise (Intel® RSTe)
  • 28. 28 Linux* Performance Testing of RSTe RAID’d drive • Measuring performance with ‘fio’ over file system # fio /idf/md4krr.ini Please note that FIO will create test files under the directory specified here: “Directory=/mnt/myraid” Number of files will match number of jobs for this ini file • Alternate way for creating test files – using ‘dd’ on a test partition with file system # dd if=/dev/zero of=/mnt/myraid/testfile bs=1M count=16384 Step 8: Measure performance of NVMe RAID volume
  • 29. 29 How Can I Monitor NVM Express™ Performance and Debug Application Performance Issues ?
  • 30. 30 FIO Visualizer Tool Unique features include: • Single GUI for FIO tool, de facto standard benchmark tool for Linux* • Real time. The data gathers by assigned time intervals and immediately displays on graphs. • Monitors IOPS, bandwidth, latency for reads and writes • Customizable layout. User defines which parameter needs to be monitored. • Multithread / multi jobs support makes a value for NVM Express™ SSD benchmarking • Workload manager for FIO settings. Comes with base workload settings used in all Intel® SSD datasheets.
  • 31. 31 Step 9: Measure Performance Using FIO Visualizer and ioprof • For this step we will be using pre-defined ini file /idf/8kmix.ini which represents semi-random customer workload with following parameters: - mix of reads and writes - 8KB access - addition of random block every 8 consecutive blocks - QD=8 - 4 threads on 2 GB disk span each:
  • 32. 32 Step 9 (cont’d): Measure Performance With FIO Visualizer and ioprof Open FIO Visualizer and use /idf/8kmix.ini as a job file : # cd /idf/fiovisualizer/ # ./fio_visualizer.py Click ‘Browse’, go to ‘/idf/’ folder, select 8kmix.ini Click ‘START’ Keep FIO visualizer running and open 2nd terminal window (adjust the size to half of the screen) # cd /idf/ioprof-master/ # ./ioprof.pl –m trace –d /dev/md0 –r 30 # ./ioprof.pl –m post –t md0.tar Please note that ‘ioprof’ should be installed separately as it is not part of standard Linux* build ‘ioprof’ is an open-source utility developed by Intel to analyze IO intensive workloads in background and report it’s statistics http://www.01.org/ioprof
  • 33. 33 Real-Time Monitoring of NVM Express™ Queues • It is possible to monitor IO utilization on the RAID level and device level via iostat, which is a standard Linux* tool for any block device • Starting with kernel 3.19 NVM Express™ (NVMe) driver reporting has been expanded. This includes performance counters under /sys/block/<nvmeXnY>/mq • Performance counters provide detailed information per NVMe queue md0 nvme0n1 nvme1n1 RAID level NVMe device Queues /sys/block/<nvmeXnY>/mq iostat iostat
  • 34. 34 Step 10: Real-time Monitoring of NVM Express™ Queues • Open new terminal window and run the command: # cat /sys/block/nvme0n1/mq/X/tags (where X = queue number) In this case: nr_tags - nr_free = 21 → Represents number of submitted IO’s waiting in the submission queue 0 Please note that the number of queue pairs in NVM Express™ driver is equal to number of logical CPU cores in the system but cannot exceed 31.
  • 35. 35 Step 11: Analyzing ioprof Results IO distribution by block size and R/W type IO “Heat” map
  • 36. 36 Intel® Cache Acceleration Software: Accelerate Your Data Center Primary Storage SAN, NAS Network FC, iSCSI Intel CAS copies hot data from back-end storage or local HDD storage to the compute node Intel® CAS Accelerates Existing Applications by Addressing Storage I/O Bottlenecks Without Application or Storage Modifications Usage Model Intel® Cache Acceleration Software (Intel® CAS) within a Compute Node Features Benefits Ease of Use • Installed & Configured in <10min • Application acceleration with no modification to the application or storage back-end Performance Intel CAS & Intel® SSD Delivers Gains vs HDD Solution up to: • 1400X IOPS1, 57X OLAP2, 3X OLTP2 • 5X the Database Transaction throughput • 30X the Virtualization I/O throughput • 12X the Microsoft Exchange* Throughput Flexible & Tuning • Several Caching policies and options - Warm cache (pinning) for proactive caching - File/block based caching w/ selective policies - Mapping to SSD or System Memory • Broad OS Support (Linux* & Windows®) • Virtualization Support (VM, XEN*, KVM, Microsoft*) • Operates on any SSD, optimized for Intel SSD DC Robust Solution • Intel validated and optimized for Intel SSDs Intel CAS Features & Benefits 1.Configuration used: Intel® Server model 2600GZ (codename Grizzly Pass); Dual Intel® E5-2680 processor (2.7GHz), 32GB memory; Seagate* ST1000NC000 SATA HDD Microsoft Windows 2012R2 SP1, Intel SSD DC P3700 -800GB, Intel® CAS 2.6 release, L2 cache on ; IOmeter 10.22.2009 ; 4K Random Read test; 8-queue depth x 8 workers 2. Configuration used: Intel® Server model 2600GZ (codename Grizzly Pass); Dual Intel Xeon E5-2680 processor (2.7GHz), 96GB DDR3, VMware* 5.5, Intel® SSD DC P3700 -800GB, Intel® CAS 2.6,, L2 cache off, 8xSeagate 146GB SAS In RAID5,VMs: Microsoft Server 2008R2, 8GB, 2 Cores, IOMeter workloads: Media Player ,Exchange Server, Web Server, 4K OLTP using QD4.1 Worker DAS (JBOD)
  • 37. 37 Intel® Cache Acceleration Software Publicly Available Information Download & Start an Evaluation Today! Software Downloads: • Intel® I/O Assessment Tool – How Intel® Cache Acceleration Software (Intel® CAS) can benefit you • 30-Day Trial Software - Try Before You Buy¹ • Click through to purchase • Overview Videos & Documents: • Intel Caching Explained Animation • Introduction to Intel CAS • Intel CAS Product Brief • Intel CAS Solution Brief Case Studies and Briefs: • Accelerating Business Analytics with Intel CAS and Intel® Solid-State Drives • Accelerating Analysis and Simulation with Intel CAS and Intel Solid-State Drives • Accelerating MySQL* Database Performance with Intel CAS and Intel Solid-State Drives • 3rd Party Performance Analysis Case Studies • & more coming! 37 Publicly Available Resources Intel.com: www.intel.com/cas Contact Intel Authorized Distributors and Resellers for current promotional programs *Other names and brands may be claimed as the property of others ¹Please see additional information at: intel.com/cas
  • 38. 38 Step 12: Deleting RAID Configuration • Un-mounting the drive # umount /mnt/myraid • Stopping RAID # mdadm --stop /dev/md0 # mdadm --stop /dev/md/imsm • Deleting meta-data # mdadm --zero-superblock /dev/nvme0n1 # mdadm --zero-superblock /dev/nvme1n1
  • 39. 39 Alright, I Will get an NVM Express™ Drive. How can I Make Sure it Will Have Enough Endurance?
  • 40. 40 Step 13: Calculating Endurance of an Intel® SSD In the beginning of the lab we reset Timed Workload SMART attributes by using following command: # isdct set –intelssd 1 EnduranceAnalyzer=reset To check Endurance Analyzer result, issue following command: # isdct show –a –intelssd 0 Look for “EnduranceAnalyzer” Please note that in order for calculation to be valid, after reset workload should be applied minimum for 60 min and so media would wear out for at least 0.01% Intel Data-Center SSD Endurance is calculated for workload specified in JESD-219 standard: 100% write, 100% drive span, 100% random, mixed blocks size with 67% being 4KB
  • 41. 41 Bonus: How to Over-provision the Drive?
  • 42. 42 Over-Provisioning • Over-provisioning (OP) allows user to trade off capacity for lower Write Amplification thus increasing Performance and Endurance. • OP is mostly applicable to Random Write with 100% drive span workloads. In such cases OP can lead to up to 400% endurance increase. • Over-provisioning could be set at - SW level (limit capacity that SW can access, i.e. data base size) - OS level (partition the drive to use not full capacity of the drive) - Drive level (set Maximum LBA accessible and visible by user) • isdct commands: # isdct set –intelssd MaximumLBA=100000 (Max LBA = 100000) # isdct set –intelssd MaximumLBA=100GB (Drive resized to 100GB) # isdct set –intelssd MaximumLBA=80% (Drive resized to 80% of it’s capacity) # isdct set –intelssd MaximumLBA=native (return to full capacity)
  • 43. 43 Bonus #2: I only use Windows*! Which tool to use in this OS?
  • 44. 44 Testing with IOmeter* 1.1 NEW Features (in ver. 1.1) • Record last update results to file - Latency buckets collected - Frequency dropdown menu • Transfer size aligned patterns added • Added option to align transfers to the request size boundary • Allows changing data pattern - Compressible (Repeating Bytes) - Partially-compressible (Pseudo-Random) - Incompressible (Full Random) • Transfer size aligned patterns added • Added option to align transfers to the request size boundary
  • 45. 45
  • 46. 46 Additional Sources of Information • A PDF of this presentation is available from our Technical Session Catalog: www.intel.com/idfsessionsSF. This URL is also printed on the top of Session Agenda Pages in the Pocket Guide. • Demos in the showcase – Intel® Solid State Drive Pavilion • Additional info in the Intel SSD Pavilion • More web based info: www.intel.com/ssd
  • 47. 47 Other Technical Sessions Session ID Title Day Time Room SSDL001/R Hands-on Lab: How to Unleash Your Storage Performance by Using NVM Express* based PCI Express* Solid-State Drives Wed 1:15; 4:00 2010 SSDC001 Tech Chat: Benchmarking Data Center Solid-State Drives – Insights Into Industry-Leading NVM Express* SSD Performance Metrics Thurs 9:30 Thurs Tech Chat Station 1 SSDC002 Tech Chat: Insights into Intel® Solid-State Drives Data Retention and Endurance Thurs 9:30 Thurs Tech Chat Station 2 SSDC003 Tech Chat: NVM Express* Features for High Availability and Storage Eco- System Wed and Thurs 10:30 Wed 9:30 Thurs Tech Chat Station 3 SSDS004 The Future of Storage Security Thurs 1:00 2006 SSDS005 New Software Capabilities and Experiences Through Innovation in Storage Architecture Thurs 2:15 2006
  • 48. 48 Legal Notices and Disclaimers Intel technologies’ features and benefits depend on system configuration and may require enabled hardware, software or service activation. Learn more at intel.com, or from the OEM or retailer. No computer system can be absolutely secure. Tests document performance of components on a particular test, in specific systems. Differences in hardware, software, or configuration will affect actual performance. Consult other sources of information to evaluate performance as you consider your purchase. For more complete information about performance and benchmark results, visit http://www.intel.com/performance. Cost reduction scenarios described are intended as examples of how a given Intel-based product, in the specified circumstances and configurations, may affect future costs and provide cost savings. Circumstances will vary. Intel does not guarantee any costs or cost reduction. This document contains information on products, services and/or processes in development. All information provided here is subject to change without notice. Contact your Intel representative to obtain the latest forecast, schedule, specifications and roadmaps. Statements in this document that refer to Intel’s plans and expectations for the quarter, the year, and the future, are forward-looking statements that involve a number of risks and uncertainties. A detailed discussion of the factors that could affect Intel’s results and plans is included in Intel’s SEC filings, including the annual report on Form 10-K. The products described may contain design defects or errors known as errata which may cause the product to deviate from published specifications. Current characterized errata are available on request. No license (express or implied, by estoppel or otherwise) to any intellectual property rights is granted by this document. Intel does not control or audit third-party benchmark data or the web sites referenced in this document. You should visit the referenced web site and confirm whether referenced data are accurate. Intel, Core, Xeon, and the Intel logo are trademarks of Intel Corporation in the United States and other countries. *Other names and brands may be claimed as the property of others. © 2015 Intel Corporation.
  • 49. 49 Risk FactorsThe above statements and any others in this document that refer to plans and expectations for the second quarter, the year and the future are forward- looking statements that involve a number of risks and uncertainties. Words such as "anticipates," "expects," "intends," "plans," "believes," "seeks," "estimates," "may," "will," "should" and their variations identify forward-looking statements. Statements that refer to or are based on projections, uncertain events or assumptions also identify forward-looking statements. Many factors could affect Intel's actual results, and variances from Intel's current expectations regarding such factors could cause actual results to differ materially from those expressed in these forward-looking statements. Intel presently considers the following to be important factors that could cause actual results to differ materially from the company's expectations. Demand for Intel's products is highly variable and could differ from expectations due to factors including changes in business and economic conditions; consumer confidence or income levels; the introduction, availability and market acceptance of Intel's products, products used together with Intel products and competitors' products; competitive and pricing pressures, including actions taken by competitors; supply constraints and other disruptions affecting customers; changes in customer order patterns including order cancellations; and changes in the level of inventory at customers. Intel's gross margin percentage could vary significantly from expectations based on capacity utilization; variations in inventory valuation, including variations related to the timing of qualifying products for sale; changes in revenue levels; segment product mix; the timing and execution of the manufacturing ramp and associated costs; excess or obsolete inventory; changes in unit costs; defects or disruptions in the supply of materials or resources; and product manufacturing quality/yields. Variations in gross margin may also be caused by the timing of Intel product introductions and related expenses, including marketing expenses, and Intel's ability to respond quickly to technological developments and to introduce new products or incorporate new features into existing products, which may result in restructuring and asset impairment charges. Intel's results could be affected by adverse economic, social, political and physical/infrastructure conditions in countries where Intel, its customers or its suppliers operate, including military conflict and other security risks, natural disasters, infrastructure disruptions, health concerns and fluctuations in currency exchange rates. Results may also be affected by the formal or informal imposition by countries of new or revised export and/or import and doing-business regulations, which could be changed without prior notice. Intel operates in highly competitive industries and its operations have high costs that are either fixed or difficult to reduce in the short term. The amount, timing and execution of Intel's stock repurchase program could be affected by changes in Intel's priorities for the use of cash, such as operational spending, capital spending, acquisitions, and as a result of changes to Intel's cash flows or changes in tax laws. Product defects or errata (deviations from published specifications) may adversely impact our expenses, revenues and reputation. Intel's results could be affected by litigation or regulatory matters involving intellectual property, stockholder, consumer, antitrust, disclosure and other issues. An unfavorable ruling could include monetary damages or an injunction prohibiting Intel from manufacturing or selling one or more products, precluding particular business practices, impacting Intel's ability to design its products, or requiring other remedies such as compulsory licensing of intellectual property. Intel's results may be affected by the timing of closing of acquisitions, divestitures and other significant transactions. A detailed discussion of these and other factors that could affect Intel's results is included in Intel's SEC filings, including the company's most recent reports on Form 10-Q, Form 10-K and earnings release. Rev. 4/14/15