MySQL Performance Schema in Action
1 like775 views

The document provides a comprehensive overview of MySQL's Performance Schema, detailing its functionalities, configuration options, and enhancements across versions 5.6 to 8.0. It covers internal diagnostics, instrumentation, and analysis of prepared statements and stored routines, with a focus on performance tuning and query optimization. Additionally, it includes practical examples for effectively using Performance Schema to diagnose slow queries and optimize database performance.


![• Not only replication
mysql> select * from log_statusG
*************************** 1. row ***************************
SERVER_UUID: c634ce2c-cbb3-11e8-8900-0242cedce297
LOCAL: {"gtid_executed": "c634ce2d-cbb3-11e8-9532-0242cedce297:1-2",
"binary_log_file": "binlog.000001",
"binary_log_position": 620}
REPLICATION: {"channels": [{"channel_name": "",
"relay_log_file": "delly-relay-bin.000002",
"relay_log_position": 819,
"relay_master_log_file": "binlog.000001",
"exec_master_log_position": 611}]}
STORAGE_ENGINES: {"InnoDB": {"LSN": 19177930, "LSN_checkpoint": 19177930}}
1 row in set (0.01 sec)
Table log status
76](https://image.slidesharecdn.com/pstutorial-perconalive-2019-austin-190601031622/85/MySQL-Performance-Schema-in-Action-145-320.jpg)


![• Variables
• Status variables
• global status
• session status
• status by [account|host|thread|user]
Variables Instrumentation
79](https://image.slidesharecdn.com/pstutorial-perconalive-2019-austin-190601031622/85/MySQL-Performance-Schema-in-Action-151-320.jpg)

![• Same information which is in
• SHOW [GLOBAL] STATUS
• I S.GLOBAL VARIABLES
Deprecated in 5.7
Removed in 8.0.1
• I S.SESSION VARIABLES
Deprecated in 5.7
Removed in 8.0.1
Global and Session Variables
80](https://image.slidesharecdn.com/pstutorial-perconalive-2019-austin-190601031622/85/MySQL-Performance-Schema-in-Action-153-320.jpg)
![• Same information which is in
• SHOW [GLOBAL] STATUS
• I S.GLOBAL VARIABLES
Deprecated in 5.7
Removed in 8.0.1
• I S.SESSION VARIABLES
Deprecated in 5.7
Removed in 8.0.1
• Helps to watch session variables changes
Global and Session Variables
80](https://image.slidesharecdn.com/pstutorial-perconalive-2019-austin-190601031622/85/MySQL-Performance-Schema-in-Action-154-320.jpg)
![• Same information which is in
• SHOW [GLOBAL] STATUS
• I S.GLOBAL STATUS
Deprecated in 5.7
Removed in 8.0.1
• I S.SESSION STATUS
Deprecated in 5.7
Removed in 8.0.1
Status Variables
81](https://image.slidesharecdn.com/pstutorial-perconalive-2019-austin-190601031622/85/MySQL-Performance-Schema-in-Action-155-320.jpg)


MySQL Performance Schema in Action
- 1. MySQL Performance Schema in Action May 28, 2019 Sveta Smirnova, Alexander Rubin with Nickolay Ihalainen
- 2. •Internal Diagnostic in MySQL •Configuration •5.6+: Statements Instrumentation •5.7+: Prepared Statements •5.7+: Stored Routines •5.7+: Locks Diagnostic •5.7+: Memory Usage •5.7+: Replication •5.7+: Variables •8.0+: Errors Summary Table of Contents 2
- 3. Who We Are 3
- 4. • MySQL Support engineer • Author of • MySQL Troubleshooting • JSON UDF functions • FILTER clause for MySQL • Speaker • Percona Live, OOW, Fosdem, DevConf, HighLoad... Who We Are: Sveta Smirnova 4
- 5. • Director of data architecture • VirtualHealth (medical startup) • With MySQL for > 12 years • Speaker • Percona Live, OOW, HighLoad... Who We Are: Alexander Rubin 5
- 6. • Senior Support Engineer • In Percona for 7+ years • DBA Expert in • MySQL • MongoDB • PostgreSQL Who We Are: Nickolay Ihalainen 6
- 7. Internal Diagnostic in MySQL
- 8. • INFORMATION SCHEMA • SHOW commands • Metadata • Storage engine extentions Runtime Can be anything Old Style 8
- 9. • INFORMATION SCHEMA • SHOW commands • Status variables • Runtime Old Style 8
- 10. • INFORMATION SCHEMA • SHOW commands • Status variables • Administration statements • ANALYZE • EXPLAIN • CHECK Old Style 8
- 11. • INFORMATION SCHEMA • SHOW commands • Status variables • Administration statements • No or limited information on • Performance • Internal server operations Old Style 8
- 12. • Introduced in version 5.5 Performance Schema 9
- 13. • Introduced in version 5.5 • Runtime performances statistics Performance Schema 9
- 14. • Introduced in version 5.5 • Runtime performances statistics • Wraps the diagnosed code locker = PSI_RWLOCK_CALL(start_rwlock_wrwait)( &state, lock->pfs_psi, PSI_RWLOCK_TRYEXCLUSIVELOCK, file_name, static_cast<uint>(line)); ret = rw_lock_x_lock_func_nowait(lock, file_name, line); if (locker != NULL) PSI_RWLOCK_CALL(end_rwlock_wrwait)( locker, static_cast<int>(ret)); Performance Schema 9
- 15. How Does Performance Schema Works? 10
- 16. Instruments: Get the Data 11
- 17. Consumers: Store the Data 12
- 18. • Must be supported by the component • Collects data only after they are enabled • Never frees allocated memory Performance Schema Limitations 13
- 19. • Views on Performance Schema tables • Stored routines sys Schema 14
- 20. • Views on Performance Schema tables • Stored routines • Easier configuration • Shortcuts to typical use cases sys Schema 14
- 21. • Views on Performance Schema tables • Stored routines • Easier configuration • Shortcuts to typical use cases • 5.7+: Installed by default • Before: github.com/mysql/mysql-sys sys Schema 14
- 22. • Statements • Locks • Memory Usage • Replication • Variables • Errors What will We Discuss Today? 15
- 23. Configuration
- 24. 5.6 • 52 tabless 589 Percona Server • 31 variables 5.7 • 87 tables • 1029 instrs 1067 Percona Server • 42 variables 8.0 • 103 tables • 1236 instrs 1255 Percona Server • 44 variables What is Inside? 17
- 25. • Defaults • ON 5.7: Only global, thread, statements and transactions instrumentation 8.0: Memory and MDL Performance Schema Defaults 18
- 26. • Defaults • ON 5.7: Only global, thread, statements and transactions instrumentation 8.0: Memory and MDL • All other instruments/consumers disabled Performance Schema Defaults 18
- 27. • We will turn required instrumentation ON for each exercise separately Prepare 19
- 28. • We will turn required instrumentation ON for each exercise separately • We will use pattern update performance_schema.setup_consumers set enabled=’yes’ where name like ’OUR_REQUIREMENT_%’; update performance_schema.setup_instruments set enabled=’yes’, timed=’yes’ where name like ’OUR_REQUIREMENT_%’; Prepare 19
- 29. • We will turn required instrumentation ON for each exercise separately • Or easier call sys.ps_setup_enable_consumer(YOUR_CONSUMER); call sys.ps_setup_enable_instrument(YOUR_INSTRUMENT); Prepare 19
- 30. • We will turn required instrumentation ON for each exercise separately • Be careful! • They are memory and CPU intensive • Do not turn them all ON until needed Prepare 19
- 32. • Instruments • > 500 mysql> select name from setup_instruments where name like ’statement%’; +-----------------------------------------------+ | name | +-----------------------------------------------+ | statement/sql/select | | statement/sql/create_table | | statement/sql/create_index | | statement/sql/alter_table | | statement/sql/update | | statement/sql/insert | | statement/sql/insert_select | ... • Enable those you want to examine Statements: configuration 21
- 33. • Instruments • > 500 • Consumers mysql> select name from setup_consumers where name like ’%statement%’; +--------------------------------+ | name | +--------------------------------+ | events_statements_current | -- Current statements | events_statements_history | -- Last 10 statements | events_statements_history_long | -- Last 1K statements | statements_digest | -- Digests +--------------------------------+ 4 rows in set (0.00 sec) Statements: configuration 21
- 34. • Why statements are slow? • Examine more rows than return/change • Use disk instead of memory • Full table scan instead of index • This is not full list! What Can We Discover? 22
- 35. • Why statements are slow? • Performance Schema has • Per-query statistics • Most evolving stages What Can We Discover? 22
- 36. • events statements * and prepared statements instances tables • Important field names CREATED TMP DISK TABLES CREATED TMP TABLES SELECT FULL JOIN SELECT RANGE CHECK SELECT SCAN SORT MERGE PASSES SORT SCAN Why Statements are Slow? 23
- 37. • events statements * and prepared statements instances tables • Views in sys schema • Important view names statement analysis statements with full table scans statements with runtimes in 95th percentile statements with sorting statements with temp tables statements with errors or warnings Why Statements are Slow? 23
- 38. • events statements * and prepared statements instances tables • Views in sys schema • Digest tables • Combined statistics events statements summary by account by event name events statements summary by host by event name events statements summary by thread by event name events statements summary by user by event name events statements summary global by event name 5.7+: events statements summary by program Why Statements are Slow? 23
- 39. • events statements * and prepared statements instances tables • Views in sys schema • Digest tables • Histogram Summary events statements histogram by digest events statements histogram global Do NOT mix with Optimizer histograms! Why Statements are Slow? 23
- 40. • events statements * and prepared statements instances tables • Views in sys schema • Digest tables • events statements summary by digest SCHEMA NAME DIGEST DIGEST TEXT 8.0+: QUERY SAMPLE TEXT Why Statements are Slow? 23
- 41. mysql> SELECT THREAD_ID TID, SUBSTR(SQL_TEXT, 1, 50) SQL_TEXT, ROWS_SENT RS, -> ROWS_EXAMINED RE,CREATED_TMP_TABLES,NO_INDEX_USED,NO_GOOD_INDEX_USED -> FROM performance_schema.events_statements_history -> WHERE NO_INDEX_USED=1 OR NO_GOOD_INDEX_USED=1G ********************** 1. row ********************** TID: 10124 SQL_TEXT: select emp_no, first_name, last_name from employee RS: 97750 RE: 397774 CREATED_TMP_TABLES: 0 NO_INDEX_USED: 1 NO_GOOD_INDEX_USED: 0 ... Which Queries Do Not Use Indexes? 24
- 42. mysql> SELECT query, total_latency, no_index_used_count, rows_sent, -> rows_examined -> FROM sys.statements_with_full_table_scans -> WHERE db=’employees’ AND query NOT LIKE ’%performance_schema%’G ********************** 1. row ********************** query: SELECT COUNT ( ‘emp_no‘ ) FROM ... ‘emp_no‘ ) WHERE ‘title‘ = ? total_latency: 805.37 ms no_index_used_count: 1 rows_sent: 1 rows_examined: 397774 ... Take it Easy: Index Usage with sys Schema 25
- 43. mysql> select DIGEST, DIGEST_TEXT, COUNT_STAR, SUM_CREATED_TMP_DISK_TABLES, -> SUM_SELECT_FULL_JOIN, SUM_SELECT_RANGE , SUM_SELECT_SCAN , SUM_NO_INDEX_USED, -> SUM_ROWS_SENT, SUM_ROWS_EXAMINED -> from events_statements_summary_by_digest where SUM_NO_INDEX_USED > 0G *************************** 1. row *************************** DIGEST: 3884185b07312b354c4918f2368d8fe2c431aeb8e39bf8ff5c3dcc6 DIGEST_TEXT: SELECT ‘c‘ FROM ‘sbtest1‘ WHERE ‘id‘ BETWEEN ? AND ? COUNT_STAR: 1501791 SUM_CREATED_TMP_DISK_TABLES: 0 SUM_SELECT_FULL_JOIN: 0 SUM_SELECT_RANGE: 1501840 SUM_SELECT_SCAN: 4 SUM_NO_INDEX_USED: 4 SUM_ROWS_SENT: 150872400 SUM_ROWS_EXAMINED: 152872000 ... Take it Easy: with Digest Tables 26
- 44. • Login into EC2 instance • Login: see your card • Password: see your card Statements: practice 27
- 45. • Start the task Statements: practice 27
- 46. • Inside MySQL client CALL help_task()G CALL help_solve()G • We need to find slowest queries: • With largest response time • With large scanned rows number • Not using indexes • Creating temporary tables Statements: practice 27
- 47. • events stages * tables Statements Deep Dive 28
- 48. • events stages * tables • Same information as in table INFORMATION SCHEMA.PROCESSLIST or SHOW PROCESSLIST output • init • executing • Opening tables Statements Deep Dive 28
- 49. • events stages * tables • Same information as in table INFORMATION SCHEMA.PROCESSLIST or SHOW PROCESSLIST output • init • executing • Opening tables • Replacement for SHOW PROFILE Statements Deep Dive 28
- 50. • events stages * tables • Same information as in table INFORMATION SCHEMA.PROCESSLIST or SHOW PROCESSLIST output • init • executing • Opening tables • Replacement for SHOW PROFILE • Only server-level • No storage engine information! Statements Deep Dive 28
- 51. • Instruments mysql> select name from setup_instruments where name like ’stage%’; +----------------------------------------------------+ | name | +----------------------------------------------------+ | stage/sql/After create | | stage/sql/allocating local table | | stage/sql/preparing for alter table | | stage/sql/altering table | | stage/sql/committing alter table to storage engine | | stage/sql/Changing master | | stage/sql/Checking master version | ... • Enable those you want to examine Stages: configuration 29
- 52. • Instruments • Consumers mysql> select name from setup_consumers where name like ’%stage%’; +----------------------------+ | name | +----------------------------+ | events_stages_current | -- Current stages | events_stages_history | -- Last 10 stages | events_stages_history_long | -- Last 1K stages +----------------------------+ 3 rows in set (0.00 sec) Stages: configuration 29
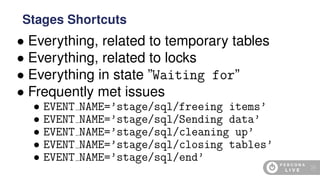
- 53. • Everything, related to temporary tables • EVENT NAME LIKE ’stage/sql/%tmp%’ • Everything, related to locks • EVENT NAME LIKE ’stage/sql/%lock%’ • Everything in state ”Waiting for” • EVENT NAME LIKE ’stage/%/Waiting for%’ • Frequently met issues Stages Shortcuts 30
- 54. • Everything, related to temporary tables • Everything, related to locks • Everything in state ”Waiting for” • Frequently met issues • EVENT NAME=’stage/sql/freeing items’ • EVENT NAME=’stage/sql/Sending data’ • EVENT NAME=’stage/sql/cleaning up’ • EVENT NAME=’stage/sql/closing tables’ • EVENT NAME=’stage/sql/end’ Stages Shortcuts 30
- 55. mysql> SELECT eshl.event_name, sql_text, eshl.timer_wait/1000000000000 w_s -> FROM performance_schema.events_stages_history_long eshl -> JOIN performance_schema.events_statements_history_long esthl -> ON (eshl.nesting_event_id = esthl.event_id) -> WHERE eshl.timer_wait > 1*10000000000G *************************** 1. row *************************** event_name: stage/sql/Sending data sql_text: SELECT COUNT(emp_no) FROM employees JOIN salaries USING(emp_no) WHERE hire_date=from_date w_s: 0.8170 1 row in set (0.00 sec) Stages Example: Which Run Critically Long? 31
- 57. • Contains current prepared statements Table prepared statements instances 33
- 58. • Contains current prepared statements • Statistics by • Which thread owns the statement • How many times executed • Optimizer statistics, similar to events statements * Table prepared statements instances 33
- 59. • Instruments statement/sql/prepare_sql statement/sql/execute_sql statement/com/Prepare statement/com/Execute Prepared Statements: configuration 34
- 60. • Instruments • Consumers • prepared statements instances Prepared Statements: configuration 34
- 61. • Instruments • Consumers • Size mysql> select @@performance_schema_max_prepared_statements_instancesG *************************** 1. row *************************** @@performance_schema_max_prepared_statements_instances: -1 1 row in set (0.00 sec) Prepared Statements: configuration 34
- 62. mysql1> prepare stmt from ’select count(*) from employees where hire_date > ?’; Query OK, 0 rows affected (0.00 sec) Statement prepared mysql1> set @hd=’1995-01-01’; Query OK, 0 rows affected (0.00 sec) mysql1> execute stmt using @hd; +----------+ | count(*) | +----------+ | 34004 | +----------+ 1 row in set (1.44 sec) Example: Prepared Statement 35
- 63. mysql1> prepare stmt from ’select count(*) from employees where hire_date > ?’; Query OK, 0 rows affected (0.00 sec) Statement prepared mysql1> set @hd=’1995-01-01’; Query OK, 0 rows affected (0.00 sec) mysql1> execute stmt using @hd; +----------+ | count(*) | +----------+ | 34004 | +----------+ 1 row in set (1.44 sec) • Try EXECUTE with different values Example: Prepared Statement 35
- 64. mysql2> select statement_name, sql_text, owner_thread_id, count_reprepare, -> count_execute, sum_timer_execute from prepared_statements_instancesG *************************** 1. row *************************** statement_name: stmt sql_text: select count(*) from employees where hire_date > ? owner_thread_id: 22 count_reprepare: 0 count_execute: 3 sum_timer_execute: 4156561368000 1 row in set (0.00 sec) mysql1> drop prepare stmt; Query OK, 0 rows affected (0.00 sec) mysql2> select * from prepared_statements_instancesG Empty set (0.00 sec) Example: diagnosis 36
- 65. • Start the task Prepared Statements: practice 37
- 66. • Inside MySQL client CALL help_task()G CALL help_solve()G • We need to find out how effective is the prepared statement Prepared Statements: practice 37
- 68. mysql> select * from setup_instruments where name like ’statement/sp%’; +--------------------------------+---------+-------+ | NAME | ENABLED | TIMED | +--------------------------------+---------+-------+ ... | statement/sp/stmt | YES | YES | | statement/sp/hreturn | | statement/sp/set | YES | YES | | statement/sp/cpush | | statement/sp/set_trigger_field | YES | YES | | statement/sp/cpop | | statement/sp/jump | YES | YES | | statement/sp/copen | | statement/sp/jump_if_not | YES | YES | | statement/sp/cclose | | statement/sp/freturn | YES | YES | | statement/sp/cfetch | | statement/sp/hpush_jump | YES | YES | | statement/sp/error | | statement/sp/hpop | YES | YES | | statement/sp/set_case_expr | ... +----------------------------+ 16 rows in set (0.00 sec) New Instruments 39
- 69. • What happens inside the routine Stored Routines Instrumentation 40
- 70. • What happens inside the routine • Queries, called from the routine • statement/sp/stmt Stored Routines Instrumentation 40
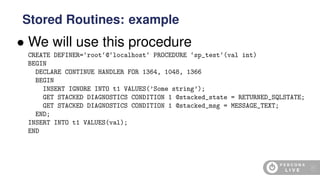
- 71. • We will use this procedure CREATE DEFINER=‘root‘@‘localhost‘ PROCEDURE ‘sp_test‘(val int) BEGIN DECLARE CONTINUE HANDLER FOR 1364, 1048, 1366 BEGIN INSERT IGNORE INTO t1 VALUES(’Some string’); GET STACKED DIAGNOSTICS CONDITION 1 @stacked_state = RETURNED_SQLSTATE; GET STACKED DIAGNOSTICS CONDITION 1 @stacked_msg = MESSAGE_TEXT; END; INSERT INTO t1 VALUES(val); END Stored Routines: example 41
- 72. • We will use this procedure CREATE DEFINER=‘root‘@‘localhost‘ PROCEDURE ‘sp_test‘(val int) BEGIN DECLARE CONTINUE HANDLER FOR 1364, 1048, 1366 BEGIN INSERT IGNORE INTO t1 VALUES(’Some string’); GET STACKED DIAGNOSTICS CONDITION 1 @stacked_state = RETURNED_SQLSTATE; GET STACKED DIAGNOSTICS CONDITION 1 @stacked_msg = MESSAGE_TEXT; END; INSERT INTO t1 VALUES(val); END • When HANDLER called? Stored Routines: example 41
- 73. mysql> call sp_test(1); Query OK, 1 row affected (0.07 sec) mysql> select thread_id, event_name, sql_text from events_statements_history -> where event_name like ’statement/sp%’; +-----------+-------------------------+----------------------------+ | thread_id | event_name | sql_text | +-----------+-------------------------+----------------------------+ | 24 | statement/sp/hpush_jump | NULL | | 24 | statement/sp/stmt | INSERT INTO t1 VALUES(val) | | 24 | statement/sp/hpop | NULL | +-----------+-------------------------+----------------------------+ 3 rows in set (0.00 sec) Correct Value 42
- 74. mysql> call sp_test(NULL); Query OK, 1 row affected (0.07 sec) mysql> select thread_id, event_name, sql_text from events_statements_history -> where event_name like ’statement/sp%’; +-----------+-------------------------+-------------------------------------------+ | thread_id | event_name | sql_text | +-----------+-------------------------+-------------------------------------------+ | 24 | statement/sp/hpush_jump | NULL | | 24 | statement/sp/stmt | INSERT INTO t1 VALUES(val) | | 24 | statement/sp/stmt | INSERT IGNORE INTO t1 VALUES(’Some str... | | 24 | statement/sp/stmt | GET STACKED DIAGNOSTICS CONDITION 1 @s... | | 24 | statement/sp/stmt | GET STACKED DIAGNOSTICS CONDITION 1 @s... | | 24 | statement/sp/hreturn | NULL | | 24 | statement/sp/hpop | NULL | +-----------+-------------------------+-------------------------------------------+ 7 rows in set (0.00 sec) HANDLER call 43
- 75. • Start the task Stored Routines: practice 44
- 76. • Inside MySQL client CALL help_task()G CALL help_solve()G CALL task_prepare(); • We need to find out why procedure takes different time each run • For better output set pager to less: mysql> P less Stored Routines: practice 44
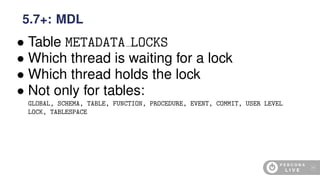
- 78. • Table METADATA LOCKS 5.7+: MDL 46
- 79. • Table METADATA LOCKS • Which thread is waiting for a lock 5.7+: MDL 46
- 80. • Table METADATA LOCKS • Which thread is waiting for a lock • Which thread holds the lock 5.7+: MDL 46
- 81. • Table METADATA LOCKS • Which thread is waiting for a lock • Which thread holds the lock • Not only for tables: GLOBAL, SCHEMA, TABLE, FUNCTION, PROCEDURE, EVENT, COMMIT, USER LEVEL LOCK, TABLESPACE 5.7+: MDL 46
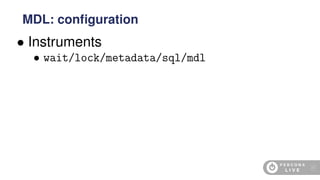
- 82. • Instruments • wait/lock/metadata/sql/mdl MDL: configuration 47
- 83. • Instruments • Consumers • METADATA LOCKS MDL: configuration 47
- 84. mysql> select processlist_id, object_type, lock_type, lock_status, source -> from metadata_locks join threads on (owner_thread_id=thread_id) -> where object_schema=’employees’ and object_name=’titles’G *************************** 1. row *************************** processlist_id: 4 object_type: TABLE lock_type: EXCLUSIVE lock_status: PENDING -- waits source: mdl.cc:3263 *************************** 2. row *************************** processlist_id: 5 object_type: TABLE lock_type: SHARED_READ lock_status: GRANTED -- holds source: sql_parse.cc:5707 METADATA LOCKS: example 48
- 85. • Start the task MDL: practice 49
- 86. • Inside MySQL client CALL help_task()G CALL help_solve()G CALL task_prepare(); • We need to find out what prevents ALTER from finishing MDL: practice 49
- 87. • Information about locks, held by engine 8.0.+: Data Locks 50
- 88. • Information about locks, held by engine • Only for engines with own locking models 8.0.+: Data Locks 50
- 89. • Information about locks, held by engine • Only for engines with own locking models • Currently only InnoDB 8.0.+: Data Locks 50
- 90. • Information about locks, held by engine • Only for engines with own locking models • Currently only InnoDB • Replacement for I S tables • INNODB LOCKS • INNODB LOCK WAITS 8.0.+: Data Locks 50
- 91. Unlike most Performance Schema data collection, there are no instruments for controlling whether data lock information is collected or system variables for controlling data lock table sizes. The Performance Schema collects information that is already available in the server, so there is no memory or CPU overhead to generate this information or need for parameters that control its collection. https://dev.mysql.com/doc/refman/8.0/en/data-locks-table.html Data Locks: configuration 51
- 92. • Which lock is held *************************** 4. row *************************** ENGINE: INNODB ENGINE_LOCK_ID: 2408:0:393:2 ENGINE_TRANSACTION_ID: 2408 THREAD_ID: 34 OBJECT_SCHEMA: test OBJECT_NAME: t INDEX_NAME: PRIMARY LOCK_TYPE: RECORD LOCK_MODE: X LOCK_STATUS: GRANTED LOCK_DATA: 12345 Table DATA LOCKS 52
- 93. • Which lock is held • Which lock is requested *************************** 2. row *************************** ENGINE: INNODB ENGINE_LOCK_ID: 2409:0:393:2 ENGINE_TRANSACTION_ID: 2409 THREAD_ID: 36 OBJECT_SCHEMA: test OBJECT_NAME: t INDEX_NAME: PRIMARY LOCK_TYPE: RECORD LOCK_MODE: X LOCK_STATUS: WAITING LOCK_DATA: 12345 Table DATA LOCKS 52
- 94. • Which lock is held • Which lock is requested • Both record-level and table level p_s> select * from data_locksG *************************** 1. row *************************** ... LOCK_TYPE: TABLE LOCK_MODE: IX LOCK_STATUS: GRANTED LOCK_DATA: NULL *************************** 2. row *************************** ... LOCK_TYPE: RECORD Table DATA LOCKS 52
- 95. • Maps lock waits with granted locks Table DATA LOCK WAITS 53
- 96. • Maps lock waits with granted locks • Only granted blocking other transactions p_s> select ENGINE, ... from data_lock_waitsG *************************** 1. row *************************** ENGINE: INNODB REQUESTING_ENGINE_LOCK_ID: 2409:0:393:2 REQUESTING_ENGINE_TRANSACTION_ID: 2409 REQUESTING_THREAD_ID: 36 BLOCKING_ENGINE_LOCK_ID: 2408:0:393:2 BLOCKING_ENGINE_TRANSACTION_ID: 2408 BLOCKING_THREAD_ID: 34 1 row in set (0,01 sec) Table DATA LOCK WAITS 53
- 97. • Partition • Subpartition • Lock data • Requesting and blocking thread id New Information 54
- 98. • View innodb lock waits In sys Schema 55
- 99. • View innodb lock waits • Takes additional information from INFORMATION SCHEMA.INNODB TRX In sys Schema 55
- 100. • View innodb lock waits sys> select locked_table, ... -> from innodb_lock_waitsG *************************** 1. row *************************** locked_table: ‘test‘.‘t‘ blocking_pid: 4 locked_index: PRIMARY blocking_query: NULL locked_type: RECORD blocking_trx_rows_locked: 1 waiting_trx_rows_locked: 1 blocking_trx_rows_modified: 1 waiting_trx_rows_modified: 0 sql_kill_blocking_query: KILL QUERY 4 waiting_pid: 6 sql_kill_blocking_connection: KILL 4 waiting_query: UPDATE t SET f=’bar’ WHERE id=12345 In sys Schema 55
- 101. • Start the task Data Locks: Practice 56
- 102. • Inside MySQL client CALL help_task()G CALL help_solve()G • We need to find • Which transaction holds the lock • What is the missed statement • Which row is locked • Which partition is locked Data Locks: Practice 56
- 103. 5.7+: Memory Usage
- 104. • Instruments mysql> select name from setup_instruments where name like ’memory%’; +-----------------------------------------------------+ | name | +-----------------------------------------------------+ ... | memory/sql/Gtid_state::group_commit_sidno_locks | | memory/sql/Mutex_cond_array::Mutex_cond | | memory/sql/TABLE_RULE_ENT | | memory/sql/Rpl_info_table | | memory/sql/Rpl_info_file::buffer | | memory/sql/db_worker_hash_entry | | memory/sql/rpl_slave::check_temp_dir | | memory/sql/rpl_slave::command_buffer | | memory/sql/binlog_ver_1_event | | memory/sql/SLAVE_INFO | Memory: configuration 58
- 105. • Instruments • Consumers • Digest tables in Performance Schema • Views in sys schema Memory: configuration 58
- 106. • Memory, used by internal mysqld structures Memory Diagnostic 59
- 107. • Memory, used by internal mysqld structures • Aggregated by • Global • Thread • Account • Host • User Memory Diagnostic 59
- 108. • Memory, used by internal mysqld structures • Aggregated by • Global • Thread • Account • Host • User • Nice views in sys schema Memory Diagnostic 59
- 109. mysql> select thread_id tid, user, current_allocated ca, total_allocated -> from sys.memory_by_thread_by_current_bytes; +-----+-------------------------+-------------+-----------------+ | tid | user | ca | total_allocated | +-----+-------------------------+-------------+-----------------+ | 1 | sql/main | 2.53 GiB | 2.69 GiB | | 150 | [email protected] | 4.06 MiB | 32.17 MiB | | 146 | sql/slave_sql | 1.31 MiB | 1.44 MiB | | 145 | sql/slave_io | 1.08 MiB | 2.79 MiB | ... | 60 | innodb/io_read_thread | 0 bytes | 384 bytes | | 139 | innodb/srv_purge_thread | -328 bytes | 754.21 KiB | | 69 | innodb/io_write_thread | -1008 bytes | 34.28 KiB | | 68 | innodb/io_write_thread | -1440 bytes | 298.05 KiB | | 74 | innodb/io_write_thread | -1656 bytes | 103.55 KiB | | 4 | innodb/io_log_thread | -2880 bytes | 132.38 KiB | | 72 | innodb/io_write_thread | -7632 bytes | 1.10 MiB | Memory Usage by Thread 60
- 110. mysql> select * from sys.memory_by_thread_by_current_bytes -> order by current_allocated descG *************************** 1. row *************************** thread_id: 152 user: [email protected] current_count_used: 325 current_allocated: 36.00 GiB current_avg_alloc: 113.43 MiB current_max_alloc: 36.00 GiB total_allocated: 37.95 GiB ... • Find threads, eating memory, in a second! Threads Statistics 61
- 111. • memory summary by account by event name • memory summary by host by event name • memory summary by thread by event name • memory summary by user by event name • memory summary global by event name RAW Performance Schema tables 62
- 112. • memory summary by account by event name • memory summary by host by event name • memory summary by thread by event name • memory summary by user by event name • memory summary global by event name • You must enable memory instrumentation! RAW Performance Schema tables 62
- 113. • memory summary by account by event name • memory summary by host by event name • memory summary by thread by event name • memory summary by user by event name • memory summary global by event name • You must enable memory instrumentation! • sys schema includes user name RAW Performance Schema tables 62
- 114. • NAME@HOST - regular user Users in sys.memory * tables 63
- 115. • NAME@HOST - regular user • System users • sql/main • innodb/* • ... Users in sys.memory * tables 63
- 116. • NAME@HOST - regular user • System users • sql/main • innodb/* • ... • Data comes from table THREADS Users in sys.memory * tables 63
- 117. • Start the task Memory Usage: practice 64
- 118. • Inside MySQL client CALL help_task()G CALL help_solve()G CALL task_prepare(); • We need to find out how much memory uses SysBench load, running in parallel • To identify how much RAM used by whole server run select * from sys.memory_global_total; Memory Usage: practice 64
- 119. 5.7+: Replication
- 120. • Data from SHOW SLAVE STATUS available in replication * tables Major Improvements 66
- 121. • Data from SHOW SLAVE STATUS available in replication * tables • Support of Replication Channels (Multi-master slave) Major Improvements 66
- 122. • Data from SHOW SLAVE STATUS available in replication * tables • Support of Replication Channels (Multi-master slave) • More instruments for GTID Major Improvements 66
- 123. • No need to parse SHOW output SLAVE STATUS 67
- 124. • No need to parse SHOW output • Configuration • replication connection configuration • replication applier configuration SLAVE STATUS 67
- 125. • No need to parse SHOW output • Configuration • IO thread • replication connection status SLAVE STATUS 67
- 126. • No need to parse SHOW output • Configuration • IO thread • SQL thread • replication applier status • replication applier status by coordinator - MTS only • replication applier status by worker • replication applier global filters • replication applier filters SLAVE STATUS 67
- 127. • No need to parse SHOW output • Configuration • IO thread • SQL thread • Group replication • replication group members • replication group member stats SLAVE STATUS 67
- 128. • Configuration mysql> select * from replication_connection_configuration -> join replication_applier_configuration using(channel_name)G *************************** 1. row *************************** CHANNEL_NAME: HOST: 127.0.0.1 PORT: 13000 USER: root NETWORK_INTERFACE: AUTO_POSITION: 1 SSL_ALLOWED: NO SSL_CA_FILE: ... CHANNEL_NAME: DESIRED_DELAY: 0 SLAVE STATUS 68
- 129. • State of IO Thread mysql> select * from replication_connection_statusG *************************** 1. row *************************** CHANNEL_NAME: GROUP_NAME: SOURCE_UUID: d0753e78-14ec-11e5-b3fb-28b2bd7442fd THREAD_ID: 21 SERVICE_STATE: ON COUNT_RECEIVED_HEARTBEATS: 17 LAST_HEARTBEAT_TIMESTAMP: 2015-06-17 15:49:08 RECEIVED_TRANSACTION_SET: LAST_ERROR_NUMBER: 0 LAST_ERROR_MESSAGE: LAST_ERROR_TIMESTAMP: 0000-00-00 00:00:00 1 row in set (0.00 sec) SLAVE STATUS 69
- 130. • Coordinator thread for multiple workers mysql> select * from replication_applier_status join -> replication_applier_status_by_coordinator using(channel_name)G *************************** 1. row *************************** CHANNEL_NAME: SERVICE_STATE: ON REMAINING_DELAY: NULL COUNT_TRANSACTIONS_RETRIES: 0 THREAD_ID: 76 SERVICE_STATE: ON LAST_ERROR_NUMBER: 0 LAST_ERROR_MESSAGE: LAST_ERROR_TIMESTAMP: 0000-00-00 00:00:00.000000 LAST_PROCESSED_TRANSACTION: c634ce2d-cbb3-11e8-9532-0242cedce297:6 LAST_PROCESSED_TRANSACTION_ORIGINAL_COMMIT_TIMESTAMP: 2018-10-09 14:59:05.281818 ... Performance Schema: State of SQL Thread 70
- 131. • Coordinator thread for multiple workers • Multi-source slave mysql> select * from replication_applier_status join -> replication_applier_status_by_worker using(channel_name)G *************************** 1. row *************************** CHANNEL_NAME: master-01 SERVICE_STATE: ON REMAINING_DELAY: NULL ... LAST_APPLIED_TRANSACTION: c634ce2d-cbb3-11e8-9532-0242cedce297:7 LAST_APPLIED_TRANSACTION_ORIGINAL_COMMIT_TIMESTAMP: 2018-10-09 15:12:56.285995 ... Performance Schema: State of SQL Thread 70
- 132. • Coordinator thread for multiple workers • Multi-source slave *************************** 2. row *************************** CHANNEL_NAME: m-03 SERVICE_STATE: OFF ... LAST_ERROR_NUMBER: 1050 LAST_ERROR_MESSAGE: Worker 1 failed executing transaction ... LAST_ERROR_TIMESTAMP: 2018-10-09 15:15:14.306672 LAST_APPLIED_TRANSACTION: c63ae70c-cbb3-11e8-b634-0242cedce297:2 ... LAST_APPLIED_TRANSACTION_END_APPLY_TIMESTAMP: 2018-10-09 15:13:33.770744 APPLYING_TRANSACTION: c63ae70c-cbb3-11e8-b634-0242cedce297:3 ... Performance Schema: State of SQL Thread 70
- 133. • Coordinator thread for multiple workers • Multi-source slave • Transient Errors mysql> select * from replication_applier_status_by_worker G *************************** 1. row *************************** ... LAST_ERROR_NUMBER: 0 ... LAST_APPLIED_TRANSACTION_RETRIES_COUNT: 1 LAST_APPLIED_TRANSACTION_LAST_TRANSIENT_ERROR_NUMBER: 1205 LAST_APPLIED_TRANSACTION_LAST_TRANSIENT_ERROR_MESSAGE: Lock wait timeout exceeded; try restarting transaction LAST_APPLIED_TRANSACTION_LAST_TRANSIENT_ERROR_TIMESTAMP: 2019-05-22 01:28:57.704802 Performance Schema: State of SQL Thread 70
- 134. • RECEIVED TRANSACTION SET in table replication connection status GTID Diagnostics 71
- 135. • RECEIVED TRANSACTION SET in table replication connection status • LAST SEEN TRANSACTION in replication applier status by worker GTID Diagnostics 71
- 136. • Single-threaded slave mysql> select cs.CHANNEL_NAME, cs.SOURCE_UUID, cs.RECEIVED_TRANSACTION_SET, -> asw.LAST_APPLIED_TRANSACTION, aps.SERVICE_STATE -> from replication_connection_status cs -> join replication_applier_status_by_worker -> asw using(channel_name) join replication_applier_status aps -> using(channel_name) G *************************** 1. row *************************** CHANNEL_NAME: SOURCE_UUID: 9038967d-7164-11e6-8c88-30b5c2208a0f RECEIVED_TRANSACTION_SET: 9038967d-7164-11e6-8c88-30b5c2208a0f:1-2 LAST_APPLIED_TRANSACTION: 9038967d-7164-11e6-8c88-30b5c2208a0f:2 SERVICE_STATE: ON 1 row in set (0,00 sec) GTID: All in One Place 72
- 137. • Single-threaded slave • Multi-threaded *************************** 1. row *************************** THREAD_ID: 30 SERVICE_STATE: ON RECEIVED_TRANSACTION_SET: 9038967d-7164-11e6-8c88-30b5c2208a0f:1-3 LAST_APPLIED_TRANSACTION: ... *************************** 8. row *************************** THREAD_ID: 37 SERVICE_STATE: ON RECEIVED_TRANSACTION_SET: 9038967d-7164-11e6-8c88-30b5c2208a0f:1-3 LAST_APPLIED_TRANSACTION: 9038967d-7164-11e6-8c88-30b5c2208a0f:3 8 rows in set (0,00 sec) GTID: All in One Place 72
- 138. • Global mysql> select * from replication_applier_global_filtersG *************************** 1. row *************************** FILTER_NAME: REPLICATE_IGNORE_TABLE FILTER_RULE: test.test CONFIGURED_BY: CHANGE_REPLICATION_FILTER ACTIVE_SINCE: 2018-10-09 16:54:45.733490 1 row in set (0.00 sec) Replication Filters 73
- 139. • Global • Worker’s mysql> select * from replication_applier_filtersG *************************** 1. row *************************** CHANNEL_NAME: m-01 FILTER_NAME: REPLICATE_IGNORE_TABLE FILTER_RULE: test.test CONFIGURED_BY: CHANGE_REPLICATION_FILTER ACTIVE_SINCE: 2018-10-09 16:54:45.733490 COUNTER: 0 *************************** 2. row *************************** CHANNEL_NAME: m-03 FILTER_NAME: REPLICATE_IGNORE_TABLE FILTER_RULE: test.t1 ... Replication Filters 73
- 140. • replication group members mysql> SELECT * FROM performance_schema.replication_group_membersG *************************** 1. row *************************** CHANNEL_NAME: group_replication_applier MEMBER_ID: c26fc705-cbcc-11e8-b5b8-0242cedce297 MEMBER_HOST: delly MEMBER_PORT: 24801 MEMBER_STATE: ONLINE MEMBER_ROLE: PRIMARY MEMBER_VERSION: 8.0.12 ... Group Replication 74
- 141. • replication group members *************************** 2. row *************************** CHANNEL_NAME: group_replication_applier MEMBER_ID: f3d2feda-cbcc-11e8-9eb9-0242cedce297 MEMBER_HOST: delly MEMBER_PORT: 24802 MEMBER_STATE: RECOVERING MEMBER_ROLE: PRIMARY MEMBER_VERSION: 8.0.12 2 rows in set (0.00 sec) Group Replication 74
- 142. • replication group members • replication group member stats mysql> SELECT * FROM performance_schema.replication_group_member_statsG *************************** 1. row *************************** CHANNEL_NAME: group_replication_applier VIEW_ID: 15390963914656312:3 MEMBER_ID: 1dfa4dee-cbcd-11e8-bad1-0242cedce297 COUNT_TRANSACTIONS_IN_QUEUE: 0 COUNT_TRANSACTIONS_CHECKED: 1 COUNT_CONFLICTS_DETECTED: 0 COUNT_TRANSACTIONS_ROWS_VALIDATING: 8 ... Group Replication 74
- 143. • Tables in mysql schema • slave master info • slave relay log info • slave worker info • Join with Performance Schema tables More Diagnostic 75
- 144. • Tables in mysql schema • slave master info • slave relay log info • slave worker info • Join with Performance Schema tables • New instruments • memory • wait • stage More Diagnostic 75
- 145. • Not only replication mysql> select * from log_statusG *************************** 1. row *************************** SERVER_UUID: c634ce2c-cbb3-11e8-8900-0242cedce297 LOCAL: {"gtid_executed": "c634ce2d-cbb3-11e8-9532-0242cedce297:1-2", "binary_log_file": "binlog.000001", "binary_log_position": 620} REPLICATION: {"channels": [{"channel_name": "", "relay_log_file": "delly-relay-bin.000002", "relay_log_position": 819, "relay_master_log_file": "binlog.000001", "exec_master_log_position": 611}]} STORAGE_ENGINES: {"InnoDB": {"LSN": 19177930, "LSN_checkpoint": 19177930}} 1 row in set (0.01 sec) Table log status 76
- 146. • Not only replication • InnoDB and MyRocks Table log status 76
- 147. • Start the task Replication: practice 77
- 148. • Inside MySQL client CALL help_task()G CALL help_solve()G • To open another terminal: Ctrl+b,c • Connection commands in another terminal • Master: m • Slave: s1 • We need to find out why replication is broken and fix it Replication: practice 77
- 149. 5.7+: Variables
- 150. • Variables • global variables • session variables • user variables by thread • variables by thread Variables Instrumentation 79
- 151. • Variables • Status variables • global status • session status • status by [account|host|thread|user] Variables Instrumentation 79
- 152. • Variables • Status variables • show compatibility 56 = 0 Variables Instrumentation 79
- 153. • Same information which is in • SHOW [GLOBAL] STATUS • I S.GLOBAL VARIABLES Deprecated in 5.7 Removed in 8.0.1 • I S.SESSION VARIABLES Deprecated in 5.7 Removed in 8.0.1 Global and Session Variables 80
- 154. • Same information which is in • SHOW [GLOBAL] STATUS • I S.GLOBAL VARIABLES Deprecated in 5.7 Removed in 8.0.1 • I S.SESSION VARIABLES Deprecated in 5.7 Removed in 8.0.1 • Helps to watch session variables changes Global and Session Variables 80
- 155. • Same information which is in • SHOW [GLOBAL] STATUS • I S.GLOBAL STATUS Deprecated in 5.7 Removed in 8.0.1 • I S.SESSION STATUS Deprecated in 5.7 Removed in 8.0.1 Status Variables 81
- 156. mysql> SELECT ss.variable_name, ss.variable_value FROM session_status ss -> LEFT JOIN global_status gs USING(variable_name) -> WHERE ss.variable_value != gs.variable_value OR gs.variable_value IS NULL; +----------------------------+----------------+ | variable_name | variable_value | +----------------------------+----------------+ | Bytes_sent | 197774 | | Handler_commit | 0 | | Handler_external_lock | 44 | | Handler_read_first | 3 | | Handler_read_key | 523 | | Handler_read_next | 0 | | Handler_read_rnd_next | 7241 | | Opened_table_definitions | 0 | ... Status Variables 82
- 157. • variables by thread • status by • account • host • thread • user Possible to Group 83
- 158. • variables by thread mysql> select * from variables_by_thread where variable_name=’tx_isolation’; +-----------+---------------+-----------------+ | THREAD_ID | VARIABLE_NAME | VARIABLE_VALUE | +-----------+---------------+-----------------+ | 71 | tx_isolation | REPEATABLE-READ | | 83 | tx_isolation | REPEATABLE-READ | | 84 | tx_isolation | SERIALIZABLE | +-----------+---------------+-----------------+ 3 rows in set, 3 warnings (0.00 sec) Possible to Group 83
- 159. • variables by thread • status by mysql> select * from status_by_thread where variable_name=’Handler_write’; +-----------+---------------+----------------+ | THREAD_ID | VARIABLE_NAME | VARIABLE_VALUE | +-----------+---------------+----------------+ | 71 | Handler_write | 94 | | 83 | Handler_write | 477 | -- Most writes | 84 | Handler_write | 101 | +-----------+---------------+----------------+ 3 rows in set (0.00 sec) Possible to Group 83
- 160. • Grouped by connection • Sometimes can help to find tricky bugs with persistent connections mysql> select * from user_variables_by_thread; +-----------+---------------+----------------+ | THREAD_ID | VARIABLE_NAME | VARIABLE_VALUE | +-----------+---------------+----------------+ | 71 | baz | boo | | 84 | foo | bar | +-----------+---------------+----------------+ 2 rows in set (0.00 sec) User Variables 84
- 161. • VARIABLES INFO • Source of variable COMPILED EXPLICIT COMMAND LINE DYNAMIC • Path of option file if specified • Minimum and maximum values 8.0+: Variables Info 85
- 162. • VARIABLES INFO mysql> select * from variables_info where set_user is not nullG *************************** 1. row *************************** VARIABLE_NAME: innodb_file_per_table VARIABLE_SOURCE: DYNAMIC VARIABLE_PATH: MIN_VALUE: 0 MAX_VALUE: 0 SET_TIME: 2018-10-09 22:17:34.638459 SET_USER: root SET_HOST: localhost *************************** 2. row *************************** VARIABLE_NAME: max_allowed_packet VARIABLE_SOURCE: DYNAMIC VARIABLE_PATH: ... 8.0+: Variables Info 85
- 163. • VARIABLES INFO • Source of variable COMPILED EXPLICIT COMMAND LINE DYNAMIC • Path of option file if specified • Minimum and maximum values • No variable values in this table! 8.0+: Variables Info 85
- 164. • Start the task Variables: practice 86
- 165. • Inside MySQL client CALL help_task()G CALL help_solve()G CALL task_prepare(); • We need to watch progress of INSERT command, running by stored routine. • Note what there is parallel load, caused by SysBench. We are not interested in its statistics. Variables: practice 86
- 166. 8.0+: Errors Summary
- 167. • Traditionally aggregated • events errors summary by account by error • events errors summary by host by error • events errors summary by thread by error • events errors summary by user by error • events errors summary global by error Errors Summary Tables 88
- 168. • Traditionally aggregated • All tables have similar structure mysql> DESC events_errors_summary_global_by_error; +-------------------+---------------------+------+-----+---------------------+ | Field | Type | Null | Key | Default | +-------------------+---------------------+------+-----+---------------------+ | ERROR_NUMBER | int(11) | YES | UNI | NULL | | ERROR_NAME | varchar(64) | YES | | NULL | | SQL_STATE | varchar(5) | YES | | NULL | | SUM_ERROR_RAISED | bigint(20) unsigned | NO | | NULL | | SUM_ERROR_HANDLED | bigint(20) unsigned | NO | | NULL | | FIRST_SEEN | timestamp | YES | | 0000-00-00 00:00:00 | | LAST_SEEN | timestamp | YES | | 0000-00-00 00:00:00 | +-------------------+---------------------+------+-----+ 7 rows in set (0,03 sec) Errors Summary Tables 88
- 169. mysql> select * from events_errors_summary_by_account_by_error -> where SUM_ERROR_RAISED > 100G *************** 1. row *************** USER: root HOST: localhost ERROR_NUMBER: 1213 ERROR_NAME: ER_LOCK_DEADLOCK SQL_STATE: 40001 SUM_ERROR_RAISED: 221 SUM_ERROR_HANDLED: 0 FIRST_SEEN: 2016-09-28 01:45:09 LAST_SEEN: 2016-09-28 01:47:02 *************** 2. row *************** USER: root HOST: localhost ERROR_NUMBER: 1287 ERROR_NAME: ER_WARN_DEPRECATED_SYNTAX SQL_STATE: HY000 SUM_ERROR_RAISED: 279 SUM_ERROR_HANDLED: 0 FIRST_SEEN: 2016-09-27 23:59:49 LAST_SEEN: 2016-09-28 01:47:05 Errors Summary: Which Accounts Raise More Errors? 89
- 170. • Start the task Errors Summary: practice 90
- 171. • Inside MySQL client CALL help_task()G CALL help_solve()G • We need to find all occasions of statements with errors • Get the list all accounts which raised errors • Get the top 3 error types globally Errors Summary: practice 90
- 172. github.com/svetasmirnova/performance schema tutorial Practice: Download Code 91
- 173. Blog of MySQL developers team Mark Leith: author of sys schema Official reference manual Webinar ”Performance Schema for MySQL Troubleshooting” More information 92
- 174. Thank You to Our Sponsors 93
- 175. Rate Our Session! 94