SlideShare a Scribd company logo
Wolaita Sodo University
College of Agriculture
Department of Natural Resources
Management
Lecture Notes: Remote Sensing &
Geographic Information Systems
5. Geographic Information System
5.1 Concepts of Geographic Information System
5.1.1 Definitions and Concepts
 The GIS stands for Geographic Information System
which is a computerized system for collection, managing
and analysis of spatial or geographically referenced
data.
 Geographic - refers to the locations of the data items are
known, can be calculated in terms of geographic
coordinates or projected coordinate systems.
 Information - refers to a raw geographic data in a GIS
can be organized and analysed to extract a useful
information as coloured maps and images and also as
statistical graphics, tables which has interactive queries.
Geographic Information System… cont’d
 Data- is a raw fact about an entity or objects, people,
events etc. It lacks defined structural organization and
contextual meaning.
 Spatial data is any data that contains positional values in
relation to the earth surface.
 Information is a processed data that has a defined
organization and contextual meaning to human mind.
 Geo-information is a specific type of information related
the earth’s geographic (spatial) object, place and
phenomena.
 System - refers to that GIS is the integration of several
interrelated and linked components with different functions
and capabilities for data capture, input, manipulation,
transformation, visualisation, combination, query,
analysis, modelling and output.
Data Computer Information GIS Knowledge
GIS is a system of hardware, software, and procedures
designed to support the capture, management,
manipulation, analysis, modeling, and display of
spatially referenced data for solving complex planning
& management problems” (Rhind, 1989).
5.1.2 Components of GIS
 According to its definition, GIS consists of different
components for input, storage, analysis, display and output
of spatial data.
 It is an integration of five basic components.
1) Hardware: computers, GIS servers, networking
devices, others.
2) Software: operating systems softwares and application
softwares
3) Data: geographical and tabular (meta or attribute)
data
4) Procedure: well designed plans of activities and
practices
5) People & Users: GIS users including the specialists
and technicians to end users
Components of GIS…cont’d
 Components of Geographic Information System
GIS
5.1.3 Functions of Geographic Information System
 GIS is a computer-based system that provides a set of
capabilities and functions to handle and analyze a
georeferenced data.
1. Capture or Input
2. Data management (storage and retrieval)
3. Manipulation and analysis
4. Visualization and presentation of output
 GIS is a computerized system that facilitates the three
main phases of the data entry, analysis and
presentation of georeferenced or spatially distributed
data .
Geographic Information System…cont’d
GIS functions:
Capture (input)
Store
Query
Analyze
Display
Output
Geographic Information System…cont’d
 GIS can answer Questions such as:
o What is it…?...........................identity of entity
o Where is it?.............................spatial locations
o What has changed since…? .....change detections
o What spatial pattern exist? .......relationships
Geographic Information System…cont’d
 Geographic Information System is an interdisciplinary
subject that incorporate skills and knowledge from a
number of disciplines.
 Geography
 Cartography
 Remote sensing
 Photo-grammetry
 Surveying
 Mathematics
 Computer science and
 Statistics etc.
5.1.4 Applications of Geographic Information
System
GIS data structures and analytical techniques are
gradually being incorporated into a wide range of
management and decision-making operations.
Applications of Geographic Information System
 Different planning and design works: road networking,
drainage & water resource management
 Land and Environmental Resources Administration &
Management , Soil resource identification
 Services and facility management Ex. Tele-
communication utilities, etc
 Network analysis: transportation, vehicle routing and
scheduling
 Military and security service analysis
Applications of GIS... Cont’d
 Agriculture: Crop type mapping, precision
farming, soil types
 Business: Site selection, locational analytics,
supply chain
 Engineering: Infrastructure data maintenance,
CAD interoperability
 Environmental studies: Environmental
assessments, climate change analysis,
groundwater contamination
 Forestry: Timber management, deforestation
analysis, forest resource inventory
 Tourism Development: GPS tracking, trail and
park planning
Applications of GIS... Cont’d
 Law and crime: Investigative analysis, in-vehicle
mobile mapping, predictive policing
 Military sciences: Locational intelligence, logistics
management, spy satellites
 Public administration: Public communication, urban
and regional planning
 Real estate: Comparative real-estate analysis, market
analysis
 Transportation: Optimal route selection, noise
modeling, future travel modeling
 Water resources: Watershed delineation and
management, determining flow direction, assessing
water quality
5.2. Spatial Data & GIS
5.2.1 Spatial Data Characteristics
A geographic data has two components.
1) Spatial data
 Data that describes the location of the geographic
feature or phenomena which expressed using Earth
Coordinate Systems.
2) Non-Spatial data
 attributes or properties of geographic features are
called attribute or descriptive data/tabular data.
Spatial Data & GIS…cont’d
 Attribute data is about “what is the spatial data’’ and
it is a list or table of data arranged as rows and
columns.
 Rows are records represent a map feature which has a
unique label ID or object ID.
 Columns are fields show the characteristics of map
features such as color, ownership, magnitude etc.
Spatial Data & GIS…cont’d
 Spatial and non-spatial or attribute data
Spatial Data & GIS…cont’d
 Discrete and Continuous Spatial Data
 Discrete Spatial Data: are distinct features that have
definite boundaries and identities.
– A district, houses, towns, agricultural fields, rivers,
highways, …
 Continuous Spatial Data: has no define borders or
distinctive values, instead, a transition from one value
to another.
– Temperature, precipitation, elevation, ...
5.2.2 Spatial Data Models
What is modelling?
 Abstracted representation of the complex real world
(i.e. abstraction or simplification of reality).
 Modelling is a representation of reality in the world
either in material form (physical representation) or
symbolic form (abstract representation).
 It is the description of a real system by using
reasonable approximations.
 How we can go close towards to the reality?
Spatial Data & GIS…cont’d
 Environmental modelling is a mathematical model of
an environmental system.
 Spatial modelling is the process of defining real
world phenomena or geographic features in terms of
their characteristics and relationships (topology)
with one another.
 Spatial modeling is the process of designing a model
that represent a phenomena in the real world to the
GIS environment which suitable for our particular
purpose.
Spatial Data & GIS…cont’d
 There are two major types of spatial data models
used to store spatial data in GIS.
1) Raster Data Model:
 Spatial data model using a grid structure (equal
sized cells) to represent the continuous surface of
the earth.
 Each cell contains an attribute value and location
coordinates.
 Individual cells as building blocks for creating
images of the earth’s surface.
 Example: Satellite images, aerial photograph,
Digital elevation model etc.
Spatial Data & GIS…cont’d
 The followings are the most common raster data
formats:
1. Imagine image (*.img)
2. TIFF (Tagged Image File Format) – (e.g. *.tiff)
3. GIF (Graphic Interchange Format) – (*.gif)
4. JPEG - (Joint Photographic Experts Group) -
compresses the image file so that it takes up
less disk space.
Spatial Data & GIS…cont’d
2) Vector Data Model:
 is the representation of real world phenomena
(objects) as a discrete objects or features using points,
lines and polygons of vector data elements.
Example: topological maps and shape files etc.
 Point – represent a zero or non-dimensional object
which has only a spatial location (x , y) and attribute.
 Points can be used to model features such as a well,
building, power, pole, sample location etc.
 Line - is a one-dimensional object that has the
property of length and can be used to represent road,
streams, faults, dikes, maker beds, boundary line etc.
Spatial Data & GIS…cont’d
 Polygon –is a two-dimensional object with properties
of area and perimeter and can represent a city,
geologic formation, dike, lake etc.
 Some of the standard vector data formats are:
o Shapefile - most widely used vector data
transfer format (.shp .shx .dbf)
o HPGL - Hewlett-Packard Graphics Language.
o Autodesk’s AutoCAD Digital Exchange Format
(AutoCAD DXF).
Spatial Data & GIS…cont’d
Vector Data: shapefile extensions
Extension What it is
.dbf Attribute data file
.shp Geometry
.shx Index to geometry
.sbn, .sbx Spatial index of features
.fbn, fbx Spatial index read only features
.ain, aih Attribute Index of active fields
.xml Metadata
.avl Legend data
.prj Projection data
Spatial Data & GIS…cont’d
 Raster and vector data representation models
Spatial Data & GIS…cont’d
Data Models:
Vector model
Raster model
Spatial Data & GIS…cont’d
 Raster and vector data models and structures:
Spatial Entities Vector view Raster view
House (point)
Road (line)
Lake (area)
0 1 2 3 4 5 6 7 8 9
0
1
2
3
4
5
6
7
8
9
0 1 2 3 4 5 6 7 8 9
0
1
2
3
4
5
6
7
8
9
0 1 2 3 4 5 6 7 8 9
0
1
2
3
4
5
6
7
8
9
0 1 2 3 4 5 6 7 8 9
0
1
2
3
4
5
6
7
8
9
Roads (network)
0 1 2 3 4 5 6 7 8 9
0
1
2
3
4
5
6
7
8
9
Surface (elevation)
GIS Lecture_edited.ppt
Class activity
•Represent different
features using Vector and
raster model on a piece of
paper
₪Playing ground, Building
and road @WSU campus
Spatial Data & GIS…cont’d
Raster Data Model:
Advantages
– Simple data structure
– Easy overlay
– Various kinds of
spatial analysis
– Uniform size and
shape
– Cheaper technology
Disadvantages
– Large amount of data
– Less “pretty”
– Different scales
between layers can be
a terrible
– May lose information
due to generalization
Spatial Data & GIS…cont’d
Vector Data Model
Advantages
– Good representation
of reality
– Compact data
structure
– Topology can be
described in a network
– Accurate graphics
Disadvantages
– Complex data
structures
– Simulation may be
difficult
– Some spatial analysis
is difficult or
impossible to perform.
cont’d
5.2.3 Data Conversion Tools
 Spatial data is collected and stored in various ways
and two or more data sources may not be entirely
compatible for spatial analysis.
 GIS can convert geographic data from one structure
to another.
Spatial Data & GIS…cont’d
Data Conversion Tools
 For manipulating and analysis, all spatial data
should be stored in the same data format.
 For integrated modelling and analysis of spatial
data, all data layers should be either in vector or
raster format.
 Usually, the conversion is from vector to raster,
because commonly the raster format is used in
spatial analysis.
 Vector data are transformed to raster data by
overlaying a grid with a user-defined cell size.
Spatial Data & GIS…cont’d
Data Conversion Tools:
ERDAS Imagine ArcGIS
Cont’d
5.3. Earth Coordinate Systems
 The spatial location (position) of an object, place or
phenomena on the Earth surface or in any space can
be described using the Earth Coordinate Systems.
 Coordinate - is set of numbers that represent location
in a given reference system (x, y) in a planar
coordinate system or (x, y, z) in a three-dimensional
coordinate system.
Cont’d….
2D (x,y) 3D(x,y,z)
Cont’d…
 The determination and description of the position or
location of a place, object or phenomena requires
understanding and knowledge of the size and shape of
the Earth.
 Geodesy
- is the science concerned with determining the size
and shape of the Earth or it is the science that locates
positions on the Earth (Geodetic Glossary, 2009).
Cont’d….
 Datum is a reference system in which the coordinates of
a particular location on the earth surface can be
measured with approximately equal to the size of the
earth.
 It is a reference for measuring locations on the surface of
the earth.
 The coordinates of the origin point are fixed and all
other points are calculated from this point.
 If we change the datum, the coordinate values of the data
will change.
Reference Ellipsoids (Earth Models or Datums)
 The Earth is not a perfect sphere, but more like an
ellipsoid (Earth Model) with flattening at the poles.
 Reference ellipsoids (Earth Models or Datums) are
defined by semi-major (equatorial radius) and semi-
minor (polar radius) axes.
 Reference ellipsoids are identified by a name and often
by a year. Ex, Clarke 1880 ellipsoid is different from
WGS 1984.
Cont’d…
 A point on the surface of the ellipsoid is matched to a
particular position on the Earth surface
 It is the measurement of the position or location of a
point in relation to a reference system (datum).
ALERT!!!!!!
 Linking Earth coordinates to the
wrong datum can result in position
errors of hundreds of meters.
Cont’d…
Earth Coordinate Systems Cont’d…
 Several reference ellipsoids (Earth models) are in use by
different nations and agencies.
 The following are some of selected main ellipsoids of the
Earth.
Earth Coordinate Systems Cont’d….
 Reference ellipsoids (Earth models or Datum) can be
divided in to two categories;
A. Global Datum - refer to positions over much of the Earth
surface. The World Geodetic System 1984 (WGS 84) is a
global standard datum serves as a reference system for
measurement of spatial location for the majority of Earth
surface.
B. Regional (Local) Datum – refers to positions to specific
areas on the Earth surface. There are several local or
regional datums used currently by different nations in the
world. Ex. North American Datum (NAD 1927 based on
Clarke 1866 ellipsoid), European Datum (ED 1950),
Adindan (East African Datum based on Clarke 1880
ellipsoid) etc.
5.3.1 Types of Earth Coordinate systems
 Coordinates are used to identify locations on the earth’s
surface.
 There are two types of coordinate systems, namely:
Geographic coordinate systems and
Plane or projected coordinate systems
Earth Coordinate systems…cont’d
1) Geographic Coordinate system
 are angular coordinates (using latitude and
longitude) and they consider the true shape of
Earth.
 Geographic coordinate systems used angular unit of
measurement (degree) and are not more
convenient for most GIS applications.
Earth Coordinate systems…cont’d
 Degrees of latitude and longitude (Global Reference
System) are used to locate exact positions on the surface
of the globe.
 Degree of latitude is used for the curved degrees of Earth
to measure north and south of the equator (0 - 90
degrees).
 Degrees of longitude measure east and west of the Prime
Meridian (0-180 degrees). The Prime Meridian is
currently based on Greenwich, England.
 Degrees of longitude also measure time, where 15
degrees of longitude is equal to one hour.
Earth Coordinate systems…cont’d
2) Plane or projected coordinate systems
 are rectangular coordinate system that result from
the transformation of geographic coordinate
systems to a two dimensional surface.
 Projection is the method by which the curved
surface is converted into a flat representation.
 Projected coordinate systems used metric system
of measurement and are widely important of
spatial analysis in most GIS applications.
5.3.2 Map projections
 In order to map the Earth’s surface, it must be
transformed from a three-dimensional surface to a
two-dimensional surface.
 This transformation, using a mathematical conversion,
is referred to as a map projection.
 A map projection is a system in which locations on the
curved surface of the earth are displayed on a flat
surface according to some set of rules.
 Mathematically, projection is a process of
transforming the global Earth surface (3D) to a
planar position (2D).
Map projections Cont’d…
 There are three types of map projections:
1) Cylinderical projection
2) Conical projection and
3) Azimuthal (planar)projection
Map projections cont’d…
 The ellipsoidal geometry of the Earth cannot be simply
transformed (represented) on a flat map without
introducing distortion.
 The distortion of a map will occur in one or more
properties of distance, area, angle and shape.
 Can you peel an orange without any distortion?
Map projections cont’d…
 All projections distort distances, areas, angles and
shape of the earth.
 There is no absolute single map projection which is
free from distortion.
Map projections cont’d…
 Projections can be classified according to their
preserved property such as Distance, Area, Angle and
Shape.
 Equal area projections - preserve the area features
other properties such as shape, angle and scale are
distorted.
 Equidistant projections - preserve the distances
between certain points.
 Conformal projections - preserve local shape.
Map projections cont’d…
 Conic (Albers Equal Area, Lambert, Conformal Conic) -
good for East-West land areas.
 Cylindrical (Transverse Mercator) - good for North-South
land areas
 Azimuthal (Lambert Azimuthal Equal Area) - good for
global views.
 The selection of appropriate map projection depends on:
o Location of the earth surface
o Purpose of map projection etc.
Universel Transverse Mercator (UTM)
 Developed in the late 1940s by the US Army.
 The projection is the equal distance cylindrical
projection.
 Intended for mapping areas between : 840 North –
800 South.
 Unit of measure is meter.
 The world is divided into 60 zones of 60 of longitude in
width and Zone 01 starts at 1800 W and each zone has its
own coordinate system.
 A second zoning is made along the latitudes following 80
intervals (except the northern most zone 120) they are given
letters from C, D, E, …
Universel Transverse Mercator (UTM)
5.3.3 Georeferencing
• Raster data is obtained by scanning maps or satellite
• Such dataset doesn’t normally contain spatial reference
information (either embedded in the file or as separate
file)
• With satellite image, sometimes the location information
delivered with them is not adequate, and the data
doesn’t align properly with the data you have
• Thus, to use some raster datasets in conjunction with
your other spatial data you may need to align (the so
called georeferencing) them to a map coordinate
system.
• A map coordinate system is defined using a map
projection ( a method by which the curved surface of the
earth is portrayed on a flat surface).
Cont’d
• Georeferencing transforms image/map from geometric
coordinate system to geographic coordinate system using
base map/image having geographic coordinate system.
• A common method georeferencing/geometric
correction/image registration is to statistically find a
polynomial of a given order that minimizes the error in
transformation from the original image coordinate to the
rectified image coordinate
• The Transformation is found by performing a least square
fit for the coefficient of the given polynomial using GCP
that are picked by the user
 First order (conformal)
 Second order (affine)
 Third order polynomial
Cont’d
• Number of GCP required
• [(P+1)(P+2)]/2, where P refers to order
Model order Minimum number of GCP
1 3
2 6
3 10
4 15
5 21
 Once the transformation is found, it is applied for every
pixel in the image.
 The other operation to be performed after transformation is
determining pixel value
 This is accomplished by Resampling (techniques: nearest
neighbor, bilinear or cubic convolution)
5.3.4 Digitization
 The process of converting the coordinate from map,
image and other resources in to a digital format in a GIS
environment.
 Hardcopy digitizing (using special pointer) and On screen
digitization (after scanning)
Digitization terminology
• Node: the start and end point of line
• Vertex: intermediate point defining the shape
• Point mode: next point is connected with the previous
point with the shortest line
• Stream mode: Points are based on the path of the mouse
pointer
Cont’d
Digitization error
• Incorrect point placement means incorrect capture of coordinate
• Error is greater at small scale
 Errors due to unsteady hand
 Switchback: extra node in a line
 Knots: line cross over
 Loops: nodes forming loops
 Dangle nodes/lines: two lines not connected
 Overshoot: Node goes beyond the line
 Undershoot: Node not connected to the line
 Sliver: polygon overlap
 Pseudo node : Extra node on top of another
 No node: line crossover without node
GIS Lecture_edited.ppt
Cont’d
Snapping
• Process of automatically setting nearby points to
have the same coordinate
• Snap tolerance or snap distance is the upper limit
of distance required between features for
snapping
Node snapping: snap node to nearby node
Line snapping: snap node to nearby line( also called
edge snapping)
Cont’d
5.4 Spatial Analysis
5.4.1 Concept of Topology
• Topology in GIS is described as the spatial
relationship between adjacent features or
neighboring feature.
• Allow GIS specialist to discover vector data
relationships between and with in layers.
• It can also be defined as: a collection of rules
that, coupled with set of editing tools and
techniques, enables the geo-database to more
accurately model geometric relationships.
Cont’d
• It creates relationship b/n adjacent polygons
(boundary is shared & stored once for both
compared to boundary digitized twice for both
features)
• No topology eg….Spaghetti model…you can pick
one nodule separately
• Through planar enforcement, spatial features
can be represented through nodes (0-
dimentinal), edges or arcs (1-dimensional) and
polygons (2-dimensional)
Cont’d
• Because features can exist on a plane, lines that
cross are broken in to separate lines that
terminate at nodes representing intersections
rather than simple vertices.
• In GIS topology is implemented through data
structure.
Advantage of Topological data structure
• Provide an automated way to handle digitizing
and editing errors/artifacts
• Reduce data storage for polygon boundaries of
adjacent features
Cont’d
• Enable advanced spatial analysis such as
adjacency, connectivity and containment/control
(COVID-19 case)
• Topology contains space filling and non
overlapping polygons. Artifacts are no more
required in GIS b/c these create additional
feature or polygon (un necessary)
• Topology is fundamentally used to ensure data
quality
Generally, topologically defined data structure
will ease spatial analysis task (Area, perimeter,
overlay, dissolve etc)
Cont’d
Ways that features share geometry in topology (
can be handled in geo-database topology)
• Area feature can share boundaries (polygon
topology)
• Line feature can share end nodes (node
topology)
• Line features can share segments with other line
features
• Area feature can be coincident with other area
feature eg: parcels can nest with in blocks
5.4.2 Definition of Spatial Analysis
 Spatial analysis is the process of modelling,
examining, interpreting and extracting
information about a set of geographic features.
 Spatial analysis requires both the locations and
attributes of spatial features (objects).
 It is the crucial step of using GIS.
 Spatial analysis provides the techniques that
enable the representation, description,
measurement, comparison, and generation of
spatial patterns (topology) between spatial
features or objects. Spatial Analysis
9/6/2022 70
Cont’d
Spatial Analysis: Analytical operation
• Data selection/Query/Retrieval
• Re classification
• Buffer generation
• Overlay Operation
• Measurement
• Neigh-bourhood operation
• Connectivity operation
Cont’d
Data selection/Query/Retrieval
• Generally the data Query is done on attribute
table (from the table one single query by setting
condition or Query the whole recording) and
finally retrieve the desired data
Two types of Query:
• Attribute Query: Involves processing of attribute
data
• Spatial Query: Selecting the feature based on
their location or spatial relationship (drawing a
line, circle or rectangle around the feature)
Cont’d
Mind here, during selection/Query/Retrieval
• (Linked) spatial and attribute data are retrieved
• No changes are made to the spatial location of
elements
• No new spatial element is created
• But if we operate new task like measuring area, a
new field will be added other wise with simple
query no change at all
Cont’d
Classification
• Based on the number of classes before and after
classification there are three classification
approaches
• One to one (1:1)..the same number of classes
• Many to one (M:1)…number of class is different
• One to many(1:M)…number of class is different
• Re classify by splitting/merging
Buffer analysis
• It is the spatial searching based on certain
criteria/condition
• It results in area expansion of features and can be
visualized as spreading the object spatially by a
given distance.
Cont’d
Overlaying operation
• Overlay analysis is operation in GIS for
superimposing the multiple layer of
datasets that representing different themes
together for analyzing or identifying
relationship of each layer.
• Overlay analysis represent the composite map
by the
combination of different attribute and geometry
of datasets or entity.
Cont’d
Based on logical functions/Boolean operation
• The Boolean operators that are used in GIS for
linking two spatial selection criteria are AND
(narrows), OR (Broadens), XOR (not both), and
NOT (Excludes/Refines). "Which areas are
forested and steep?" "Which areas are forested
or steep?" "Which areas are either forested or
steep but not both at the same time?"
Cont’d
 overlay operators in common use
Point-in-area (also known as point in polygon)
Point in Polygon Overlay operation will also generate combinative
properties of
point attributes of one layer and the polygon attribute of the
analysis layer
Line-in-area (also known as line in polygon)
Line in area overlay operations need to check linear object or
attribute which will combine or merge with area layer.
Area-on-area (also known as polygon on polygon)
Concept of overlay
Map A Map B
Map C
C A B
C1 A1 B1
C2 A1 B3
C3 A2 B3
C4 A1 B2
C5 A2 B2
C6 A2 B4
A new
topology
table has
to be
construct
ed
GIS Lecture_edited.ppt
Generally...cont’d
Vector based spatial Analysis
a) Vector overlays
 Polygon to polygon, Line in polygon and
Point in polygon
b) Spatial joint operations
 Identity, intersect, union etc
c) Feature extraction operations
 Clip, erase, reselect etc
d) Feature merging operations
 Dissolve and eliminate
e) Buffer operations
Spatial Analysis
9/6/2022 87
Spatial Analysis in GIS...cont’d
Buffer Operations
 Building zone around features is a standard and very
useful GIS capability (but difficult to do manually).
 Buffers have many uses, mostly dealing with distance
from selected features.
Data Merging and Overlays
 There are many needs in GIS for combining several
themes into a single one for permanent use.
 By merging the data rather than just visually
overlaying, new themes with derived data are
constructed.
Spatial Analysis
9/6/2022 88
Spatial Analysis in GIS...cont’d
Intersect and Union
 Two of the most useful overlays are the intersect and
union operations.
 Intersect merges only the parts that share common
space (where the two themes overlap).
 Union combines all of the features involved.
 Union provides the comprehensive data merging rather
than just visual display overlay.
Spatial Analysis
9/6/2022 89
Spatial Analysis in GIS...cont’d
Clip and Erase Operations
 Clip is an option that removes a selected part of one
theme using another theme, selected features, or a
graphic.
 In effect, it is an overlay operation that uses one part
of a theme to select part of another by extraction
(cutting and removal).
Spatial Analysis
9/6/2022 90
Spatial Analysis in GIS...cont’d
Mask and Replace
 Mask is a type of clip operation in which a designated
section or set of features from one theme is used for
selecting parts of a second theme.
Spatial Analysis
9/6/2022 91
Raster based Overlay operation tools
• Arithmetic function (+, -, *, /)
• Relational function (<, >, =)
• Logical operation (AND, Or, XOr, Not)
• Conditional function (if, then ,else..)
Cont’d
• The raster data processing methods can be
classified into the following categories:
Local operations (cell by cell operation)
•
Neighborhood operation (focal operation)
•
Regional operations (Zonal operation.
• Generally a region is defined as the area with
homogeneous characteristics)
Cont’d
Raster overlays
 The use of mathematical operation is called map
algebra, which usually includes
Add,
Subtract,
Multiply,
Divide,
Exponent, and other operators.
GIS Lecture_edited.ppt
Relational function
Overlaying using AND statement
• Land use = forest AND Slope= Steep
• Output is different map
Relational and Logical function
GIS Lecture_edited.ppt
Spatial Analysis in GIS...cont’d
 Spatial analysis in GIS can be done in two ways.
A. Vector based analysis
B. Raster based analysis
 Spatial analysis is one of the most important uses of
GIS and its fundamental objectives are:
– Generation of maps
– Generation of tabular reports
– Feature extraction capabilities
Spatial Analysis
9/6/2022 99
cont’d
5.4.2 Basic types of spatial analysis
1. Single layer operations - are procedures which
correspond to queries and alterations of data that
operate on a single data layer. Example: Creating a
buffer zone, merging and dissolve etc.
2. Multi-layer (Topological overlays) - are useful for
manipulation of spatial data on multiple data layers.
- They allow to combine features from different layers
to form a new map and give new information.
3. Spatial modeling – it involves the construction of
explanatory and predictive models for statistical
testing. Ex. Generation of evapo-transpiration potential
of a region, Generating PH map of a study area etc
Spatial Analysis
9/6/2022 100
Spatial Analysis in GIS...cont’d
4. Geometric analysis – helps to calculating the
distance, area, length and perimeter, geometric
buffer analysis on a selected geographic
feature like road, flood hazard zone etc.
5. Network analysis - designed specifically for
line features organized in connected network
and applies to transportation problems and
location analysis such as school bus routing,
passenger plotting, walking distance, bus stop
optimization, optimum path finding etc.
Spatial Analysis
9/6/2022 101
Spatial Analysis in GIS...cont’d
7. Surface analysis - deals with the spatial distribution of
surface information in terms of a three-dimensional
structure (DEM, DTM etc). Example: Drainage
network analysis and water resource modeling.
8. Grid analysis – Grid analysis involves the processing of
spatial data in a regularly spaced form like latitudes and
longitudes. Example: Satellite image analysis.
9. Geostatistical Tools for Spatial Analysis – spatial
variability of regional variables.
- Variables that have an attribute value and a location in a two
or three dimensional space. Ex: temperature, rainfall etc.
Spatial Analysis
9/6/2022 102
5.4.3 Spatial Interpolation
• Spatial interpolation is the procedure of
estimating the value of properties at un sampled
sites with in the area covered by existing
observation.
• Turns raw data in to useful information
• From discrete data to continuous data/creating
surface
• The rational behind spatial interpolation is the
observation that points close to each other in
space are more likely to have similar value than
points far apart.
Spatial Analysis in GIS...cont’d
Raster interpolation
Spatial Analysis
9/6/2022 104
Spatial Analysis in GIS...cont’d
Interpolating to Raster
 Interpolation to predict values for cells from a limited
number of sample data points.
 Visiting every location is usually difficult or expensive.
 Assumption: spatially distributed objects are spatially
correlated. In other words, things close together tend to
have similar characteristics (spatial autocorrelation).
Spatial Analysis
9/6/2022 105
Interpolation techniques
Based on distance weighted interpolation
- Inverse Distance Weighted (IDW)
- Polynomial Trend Surface
- Spline
- Kriging
5.4.4 Watershed Delineation
 A watershed describes an area of land that contains a common
set of streams and rivers that all drain into a single larger body of
water, such as a larger river, a lake or an ocean.
 Watershed management is a term used to describe the process of
implementing land use practices and water management practices
to protect and improve the quality of the water and other natural
resources within a watershed by managing the use of those land
and water resources in a comprehensive manner.
 Watershed management planning is a process that results in a
plan or a blueprint of how to best protect and improve the water
quality and other natural resources in a watershed.
 Watershed delineation is a process for creating a boundary that
represents the contributing area for a specific control point or water
outlet, with the intent of characterization and analysis of portions of
a study area
Cont’d
GIS Lecture_edited.ppt
Cont’d
WHY DELINEATE
• Delineated watersheds are required for modeling
and for watershed characterization reports
• So we can characterize and investigate what is
going on in one portion of the study area versus
another.
• Delineation is part of the process known as
watershed segmentation, i.e., dividing the
watershed into discrete land and channel
segments to analyze watershed behavior
Cont’d
DELINEATION METHODS
DEM Based (Automatic Delineation)
• Water flows downhill
• Grid cell based approach
• Boundaries created automatically by computer
Manual Delineation
• Drawing watersheds by clicking on the map
• Requires underlying data for accuracy
Cont’d
• Steps in watershed delineation
Step 1 Set up your work environment. ...
Step 2 Create a depression less DEM.
Step 3 Create a flow direction grid.
Step 4 Create a flow accumulation grid.
Step 5 Create outlet (pour) points. ...
Step 6 Snapping pour points. ...
Step 8 Convert watershed raster to polygons.
Cont’d
Cont’d
Cont’d
• The flow direction value for each pixel is the direction in
which water is flowing over that pixel as it makes its way
downstream.
• The flow accumulation value for each pixel is the sum of
all flows from upstream of that pixel, that is the
accumulated value, or magnitude of the stream that flows
over that pixel.
• The Snap Pour Point tool is used to ensure the
selection of points of high accumulated flow when
delineating drainage basins using the Watershed tool.
Snap Pour Point will search within a snap distance around
the specified pour points for the cell of highest
accumulated flow and move the pour point to that
location.
Cont’d
GIS Lecture_edited.ppt
Spatial Analysis in GIS...cont’d
Hydrologic analysis functions
provide methods for describing the hydrologic
characteristics of a watershed.
Filling the depression
Flow direction
Flow accumulation
Stream networks
Reclassification
Watershed delineation
Spatial Analysis
9/6/2022 118
5.4.5 Error and Spatial Data Quality
 GIS cannot perfectly represent the real world for
many reasons since the real world is too complex and
more detail than the spatial modelling.
 The data structures or models (raster and vector)
used in GIS are not flexible to model as close as to
the reality.
 It is impossible to make a perfect representation of
the real world in spatial modelling and uncertainty is
inevitable in modelling.
cont’d
 Conceptual view of uncertainty and error in spatial
modeling
cont’d
 Spatial uncertainty: occurs when objects do not have
a discrete and well defined extent.
– Occurs when zones are classified by sharp boundaries
between them, while spatial distribution show gradual
changes in space.
 Error and uncertainty reduce the quality of a the spatial
modelling.
cont’d
 Uncertainty and error occur in a number of spatial
processes and stages. Some of these are:
o Physical measurement error
− Instruments and procedures
− Curvature of the earth
− Continental drift
o Digitizing error
− Under shoot
− Over shoot
− Duplication of line etc
o Spatial modelling
− Representation of spatial data (raster & vector)
cont’d
o Processing and analysis of spatial data
−Data conversion error
−Georeferencing and resampling
−Projection and transformation error
−Classification errors
 All spatial data contain some degree of error and in
every processing step in spatial data handling and
there are many possibilities to influence the quality of
data or products.
cont’d
 Error and uncertainty in digitizing and conversion
Content and quality of Metadata
Data Quality
 Data quality is the total characteristics of a product
that provide to satisfy the stated needs (ISO 8402).
 Quality is a function of intangible properties such as
completeness and consistency.
 Data quality refers to the relative accuracy and
precision of a particular database used for any given
application.
 Data quality is documented by the data quality
elements and tested through data quality measures that
result in data quality results.
Content and quality of Metadata
 The following are ISO 19113:2002 Geographic
Information – Quality Principles, and ISO 19114:2003
Geographic Information – Quality Evaluation Procedures
standards.
a) Completeness
b) Logical consistency
c) Positional accuracy
d) Temporal accuracy
e) Thematic accuracy
f) Purpose
g) Lineage
5.5 Introduction to GPS
• The Global Positioning System consists of 24
satellites, that circle the globe once every 12
hours, to provide worldwide position, time and
velocity information.
• GPS makes it possible to precisely identify
locations on the earth by measuring distance
from the satellites.
Cont’d
• How Does GPS Work?
• GPS satellites circle the earth twice a day in a very precise
orbit and transmit signal information to earth. GPS
receivers take this information and use triangulation to
calculate the user's exact location.
• Essentially, the GPS receiver compares the time a signal
was transmitted by a satellite with the time it was
received.
• The time difference tells the GPS receiver how far away
the satellite is.
• Now, with distance measurements from a few more
satellites, the receiver can determine the user's position
and display it on the user's electronic map.
Cont’d
• A GPS reciever must be locked on to the signal of
at least three satellites to calculate a 2D position
(latitude and longitude) and track movement.
• With four more satellites in view, the reciever can
determine the user's 3D position (latitude,
longitude and altitude).
• Once the user's position has been determined,
the GPS unit can calculate other information,
such as speed, bearing, track, trip distance,
distance to destination, sunrise and sunset time
and more.
Cont’d
• To calculate the Longitude, Latitude and Height
position, a GPS receiver precisely measures the
different speed of light (299,792 km/s) delays in
the signals coming from 4 or more satellites.
• To calculate its position, a GPS device measures
its distance (range) from multiple GPS satellites.
• The distance to each satellite is calculated, and
then using trilateration, the 3D position of the
GPS antenna is calculated.
5.6. Cartography and Map Layout
Contents
Definition of Cartography and Map
Purpose of Maps
Kind of maps
Elements of Map
131
Cartography & Map Reading
Cartography and Map Layout
 Cartography is the art of geo-visualization; a way of
sharing spatial knowledge and empowering people
through the application of good design, whether the
medium is electronic or paper, permanent or
perishable, static or dynamic.
 A map says to you, “Read me carefully, follow me
closely, and not doubt me.”
 It says, “I am the earth in the palm of your hand.
Without me, you are alone and lost.”
132
Cartography & Map Reading
Cartography and Map Layout
 Cartography - is the science and art of making maps.
 According to the International Cartographic Association :
A map is representation of objects and features or
abstract features normally to a selected scale on a two
dimensional flat surface in relation to the Earth
surface.
The art, science and technology of making maps,
including their design, compilation, construction,
projection, reproduction, use, and distribution.
133
Cartography & Map Reading
Cartography and Map Layout
 It is a picture used to describe digital or analog (soft or
hardcopy) information that shows geographic
information using well established cartographic
conventions.
Map objectives
 To share information
 Show spatial pattern and organization (relationships)
 Demonstrate results
134
Cartography & Map Reading
Kinds of Maps
 Since maps can represent anything that has a spatial
component, there are hundreds of possible map types.
However, based on their function:
– General purpose maps
– Special purpose maps and
– Thematic maps
General purpose maps (Reference or Topographic)
do not emphasize one type of feature over another.
They show a variety of geographic phenomena, all
natural and manmade features (political boundaries,
transportation lines, cities, rivers, roads etc.) and
present a general picture of an area.
They are used for reference, planning, and location.
135
Cartography & Map Reading
Kinds of Maps…cont’d
Special purpose maps
They are created for a very specific type of user and
they include geologic, road, soil, and cadastral maps.
They are usually large scale (showing a small area and
much detail), and the user is usually familiar with the
subject not the area.
Thematic maps
Sometime called special subject, statistical, distribution,
and data maps but the term thematic is more accepted.
reflects a particular theme (topic or idea), for example
political, cultural or agricultural features of an area.
136
Cartography & Map Reading
Kinds of Maps…cont’d
Thematic maps normally characterize only a single
distribution or relationship and any other information
shown (base data).
Thematic maps may be either qualitative or
quantitative.
they show some characteristic or property such as
slope or show numerical data, such as temperatures,
rainfall, or population.
137
Cartography & Map Reading
Themes or
group of
features
138
Cartography & Map Reading
Kinds of Maps
139
Cartography & Map Reading
Rules and conventions
 In designing maps there are a number of
conventions and guidelines.
 Conventions are such practices as blue for water,
red for hot, and blue for cold.
 Some of the conventions are logical. Using red for
hot, for example, is based on the idea that reds,
oranges, and yellows are warm colors and blue and
green is cool colors.
140
Cartography & Map Reading
Rules and conventions…cont’d
 Conventions - are not rules and can be ignored, but
only for good reasons.
 Example, showing a polluted river as brown would be
a reasonable “violation” of the blue-water convention.
 However, using blue for hot and red for cold creates
confusion, and coloring the oceans as orange will
make anger most map users.
141
Cartography & Map Reading
Rules and conventions…cont’d
 Color or tone is the best choices to distinguish land
and water.
 Blue for water features is the most common
convention.
 Similarly, in using symbols to represent surface
feature, Flags, Cross and Moon used to represent
Schools, Churches and Mosques in geographical
maps.
142
Cartography & Map Reading
Basic Elements of Map
The basic elements of a map includes following:
- Title
- Feature (spatial objects)
- legend
- Symbols and colors (graphic language)
- Scale
- North arrow
- Grid (projection information)
- Other elements (date etc)
143
Cartography & Map Reading
Map Layout
144
Cartography & Map Reading
Scale
Scale
Thank
you!

More Related Content

What's hot (20)

PDF
Spatial vs non spatial
Sumant Diwakar
 
PPTX
TYBSC IT PGIS Unit V Data Visualization
Arti Parab Academics
 
PPTX
Spatial analysis and modeling
Tolasa_F
 
PDF
Satellite Image Classification with Deep Learning Survey
ijtsrd
 
PPT
Image classification, remote sensing, P K MANI
P.K. Mani
 
PDF
georeference
Thana Chirapiwat
 
PPTX
Cartography
PRAMODA G
 
PDF
Sensors for remote sensing
Mohsin Siddique
 
PPT
Change detection using remote sensing and GIS
Tilok Chetri
 
PPT
Digital image processing
Dhaval Jalalpara
 
PPTX
Introduction and Application of GIS
Satish Taji
 
PPTX
Spatial data for GIS
Al Nahian Avro
 
PDF
Aerial photographs and their interpretation
Sumant Diwakar
 
PPTX
Types of Map Scales
Lyric Treco-Hanna
 
PDF
Regional Planning Notes
Yash Shah
 
PPTX
Geographic Phenomena
PandeyABHISHEK1
 
PPTX
Thermal remote sensing
vidyasagar university
 
PPTX
Introduction to Aerial Photogrammetry
Malla Reddy University
 
PPTX
Coordinate systems
Reham Maher El-Safarini
 
Spatial vs non spatial
Sumant Diwakar
 
TYBSC IT PGIS Unit V Data Visualization
Arti Parab Academics
 
Spatial analysis and modeling
Tolasa_F
 
Satellite Image Classification with Deep Learning Survey
ijtsrd
 
Image classification, remote sensing, P K MANI
P.K. Mani
 
georeference
Thana Chirapiwat
 
Cartography
PRAMODA G
 
Sensors for remote sensing
Mohsin Siddique
 
Change detection using remote sensing and GIS
Tilok Chetri
 
Digital image processing
Dhaval Jalalpara
 
Introduction and Application of GIS
Satish Taji
 
Spatial data for GIS
Al Nahian Avro
 
Aerial photographs and their interpretation
Sumant Diwakar
 
Types of Map Scales
Lyric Treco-Hanna
 
Regional Planning Notes
Yash Shah
 
Geographic Phenomena
PandeyABHISHEK1
 
Thermal remote sensing
vidyasagar university
 
Introduction to Aerial Photogrammetry
Malla Reddy University
 
Coordinate systems
Reham Maher El-Safarini
 

Similar to GIS Lecture_edited.ppt (20)

PPTX
Geographic information system (gis)
Vandana Verma
 
PDF
2-200305220204.pdf
IIT Bombay
 
PPTX
Introduction to GIS
KU Leuven
 
PPTX
Part I - ch-1 GIS Lesson.pptx **introduction to geographic information system...
TajebeNegash
 
PPTX
Geographical Information System By Zewde Alemayehu Tilahun.pptx
zewde alemayehu
 
PPTX
Geographical information system by zewde alemayehu tilahun
zewde alemayehu
 
PPT
Introduction to GIS systems
Vivek Srivastava
 
PPTX
Unit 4 Data Input and Analysis.pptx
e20ag004
 
PPT
Chap1 introduction to geographic information system (gis)
Mweemba Hachita
 
PPTX
Data Input and Analysis.pptx engineering
rajabarath333
 
PPTX
Intro of geographic info system
Janak Parmar
 
PDF
Introduction to gis
FranklinOgwankwa
 
PPTX
GIS and Its Components.pptx
Dr. B. Sarkar, Dinhata College
 
PPTX
Introduction to GIS.pptx
Xian shiyou university
 
PPT
Intro to GIS and Remote Sensing
John Reiser
 
PPT
Gis Geographical Information System Fundamentals
Uroosa Samman
 
PPT
Gis Concepts 1/5
CIER Facultad de Agronomía
 
PPTX
UNIt 6.pptxkkkkkkkkkkkkkkkkkkkkkkkkkkkkkkkkkkkkk
Mrunmayee Manjari
 
PDF
Basic of gis concept and theories
Mohsin Siddique
 
PPTX
TYBSC IT PGIS Unit I Chapter I- Introduction to Geographic Information Systems
Arti Parab Academics
 
Geographic information system (gis)
Vandana Verma
 
2-200305220204.pdf
IIT Bombay
 
Introduction to GIS
KU Leuven
 
Part I - ch-1 GIS Lesson.pptx **introduction to geographic information system...
TajebeNegash
 
Geographical Information System By Zewde Alemayehu Tilahun.pptx
zewde alemayehu
 
Geographical information system by zewde alemayehu tilahun
zewde alemayehu
 
Introduction to GIS systems
Vivek Srivastava
 
Unit 4 Data Input and Analysis.pptx
e20ag004
 
Chap1 introduction to geographic information system (gis)
Mweemba Hachita
 
Data Input and Analysis.pptx engineering
rajabarath333
 
Intro of geographic info system
Janak Parmar
 
Introduction to gis
FranklinOgwankwa
 
GIS and Its Components.pptx
Dr. B. Sarkar, Dinhata College
 
Introduction to GIS.pptx
Xian shiyou university
 
Intro to GIS and Remote Sensing
John Reiser
 
Gis Geographical Information System Fundamentals
Uroosa Samman
 
Gis Concepts 1/5
CIER Facultad de Agronomía
 
UNIt 6.pptxkkkkkkkkkkkkkkkkkkkkkkkkkkkkkkkkkkkkk
Mrunmayee Manjari
 
Basic of gis concept and theories
Mohsin Siddique
 
TYBSC IT PGIS Unit I Chapter I- Introduction to Geographic Information Systems
Arti Parab Academics
 
Ad

More from amanueltafese2 (20)

PPTX
Chapter_4_Marketing_Mix_Price,_Product,_Promotion_and_Place.pptx
amanueltafese2
 
PPTX
Part III-Managerial Accounting.pptx
amanueltafese2
 
PPT
Part I - Financial Accounting.ppt
amanueltafese2
 
PPTX
Chapter 6 - Market Research.pptx
amanueltafese2
 
PPTX
Chapter 3- Strategic Marketing Planning Edited.pptx
amanueltafese2
 
PPTX
Presentation2.pptx
amanueltafese2
 
PPTX
Dr. umer.pptx
amanueltafese2
 
PPT
chem 576...1 ppt.ppt
amanueltafese2
 
PPTX
Lecture Note Chapter 3 & 4.pptx
amanueltafese2
 
PPTX
network design chapter 4(1).pptx
amanueltafese2
 
PPTX
NETWORK DESIGNchapter5 part1.pptx
amanueltafese2
 
PPTX
NETWORK DESIGN CHAPTER 1(1).pptx
amanueltafese2
 
PDF
stereochemistry-1.pdf
amanueltafese2
 
PPTX
aman ppfa - Copy.pptx
amanueltafese2
 
PPTX
Abebe project proposal.pptx
amanueltafese2
 
PPTX
Presentation1 GLC.pptx
amanueltafese2
 
PPT
Organozinc_compound.ppt
amanueltafese2
 
PPT
Organozinc_compound.ppt
amanueltafese2
 
PPT
SEMINARPAPER.ppt
amanueltafese2
 
PPTX
asss,narm.pptx
amanueltafese2
 
Chapter_4_Marketing_Mix_Price,_Product,_Promotion_and_Place.pptx
amanueltafese2
 
Part III-Managerial Accounting.pptx
amanueltafese2
 
Part I - Financial Accounting.ppt
amanueltafese2
 
Chapter 6 - Market Research.pptx
amanueltafese2
 
Chapter 3- Strategic Marketing Planning Edited.pptx
amanueltafese2
 
Presentation2.pptx
amanueltafese2
 
Dr. umer.pptx
amanueltafese2
 
chem 576...1 ppt.ppt
amanueltafese2
 
Lecture Note Chapter 3 & 4.pptx
amanueltafese2
 
network design chapter 4(1).pptx
amanueltafese2
 
NETWORK DESIGNchapter5 part1.pptx
amanueltafese2
 
NETWORK DESIGN CHAPTER 1(1).pptx
amanueltafese2
 
stereochemistry-1.pdf
amanueltafese2
 
aman ppfa - Copy.pptx
amanueltafese2
 
Abebe project proposal.pptx
amanueltafese2
 
Presentation1 GLC.pptx
amanueltafese2
 
Organozinc_compound.ppt
amanueltafese2
 
Organozinc_compound.ppt
amanueltafese2
 
SEMINARPAPER.ppt
amanueltafese2
 
asss,narm.pptx
amanueltafese2
 
Ad

Recently uploaded (20)

PPTX
Explorando Recursos do Summer '25: Dicas Essenciais - 02
Mauricio Alexandre Silva
 
PDF
Federal dollars withheld by district, charter, grant recipient
Mebane Rash
 
PPTX
How to Configure Storno Accounting in Odoo 18 Accounting
Celine George
 
PPT
digestive system for Pharm d I year HAP
rekhapositivity
 
PPTX
CONVULSIVE DISORDERS: NURSING MANAGEMENT.pptx
PRADEEP ABOTHU
 
PPTX
How to Configure Lost Reasons in Odoo 18 CRM
Celine George
 
PDF
CONCURSO DE POESIA “POETUFAS – PASSOS SUAVES PELO VERSO.pdf
Colégio Santa Teresinha
 
PPTX
Pyhton with Mysql to perform CRUD operations.pptx
Ramakrishna Reddy Bijjam
 
PPTX
HYDROCEPHALUS: NURSING MANAGEMENT .pptx
PRADEEP ABOTHU
 
PPSX
HEALTH ASSESSMENT (Community Health Nursing) - GNM 1st Year
Priyanshu Anand
 
PDF
IMP NAAC-Reforms-Stakeholder-Consultation-Presentation-on-Draft-Metrics-Unive...
BHARTIWADEKAR
 
PPTX
How to Create Rental Orders in Odoo 18 Rental
Celine George
 
PDF
ARAL_Orientation_Day-2-Sessions_ARAL-Readung ARAL-Mathematics ARAL-Sciencev2.pdf
JoelVilloso1
 
PDF
ARAL-Orientation_Morning-Session_Day-11.pdf
JoelVilloso1
 
PDF
BÀI TẬP BỔ TRỢ TIẾNG ANH 8 - GLOBAL SUCCESS - CẢ NĂM - NĂM 2024 (VOCABULARY, ...
Nguyen Thanh Tu Collection
 
PPTX
Optimizing Cancer Screening With MCED Technologies: From Science to Practical...
i3 Health
 
PPTX
Optimizing Cancer Screening With MCED Technologies: From Science to Practical...
i3 Health
 
PPTX
Gall bladder, Small intestine and Large intestine.pptx
rekhapositivity
 
PPTX
LEGAL ASPECTS OF PSYCHIATRUC NURSING.pptx
PoojaSen20
 
PPTX
How to Manage Promotions in Odoo 18 Sales
Celine George
 
Explorando Recursos do Summer '25: Dicas Essenciais - 02
Mauricio Alexandre Silva
 
Federal dollars withheld by district, charter, grant recipient
Mebane Rash
 
How to Configure Storno Accounting in Odoo 18 Accounting
Celine George
 
digestive system for Pharm d I year HAP
rekhapositivity
 
CONVULSIVE DISORDERS: NURSING MANAGEMENT.pptx
PRADEEP ABOTHU
 
How to Configure Lost Reasons in Odoo 18 CRM
Celine George
 
CONCURSO DE POESIA “POETUFAS – PASSOS SUAVES PELO VERSO.pdf
Colégio Santa Teresinha
 
Pyhton with Mysql to perform CRUD operations.pptx
Ramakrishna Reddy Bijjam
 
HYDROCEPHALUS: NURSING MANAGEMENT .pptx
PRADEEP ABOTHU
 
HEALTH ASSESSMENT (Community Health Nursing) - GNM 1st Year
Priyanshu Anand
 
IMP NAAC-Reforms-Stakeholder-Consultation-Presentation-on-Draft-Metrics-Unive...
BHARTIWADEKAR
 
How to Create Rental Orders in Odoo 18 Rental
Celine George
 
ARAL_Orientation_Day-2-Sessions_ARAL-Readung ARAL-Mathematics ARAL-Sciencev2.pdf
JoelVilloso1
 
ARAL-Orientation_Morning-Session_Day-11.pdf
JoelVilloso1
 
BÀI TẬP BỔ TRỢ TIẾNG ANH 8 - GLOBAL SUCCESS - CẢ NĂM - NĂM 2024 (VOCABULARY, ...
Nguyen Thanh Tu Collection
 
Optimizing Cancer Screening With MCED Technologies: From Science to Practical...
i3 Health
 
Optimizing Cancer Screening With MCED Technologies: From Science to Practical...
i3 Health
 
Gall bladder, Small intestine and Large intestine.pptx
rekhapositivity
 
LEGAL ASPECTS OF PSYCHIATRUC NURSING.pptx
PoojaSen20
 
How to Manage Promotions in Odoo 18 Sales
Celine George
 

GIS Lecture_edited.ppt

  • 1. Wolaita Sodo University College of Agriculture Department of Natural Resources Management Lecture Notes: Remote Sensing & Geographic Information Systems
  • 2. 5. Geographic Information System 5.1 Concepts of Geographic Information System 5.1.1 Definitions and Concepts  The GIS stands for Geographic Information System which is a computerized system for collection, managing and analysis of spatial or geographically referenced data.  Geographic - refers to the locations of the data items are known, can be calculated in terms of geographic coordinates or projected coordinate systems.  Information - refers to a raw geographic data in a GIS can be organized and analysed to extract a useful information as coloured maps and images and also as statistical graphics, tables which has interactive queries.
  • 3. Geographic Information System… cont’d  Data- is a raw fact about an entity or objects, people, events etc. It lacks defined structural organization and contextual meaning.  Spatial data is any data that contains positional values in relation to the earth surface.  Information is a processed data that has a defined organization and contextual meaning to human mind.  Geo-information is a specific type of information related the earth’s geographic (spatial) object, place and phenomena.  System - refers to that GIS is the integration of several interrelated and linked components with different functions and capabilities for data capture, input, manipulation, transformation, visualisation, combination, query, analysis, modelling and output.
  • 4. Data Computer Information GIS Knowledge GIS is a system of hardware, software, and procedures designed to support the capture, management, manipulation, analysis, modeling, and display of spatially referenced data for solving complex planning & management problems” (Rhind, 1989).
  • 5. 5.1.2 Components of GIS  According to its definition, GIS consists of different components for input, storage, analysis, display and output of spatial data.  It is an integration of five basic components. 1) Hardware: computers, GIS servers, networking devices, others. 2) Software: operating systems softwares and application softwares 3) Data: geographical and tabular (meta or attribute) data 4) Procedure: well designed plans of activities and practices 5) People & Users: GIS users including the specialists and technicians to end users
  • 6. Components of GIS…cont’d  Components of Geographic Information System GIS
  • 7. 5.1.3 Functions of Geographic Information System  GIS is a computer-based system that provides a set of capabilities and functions to handle and analyze a georeferenced data. 1. Capture or Input 2. Data management (storage and retrieval) 3. Manipulation and analysis 4. Visualization and presentation of output  GIS is a computerized system that facilitates the three main phases of the data entry, analysis and presentation of georeferenced or spatially distributed data .
  • 8. Geographic Information System…cont’d GIS functions: Capture (input) Store Query Analyze Display Output
  • 9. Geographic Information System…cont’d  GIS can answer Questions such as: o What is it…?...........................identity of entity o Where is it?.............................spatial locations o What has changed since…? .....change detections o What spatial pattern exist? .......relationships
  • 10. Geographic Information System…cont’d  Geographic Information System is an interdisciplinary subject that incorporate skills and knowledge from a number of disciplines.  Geography  Cartography  Remote sensing  Photo-grammetry  Surveying  Mathematics  Computer science and  Statistics etc.
  • 11. 5.1.4 Applications of Geographic Information System GIS data structures and analytical techniques are gradually being incorporated into a wide range of management and decision-making operations.
  • 12. Applications of Geographic Information System  Different planning and design works: road networking, drainage & water resource management  Land and Environmental Resources Administration & Management , Soil resource identification  Services and facility management Ex. Tele- communication utilities, etc  Network analysis: transportation, vehicle routing and scheduling  Military and security service analysis
  • 13. Applications of GIS... Cont’d  Agriculture: Crop type mapping, precision farming, soil types  Business: Site selection, locational analytics, supply chain  Engineering: Infrastructure data maintenance, CAD interoperability  Environmental studies: Environmental assessments, climate change analysis, groundwater contamination  Forestry: Timber management, deforestation analysis, forest resource inventory  Tourism Development: GPS tracking, trail and park planning
  • 14. Applications of GIS... Cont’d  Law and crime: Investigative analysis, in-vehicle mobile mapping, predictive policing  Military sciences: Locational intelligence, logistics management, spy satellites  Public administration: Public communication, urban and regional planning  Real estate: Comparative real-estate analysis, market analysis  Transportation: Optimal route selection, noise modeling, future travel modeling  Water resources: Watershed delineation and management, determining flow direction, assessing water quality
  • 15. 5.2. Spatial Data & GIS 5.2.1 Spatial Data Characteristics A geographic data has two components. 1) Spatial data  Data that describes the location of the geographic feature or phenomena which expressed using Earth Coordinate Systems. 2) Non-Spatial data  attributes or properties of geographic features are called attribute or descriptive data/tabular data.
  • 16. Spatial Data & GIS…cont’d  Attribute data is about “what is the spatial data’’ and it is a list or table of data arranged as rows and columns.  Rows are records represent a map feature which has a unique label ID or object ID.  Columns are fields show the characteristics of map features such as color, ownership, magnitude etc.
  • 17. Spatial Data & GIS…cont’d  Spatial and non-spatial or attribute data
  • 18. Spatial Data & GIS…cont’d  Discrete and Continuous Spatial Data  Discrete Spatial Data: are distinct features that have definite boundaries and identities. – A district, houses, towns, agricultural fields, rivers, highways, …  Continuous Spatial Data: has no define borders or distinctive values, instead, a transition from one value to another. – Temperature, precipitation, elevation, ...
  • 19. 5.2.2 Spatial Data Models What is modelling?  Abstracted representation of the complex real world (i.e. abstraction or simplification of reality).  Modelling is a representation of reality in the world either in material form (physical representation) or symbolic form (abstract representation).  It is the description of a real system by using reasonable approximations.  How we can go close towards to the reality?
  • 20. Spatial Data & GIS…cont’d  Environmental modelling is a mathematical model of an environmental system.  Spatial modelling is the process of defining real world phenomena or geographic features in terms of their characteristics and relationships (topology) with one another.  Spatial modeling is the process of designing a model that represent a phenomena in the real world to the GIS environment which suitable for our particular purpose.
  • 21. Spatial Data & GIS…cont’d  There are two major types of spatial data models used to store spatial data in GIS. 1) Raster Data Model:  Spatial data model using a grid structure (equal sized cells) to represent the continuous surface of the earth.  Each cell contains an attribute value and location coordinates.  Individual cells as building blocks for creating images of the earth’s surface.  Example: Satellite images, aerial photograph, Digital elevation model etc.
  • 22. Spatial Data & GIS…cont’d  The followings are the most common raster data formats: 1. Imagine image (*.img) 2. TIFF (Tagged Image File Format) – (e.g. *.tiff) 3. GIF (Graphic Interchange Format) – (*.gif) 4. JPEG - (Joint Photographic Experts Group) - compresses the image file so that it takes up less disk space.
  • 23. Spatial Data & GIS…cont’d 2) Vector Data Model:  is the representation of real world phenomena (objects) as a discrete objects or features using points, lines and polygons of vector data elements. Example: topological maps and shape files etc.  Point – represent a zero or non-dimensional object which has only a spatial location (x , y) and attribute.  Points can be used to model features such as a well, building, power, pole, sample location etc.  Line - is a one-dimensional object that has the property of length and can be used to represent road, streams, faults, dikes, maker beds, boundary line etc.
  • 24. Spatial Data & GIS…cont’d  Polygon –is a two-dimensional object with properties of area and perimeter and can represent a city, geologic formation, dike, lake etc.  Some of the standard vector data formats are: o Shapefile - most widely used vector data transfer format (.shp .shx .dbf) o HPGL - Hewlett-Packard Graphics Language. o Autodesk’s AutoCAD Digital Exchange Format (AutoCAD DXF).
  • 25. Spatial Data & GIS…cont’d Vector Data: shapefile extensions Extension What it is .dbf Attribute data file .shp Geometry .shx Index to geometry .sbn, .sbx Spatial index of features .fbn, fbx Spatial index read only features .ain, aih Attribute Index of active fields .xml Metadata .avl Legend data .prj Projection data
  • 26. Spatial Data & GIS…cont’d  Raster and vector data representation models
  • 27. Spatial Data & GIS…cont’d Data Models: Vector model Raster model
  • 28. Spatial Data & GIS…cont’d  Raster and vector data models and structures: Spatial Entities Vector view Raster view House (point) Road (line) Lake (area) 0 1 2 3 4 5 6 7 8 9 0 1 2 3 4 5 6 7 8 9 0 1 2 3 4 5 6 7 8 9 0 1 2 3 4 5 6 7 8 9 0 1 2 3 4 5 6 7 8 9 0 1 2 3 4 5 6 7 8 9 0 1 2 3 4 5 6 7 8 9 0 1 2 3 4 5 6 7 8 9 Roads (network) 0 1 2 3 4 5 6 7 8 9 0 1 2 3 4 5 6 7 8 9 Surface (elevation)
  • 30. Class activity •Represent different features using Vector and raster model on a piece of paper ₪Playing ground, Building and road @WSU campus
  • 31. Spatial Data & GIS…cont’d Raster Data Model: Advantages – Simple data structure – Easy overlay – Various kinds of spatial analysis – Uniform size and shape – Cheaper technology Disadvantages – Large amount of data – Less “pretty” – Different scales between layers can be a terrible – May lose information due to generalization
  • 32. Spatial Data & GIS…cont’d Vector Data Model Advantages – Good representation of reality – Compact data structure – Topology can be described in a network – Accurate graphics Disadvantages – Complex data structures – Simulation may be difficult – Some spatial analysis is difficult or impossible to perform.
  • 33. cont’d 5.2.3 Data Conversion Tools  Spatial data is collected and stored in various ways and two or more data sources may not be entirely compatible for spatial analysis.  GIS can convert geographic data from one structure to another.
  • 34. Spatial Data & GIS…cont’d Data Conversion Tools  For manipulating and analysis, all spatial data should be stored in the same data format.  For integrated modelling and analysis of spatial data, all data layers should be either in vector or raster format.  Usually, the conversion is from vector to raster, because commonly the raster format is used in spatial analysis.  Vector data are transformed to raster data by overlaying a grid with a user-defined cell size.
  • 35. Spatial Data & GIS…cont’d Data Conversion Tools: ERDAS Imagine ArcGIS
  • 36. Cont’d 5.3. Earth Coordinate Systems  The spatial location (position) of an object, place or phenomena on the Earth surface or in any space can be described using the Earth Coordinate Systems.  Coordinate - is set of numbers that represent location in a given reference system (x, y) in a planar coordinate system or (x, y, z) in a three-dimensional coordinate system.
  • 38. Cont’d…  The determination and description of the position or location of a place, object or phenomena requires understanding and knowledge of the size and shape of the Earth.  Geodesy - is the science concerned with determining the size and shape of the Earth or it is the science that locates positions on the Earth (Geodetic Glossary, 2009).
  • 39. Cont’d….  Datum is a reference system in which the coordinates of a particular location on the earth surface can be measured with approximately equal to the size of the earth.  It is a reference for measuring locations on the surface of the earth.  The coordinates of the origin point are fixed and all other points are calculated from this point.  If we change the datum, the coordinate values of the data will change.
  • 40. Reference Ellipsoids (Earth Models or Datums)  The Earth is not a perfect sphere, but more like an ellipsoid (Earth Model) with flattening at the poles.  Reference ellipsoids (Earth Models or Datums) are defined by semi-major (equatorial radius) and semi- minor (polar radius) axes.  Reference ellipsoids are identified by a name and often by a year. Ex, Clarke 1880 ellipsoid is different from WGS 1984.
  • 41. Cont’d…  A point on the surface of the ellipsoid is matched to a particular position on the Earth surface  It is the measurement of the position or location of a point in relation to a reference system (datum). ALERT!!!!!!  Linking Earth coordinates to the wrong datum can result in position errors of hundreds of meters.
  • 43. Earth Coordinate Systems Cont’d…  Several reference ellipsoids (Earth models) are in use by different nations and agencies.  The following are some of selected main ellipsoids of the Earth.
  • 44. Earth Coordinate Systems Cont’d….  Reference ellipsoids (Earth models or Datum) can be divided in to two categories; A. Global Datum - refer to positions over much of the Earth surface. The World Geodetic System 1984 (WGS 84) is a global standard datum serves as a reference system for measurement of spatial location for the majority of Earth surface. B. Regional (Local) Datum – refers to positions to specific areas on the Earth surface. There are several local or regional datums used currently by different nations in the world. Ex. North American Datum (NAD 1927 based on Clarke 1866 ellipsoid), European Datum (ED 1950), Adindan (East African Datum based on Clarke 1880 ellipsoid) etc.
  • 45. 5.3.1 Types of Earth Coordinate systems  Coordinates are used to identify locations on the earth’s surface.  There are two types of coordinate systems, namely: Geographic coordinate systems and Plane or projected coordinate systems
  • 46. Earth Coordinate systems…cont’d 1) Geographic Coordinate system  are angular coordinates (using latitude and longitude) and they consider the true shape of Earth.  Geographic coordinate systems used angular unit of measurement (degree) and are not more convenient for most GIS applications.
  • 47. Earth Coordinate systems…cont’d  Degrees of latitude and longitude (Global Reference System) are used to locate exact positions on the surface of the globe.  Degree of latitude is used for the curved degrees of Earth to measure north and south of the equator (0 - 90 degrees).  Degrees of longitude measure east and west of the Prime Meridian (0-180 degrees). The Prime Meridian is currently based on Greenwich, England.  Degrees of longitude also measure time, where 15 degrees of longitude is equal to one hour.
  • 48. Earth Coordinate systems…cont’d 2) Plane or projected coordinate systems  are rectangular coordinate system that result from the transformation of geographic coordinate systems to a two dimensional surface.  Projection is the method by which the curved surface is converted into a flat representation.  Projected coordinate systems used metric system of measurement and are widely important of spatial analysis in most GIS applications.
  • 49. 5.3.2 Map projections  In order to map the Earth’s surface, it must be transformed from a three-dimensional surface to a two-dimensional surface.  This transformation, using a mathematical conversion, is referred to as a map projection.  A map projection is a system in which locations on the curved surface of the earth are displayed on a flat surface according to some set of rules.  Mathematically, projection is a process of transforming the global Earth surface (3D) to a planar position (2D).
  • 50. Map projections Cont’d…  There are three types of map projections: 1) Cylinderical projection 2) Conical projection and 3) Azimuthal (planar)projection
  • 51. Map projections cont’d…  The ellipsoidal geometry of the Earth cannot be simply transformed (represented) on a flat map without introducing distortion.  The distortion of a map will occur in one or more properties of distance, area, angle and shape.  Can you peel an orange without any distortion?
  • 52. Map projections cont’d…  All projections distort distances, areas, angles and shape of the earth.  There is no absolute single map projection which is free from distortion.
  • 53. Map projections cont’d…  Projections can be classified according to their preserved property such as Distance, Area, Angle and Shape.  Equal area projections - preserve the area features other properties such as shape, angle and scale are distorted.  Equidistant projections - preserve the distances between certain points.  Conformal projections - preserve local shape.
  • 54. Map projections cont’d…  Conic (Albers Equal Area, Lambert, Conformal Conic) - good for East-West land areas.  Cylindrical (Transverse Mercator) - good for North-South land areas  Azimuthal (Lambert Azimuthal Equal Area) - good for global views.  The selection of appropriate map projection depends on: o Location of the earth surface o Purpose of map projection etc.
  • 55. Universel Transverse Mercator (UTM)  Developed in the late 1940s by the US Army.  The projection is the equal distance cylindrical projection.  Intended for mapping areas between : 840 North – 800 South.  Unit of measure is meter.  The world is divided into 60 zones of 60 of longitude in width and Zone 01 starts at 1800 W and each zone has its own coordinate system.  A second zoning is made along the latitudes following 80 intervals (except the northern most zone 120) they are given letters from C, D, E, …
  • 57. 5.3.3 Georeferencing • Raster data is obtained by scanning maps or satellite • Such dataset doesn’t normally contain spatial reference information (either embedded in the file or as separate file) • With satellite image, sometimes the location information delivered with them is not adequate, and the data doesn’t align properly with the data you have • Thus, to use some raster datasets in conjunction with your other spatial data you may need to align (the so called georeferencing) them to a map coordinate system. • A map coordinate system is defined using a map projection ( a method by which the curved surface of the earth is portrayed on a flat surface).
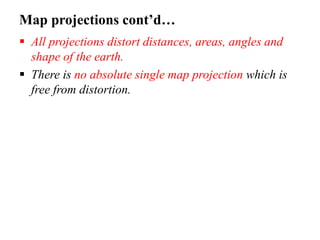
  • 58. Cont’d • Georeferencing transforms image/map from geometric coordinate system to geographic coordinate system using base map/image having geographic coordinate system. • A common method georeferencing/geometric correction/image registration is to statistically find a polynomial of a given order that minimizes the error in transformation from the original image coordinate to the rectified image coordinate • The Transformation is found by performing a least square fit for the coefficient of the given polynomial using GCP that are picked by the user  First order (conformal)  Second order (affine)  Third order polynomial
  • 59. Cont’d • Number of GCP required • [(P+1)(P+2)]/2, where P refers to order Model order Minimum number of GCP 1 3 2 6 3 10 4 15 5 21  Once the transformation is found, it is applied for every pixel in the image.  The other operation to be performed after transformation is determining pixel value  This is accomplished by Resampling (techniques: nearest neighbor, bilinear or cubic convolution)
  • 60. 5.3.4 Digitization  The process of converting the coordinate from map, image and other resources in to a digital format in a GIS environment.  Hardcopy digitizing (using special pointer) and On screen digitization (after scanning) Digitization terminology • Node: the start and end point of line • Vertex: intermediate point defining the shape • Point mode: next point is connected with the previous point with the shortest line • Stream mode: Points are based on the path of the mouse pointer
  • 61. Cont’d Digitization error • Incorrect point placement means incorrect capture of coordinate • Error is greater at small scale  Errors due to unsteady hand  Switchback: extra node in a line  Knots: line cross over  Loops: nodes forming loops  Dangle nodes/lines: two lines not connected  Overshoot: Node goes beyond the line  Undershoot: Node not connected to the line  Sliver: polygon overlap  Pseudo node : Extra node on top of another  No node: line crossover without node
  • 63. Cont’d Snapping • Process of automatically setting nearby points to have the same coordinate • Snap tolerance or snap distance is the upper limit of distance required between features for snapping Node snapping: snap node to nearby node Line snapping: snap node to nearby line( also called edge snapping)
  • 65. 5.4 Spatial Analysis 5.4.1 Concept of Topology • Topology in GIS is described as the spatial relationship between adjacent features or neighboring feature. • Allow GIS specialist to discover vector data relationships between and with in layers. • It can also be defined as: a collection of rules that, coupled with set of editing tools and techniques, enables the geo-database to more accurately model geometric relationships.
  • 66. Cont’d • It creates relationship b/n adjacent polygons (boundary is shared & stored once for both compared to boundary digitized twice for both features) • No topology eg….Spaghetti model…you can pick one nodule separately • Through planar enforcement, spatial features can be represented through nodes (0- dimentinal), edges or arcs (1-dimensional) and polygons (2-dimensional)
  • 67. Cont’d • Because features can exist on a plane, lines that cross are broken in to separate lines that terminate at nodes representing intersections rather than simple vertices. • In GIS topology is implemented through data structure. Advantage of Topological data structure • Provide an automated way to handle digitizing and editing errors/artifacts • Reduce data storage for polygon boundaries of adjacent features
  • 68. Cont’d • Enable advanced spatial analysis such as adjacency, connectivity and containment/control (COVID-19 case) • Topology contains space filling and non overlapping polygons. Artifacts are no more required in GIS b/c these create additional feature or polygon (un necessary) • Topology is fundamentally used to ensure data quality Generally, topologically defined data structure will ease spatial analysis task (Area, perimeter, overlay, dissolve etc)
  • 69. Cont’d Ways that features share geometry in topology ( can be handled in geo-database topology) • Area feature can share boundaries (polygon topology) • Line feature can share end nodes (node topology) • Line features can share segments with other line features • Area feature can be coincident with other area feature eg: parcels can nest with in blocks
  • 70. 5.4.2 Definition of Spatial Analysis  Spatial analysis is the process of modelling, examining, interpreting and extracting information about a set of geographic features.  Spatial analysis requires both the locations and attributes of spatial features (objects).  It is the crucial step of using GIS.  Spatial analysis provides the techniques that enable the representation, description, measurement, comparison, and generation of spatial patterns (topology) between spatial features or objects. Spatial Analysis 9/6/2022 70
  • 71. Cont’d Spatial Analysis: Analytical operation • Data selection/Query/Retrieval • Re classification • Buffer generation • Overlay Operation • Measurement • Neigh-bourhood operation • Connectivity operation
  • 72. Cont’d Data selection/Query/Retrieval • Generally the data Query is done on attribute table (from the table one single query by setting condition or Query the whole recording) and finally retrieve the desired data Two types of Query: • Attribute Query: Involves processing of attribute data • Spatial Query: Selecting the feature based on their location or spatial relationship (drawing a line, circle or rectangle around the feature)
  • 73. Cont’d Mind here, during selection/Query/Retrieval • (Linked) spatial and attribute data are retrieved • No changes are made to the spatial location of elements • No new spatial element is created • But if we operate new task like measuring area, a new field will be added other wise with simple query no change at all
  • 74. Cont’d Classification • Based on the number of classes before and after classification there are three classification approaches • One to one (1:1)..the same number of classes • Many to one (M:1)…number of class is different • One to many(1:M)…number of class is different • Re classify by splitting/merging
  • 75. Buffer analysis • It is the spatial searching based on certain criteria/condition • It results in area expansion of features and can be visualized as spreading the object spatially by a given distance.
  • 77. Overlaying operation • Overlay analysis is operation in GIS for superimposing the multiple layer of datasets that representing different themes together for analyzing or identifying relationship of each layer. • Overlay analysis represent the composite map by the combination of different attribute and geometry of datasets or entity.
  • 78. Cont’d Based on logical functions/Boolean operation • The Boolean operators that are used in GIS for linking two spatial selection criteria are AND (narrows), OR (Broadens), XOR (not both), and NOT (Excludes/Refines). "Which areas are forested and steep?" "Which areas are forested or steep?" "Which areas are either forested or steep but not both at the same time?"
  • 79. Cont’d  overlay operators in common use Point-in-area (also known as point in polygon) Point in Polygon Overlay operation will also generate combinative properties of point attributes of one layer and the polygon attribute of the analysis layer Line-in-area (also known as line in polygon) Line in area overlay operations need to check linear object or attribute which will combine or merge with area layer. Area-on-area (also known as polygon on polygon)
  • 81. Map A Map B Map C C A B C1 A1 B1 C2 A1 B3 C3 A2 B3 C4 A1 B2 C5 A2 B2 C6 A2 B4 A new topology table has to be construct ed
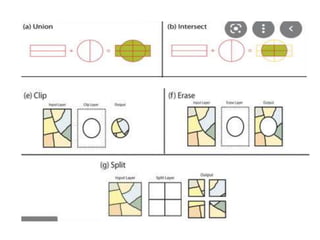
  • 87. Generally...cont’d Vector based spatial Analysis a) Vector overlays  Polygon to polygon, Line in polygon and Point in polygon b) Spatial joint operations  Identity, intersect, union etc c) Feature extraction operations  Clip, erase, reselect etc d) Feature merging operations  Dissolve and eliminate e) Buffer operations Spatial Analysis 9/6/2022 87
  • 88. Spatial Analysis in GIS...cont’d Buffer Operations  Building zone around features is a standard and very useful GIS capability (but difficult to do manually).  Buffers have many uses, mostly dealing with distance from selected features. Data Merging and Overlays  There are many needs in GIS for combining several themes into a single one for permanent use.  By merging the data rather than just visually overlaying, new themes with derived data are constructed. Spatial Analysis 9/6/2022 88
  • 89. Spatial Analysis in GIS...cont’d Intersect and Union  Two of the most useful overlays are the intersect and union operations.  Intersect merges only the parts that share common space (where the two themes overlap).  Union combines all of the features involved.  Union provides the comprehensive data merging rather than just visual display overlay. Spatial Analysis 9/6/2022 89
  • 90. Spatial Analysis in GIS...cont’d Clip and Erase Operations  Clip is an option that removes a selected part of one theme using another theme, selected features, or a graphic.  In effect, it is an overlay operation that uses one part of a theme to select part of another by extraction (cutting and removal). Spatial Analysis 9/6/2022 90
  • 91. Spatial Analysis in GIS...cont’d Mask and Replace  Mask is a type of clip operation in which a designated section or set of features from one theme is used for selecting parts of a second theme. Spatial Analysis 9/6/2022 91
  • 92. Raster based Overlay operation tools • Arithmetic function (+, -, *, /) • Relational function (<, >, =) • Logical operation (AND, Or, XOr, Not) • Conditional function (if, then ,else..)
  • 93. Cont’d • The raster data processing methods can be classified into the following categories: Local operations (cell by cell operation) • Neighborhood operation (focal operation) • Regional operations (Zonal operation. • Generally a region is defined as the area with homogeneous characteristics)
  • 94. Cont’d Raster overlays  The use of mathematical operation is called map algebra, which usually includes Add, Subtract, Multiply, Divide, Exponent, and other operators.
  • 97. Overlaying using AND statement • Land use = forest AND Slope= Steep • Output is different map Relational and Logical function
  • 99. Spatial Analysis in GIS...cont’d  Spatial analysis in GIS can be done in two ways. A. Vector based analysis B. Raster based analysis  Spatial analysis is one of the most important uses of GIS and its fundamental objectives are: – Generation of maps – Generation of tabular reports – Feature extraction capabilities Spatial Analysis 9/6/2022 99
  • 100. cont’d 5.4.2 Basic types of spatial analysis 1. Single layer operations - are procedures which correspond to queries and alterations of data that operate on a single data layer. Example: Creating a buffer zone, merging and dissolve etc. 2. Multi-layer (Topological overlays) - are useful for manipulation of spatial data on multiple data layers. - They allow to combine features from different layers to form a new map and give new information. 3. Spatial modeling – it involves the construction of explanatory and predictive models for statistical testing. Ex. Generation of evapo-transpiration potential of a region, Generating PH map of a study area etc Spatial Analysis 9/6/2022 100
  • 101. Spatial Analysis in GIS...cont’d 4. Geometric analysis – helps to calculating the distance, area, length and perimeter, geometric buffer analysis on a selected geographic feature like road, flood hazard zone etc. 5. Network analysis - designed specifically for line features organized in connected network and applies to transportation problems and location analysis such as school bus routing, passenger plotting, walking distance, bus stop optimization, optimum path finding etc. Spatial Analysis 9/6/2022 101
  • 102. Spatial Analysis in GIS...cont’d 7. Surface analysis - deals with the spatial distribution of surface information in terms of a three-dimensional structure (DEM, DTM etc). Example: Drainage network analysis and water resource modeling. 8. Grid analysis – Grid analysis involves the processing of spatial data in a regularly spaced form like latitudes and longitudes. Example: Satellite image analysis. 9. Geostatistical Tools for Spatial Analysis – spatial variability of regional variables. - Variables that have an attribute value and a location in a two or three dimensional space. Ex: temperature, rainfall etc. Spatial Analysis 9/6/2022 102
  • 103. 5.4.3 Spatial Interpolation • Spatial interpolation is the procedure of estimating the value of properties at un sampled sites with in the area covered by existing observation. • Turns raw data in to useful information • From discrete data to continuous data/creating surface • The rational behind spatial interpolation is the observation that points close to each other in space are more likely to have similar value than points far apart.
  • 104. Spatial Analysis in GIS...cont’d Raster interpolation Spatial Analysis 9/6/2022 104
  • 105. Spatial Analysis in GIS...cont’d Interpolating to Raster  Interpolation to predict values for cells from a limited number of sample data points.  Visiting every location is usually difficult or expensive.  Assumption: spatially distributed objects are spatially correlated. In other words, things close together tend to have similar characteristics (spatial autocorrelation). Spatial Analysis 9/6/2022 105
  • 106. Interpolation techniques Based on distance weighted interpolation - Inverse Distance Weighted (IDW) - Polynomial Trend Surface - Spline - Kriging
  • 107. 5.4.4 Watershed Delineation  A watershed describes an area of land that contains a common set of streams and rivers that all drain into a single larger body of water, such as a larger river, a lake or an ocean.  Watershed management is a term used to describe the process of implementing land use practices and water management practices to protect and improve the quality of the water and other natural resources within a watershed by managing the use of those land and water resources in a comprehensive manner.  Watershed management planning is a process that results in a plan or a blueprint of how to best protect and improve the water quality and other natural resources in a watershed.  Watershed delineation is a process for creating a boundary that represents the contributing area for a specific control point or water outlet, with the intent of characterization and analysis of portions of a study area
  • 110. Cont’d WHY DELINEATE • Delineated watersheds are required for modeling and for watershed characterization reports • So we can characterize and investigate what is going on in one portion of the study area versus another. • Delineation is part of the process known as watershed segmentation, i.e., dividing the watershed into discrete land and channel segments to analyze watershed behavior
  • 111. Cont’d DELINEATION METHODS DEM Based (Automatic Delineation) • Water flows downhill • Grid cell based approach • Boundaries created automatically by computer Manual Delineation • Drawing watersheds by clicking on the map • Requires underlying data for accuracy
  • 112. Cont’d • Steps in watershed delineation Step 1 Set up your work environment. ... Step 2 Create a depression less DEM. Step 3 Create a flow direction grid. Step 4 Create a flow accumulation grid. Step 5 Create outlet (pour) points. ... Step 6 Snapping pour points. ... Step 8 Convert watershed raster to polygons.
  • 115. Cont’d • The flow direction value for each pixel is the direction in which water is flowing over that pixel as it makes its way downstream. • The flow accumulation value for each pixel is the sum of all flows from upstream of that pixel, that is the accumulated value, or magnitude of the stream that flows over that pixel. • The Snap Pour Point tool is used to ensure the selection of points of high accumulated flow when delineating drainage basins using the Watershed tool. Snap Pour Point will search within a snap distance around the specified pour points for the cell of highest accumulated flow and move the pour point to that location.
  • 118. Spatial Analysis in GIS...cont’d Hydrologic analysis functions provide methods for describing the hydrologic characteristics of a watershed. Filling the depression Flow direction Flow accumulation Stream networks Reclassification Watershed delineation Spatial Analysis 9/6/2022 118
  • 119. 5.4.5 Error and Spatial Data Quality  GIS cannot perfectly represent the real world for many reasons since the real world is too complex and more detail than the spatial modelling.  The data structures or models (raster and vector) used in GIS are not flexible to model as close as to the reality.  It is impossible to make a perfect representation of the real world in spatial modelling and uncertainty is inevitable in modelling.
  • 120. cont’d  Conceptual view of uncertainty and error in spatial modeling
  • 121. cont’d  Spatial uncertainty: occurs when objects do not have a discrete and well defined extent. – Occurs when zones are classified by sharp boundaries between them, while spatial distribution show gradual changes in space.  Error and uncertainty reduce the quality of a the spatial modelling.
  • 122. cont’d  Uncertainty and error occur in a number of spatial processes and stages. Some of these are: o Physical measurement error − Instruments and procedures − Curvature of the earth − Continental drift o Digitizing error − Under shoot − Over shoot − Duplication of line etc o Spatial modelling − Representation of spatial data (raster & vector)
  • 123. cont’d o Processing and analysis of spatial data −Data conversion error −Georeferencing and resampling −Projection and transformation error −Classification errors  All spatial data contain some degree of error and in every processing step in spatial data handling and there are many possibilities to influence the quality of data or products.
  • 124. cont’d  Error and uncertainty in digitizing and conversion
  • 125. Content and quality of Metadata Data Quality  Data quality is the total characteristics of a product that provide to satisfy the stated needs (ISO 8402).  Quality is a function of intangible properties such as completeness and consistency.  Data quality refers to the relative accuracy and precision of a particular database used for any given application.  Data quality is documented by the data quality elements and tested through data quality measures that result in data quality results.
  • 126. Content and quality of Metadata  The following are ISO 19113:2002 Geographic Information – Quality Principles, and ISO 19114:2003 Geographic Information – Quality Evaluation Procedures standards. a) Completeness b) Logical consistency c) Positional accuracy d) Temporal accuracy e) Thematic accuracy f) Purpose g) Lineage
  • 127. 5.5 Introduction to GPS • The Global Positioning System consists of 24 satellites, that circle the globe once every 12 hours, to provide worldwide position, time and velocity information. • GPS makes it possible to precisely identify locations on the earth by measuring distance from the satellites.
  • 128. Cont’d • How Does GPS Work? • GPS satellites circle the earth twice a day in a very precise orbit and transmit signal information to earth. GPS receivers take this information and use triangulation to calculate the user's exact location. • Essentially, the GPS receiver compares the time a signal was transmitted by a satellite with the time it was received. • The time difference tells the GPS receiver how far away the satellite is. • Now, with distance measurements from a few more satellites, the receiver can determine the user's position and display it on the user's electronic map.
  • 129. Cont’d • A GPS reciever must be locked on to the signal of at least three satellites to calculate a 2D position (latitude and longitude) and track movement. • With four more satellites in view, the reciever can determine the user's 3D position (latitude, longitude and altitude). • Once the user's position has been determined, the GPS unit can calculate other information, such as speed, bearing, track, trip distance, distance to destination, sunrise and sunset time and more.
  • 130. Cont’d • To calculate the Longitude, Latitude and Height position, a GPS receiver precisely measures the different speed of light (299,792 km/s) delays in the signals coming from 4 or more satellites. • To calculate its position, a GPS device measures its distance (range) from multiple GPS satellites. • The distance to each satellite is calculated, and then using trilateration, the 3D position of the GPS antenna is calculated.
  • 131. 5.6. Cartography and Map Layout Contents Definition of Cartography and Map Purpose of Maps Kind of maps Elements of Map 131 Cartography & Map Reading
  • 132. Cartography and Map Layout  Cartography is the art of geo-visualization; a way of sharing spatial knowledge and empowering people through the application of good design, whether the medium is electronic or paper, permanent or perishable, static or dynamic.  A map says to you, “Read me carefully, follow me closely, and not doubt me.”  It says, “I am the earth in the palm of your hand. Without me, you are alone and lost.” 132 Cartography & Map Reading
  • 133. Cartography and Map Layout  Cartography - is the science and art of making maps.  According to the International Cartographic Association : A map is representation of objects and features or abstract features normally to a selected scale on a two dimensional flat surface in relation to the Earth surface. The art, science and technology of making maps, including their design, compilation, construction, projection, reproduction, use, and distribution. 133 Cartography & Map Reading
  • 134. Cartography and Map Layout  It is a picture used to describe digital or analog (soft or hardcopy) information that shows geographic information using well established cartographic conventions. Map objectives  To share information  Show spatial pattern and organization (relationships)  Demonstrate results 134 Cartography & Map Reading
  • 135. Kinds of Maps  Since maps can represent anything that has a spatial component, there are hundreds of possible map types. However, based on their function: – General purpose maps – Special purpose maps and – Thematic maps General purpose maps (Reference or Topographic) do not emphasize one type of feature over another. They show a variety of geographic phenomena, all natural and manmade features (political boundaries, transportation lines, cities, rivers, roads etc.) and present a general picture of an area. They are used for reference, planning, and location. 135 Cartography & Map Reading
  • 136. Kinds of Maps…cont’d Special purpose maps They are created for a very specific type of user and they include geologic, road, soil, and cadastral maps. They are usually large scale (showing a small area and much detail), and the user is usually familiar with the subject not the area. Thematic maps Sometime called special subject, statistical, distribution, and data maps but the term thematic is more accepted. reflects a particular theme (topic or idea), for example political, cultural or agricultural features of an area. 136 Cartography & Map Reading
  • 137. Kinds of Maps…cont’d Thematic maps normally characterize only a single distribution or relationship and any other information shown (base data). Thematic maps may be either qualitative or quantitative. they show some characteristic or property such as slope or show numerical data, such as temperatures, rainfall, or population. 137 Cartography & Map Reading
  • 140. Rules and conventions  In designing maps there are a number of conventions and guidelines.  Conventions are such practices as blue for water, red for hot, and blue for cold.  Some of the conventions are logical. Using red for hot, for example, is based on the idea that reds, oranges, and yellows are warm colors and blue and green is cool colors. 140 Cartography & Map Reading
  • 141. Rules and conventions…cont’d  Conventions - are not rules and can be ignored, but only for good reasons.  Example, showing a polluted river as brown would be a reasonable “violation” of the blue-water convention.  However, using blue for hot and red for cold creates confusion, and coloring the oceans as orange will make anger most map users. 141 Cartography & Map Reading
  • 142. Rules and conventions…cont’d  Color or tone is the best choices to distinguish land and water.  Blue for water features is the most common convention.  Similarly, in using symbols to represent surface feature, Flags, Cross and Moon used to represent Schools, Churches and Mosques in geographical maps. 142 Cartography & Map Reading
  • 143. Basic Elements of Map The basic elements of a map includes following: - Title - Feature (spatial objects) - legend - Symbols and colors (graphic language) - Scale - North arrow - Grid (projection information) - Other elements (date etc) 143 Cartography & Map Reading
  • 144. Map Layout 144 Cartography & Map Reading Scale Scale