WebSphere Technical University: Top WebSphere Problem Determination Features
6 likes3,189 views

The document discusses features for problem determination in IBM WebSphere Application Server, focusing on problem reduction strategies and various monitoring tools. Key features include hang detection, binary logging, memory leak detection, and server dump commands that assist in diagnosing issues. It emphasizes the importance of improving serviceability and the ability to analyze complex issues through various tools provided by IBM.


![Timed Operations
Sample logged message
[3/14/13 14:01:25:960 CDT] 00000025 TimedOperatio W
TRAS0080W: Operation
websphere.datasource.execute:jdbc/social:INSERT INTO
DB2INST1.CommentTab (comment, extension, object, time,
userid, mentionsid) VALUES (?, ?, ?, ?, ?, ?) took
16.613 ms to complete, which was longer than the
expected duration of 10.859 ms based on past
observations.
Sample automatically generated report in the log
© 2014 12 IBM Corporation](https://image.slidesharecdn.com/wtu-topwaspdfeatures-141107034105-conversion-gate02/85/WebSphere-Technical-University-Top-WebSphere-Problem-Determination-Features-12-320.jpg)


![Viewing logs and trace
Viewing logs and trace
– [Liberty] binaryLog command is used to view content from logdata / tracedata
– [Full Profile] logViewer command is used to view content from logdata /
tracedata
– displays repository content in plain text
– provides options to filter the displayed content and to choose the output format
– can be used to monitor (tail) the repositories in real time
© 2014 22 IBM Corporation](https://image.slidesharecdn.com/wtu-topwaspdfeatures-141107034105-conversion-gate02/85/WebSphere-Technical-University-Top-WebSphere-Problem-Determination-Features-22-320.jpg)


![Extensibility
Developers can add key-value pairs to log and trace records using the LogRecordContext
API
– For example, in an application hosting multiple stores, you could add the storeId to each
log and trace record in a servlet filter
– Key-value pairs appear in log output when the advanced format is used (selectable when
running the [Liberty] binaryLog / [Full Profile] logViewer command)
– Key-value pairs can be used as filter parameters in [Liberty] binaryLog / [Full Profile]
logViewer command
– [Full Profile] appName extension is provided automatically, and other extensions are
provided for thing like cross component trace, and SIP
– Liberty:
binarylog view serverName –-includeExtension=”storeId=WidgetsPlus” --format=advanced
– Full Profile:
logViewer -includeExtensions “appName=MyMall” ”storeId=WidgetsPlus” -format advanced
[11/26/13 8:15:13:495 EST] 00000074 I UOW= source=com.mymall.ServletX class=com.mymall.Serv
letX method=doGet org= prod= component= thread=[WebContainer : 0] storeId=[WidgetsPlus]
Welcome to Widget's Plus!
© 2014 37 IBM Corporation](https://image.slidesharecdn.com/wtu-topwaspdfeatures-141107034105-conversion-gate02/85/WebSphere-Technical-University-Top-WebSphere-Problem-Determination-Features-37-320.jpg)

![Using High Performance Extensible Logging / Binary Logging with SplunkTM
Option #1 (simplest) - Read from TextLog files
inputs.conf
[monitor://D:WASprofilesAppSrv01logsserver1]
whitelist=Text.*.log$
crcSalt = <SOURCE>
disabled = false
followTail = 0
index = websphere
sourcetype = WebSphere:SystemOutErrLog
© 2014 39 IBM Corporation](https://image.slidesharecdn.com/wtu-topwaspdfeatures-141107034105-conversion-gate02/85/WebSphere-Technical-University-Top-WebSphere-Problem-Determination-Features-39-320.jpg)
![Using High Performance Extensible Logging / Binary Logging with SplunkTM
Option #2 (any environment) - Read from logViewer -monitor script
inputs.conf
[script://$SPLUNK_HOMEetcsystembinrunLogViewer.cmd]
disabled = false
interval = -1
index = websphere
sourcetype = WebSphere:SystemOutErrLog
runLogViewer.cmd
call D:WASprofilesAppSrv01binlogViewer -monitor
WASbinlogViewer.cmd
change:
%JAVA_EXE% ... com.ibm.ws.logging.hpel.viewer.LogViewer %*
to:
%JAVA_EXE% -Xrs ... com.ibm.ws.logging.hpel.viewer.LogViewer %*
© 2014 40 IBM Corporation](https://image.slidesharecdn.com/wtu-topwaspdfeatures-141107034105-conversion-gate02/85/WebSphere-Technical-University-Top-WebSphere-Problem-Determination-Features-40-320.jpg)


![Understanding XCT Correlation Log Records
Correlation log records look like this example:
[4/23/12 13:54:44:509 IST] 0000008e XCT I BEGIN
AAADx/itMDz-AAAAAAAAAAA 00000000000-cccccccccc2
HTTPCF(InboundRequest /JMSApp/LocalMessageSend
RemoteAddress(127.0.0.1) RequestContext(2082603117))
<Date>: The date and time when the log record was generated
<Thread_ID>: The thread which generated this message
<XCT_Logger_Name>: The XCT logger name is XCT. This logger is used to identify the XCT Records in
the Log file
<Message_Type>: Type of the log message
<XCT_STATE>: Each XCT Record has a State, it can be BEGIN, END
<XCT_ID>: A Unique ID generated for correlating the XCT Records
<XCT_PARENT_ID>: The XCT_ID of the parent XCT context
<XCT_MESSAGE>: The XCT message contains the information about the XCT record; this can contain
some Associations and Annotations
© 2014 4499 IBM Corporation](https://image.slidesharecdn.com/wtu-topwaspdfeatures-141107034105-conversion-gate02/85/WebSphere-Technical-University-Top-WebSphere-Problem-Determination-Features-49-320.jpg)


![Leak detection messages
CWMML0015E: The web application [WasSwat#WasSwatWeb.war] created a
ThreadLocal with key of type [test.memleak.MyThreadLocal] (value
[test.memleak.MyThreadLocal@216c691]) and a value of type
[test.memleak.MyCounter] (value [test.memleak.MyCounter@21942ff])
but failed to remove it when the web application was stopped.
CWMML0010E: The web application [LeakApp#leak.war] appears to have
started a thread named [Thread-73] but has failed to stop it.
CWMML0011E: The web application [LeakApp#leak.war] appears to have
started a TimerThread named [leaked-thread] via the java.util.Timer
API but has failed to stop it.
CWMML0024W: About to interrupt thread [leakingThread] which is
currently executing
CWMML0026I: ClassLoader memory leak is fixed. Clearing leak
References succeeded for LeakApp#leak.war.
© 2014 61
IBM Corporation](https://image.slidesharecdn.com/wtu-topwaspdfeatures-141107034105-conversion-gate02/85/WebSphere-Technical-University-Top-WebSphere-Problem-Determination-Features-61-320.jpg)


![Your feedback is valuable - please complete your session
or lab evaluation!
Session number
[A6]
© 2014 IBM Corporation
Provide your evaluations by:
Evaluation forms:
Fill out a form at the end of each session
Paper forms are located in each of the session or lab rooms
Place the completed form in the tray as you exit the room
- Or –
Complete the session survey on Event Connect Portal:
ibmeventconnect.eu/euxdx
Select Sessions, then Session Finder, and complete the
survey](https://image.slidesharecdn.com/wtu-topwaspdfeatures-141107034105-conversion-gate02/85/WebSphere-Technical-University-Top-WebSphere-Problem-Determination-Features-76-320.jpg)


WebSphere Technical University: Top WebSphere Problem Determination Features
- 1. A6: Top IBM WebSphere Application Server Problem Determination Features Chris Bailey STSM, IBM Runtime Monitoring and Diagnostics
- 2. Please Note IBM’s statements regarding its plans, directions, and intent are subject to change or withdrawal without notice at IBM’s sole discretion. Information regarding potential future products is intended to outline our general product direction and it should not be relied on in making a purchasing decision. The information mentioned regarding potential future products is not a commitment, promise, or legal obligation to deliver any material, code or functionality. Information about potential future products may not be incorporated into any contract. The development, release, and timing of any future features or functionality described for our products remains at our sole discretion Performance is based on measurements and projections using standard IBM benchmarks in a controlled environment. The actual throughput or performance that any user will experience will vary depending upon many factors, including considerations such as the amount of multiprogramming in the user’s job stream, the I/O configuration, the storage configuration, and the workload processed. Therefore, no assurance can be given that an individual user will achieve results similar to those stated here. © 2014 IBM Corporation 2
- 3. Introduction to the Speaker Chris Bailey STSM, IBM Runtime Monitoring and Diagnostics Architect 14 years experience developing and deploying Java SDKs 1 years experience developing and deploying Node.js SDKs 3 Recent work focus: Java and Node.js monitoring and diagnostics Java and Node.js integration into the cloud Highly resilient and scalable deployments Requirements gathering Contact Details: [email protected] http://www.linkedin.com/in/chrisbaileyibm http://www.slideshare.net/cnbailey/ @Chris__Bailey
- 4. 4 Problem Reduction 1. Eliminate Problems remove the source of problems so that they no longer occur. For example, redesign a component to eliminate the need to configure something that customers have trouble with. 2. Improve Serviceability make it easier for customers or support to service problems when they occur. For example, provide a way for customers to quickly check to see if there are any configuration problems. Eliminate Problems Improve Serviceability Goal: Reduce total problem hours
- 5. 5 Problem Reduction Serviceability Features • Hang detection • First Failure Data Capture • High Performance Extensible Logging • Cross Component Trace • Memory Leak Detection and Prevention • Timed Operations • … Component Improvements • Security • Systems Management • Install • Plugin • Java™ and JDK • WebServices • ... Problem Determination Tools • IBM Support Assistant Team Server (with Automated Analysis) • Garbage Collection and Memory Visualizer • Memory Analyzer (with WAS extensions) • Java Health Center • Thread and Monitor Dump Analyzer • Performance Tuning Toolkit • ... Problem reduction is driven from multiple directions Component improvements reduce problem determination time for key components Serviceability features simplify problem determination across the product Problem determination tools make it easier to analyze complex issues
- 6. WAS V8.5.5 (L) Binary Logging (L) Timed Operations (L) Sensitive WAS Runtime Features Log and Trace Guard WAS V8.5.x (F) Cross Component Trace ISA DC integration (F) HPEL enhanced filtering (F) Memory leak detection and protection (L) Liberty Serviceability (logs, dumps, FFDC) 6 WAS V5.1.x Session data crossover assist Socket Connect Timeouts High Performance Extensible Logging (HPEL) JVM Serviceability Enhancements WAS V6.1.x (*) Diagnostic Providers Unique Message IDs Trigger dumps from console Sensitive log and trace guard WAS v6.0.x JSR 47 Logging Common Base Events FFDC Aspects FFDC Capability for z/OS Class Loader Viewer WAS V5.0.x FFDC Collector Summary Config Validation Connection Manager Serviceability Hang Detection in the Runtime WAS V8.0.x WAS V7.0.x (*) FFDC Improvements Diagnostic Tooling Framework for Java (DTFJ) Ongoing Serviceability Defects Process to report and address specific serviceability issues encountered in the field (*) Several tooling-related projects were delivered as WAS Line Items in WAS 6.1 and 7.0 (F)=Full Profile (L)=Liberty Profile
- 7. 7 Liberty
- 8. Liberty Problem Determination Server dump Command Server javadump Command TimedOperations Feature Binary Logging © 2014 8 IBM Corporation
- 9. Server Dump Command The server dump command is a utility you can run from the bin directory to dump and zip up important state information from the application server itself. wlpbin> server dump The server dump command collects: – Log files – Configuration information – Details of deployed applications If the server is running when the command executes, it also collects: – State of each OSGi bundle in the server – Wiring information for each OSGi bundle in the server – Component list managed by the Service Component Runtime (SCR) environment – Detailed information of each component from SCR – Configuration administration data of each OSGi bundle – Information about registered OSGi services – Runtime environment settings such as Java™ virtual machine (JVM), heap size, operating system, thread information, and network status © 2014 9 IBM Corporation
- 10. Server JavaDump Command The server javadump command is a utility you can run from the bin directory to collect javacores, heap dumps, and system cores. wlpbin> server javadump – Collects a javacore from a running server. Javacores are helpful for diagnosing hangs, 100% CPU conditions, and deadlocks. Use tools such as the Thread and Monitor Dump Analyzer available in the IBM Support Assistant to analyze javacores. wlpbin> server javadump –-include=heap – Collects a heap dump from a running server. Heap dumps are helpful for diagnosing memory leaks. Use tools such as Memory Analyzer available in the IBM Support Assistant to analyze heap dumps. wlpbin> server javadump --include=system – Collects a system core from a running server. System cores are helpful for diagnosing memory leaks, or exploring specific data in your heap address space. Use tools such as Memory Analyzer, or Interactive Diagnostic Data Explorer available in the IBM Support Assistant to analyze system cores. © 2014 10 IBM Corporation
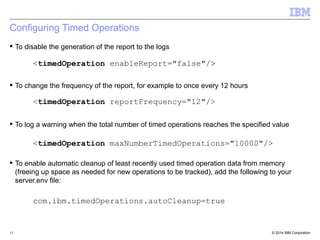
- 11. Timed Operations Timed operations is a new feature that tracks the duration of JDBC operations running in the application server –Logs a warning when operations take more or less time to execute than expected –Periodically creates a report in the application server log, detailing which operations took longest to execute – When running the server dump command, it will generate a report containing information about all operations it has tracked –The information listed in these reports can be used to decide if anything has an unusual behavior –Recommended for production environments to track slowdowns when they first occur © 2014 11 IBM Corporation
- 12. Timed Operations Sample logged message [3/14/13 14:01:25:960 CDT] 00000025 TimedOperatio W TRAS0080W: Operation websphere.datasource.execute:jdbc/social:INSERT INTO DB2INST1.CommentTab (comment, extension, object, time, userid, mentionsid) VALUES (?, ?, ?, ?, ?, ?) took 16.613 ms to complete, which was longer than the expected duration of 10.859 ms based on past observations. Sample automatically generated report in the log © 2014 12 IBM Corporation
- 13. Timed Operations Sample introspection file The description of this introspectable service: Information about the timed operations, grouped by type, and sorted within each group by expected duration --------------------------------------------------------------- Timed operations for: websphere.datasource.execute --------------------------------------------------------------- Expected duration (ms) Standard deviation (ms) Timed operation 1.204297 0.929251 websphere.datasource.execute:jdbc/TradeDS:update orderejb set holdingID = ? where orderid = ? 1.107012 1.127067 websphere.datasource.execute:jdbc/TradeDS:delete from orderejb 0.286977 0.163669 websphere.datasource.execute:jdbc/TradeDS:update orderejb set holdingid=null where holdingid = ? 0.211317 0.083466 websphere.datasource.execute:jdbc/TradeDS:delete from accountejb 0.209597 0.243975 websphere.datasource.execute:jdbc/TradeDS:update orderejb set orderstatus = ? where orderid = ? 0.201933 0.059850 websphere.datasource.execute:jdbc/TradeDS:select * from orderejb o where o.orderstatus = 'closed' 0.144153 0.052846 websphere.datasource.execute:jdbc/TradeDS:delete from holdingejb where holdingID = ? 0.143007 0.037623 websphere.datasource.execute:jdbc/TradeDS:update orderejb set holdingID = ? where orderid = ? 0.139108 0.042636 websphere.datasource.execute:jdbc/TradeDS:update accountejb set lastLogin=?, where userID=? 0.137844 0.125086 websphere.datasource.execute:jdbc/TradeDS:delete from orderejb where orderStatus='cancelled' 0.128342 0.042986 websphere.datasource.execute:jdbc/TradeDS:delete from accountprofileejb 0.114781 0.029487 websphere.datasource.execute:jdbc/TradeDS:update accountejb set balance = ? where account = ? 0.028868 0.128856 websphere.datasource.execute:jdbc/TradeDS:select * from orderejb o where o.orderid = ? 0.021680 0.008652 websphere.datasource.execute:jdbc/TradeDS:select * from quoteejb q where q.symbol=? © 2014 13 IBM Corporation
- 14. Enabling Timed Operations To enable timed operations add the following feature to your server.xml file: <feature>timedOperations-1.0</feature> To disable timed operations remove this line from your server.xml file A server restart is not required to enable or disable timed operations © 2014 14 IBM Corporation
- 15. Configuring Timed Operations To disable the generation of the report to the logs <timedOperation enableReport="false"/> To change the frequency of the report, for example to once every 12 hours <timedOperation reportFrequency="12"/> To log a warning when the total number of timed operations reaches the specified value <timedOperation maxNumberTimedOperations="10000"/> To enable automatic cleanup of least recently used timed operation data from memory (freeing up space as needed for new operations to be tracked), add the following to your server.env file: com.ibm.timedOperations.autoCleanup=true © 2014 15 IBM Corporation
- 16. Liberty and Full Profile 16
- 17. Problem Determination Capabilities in Both Liberty and Full Profile Binary Logging (Liberty) High Performance Extensible Logging (Full Profile) © 2014 17 IBM Corporation
- 18. Binary logging / High performance extensible logging High speed log and trace handling for WebSphere Application Server –Available in full profile since WAS 8.0 –Referred to as High Performance Extensible Logging (HPEL) –Available in Liberty since WAS 8.5.5 - Referred to as binary logging © 2014 18 IBM Corporation
- 19. Binary logging / High performance extensible logging Benefits –Greatly improves speed of logging and tracing –Enables you to add new fields to log and trace records –Helps you filter through logs and trace with a powerful command line tool –Provides a common solution for all supported platforms –Includes an API to read from binary repositories programmatically Notes – Stores log and trace data in a binary format – Does not require any change to your application code – Able to work with log analytics tools © 2014 19 IBM Corporation
- 20. Runtime Logs – Full Profile Full Profile - default logs trace System.out System.err SystemOut.log SystemErr.log trace.log activity.log1 Full Profile - HPEL logs trace System.out System.err logdata/ tracedata/ TextLog2 3 1activity.log is deprecated and can be disabled. 2TextLog is redundant and can be disabled if you don't need a plain text log 3Inclusion of trace content in TextLog is optional and not recommended for high performance © 2014 20 IBM Corporation
- 21. Runtime Logs – Liberty Liberty - default logs trace System.out System.err messages.log trace.log console.log1 Liberty – binary logging logs trace System.out System.err logdata/ tracedata/ console.log1 1console.log is redundant and can be disabled if you don't need it © 2014 21 IBM Corporation
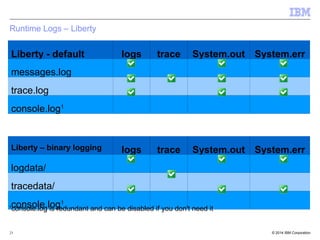
- 22. Viewing logs and trace Viewing logs and trace – [Liberty] binaryLog command is used to view content from logdata / tracedata – [Full Profile] logViewer command is used to view content from logdata / tracedata – displays repository content in plain text – provides options to filter the displayed content and to choose the output format – can be used to monitor (tail) the repositories in real time © 2014 22 IBM Corporation
- 23. Binary Logging Performance (Liberty) – Measured using java.util.logging – Much faster than logging to messages.log when console.log was disabled – Much faster than tracing to trace.log – Performance gains are very dependent on log / trace content Use binary logging to reduce performance impact of logs and traces on your production servers – console.log should be disabled when superior logging performance is required (note that this is not a factor in trace performance) <logging consoleLogLevel="OFF" /> Liberty Trace Performance 0 2 4 6 8 10 12 14 16 18 700000 600000 500000 400000 300000 200000 100000 0 Default HPEL threads events per second Performance Liberty Logging Performance 0 2 4 6 8 10 12 14 16 18 700000 600000 500000 400000 300000 200000 100000 0 Default (with console.log) Default (no console.log) HPEL (with console.log) HPEL (no console.log) threads events per second © 2014 23 IBM Corporation
- 24. HPEL Performance (Full Profile) Performance – Measured using java.util.logging – Much faster than logging to SystemOut.log when TextLog and JMX Notification are disabled – Much faster than tracing to trace.log – Performance gains are very dependent on log / trace content Use HPEL to reduce performance impact of logs and traces on your production servers Full Profile Logging Performance threads events per second 0 2 4 6 8 10 12 14 16 18 800000 700000 600000 500000 400000 300000 200000 100000 0 Default Default (no JMX Notification) HPEL HPEL (no JMX Notification, no TextLog) Full Profile Trace Performance 0 2 4 6 8 10 12 14 16 18 700000 600000 500000 400000 300000 200000 100000 0 Default HPEL threads events per second © 2014 24 IBM Corporation
- 25. Enabling binary logging (Liberty) To enable binary logging add the following line to your bootstrap.properties file in your server root directory: websphere.log.provider=binaryLogging-1.0 To disable binary logging remove the above line from your bootstrap.properties file A server restart is required to enable or disable binary logging © 2014 25 IBM Corporation
- 26. Enabling HPEL (Full Profile) Administrative Console 1. Expand Troubleshooting 2. Select Logs and trace 3. Select server1 4. Select Change log and trace mode 5. Click Switch to HPEL Mode 6. Save your configuration 7. Restart your server A server restart is required to enable or disable binary logging © 2014 26 IBM Corporation
- 27. Configuring binary logging (Liberty) Binary log and trace settings are set in child elements of the logging element in the server.xml Settings for the console log, trace specification, and log directory are inherited from the logging element <logging logDirectory="${server.output.dir}/logs" traceSpecification="*=info" consoleLogLevel="AUDIT"> <binaryLog purgeMaxSize="50"/> <binaryTrace purgeMaxSize="50"/> </logging> © 2014 27 IBM Corporation
- 28. Configuring HPEL (Full Profile) Administrators can independently configure (as an immediate runtime change or a persistent config change): • HPEL Log • HPEL Trace • HPEL Text log Log detail level setting is the same as previous releases. © 2014 28 IBM Corporation
- 29. Viewing logs and trace (Liberty ) The binaryLog command is in the wlp/bin directory To view all binary logs and trace binaryLog view serverName To view all warnings and errors binarylog view serverName --minLevel=WARNING To view all warnings and errors from thread 33 from the latest run of the server binarylog view serverName –-includeThread=33 --includeInstance=”latest” To tail the content of the logs and trace as they are written by the server binarylog view serverName --monitor To see all of the available options binarylog help view © 2014 29 IBM Corporation
- 30. Viewing logs and trace (Full profile) The logViewer command is in the profile bin directory To view all binary logs and trace LogViewer | LogViewer -monitor © 2014 30 IBM Corporation
- 31. Viewing logs and trace (Full profile) The logViewer command is in the profile bin directory To view all warnings and errors LogViewer -minLevel WARNING © 2014 31 IBM Corporation
- 32. Viewing logs and trace (Full profile) The logViewer command is in the profile bin directory To view all binary logs and trace LogViewer -minLevel WARNING -latestInstance © 2014 32 IBM Corporation
- 33. Viewing logs and trace (Full profile) The logViewer command is in the profile bin directory To view all binary logs and trace LogViewer -startDate "05/31/12 22:10:40:000 EDT" -stopDate "05/31/12 22:10:58:000 EDT" -thread 91 -minLevel info © 2014 33 IBM Corporation
- 34. Viewing logs and trace (Full profile) Administrative Console 1. Expand Troubleshooting 2. Select Logs and trace 3. Select server1 4. Select View HPEL logs and trace © 2014 34 IBM Corporation
- 35. Copying log and trace (Liberty) The binaryLog command lets you make new binary copies of your data Any of the filtering options can be used when making a new copy To create a new binary copy of your log and trace data with only messages that contain the string “hello” binarylog copy serverName myOutputDirectory --includeMessage="*hello*" To view all log and trace data stored in this new copy binarylog view myOutputDirectory To see all of the available options binarylog help copy © 2014 35 IBM Corporation
- 36. Copying log and trace (Full profile) The logViewer command lets you make new binary copies of your data Any of the filtering options can be used when making a new copy To create a new binary copy of your log and trace data with only messages that contain the string “hello” logViewer -extractToNewRepository myOutputDirectory -message "*hello*" To view all log and trace data stored in this new copy logviewer -repositoryDir myOutputDirectory To see all of the available options logViewer -help © 2014 36 IBM Corporation
- 37. Extensibility Developers can add key-value pairs to log and trace records using the LogRecordContext API – For example, in an application hosting multiple stores, you could add the storeId to each log and trace record in a servlet filter – Key-value pairs appear in log output when the advanced format is used (selectable when running the [Liberty] binaryLog / [Full Profile] logViewer command) – Key-value pairs can be used as filter parameters in [Liberty] binaryLog / [Full Profile] logViewer command – [Full Profile] appName extension is provided automatically, and other extensions are provided for thing like cross component trace, and SIP – Liberty: binarylog view serverName –-includeExtension=”storeId=WidgetsPlus” --format=advanced – Full Profile: logViewer -includeExtensions “appName=MyMall” ”storeId=WidgetsPlus” -format advanced [11/26/13 8:15:13:495 EST] 00000074 I UOW= source=com.mymall.ServletX class=com.mymall.Serv letX method=doGet org= prod= component= thread=[WebContainer : 0] storeId=[WidgetsPlus] Welcome to Widget's Plus! © 2014 37 IBM Corporation
- 38. Using High Performance Extensible Logging / Binary Logging with SplunkTM Step 1 - Install Splunk app for WAS Step 2 - Configure Splunk forwarder – Option #1 (simplest) - Read from TextLog files – Add monitor stanza to Splunk inputs.conf file to read from TextLog (use index=websphere and sourcetype=WebSphere:SystemOutErrLog) – Option #2 (any environment) - Read from logViewer -monitor script – Configure Splunk to read output from logViewer -monitor – Set up a no-arg script to run logViewer -monitor from profile bin – Add script stanza to Splunk inputs.conf file to run the above created script (use index=websphere sourcetype=WebSphere:SystemOutErrLog interval=-1) – Add -Xrs to Java command invocation in WASbinlogViewer script (for graceful shutdown when Splunk stops) © 2014 38 IBM Corporation
- 39. Using High Performance Extensible Logging / Binary Logging with SplunkTM Option #1 (simplest) - Read from TextLog files inputs.conf [monitor://D:WASprofilesAppSrv01logsserver1] whitelist=Text.*.log$ crcSalt = <SOURCE> disabled = false followTail = 0 index = websphere sourcetype = WebSphere:SystemOutErrLog © 2014 39 IBM Corporation
- 40. Using High Performance Extensible Logging / Binary Logging with SplunkTM Option #2 (any environment) - Read from logViewer -monitor script inputs.conf [script://$SPLUNK_HOMEetcsystembinrunLogViewer.cmd] disabled = false interval = -1 index = websphere sourcetype = WebSphere:SystemOutErrLog runLogViewer.cmd call D:WASprofilesAppSrv01binlogViewer -monitor WASbinlogViewer.cmd change: %JAVA_EXE% ... com.ibm.ws.logging.hpel.viewer.LogViewer %* to: %JAVA_EXE% -Xrs ... com.ibm.ws.logging.hpel.viewer.LogViewer %* © 2014 40 IBM Corporation
- 41. 41 Full Profile
- 42. Full Profile Problem Determination IBM Support Assistant Data Collector Cross Component Trace TimedOperations Feature Memory Leak Detection, Prevention, and Correction © 2014 42 IBM Corporation
- 43. IBM Support Assistant Data Collector The isadc command is a console utility you can run from your profile bin directory (starting from WAS 8.0.0.6) to collect diagnostic information from your application server when you are experiencing problems. AppServerbin> isadc The IBM Support Assistant data collector executes scripts which follow the same steps as detailed in MustGather documents produced by IBM L2 support teams for common problems. Use of the IBM Support Assistant Data Collector can speed up problem determination by ensuring you have the right artifacts to work with support teams The isadc command must be run on the system on which you are experiencing problems. Many of the scripts require the server to be running, and in the problem state. The resultant data collected can be sent to IBM via secure file transfer, or kept for your own purposes. © 2014 43 IBM Corporation
- 44. IBM Support Assistant Data Collector The IBM Support Assistant data collector is menu driven – you can choose from dozens of possible problem symptoms to gather problem-specific artifacts. Responses to menu choices and prompts can be recorded to a response file as follows: AppServerbin> isadc -record response.txt Response files are in plain text and can be reused for future invocations of the tool: AppServerbin> isadc response.txt The tool provides a way to securely transfer data to IBM ECuRep, if desired. © 2014 44 IBM Corporation
- 45. IBM Support Assistant Data Collector Console (text) Interface isadc.bat or isadc.sh in WAS_HOME/bin Silent response capability Collection Archive Transfer to IBM for analysis with a PMR © 2014 45 IBM Corporation
- 46. Cross Component Trace Cross Component Trace (XCT) is a log/trace correlation technology. XCT enables you to determine which log/trace entries are part of each request. XCT can be used in any of three different modes: 1)Request ID mode 2)Request ID and correlation log record mode 3)Request ID, correlation log record, and data snapshot mode XCT works best in combination with High Performance Extensible Logging (HPEL). • HPEL stores XCT Request IDs • HPEL can filter log/trace records by XCT Request ID © 2014 4466 IBM Corporation
- 47. Cross Component Trace Logviewer IBM WebSphere Cross Component Trace Logviewer can be used to view files augmented with correlation log records. • Available for the IBM Support Assistant • Can load multiple files simultaneously • Can show flat / hierarchical views © 2014 4477 IBM Corporation
- 48. Enabling XCT through Administrative Console The panel below is where XCT is enabled on the administrative console • The panel can be found here: WebSphere Application Servers > SERVER_NAME > Change log detail levels © 2014 4488 IBM Corporation
- 49. Understanding XCT Correlation Log Records Correlation log records look like this example: [4/23/12 13:54:44:509 IST] 0000008e XCT I BEGIN AAADx/itMDz-AAAAAAAAAAA 00000000000-cccccccccc2 HTTPCF(InboundRequest /JMSApp/LocalMessageSend RemoteAddress(127.0.0.1) RequestContext(2082603117)) <Date>: The date and time when the log record was generated <Thread_ID>: The thread which generated this message <XCT_Logger_Name>: The XCT logger name is XCT. This logger is used to identify the XCT Records in the Log file <Message_Type>: Type of the log message <XCT_STATE>: Each XCT Record has a State, it can be BEGIN, END <XCT_ID>: A Unique ID generated for correlating the XCT Records <XCT_PARENT_ID>: The XCT_ID of the parent XCT context <XCT_MESSAGE>: The XCT message contains the information about the XCT record; this can contain some Associations and Annotations © 2014 4499 IBM Corporation
- 50. Identifying all log/trace entries that are part of the same HTTP request The XCT requestID is added to all log and trace records associated with HTTP requests. The requestID can only be seen when using the HPEL logViewer command-line tool with the advanced format logViewer -thread 91 -minlevel info -format advanced © 2014 5500 IBM Corporation
- 51. Identifying all log/trace entries that are part of the same HTTP request The XCT requestID is added to all log and trace records associated with HTTP requests. – The requestID can only be seen when using the HPEL logViewer command-line tool with the advanced format logViewer -includeExtensions requestID=AAAKLwUVkuH-AAAAAAAAAAC © 2014 5511 IBM Corporation
- 52. IBM WebSphere Cross Component Trace Logviewer The scenarios following this slide use the IBM WebSphere Cross Component Trace Logviewer – available as a tool add-on for the IBM Support Assistant Tool used to examine XCT entries in a log Logs can be loaded from multiple servers and they are stitched together © 2014 5522 IBM Corporation
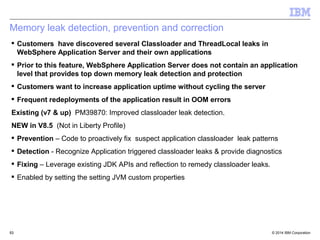
- 53. Memory leak detection, prevention and correction Customers have discovered several Classloader and ThreadLocal leaks in WebSphere Application Server and their own applications Prior to this feature, WebSphere Application Server does not contain an application level that provides top down memory leak detection and protection Customers want to increase application uptime without cycling the server Frequent redeployments of the application result in OOM errors Existing (v7 & up) PM39870: Improved classloader leak detection. NEW in V8.5 (Not in Liberty Profile) Prevention – Code to proactively fix suspect application classloader leak patterns Detection - Recognize Application triggered classloader leaks & provide diagnostics Fixing – Leverage existing JDK APIs and reflection to remedy classloader leaks. Enabled by setting the setting JVM custom properties © 2014 5533 IBM Corporation
- 54. Class Unloading 101 A Java Object has a reference to its Class object.getClass() A Class has a reference to its ClassLoader class.getClassloader() A ClassLoader has a reference to every Class it has loaded classloader.findLoadedClass() Java classes are loaded per-class, but unloaded per-classloader Class unloading can be denied because of references to ClassLoader, Class or Object – References can come from anywhere: • Other Objects • Other Llasses/ClassLoaders • Thread stacks • Thread variables • JNI global references • Finalizer queue entries © 2014 5544 IBM Corporation
- 55. Unwanted reference to application classloader – example 1 ■ Here, we have a CompoundClassLoader which is kept alive because a thread named “Keep- Alive-Timer” has its contextClassLoader set to it ■ “Keep-Alive-Timer” is a daemon thread – Spawned by the classlibraries – Daemon threads live until the JVM ends ■ Threads inherit contextclassloader – From their parent ■ This is a Java classlibrary bug – Being raised with Oracle – Fix is simple: • thread.setContextClassLoader(null); 55 © 2010 IBM Corporation
- 56. Unwanted reference to a class which was loaded by the application classloader – example 2 ■ Here, a CompoundClassLoader is kept alive because a class it loaded – org.richfaces.model.selection.ClientSelecti on – has been stored inside a HashMap in the system class java.beans.PropertyEditorManager ■ Because this is a system class, it has javadoc! ■ Looks like a RichFaces bug... – https://jira.jboss.org/browse/RF-7911 • “OutOfMemory when redeploying - ClientSelection not unregistered from PropertyEditorManager” 56 © 2010 IBM Corporation
- 57. Common leaks ■ ThreadLocal problems – Custom class extending ThreadLocal? ■ Threads' contextClassLoaders – Daemon threads started by a servlet – Careless use of java.util.Timer – Daemon threads started by 3rd party libraries, shared between two applications ■ Bean introspection – If you introspect (call getBeanInfo()) on a Bean loaded by the app classloader, you must call flushfromCaches(beanClass) on app shutdown ■ JMX MBeans and NotificationListeners – Must be unregistered when the application stops 57 © 2010 IBM Corporation
- 58. Example BAD code public class MyCounter { private int count = 0; public void increment() { count++; } public int getCount() { return count; } } public class MyThreadLocal extends ThreadLocal<MyCounter> { } public class LeakingServlet extends HttpServlet { private static MyThreadLocal myThreadLocal = new MyThreadLocal(); protected void doGet(HttpServletRequest request, HttpServletResponse response) throws ServletException, IOException { MyCounter counter = myThreadLocal.get(); if (counter == null) { counter = new MyCounter(); myThreadLocal.set(counter); } response.getWriter().println( "The current thread served this servlet " + counter.getCount() + " times"); counter.increment(); } } 58 © 2010 IBM Corporation
- 59. Example BAD code public class MyCounter { private int count = 0; public void increment() { count++; } public int getCount() { return count; } } public class MyThreadLocal extends ThreadLocal<MyCounter> { } public class LeakingServlet extends HttpServlet { private static MyThreadLocal myThreadLocal = new MyThreadLocal(); protected void doGet(HttpServletRequest request, HttpServletResponse response) throws ServletException, IOException { MyCounter counter = myThreadLocal.get(); if (counter == null) { counter = new MyCounter(); myThreadLocal.set(counter); } response.getWriter().println( "The current thread served this servlet " + counter.getCount() + " times"); counter.increment(); } } 59 © 2010 IBM Corporation
- 60. Detection, prevention and action Detection: Issue warnings when a memory leak is detected Prevention is on by default and applies only to JRE triggered leaks. Action: Take proactive action to fix memory leaks. Actions have reasonable defaults and are configured on a case-by-case Pseudo code for clearing leaks protected void com.ibm.ws.classloader.clearReferences() { if(ENABLE_CLEAR_REFERENCES_JDBC) clearReferencesJdbc(); if(ENABLE_CLEAR_REFERENCES_THREADS) clearReferencesThreads(); if(ENABLE_CLEAR_REFERENCES_THREADLOCALS) clearReferencesThreadLocals(); if(ENABLE_CLEAR_REFERENCES_RMI_TARGETS) clearReferencesRmiTargets(); if(ENABLE_CLEAR_REFERENCES_STATICS) clearReferencesStaticFinal(); } © 2014 60 IBM Corporation
- 61. Leak detection messages CWMML0015E: The web application [WasSwat#WasSwatWeb.war] created a ThreadLocal with key of type [test.memleak.MyThreadLocal] (value [test.memleak.MyThreadLocal@216c691]) and a value of type [test.memleak.MyCounter] (value [test.memleak.MyCounter@21942ff]) but failed to remove it when the web application was stopped. CWMML0010E: The web application [LeakApp#leak.war] appears to have started a thread named [Thread-73] but has failed to stop it. CWMML0011E: The web application [LeakApp#leak.war] appears to have started a TimerThread named [leaked-thread] via the java.util.Timer API but has failed to stop it. CWMML0024W: About to interrupt thread [leakingThread] which is currently executing CWMML0026I: ClassLoader memory leak is fixed. Clearing leak References succeeded for LeakApp#leak.war. © 2014 61 IBM Corporation
- 62. Useful Links – Runtime Capabilities High Performance Extensible Logging Using High Performance Extensible Logging to troubleshoot applications http://pic.dhe.ibm.com/infocenter/wasinfo/v8r5/index.jsp? topic=%2Fcom.ibm.websphere.nd.multiplatform.doc %2Fae%2Fttrb_usinghpel.html High Performance Extensible Logging (HPEL) http://publib.boulder.ibm.com/infocenter/ieduasst/v1r1m0/i ndex.jsp? topic=/com.ibm.iea.was_v8/was/8.0/ProblemDeterminatio n/WASv8_HPEL/player.html System administration in WebSphere Application Server V8.5, Part 3: High Performance Extensible Logging (HPEL) http://www.ibm.com/developerworks/websphere/techjourn al/1208_bourne/1208_bourne.html Cross Component Trace WebSphere Application Server v8.5 Cross Component Trace http://webspherecommunity.blogspot.ca/2012/07/websph ere-application-server-v85-cross.html Use Cross Component Trace (XCT) request Ids to see which log entries were generated by each request http://www.youtube.com/watch?v=oXsfDoiNb5c Use the IBM WebSphere Cross Component Trace Logviewer to view WebSphere Application Server log files http://www.youtube.com/watch?v=qorwRZh4DgQ High Performance Extensible Logging and Cross Component Trace Tech Video https://www.youtube.com/watch?v=FKKfUdNux70 IBM Training: IBM WebSphere Application Server V8 Problem Determination http://www- 304.ibm.com/jct03001c/services/learning/ites.wss/us/en? pageType=course_description&courseCode=WU582 © 2014 62 IBM Corporation
- 63. Useful Links – Runtime Capabilities Memory Leak Detection and Prevention Configuring the memory leak policy http://pic.dhe.ibm.com/infocenter/wasinfo/v8r5/topic/com.i bm.websphere.nd.doc/ae/ttrb_configmemleak.html Memory leaks in Java Platform, Enterprise Edition applications http://pic.dhe.ibm.com/infocenter/wasinfo/v8r5/index.jsp? topic=%2Fcom.ibm.websphere.nd.doc%2Fae %2Fctrb_memleakdetection.html Binary Logging Liberty Profile: Binary Logging http://pic.dhe.ibm.com/infocenter/wasinfo/v8r5/topic/com.i bm.websphere.wlp.express.doc/ae/cwlp_HPELOverview. html Binary logging for Liberty profile http://publib.boulder.ibm.com/infocenter/ieduasst/v1r1m0/t opic/com.ibm.iea.was_v8/was/8.5.5.0/content/WASV855_ Binary_Logging/player.html? dmuid=20130807101913462846 © 2014 63 IBM Corporation
- 64. Useful Links – Runtime Capabilities Timed Operations Timed operations for Liberty http://publib.boulder.ibm.com/infocenter/ieduasst/v1r1m0/t opic/com.ibm.iea.was_v8/was/8.5.5.0/content/WASV855_ Serviceability_TimedOperations/player.html? dmuid=20130815082326115285 Lab: Liberty profile timed operations for JDBC http://publib.boulder.ibm.com/infocenter/ieduasst/v1r1m0/t opic/com.ibm.iea.was_v8/was/8.5.5.0/content/WASv855_ Liberty_Timed_Operations_Lab.pdf? dmuid=20130807102148029081 Files for lab: http://publib.boulder.ibm.com/infocenter/ieduasst/v1r1m0/topic/com.Sensitive Log and Trace Guard Using sensitive log and trace guard http://pic.dhe.ibm.com/infocenter/wasinfo/v8r5/topic/com.i bm.websphere.express.doc/ae/ctrb_sensitivelogtrace.html © 2014 64 IBM Corporation
- 65. IBM Support Assistant v5.0 65
- 66. IBM Support Assistant 5.0 ISA 5.0 Team Server •Server-based model •Install once - shared by many team members via browser •Web 2.0 browser interface •Remote execution of PD tools •Off-load analysis processing •Collaboration on PD •Case Management •Tool Management •Single-user option available Browser Browser Browser Browser © 2014 66 IBM Corporation Available at www.ibm.com/software/support/isa ISA Team Server
- 67. IBM Support Assistant 5.0 – Deployment options Team Server Single install Multiple end users Leverages resources of ISA server system Shared investigation Standalone Single user Local install User administered ibm.com (ISA and Tool updates) ISA Team Server ibm.com (ISA and Tool updates) ISA Team Server (local) © 2014 67 IBM Corporation
- 68. Automation of Data Upload to ISA 5 ■ ISA Provide a REST interface for some of its functions: ■ Case creation: curl --user user1:user1password -X POST -H Content-Type:application/x-www-form-urlencoded -v -o /home/dumps/curl.log --url http://myISA5TeamServer.mydomain.net/rest/1/tickets -d "summary={case summary}&description={case description}" ■ File upload: curl --user user1:user1password -X POST -v -k -o /home/dumps/curl.log -F file=@'{}' --url http://myISA5TeamServer.mydomain.net/rest/1/files/${caseno}/file_upload?path=/${caseno}/ ■ Can be combined with IBM JDKs “-Xdump” options to run automatically: -Xdump:tool:events=systhrow,filter=java/lang/OutOfMemoryError,exec="DumpUpload.sh %pid” 68 © 2010 IBM Corporation
- 69. Tools – Toolbox •Catalog of available tools •Learn about and discover tools •Launch •Tool Help •Execution History © 2014 6699 IBM Corporation
- 70. Files – Launch tools Suggested tools based on file type Automatically pass files to a tool All tools available from the “Other…” menu © 2014 7700 IBM Corporation
- 71. Available Problem Determination Tools in ISA 5.0 Team Server Tool Name Problem Areas Type Classloader Analyzer Java™, Runtime Desktop Database Connection Pool Analyzer WebSphere, Runtime Desktop FileNet Optical Storage And Retrieval (OSAR) Cable Tool Desktop Garbage Collection and Memory Visualizer (GCMV) Java, Performance, Memory Desktop, Report Health Center Java, Performance Desktop HeapAnalyzer Java, Memory Desktop Interactive Diagnostic Data Explorer (IDDE) Java, Memory Desktop+Server/Web Memory Analyzer (MAT) Java, Memory Desktop, Report, Web Pattern Modeling and Analysis Tool (PMAT) Java, Performance, Memory Desktop, Report Portal Log Analyzer WebSphere, Configuration Report Processor Time Analysis Tool for Linux Java, Performance Desktop Profile Port Checker WebSphere, Configuation Report Thread and Monitor Dump Analyzer (TMDA) Java, Runtime Desktop, Report Trace and Request Analyzer for WebSphere Application Server WebSphere, Runtime Desktop Web Server Plug-in Analyzer for WebSphere Application Server WebSphere, Perfomance Desktop WebSphere Application Server Configuration Visualizer WebSphere, Configuration Report WebSphere Cross Component Trace Logviewer WebSphere, Runtime Desktop © 2014 7711 IBM Corporation
- 72. Additional Resources ISA YouTube playlist @ISA_Tools Requests for Enhancement Contact Information Need support or have questions about Team Server? Visit our forum: http://ibm.biz/ISA-Forum IBM Support Assistant web page http://www.ibm.com/software/support/isa © 2014 72 IBM Corporation
- 73. Useful Links – Problem Determination Tools IBM Support Assistant IBM Support Assistant http://www.ibm.com/software/support/isa/ WAIT IBM Whole-system Analysis of Idle Time (WAIT) http://wait.ibm.com © 2014 73 IBM Corporation
- 74. Useful Links – Knowledge and Education IBM Training IBM WebSphere Application Server V8.5.5 Problem Determination http://www- 304.ibm.com/jct03001c/services/learning/ites.wss/ca/en? pageType=course_description&courseCode=WA591CE WebSphere Support Technical Exchanges Support Technical Exchanges http://www.ibm.com/support/entry/portal/Scheduled_tech_ exchanges/Software/WebSphere/WebSphere_brand_sup port_(general) IBM Education Assistant IBM Education Assistant http://www.ibm.com/software/info/education/assistant/ Problem Determination Practices RedPaper – Increasing Resiliency for IBM WebSphere Application Server Deployments http://www.redbooks.ibm.com/redpapers/pdfs/redp5033.p df © 2014 74 IBM Corporation
- 75. 75 Questions?
- 76. Your feedback is valuable - please complete your session or lab evaluation! Session number [A6] © 2014 IBM Corporation Provide your evaluations by: Evaluation forms: Fill out a form at the end of each session Paper forms are located in each of the session or lab rooms Place the completed form in the tray as you exit the room - Or – Complete the session survey on Event Connect Portal: ibmeventconnect.eu/euxdx Select Sessions, then Session Finder, and complete the survey
- 77. Visit WASdev.net for downloads and other resources WASdev.net
- 78. For Additional Information © 2014 IBM Corporation IBM Training http://www.ibm.com/training IBM WebSphere http://www-01.ibm.com/software/be/websphere/ IBM developerWorks www.ibm.com/developerworks/websphere/websphere2.html WebSphere forums and community www.ibm.com/developerworks/websphere/community/ 78