SlideShare a Scribd company logo
G R A P H I S T R Y info@graphistry.com
G R A P H I S T R Y
Scaling Visual Graph Investigations with Math, GPUs, and Experts
GraphThePlanet, San Francisco, 2020
Leo Meyerovich, CEO
@LMeyerov
G R A P H I S T R Y info@graphistry.com
Tech
Security, anti-fraud, networking, …
Analysts, devs, & researchers
100X Investigations:
Graph, viz, GPUs, workflow acceleration
Users
G R A P H I S T R Y info@graphistry.com3
Graph the planet by solving logs
• 1K – 1M devices
• 1K – 1B users
• All logged: Payments, logins, clicks, ...
• Super rich metadata: IP, time, …
• Stored in many independent DBs/APIs
GRAPH
• Scope
• History & root cause
• Impact
• Patterns & outliers
• …
G R A P H I S T R Y info@graphistry.com
Three scaling advances for graph-aware investigations
Math
Hypergraphs, virtual graphs,
& ML-driven linking
Compute
GPUs for everyone!
Experts
Collaborative low-code automation
G R A P H I S T R Y
G R A P H I S T R Y info@graphistry.com
IP=10.16.0.8; msg=Malware.Object;
time=2 Nov 2017 19:32:00 UTC;
vendor=FireEye; Product=Web MPS NX
5
Unify all data by modeling logs as graphs
G R A P H I S T R Y info@graphistry.com
Pick entity cols for nodes Linked when same Event
event
Fetch logs
(ex: api result)
Modeling 1/5: Map all logs as hypergraphs
Simple UI: Column picker for any
Splunk, Neo4j, etc. query result
IP in 2 events
event
G R A P H I S T R Y info@graphistry.com
Modeling 2/5: Look across all DBs/APIs with virtual graph queries
10.0.0.1
Alert
Alerts DB
(Splunk)
10.0.0.2
Accounts DB
(SQL)
10.0.0.2
User2
Account Takeover
(ZenDesk)
LM LMeyer
G R A P H I S T R Y info@graphistry.com
Modeling 2/5: Look across all DBs/APIs with virtual graph queries
10.0.0.1
Alert
10.0.0.2 10.0.0.2
User2
search_splunk(x)
LM LMeyer
search_splunk(x)
search_sql(x)
search_sql(x)
Alerts DB
(Splunk)
Accounts DB
(SQL)
Account Takeover
(ZenDesk)
Materialize on-demand: no actual graph
DB!
G R A P H I S T R Y info@graphistry.com
Modeling 3/5: Queries are nasty, generate w/ UI + automation!
Checks more data sources Tracks more clues In less time
Generated query for 1 Splunk pivot call
G R A P H I S T R Y info@graphistry.com
Modeling 4/5: Graph algorithms to highlight events & entities
Auto-clusters
into 4 different
behavioral
groups
Pumped accts &
messages have
high degree,
high centrality
Twitter-based mass phishing
scam
Alerts across IT perimeter
User clusters
inside company
Smart layout splits
out perimeter crossings
G R A P H I S T R Y info@graphistry.com
UMAP: ML likes dates, $, counts, … which graphs don’t…
@leland_mcinnes
G R A P H I S T R Y info@graphistry.com
Modeling 5/5: … Use ML to infer neighbors & add them!
Tensorflow+UMAP
White: Link by k-nn on model
Blue: Link entities as usual
Regular graph analytics on merged graph
G R A P H I S T R Y info@graphistry.com
Three scaling advances for graph-aware investigations
Math
Hypergraphs, virtual graphs,
& ML-driven linking
Compute
GPUs for everyone!
Experts
Collaborative low-code automation
G R A P H I S T R Y
G R A P H I S T R Y info@graphistry.com
Scaling viz helps reveal correlations + work through dirty data
G R A P H I S T R Y info@graphistry.com
Client/Cloud CPU: Moore’s law is dead
Client/Cloud GPU: Steady perf doublings & price drops 🤩
Flipping from “Graphistry is weird sci-fi” to “best & most affordable solution”
G R A P H I S T R Y info@graphistry.com
GPU Democratization 1/2
2014
Graphistry NSF:
GPU Dataframes SBIR
2016/2017
Apache Arrow
+ Nvidia, BlazingSQL, …
2018/2019
RAPIDS:
Databricks, Ursa, …
Shared data format,
GPU docker, …
Graphistry first RAPIDS-
native viz stack: it’s ready!
GPU client <>GPU server:
any browser!
G R A P H I S T R Y info@graphistry.com
G R A P H I S T R Y
Graphistry Cloud:
Get an account and go!
• Open graph data network:
free!
• Developer embedding API
• Data scientist notebook API
• (AWS Price drop: 5X!)
Rest of 2020: Explore more
things & more easily!
GPU Democratization 2/2
G R A P H I S T R Y info@graphistry.com
Three scaling advances for graph-aware investigations
Math
Hypergraphs, virtual graphs,
& ML-inferred edges
Compute
GPUs for everyone!
Experts
Collaborative low-code automation
G R A P H I S T R Y
G R A P H I S T R Y info@graphistry.com
Putting the Team into Blue Team: Collaboration tech
Share Configs
Data schemas generated and shared across community:
“AWS logs settings”
Automate without the Python & Docker
• Enable regular analysts to automate their
investigations via record & replay
• ... => build up team arsenal to cover all data types and
all investigation types
Integrate with other investigation tools
Embed viz into others apps
 launch investigation templates from them (ex: User 360)
 jump from event/entity to original tool / query (ex: Splunk)
Explore
G R A P H I S T R Y info@graphistry.com
G R A P H I S T R Y
Graphistry Cloud:
Get an account and go!
• Open graph data network:
free!
• Developer embedding API
• Data scientist notebook API
Thanks!
info@graphistry.com
G R A P H I S T R Y info@graphistry.com
backup
G R A P H I S T R Y info@graphistry.com
Management perspective: 80/20 rule for covering functional KPIs
80% of DATA
endpoint logs & alerts
user logs & alerts
server logs & alerts
network logs & alerts
service logs & alerts
ticket APIs
…
80% of INCIDENTS
malware
phishing
cloud tenant breach
app server takeover
device theft
offboarding
…
80% of TASKS
high-fidelity quick check
investigative deep dive
mitigation/containment/report
table top training
automation
...
Overdue to make investigation structured & predictable!
• Incident SLA
• Investigation depth (burnout!)
• Satellite team methodology
• …
G R A P H I S T R Y info@graphistry.com
Collective automation:
Record-and-replay
investigation templates!
2. Auto-expand virtual graph
G R A P H I S T R Y info@graphistry.com
GPUs unlocking fast data @ scale for every step of your data pipeline
24
1 GPU w/ 1+ GB RAM
Dedicated
16+ GPU per node w/ 500GB+ RAM
Shared
1+ MB/s
Big & fast data
pushdown
Database
STREAMING WEBGL GRAPHICS
OPTIMIZED NETWORKING
GRAPH & TABULAR ANALYTICS
© 2018 Graphistry, Inc. All rights reserved. Confidential and proprietary information. Do not distribute. info@graphistry.com
G R A P H I S T R Y info@graphistry.com
Graph reveal non-local stats on connected data (= all digital logs!)
© 2018 Graphistry, Inc. All rights reserved. Confidential and proprietary information. Do not distribute. info@graphistry.com | 25
Scoping
Patterns & Outliers Influence & Critical Players
Progression & Behavior
G R A P H I S T R Y info@graphistry.com
RAPIDS UMAP layout
Tensorflow categorization
Graphistry visual analytics
Splunk data lake
regular review
potential illicit activity
potential trafficking
41K Reviews => 400 flagged
G R A P H I S T R Y info@graphistry.com
Graph: Top 5 most suspicious co’s,
their records, and hits on their metadata
Explainable & key entities *pop*
Graph for correlating entities across events
G R A P H I S T R Y info@graphistry.com
Correlated macro view better than disconnected alerts & tickets!
DEMO: 1w of FireEye HX over 546 IPs & 22 users
G R A P H I S T R Y info@graphistry.com
Quickly popping insights
Color by time, data source Expand 2 hops Expand by community
Color by rank, btwness, … Visual data cleaning Model tuning
G R A P H I S T R Y info@graphistry.com
100X Compute:
GPUs for everyone
What if we could easily compute over full datasets in subsecond?
G R A P H I S T R Y info@graphistry.com
Hunting:
Finally possible to do 1M+ events/entities w/ web UIs!
Ex: Bro/Zeek
(secrepo.com)
G R A P H I S T R Y info@graphistry.com
Faster Speeds, Real-World Benefits
cuIO/cuDF –
Load and Data Preparation cuML - XGBoost
Time in seconds (shorter is better)
cuIO/cuDF (Load and Data Prep) Data Conversion XGBoost
Benchmark
200GB CSV dataset; Data prep includes
joins, variable transformations
CPU Cluster Configuration
CPU nodes (61 GiB memory, 8 vCPUs, 64-
bit platform), Apache Spark
DGX Cluster Configuration
5x DGX-1 on InfiniBand
network
8762
6148
3925
3221
322
213
End-to-End
my_gdf.groupby([‘src_ip’,’dest_ip’])[‘time’].plot()
G R A P H I S T R Y info@graphistry.com
cuGraph
Multi-GPU PageRank Performance
PageRank portion of the HiBench benchmark suite
HiBench Scale Vertices Edges CSV File
(GB)
# of GPUs PageRank for
3 Iterations (secs)
Huge 5,000,000 198,000,000 3 1 1.1
BigData 50,000,000 1,980,000,000 34 3 5.1
BigData x2 100,000,000 4,000,000,000 69 6 9.0
BigData x4 200,000,000 8,000,000,000 146 12 18.2
BigData x8 400,000,000 16,000,000,000 300 16 31.8
Graph().add_edges(my_df).pagerank()
G R A P H I S T R Y info@graphistry.com
graph = netflow_df.sql(“““
SELECT
sum(bytes),
min(time),
max(time)
GROUP BY src_ip, dest_ip
”””)
graphistry.plot(graph)
BlazingSQL’s C++ skips cuDF’s Python Numba JIT…
so _great_ for subsecond interactivity!
G R A P H I S T R Y info@graphistry.com
Closing remarks: Scaling graph _projects_
Avoid failure to launch by avoiding infra & NIH:
1d-1mo: Cloud, viz, on-the-fly compute, notebooks, API connectors
3mo-never: Graph DB, Kafka ingest, Hadoop, on-prem, custom analytics, custom UIs
Useful by design: Make user+problem #1 driver, not infra
Win ROI politics w/ cupcake principle: Big projects start as small projects
Lower switching costs by augmenting vs. replacing
Everyone used to status quo and uninterested in avoidable work..
Start w/ good champions: Ideally innovative, influential, technical, & has time
grow from there
Gartner: “85% of data science projects fail.”

More Related Content

Similar to Scaling graph investigations with Math, GPUs, & Experts (20)

PDF
Graph Databases and Machine Learning | November 2018
TigerGraph
 
PDF
Graph Gurus Episode 37: Modeling for Kaggle COVID-19 Dataset
TigerGraph
 
PDF
IoT NY - Google Cloud Services for IoT
James Chittenden
 
PDF
Hardware Accelerated Machine Learning Solution for Detecting Fraud and Money ...
TigerGraph
 
PDF
GOAI: GPU-Accelerated Data Science DataSciCon 2017
Joshua Patterson
 
PDF
Dsdt meetup-january2018
JDA Labs MTL
 
PDF
DSDT Meetup January 2018
DSDT_MTL
 
PDF
Bring Your Own Recipes Hands-On Session
Sri Ambati
 
PDF
High Performance Spatial-Temporal Trajectory Analysis with Spark
DataWorks Summit/Hadoop Summit
 
PPT
Graph Analytics for big data
Sigmoid
 
PPTX
Distributed computing poli
ivascucristian
 
PDF
AI 클라우드로 완전 정복하기 - 데이터 분석부터 딥러닝까지 (윤석찬, AWS테크에반젤리스트)
Amazon Web Services Korea
 
PDF
Graphalytics: A big data benchmark for graph-processing platforms
Graph-TA
 
PDF
Build and Host Real-world Machine Learning Services from Scratch @ pycontw2019
Chun-Yu Tseng
 
PDF
Real-Time Fraud Detection at Scale—Integrating Real-Time Deep-Link Graph Anal...
Databricks
 
PDF
Multiplaform Solution for Graph Datasources
Stratio
 
PDF
Multiplatform Spark solution for Graph datasources by Javier Dominguez
Big Data Spain
 
PPTX
End-to-end Machine Learning Pipelines with HP Vertica and Distributed R
Jorge Martinez de Salinas
 
PPTX
Designing data pipelines for analytics and machine learning in industrial set...
DataWorks Summit
 
PDF
GraphGen: Conducting Graph Analytics over Relational Databases
PyData
 
Graph Databases and Machine Learning | November 2018
TigerGraph
 
Graph Gurus Episode 37: Modeling for Kaggle COVID-19 Dataset
TigerGraph
 
IoT NY - Google Cloud Services for IoT
James Chittenden
 
Hardware Accelerated Machine Learning Solution for Detecting Fraud and Money ...
TigerGraph
 
GOAI: GPU-Accelerated Data Science DataSciCon 2017
Joshua Patterson
 
Dsdt meetup-january2018
JDA Labs MTL
 
DSDT Meetup January 2018
DSDT_MTL
 
Bring Your Own Recipes Hands-On Session
Sri Ambati
 
High Performance Spatial-Temporal Trajectory Analysis with Spark
DataWorks Summit/Hadoop Summit
 
Graph Analytics for big data
Sigmoid
 
Distributed computing poli
ivascucristian
 
AI 클라우드로 완전 정복하기 - 데이터 분석부터 딥러닝까지 (윤석찬, AWS테크에반젤리스트)
Amazon Web Services Korea
 
Graphalytics: A big data benchmark for graph-processing platforms
Graph-TA
 
Build and Host Real-world Machine Learning Services from Scratch @ pycontw2019
Chun-Yu Tseng
 
Real-Time Fraud Detection at Scale—Integrating Real-Time Deep-Link Graph Anal...
Databricks
 
Multiplaform Solution for Graph Datasources
Stratio
 
Multiplatform Spark solution for Graph datasources by Javier Dominguez
Big Data Spain
 
End-to-end Machine Learning Pipelines with HP Vertica and Distributed R
Jorge Martinez de Salinas
 
Designing data pipelines for analytics and machine learning in industrial set...
DataWorks Summit
 
GraphGen: Conducting Graph Analytics over Relational Databases
PyData
 

Recently uploaded (20)

PDF
Newgen Beyond Frankenstein_Build vs Buy_Digital_version.pdf
darshakparmar
 
PDF
"Beyond English: Navigating the Challenges of Building a Ukrainian-language R...
Fwdays
 
PDF
New from BookNet Canada for 2025: BNC BiblioShare - Tech Forum 2025
BookNet Canada
 
PPTX
Building Search Using OpenSearch: Limitations and Workarounds
Sease
 
PDF
CIFDAQ Market Wrap for the week of 4th July 2025
CIFDAQ
 
PDF
What Makes Contify’s News API Stand Out: Key Features at a Glance
Contify
 
PDF
Using FME to Develop Self-Service CAD Applications for a Major UK Police Force
Safe Software
 
PDF
CIFDAQ Market Insights for July 7th 2025
CIFDAQ
 
PDF
"AI Transformation: Directions and Challenges", Pavlo Shaternik
Fwdays
 
PDF
Fl Studio 24.2.2 Build 4597 Crack for Windows Free Download 2025
faizk77g
 
PDF
Newgen 2022-Forrester Newgen TEI_13 05 2022-The-Total-Economic-Impact-Newgen-...
darshakparmar
 
PDF
Jak MŚP w Europie Środkowo-Wschodniej odnajdują się w świecie AI
dominikamizerska1
 
PPTX
WooCommerce Workshop: Bring Your Laptop
Laura Hartwig
 
PDF
Blockchain Transactions Explained For Everyone
CIFDAQ
 
PDF
The Rise of AI and IoT in Mobile App Tech.pdf
IMG Global Infotech
 
PDF
Empower Inclusion Through Accessible Java Applications
Ana-Maria Mihalceanu
 
PDF
Biography of Daniel Podor.pdf
Daniel Podor
 
PPTX
From Sci-Fi to Reality: Exploring AI Evolution
Svetlana Meissner
 
PPTX
Webinar: Introduction to LF Energy EVerest
DanBrown980551
 
PDF
Bitcoin for Millennials podcast with Bram, Power Laws of Bitcoin
Stephen Perrenod
 
Newgen Beyond Frankenstein_Build vs Buy_Digital_version.pdf
darshakparmar
 
"Beyond English: Navigating the Challenges of Building a Ukrainian-language R...
Fwdays
 
New from BookNet Canada for 2025: BNC BiblioShare - Tech Forum 2025
BookNet Canada
 
Building Search Using OpenSearch: Limitations and Workarounds
Sease
 
CIFDAQ Market Wrap for the week of 4th July 2025
CIFDAQ
 
What Makes Contify’s News API Stand Out: Key Features at a Glance
Contify
 
Using FME to Develop Self-Service CAD Applications for a Major UK Police Force
Safe Software
 
CIFDAQ Market Insights for July 7th 2025
CIFDAQ
 
"AI Transformation: Directions and Challenges", Pavlo Shaternik
Fwdays
 
Fl Studio 24.2.2 Build 4597 Crack for Windows Free Download 2025
faizk77g
 
Newgen 2022-Forrester Newgen TEI_13 05 2022-The-Total-Economic-Impact-Newgen-...
darshakparmar
 
Jak MŚP w Europie Środkowo-Wschodniej odnajdują się w świecie AI
dominikamizerska1
 
WooCommerce Workshop: Bring Your Laptop
Laura Hartwig
 
Blockchain Transactions Explained For Everyone
CIFDAQ
 
The Rise of AI and IoT in Mobile App Tech.pdf
IMG Global Infotech
 
Empower Inclusion Through Accessible Java Applications
Ana-Maria Mihalceanu
 
Biography of Daniel Podor.pdf
Daniel Podor
 
From Sci-Fi to Reality: Exploring AI Evolution
Svetlana Meissner
 
Webinar: Introduction to LF Energy EVerest
DanBrown980551
 
Bitcoin for Millennials podcast with Bram, Power Laws of Bitcoin
Stephen Perrenod
 
Ad

Scaling graph investigations with Math, GPUs, & Experts

  • 1. G R A P H I S T R Y [email protected] G R A P H I S T R Y Scaling Visual Graph Investigations with Math, GPUs, and Experts GraphThePlanet, San Francisco, 2020 Leo Meyerovich, CEO @LMeyerov
  • 2. G R A P H I S T R Y [email protected] Tech Security, anti-fraud, networking, … Analysts, devs, & researchers 100X Investigations: Graph, viz, GPUs, workflow acceleration Users
  • 3. G R A P H I S T R Y [email protected] Graph the planet by solving logs • 1K – 1M devices • 1K – 1B users • All logged: Payments, logins, clicks, ... • Super rich metadata: IP, time, … • Stored in many independent DBs/APIs GRAPH • Scope • History & root cause • Impact • Patterns & outliers • …
  • 4. G R A P H I S T R Y [email protected] Three scaling advances for graph-aware investigations Math Hypergraphs, virtual graphs, & ML-driven linking Compute GPUs for everyone! Experts Collaborative low-code automation G R A P H I S T R Y
  • 5. G R A P H I S T R Y [email protected] IP=10.16.0.8; msg=Malware.Object; time=2 Nov 2017 19:32:00 UTC; vendor=FireEye; Product=Web MPS NX 5 Unify all data by modeling logs as graphs
  • 6. G R A P H I S T R Y [email protected] Pick entity cols for nodes Linked when same Event event Fetch logs (ex: api result) Modeling 1/5: Map all logs as hypergraphs Simple UI: Column picker for any Splunk, Neo4j, etc. query result IP in 2 events event
  • 7. G R A P H I S T R Y [email protected] Modeling 2/5: Look across all DBs/APIs with virtual graph queries 10.0.0.1 Alert Alerts DB (Splunk) 10.0.0.2 Accounts DB (SQL) 10.0.0.2 User2 Account Takeover (ZenDesk) LM LMeyer
  • 8. G R A P H I S T R Y [email protected] Modeling 2/5: Look across all DBs/APIs with virtual graph queries 10.0.0.1 Alert 10.0.0.2 10.0.0.2 User2 search_splunk(x) LM LMeyer search_splunk(x) search_sql(x) search_sql(x) Alerts DB (Splunk) Accounts DB (SQL) Account Takeover (ZenDesk) Materialize on-demand: no actual graph DB!
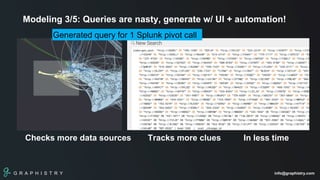
  • 9. G R A P H I S T R Y [email protected] Modeling 3/5: Queries are nasty, generate w/ UI + automation! Checks more data sources Tracks more clues In less time Generated query for 1 Splunk pivot call
  • 10. G R A P H I S T R Y [email protected] Modeling 4/5: Graph algorithms to highlight events & entities Auto-clusters into 4 different behavioral groups Pumped accts & messages have high degree, high centrality Twitter-based mass phishing scam Alerts across IT perimeter User clusters inside company Smart layout splits out perimeter crossings
  • 11. G R A P H I S T R Y [email protected] UMAP: ML likes dates, $, counts, … which graphs don’t… @leland_mcinnes
  • 12. G R A P H I S T R Y [email protected] Modeling 5/5: … Use ML to infer neighbors & add them! Tensorflow+UMAP White: Link by k-nn on model Blue: Link entities as usual Regular graph analytics on merged graph
  • 13. G R A P H I S T R Y [email protected] Three scaling advances for graph-aware investigations Math Hypergraphs, virtual graphs, & ML-driven linking Compute GPUs for everyone! Experts Collaborative low-code automation G R A P H I S T R Y
  • 14. G R A P H I S T R Y [email protected] Scaling viz helps reveal correlations + work through dirty data
  • 15. G R A P H I S T R Y [email protected] Client/Cloud CPU: Moore’s law is dead Client/Cloud GPU: Steady perf doublings & price drops 🤩 Flipping from “Graphistry is weird sci-fi” to “best & most affordable solution”
  • 16. G R A P H I S T R Y [email protected] GPU Democratization 1/2 2014 Graphistry NSF: GPU Dataframes SBIR 2016/2017 Apache Arrow + Nvidia, BlazingSQL, … 2018/2019 RAPIDS: Databricks, Ursa, … Shared data format, GPU docker, … Graphistry first RAPIDS- native viz stack: it’s ready! GPU client <>GPU server: any browser!
  • 17. G R A P H I S T R Y [email protected] G R A P H I S T R Y Graphistry Cloud: Get an account and go! • Open graph data network: free! • Developer embedding API • Data scientist notebook API • (AWS Price drop: 5X!) Rest of 2020: Explore more things & more easily! GPU Democratization 2/2
  • 18. G R A P H I S T R Y [email protected] Three scaling advances for graph-aware investigations Math Hypergraphs, virtual graphs, & ML-inferred edges Compute GPUs for everyone! Experts Collaborative low-code automation G R A P H I S T R Y
  • 19. G R A P H I S T R Y [email protected] Putting the Team into Blue Team: Collaboration tech Share Configs Data schemas generated and shared across community: “AWS logs settings” Automate without the Python & Docker • Enable regular analysts to automate their investigations via record & replay • ... => build up team arsenal to cover all data types and all investigation types Integrate with other investigation tools Embed viz into others apps  launch investigation templates from them (ex: User 360)  jump from event/entity to original tool / query (ex: Splunk) Explore
  • 20. G R A P H I S T R Y [email protected] G R A P H I S T R Y Graphistry Cloud: Get an account and go! • Open graph data network: free! • Developer embedding API • Data scientist notebook API Thanks! [email protected]
  • 21. G R A P H I S T R Y [email protected] backup
  • 22. G R A P H I S T R Y [email protected] Management perspective: 80/20 rule for covering functional KPIs 80% of DATA endpoint logs & alerts user logs & alerts server logs & alerts network logs & alerts service logs & alerts ticket APIs … 80% of INCIDENTS malware phishing cloud tenant breach app server takeover device theft offboarding … 80% of TASKS high-fidelity quick check investigative deep dive mitigation/containment/report table top training automation ... Overdue to make investigation structured & predictable! • Incident SLA • Investigation depth (burnout!) • Satellite team methodology • …
  • 23. G R A P H I S T R Y [email protected] Collective automation: Record-and-replay investigation templates! 2. Auto-expand virtual graph
  • 24. G R A P H I S T R Y [email protected] GPUs unlocking fast data @ scale for every step of your data pipeline 24 1 GPU w/ 1+ GB RAM Dedicated 16+ GPU per node w/ 500GB+ RAM Shared 1+ MB/s Big & fast data pushdown Database STREAMING WEBGL GRAPHICS OPTIMIZED NETWORKING GRAPH & TABULAR ANALYTICS © 2018 Graphistry, Inc. All rights reserved. Confidential and proprietary information. Do not distribute. [email protected]
  • 25. G R A P H I S T R Y [email protected] Graph reveal non-local stats on connected data (= all digital logs!) © 2018 Graphistry, Inc. All rights reserved. Confidential and proprietary information. Do not distribute. [email protected] | 25 Scoping Patterns & Outliers Influence & Critical Players Progression & Behavior
  • 26. G R A P H I S T R Y [email protected] RAPIDS UMAP layout Tensorflow categorization Graphistry visual analytics Splunk data lake regular review potential illicit activity potential trafficking 41K Reviews => 400 flagged
  • 27. G R A P H I S T R Y [email protected] Graph: Top 5 most suspicious co’s, their records, and hits on their metadata Explainable & key entities *pop* Graph for correlating entities across events
  • 28. G R A P H I S T R Y [email protected] Correlated macro view better than disconnected alerts & tickets! DEMO: 1w of FireEye HX over 546 IPs & 22 users
  • 29. G R A P H I S T R Y [email protected] Quickly popping insights Color by time, data source Expand 2 hops Expand by community Color by rank, btwness, … Visual data cleaning Model tuning
  • 30. G R A P H I S T R Y [email protected] 100X Compute: GPUs for everyone What if we could easily compute over full datasets in subsecond?
  • 31. G R A P H I S T R Y [email protected] Hunting: Finally possible to do 1M+ events/entities w/ web UIs! Ex: Bro/Zeek (secrepo.com)
  • 32. G R A P H I S T R Y [email protected] Faster Speeds, Real-World Benefits cuIO/cuDF – Load and Data Preparation cuML - XGBoost Time in seconds (shorter is better) cuIO/cuDF (Load and Data Prep) Data Conversion XGBoost Benchmark 200GB CSV dataset; Data prep includes joins, variable transformations CPU Cluster Configuration CPU nodes (61 GiB memory, 8 vCPUs, 64- bit platform), Apache Spark DGX Cluster Configuration 5x DGX-1 on InfiniBand network 8762 6148 3925 3221 322 213 End-to-End my_gdf.groupby([‘src_ip’,’dest_ip’])[‘time’].plot()
  • 33. G R A P H I S T R Y [email protected] cuGraph Multi-GPU PageRank Performance PageRank portion of the HiBench benchmark suite HiBench Scale Vertices Edges CSV File (GB) # of GPUs PageRank for 3 Iterations (secs) Huge 5,000,000 198,000,000 3 1 1.1 BigData 50,000,000 1,980,000,000 34 3 5.1 BigData x2 100,000,000 4,000,000,000 69 6 9.0 BigData x4 200,000,000 8,000,000,000 146 12 18.2 BigData x8 400,000,000 16,000,000,000 300 16 31.8 Graph().add_edges(my_df).pagerank()
  • 34. G R A P H I S T R Y [email protected] graph = netflow_df.sql(“““ SELECT sum(bytes), min(time), max(time) GROUP BY src_ip, dest_ip ”””) graphistry.plot(graph) BlazingSQL’s C++ skips cuDF’s Python Numba JIT… so _great_ for subsecond interactivity!
  • 35. G R A P H I S T R Y [email protected] Closing remarks: Scaling graph _projects_ Avoid failure to launch by avoiding infra & NIH: 1d-1mo: Cloud, viz, on-the-fly compute, notebooks, API connectors 3mo-never: Graph DB, Kafka ingest, Hadoop, on-prem, custom analytics, custom UIs Useful by design: Make user+problem #1 driver, not infra Win ROI politics w/ cupcake principle: Big projects start as small projects Lower switching costs by augmenting vs. replacing Everyone used to status quo and uninterested in avoidable work.. Start w/ good champions: Ideally innovative, influential, technical, & has time grow from there Gartner: “85% of data science projects fail.”