Information Visualisation: perception and principles
1 like784 views

This document discusses principles of information visualization and perception. It covers topics like moving illusions, pre-attentive processing, magnitude estimation, Gestalt grouping principles, color perception, and guidelines for effective use of color in visualization. Examples are provided to illustrate concepts like encoding methods, perceptual scaling, simultaneous contrast effects, and chromostereopsis. Readings on color selection and information visualization are recommended.


![Find the cherries
“Color helps us break camouflage”
[Ware, 2013]
Slide adapted from S. Hsiao](https://image.slidesharecdn.com/lecture2-iv-perception-20190217-190219080537/85/Information-Visualisation-perception-and-principles-60-320.jpg)


![Designing for color deficiency: Blue-Orange is safe
[Seriously Colorful: Advanced Color Principles & Practices.
Stone.Tableau Customer Conference 2014.]
Slide source: Tamara Munzner](https://image.slidesharecdn.com/lecture2-iv-perception-20190217-190219080537/85/Information-Visualisation-perception-and-principles-70-320.jpg)


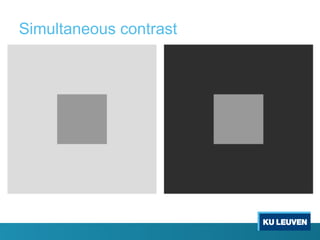


![Simultaneous brightness contrast
[Ware, 1988]](https://image.slidesharecdn.com/lecture2-iv-perception-20190217-190219080537/85/Information-Visualisation-perception-and-principles-88-320.jpg)

![Simultaneous contrast and errors in reading
maps
Gravity map of the North Atlantic Ocean. Large errors occur when gray-scale maps
are read using a key 20% error of the entire scale [Ware, 1988]](https://image.slidesharecdn.com/lecture2-iv-perception-20190217-190219080537/85/Information-Visualisation-perception-and-principles-90-320.jpg)
![Guideline
Avoid using gray scales as a method for representing more
than a few (two to four) numerical values [Ware, 2013]](https://image.slidesharecdn.com/lecture2-iv-perception-20190217-190219080537/85/Information-Visualisation-perception-and-principles-91-320.jpg)


![Haloing effect
• Enhancing the edges
• Luminance contrast as a
highlighting method
[Ware, 2013]
Slide adapted from S. Hsiao](https://image.slidesharecdn.com/lecture2-iv-perception-20190217-190219080537/85/Information-Visualisation-perception-and-principles-99-320.jpg)


Information Visualisation: perception and principles
- 1. Information Visualisation perception and principles Katrien Verbert [email protected]
- 2. Perception how our brain perceives and interprets visuals
- 6. Pre-attentive processing How do we make things pop-out?
- 10. Pre-attentive vs. attentive Pre-attentive ≤500 ms ≤10 ms parallel processing Attentive >500 ms >10 ms sequential processing Differences in speed of perception task individual object Slide adapted from Michael Porath
- 11. Pre-attentive processing “An understanding of what is processed pre-attentively is probably the most important contribution that visual science can make to data visualization” (Ware, 2004, p. 19)
- 12. Shape Different shapes can often pop out
- 13. Enclosure A single lack of enclosure can quickly be identified pre- attentively
- 14. The ‘odd one out’ can quickly be identified, by pre-attentive processing Orientation Pre-attentive processing: ‘things that pop out’
- 15. Colour A different colour can be pre-attentively identified
- 16. Did you notice the red square?
- 17. With conjunction encoding the red square is not pre- attentively identified
- 19. Where is Waldo?
- 20. Where is Waldo?
- 21. encoding methods
- 22. Magnitude estimation How much bigger is the lower bar?
- 23. Magnitude estimation How much bigger is the lower bar? X 4
- 24. Magnitude estimation How much bigger is the right circle?
- 25. Magnitude estimation How much bigger is the right circle? X 5
- 26. Magnitude estimation How much bigger is the right circle?
- 27. Magnitude estimation How much bigger is the right circle? X 9
- 29. Which one is more accurate?
- 30. Perceptual or apparent scaling Compensating magnitude to match perception
- 31. Cleveland and McGill (1984) Length Position Angle Slope Area Volume Colour Density Most accurate Least accurate Accuracy of judgment of encoded quantitative data
- 32. The marks are perceived as PROPORTIONAL to each other Association Selection Order Quantity Size Value Texture Colour Orientation Shape The marks can be perceived as SIMILAR The marks are perceived as DIFFERENT, forming families The marks are perceived as ORDERED Choice of encoding • Bertin’s guidance • suitability of various encoding methods • to support common tasks
- 33. First the user specifies three topics of interest User query Osteoporosis Prevention Research Example application that uses different encoding methods
- 34. (top) The TileBar representation of the relevance of paragraphs to the topic words: (bottom) a selected paragraph with topic words highlighted ‘Recent advances in the world of drugs’ Fortunately, scientific knowledge about this desease has grown, and there is reason for hope. for older women and through adequate calcium intake and regular weight-bearing exercise for people of all ages. New approaches to diagnosis and treatment are also under active investigation. For this work to continue and for use to take advantage of the knowledge we have already gained, public awareness of osteoporosis and of the importance of further scientific research is essential. Research is revealing that prevention may be achieved through estrogen replacement therapy TileBar: which encoding methods are used for which purposes?
- 35. Attribute types 35 Slide source: Tamara Munzner
- 36. Guidance for the encoding of quantitative, ordinal and categorical data (Mackinlay 1986) Quantitative Position Length Angle Slope Area Volume Density Shape Ordinal Position Density Colour saturation Texture Connection Containment Length Angle Slope Area Volume Colour hue Categorical Position Colour hue Texture Connection Containment Density Colour saturation Shape Length Angle Slope Area Volume Treble Bass Quantitative, ordinal and categorical data
- 37. Expressiveness types and effectiveness Slide source: Tamara Munzner
- 38. Expressiveness types and effectiveness rankings 38 Slide source: Tamara Munzner
- 39. Gestalt grouping
- 41. Principles: figure and ground Slide adapted from Michael Porath
- 42. Principles: proximity Slide adapted from Michael Porath
- 43. Principles: proximity Slide adapted from Michael Porath
- 44. Principles: similarity Slide adapted from Michael Porath
- 45. Principles: connectedness Slide adapted from Michael Porath
- 46. Principles: continuity Slide adapted from Michael Porath
- 47. Principles: continuity Slide adapted from Michael Porath
- 48. Principles: continuity Slide adapted from Michael Porath
- 49. Principles: closure Slide adapted from Michael Porath
- 50. Principles: closure Slide adapted from Michael Porath
- 51. Principles: closure Slide adapted from Michael Porath
- 52. Principles: closure Slide adapted from Michael Porath
- 53. Principles: smallness Slide adapted from Michael Porath
- 54. Principles: smallness Slide adapted from Michael Porath
- 55. Principles: surroundedness Slide adapted from Michael Porath
- 56. Principles: surroundness Slide adapted from Michael Porath
- 57. Guideline Use a combination of closure, common region and layout to ensure that data entities are represented by graphical patterns that will be perceived as figure, not ground.
- 59. Color
- 60. Find the cherries “Color helps us break camouflage” [Ware, 2013] Slide adapted from S. Hsiao
- 61. Snow white may be color blind? Slide adapted from S. Hsiao
- 62. Ready to eat Slide adapted from S. Hsiao
- 63. How we see color http://www.youtube.com/watch?v=l8_fZPHasdo
- 64. Trichromacy Theory: 3 color cones sensitivity functions Slide adapted from S. Hsiao
- 65. 10% CAUCASIAN MALE IS COLOR BLIND! Slide adapted from S. Hsiao
- 66. Color Tests Information Visualization Course, Katy Börner • The individual with normal color vision will see a 5 revealed in the dot pattern. • An individual with Red/Green (the most common) color deficiency will see a 2 revealed in the dots. http://www.visibone.com/colorblind/
- 67. Color blindness
- 68. We often take color for granted • How do blind people learn colors? • How do colorblind people drive? Slide adapted from S. Hsiao
- 70. Designing for color deficiency: Blue-Orange is safe [Seriously Colorful: Advanced Color Principles & Practices. Stone.Tableau Customer Conference 2014.] Slide source: Tamara Munzner
- 73. How to use colors • hue: categorical • saturation: ordinal and quantitative • luminance: ordinal and quantitative
- 77. ColorBrewer2.org
- 78. Good or bad use of colors?
- 88. Simultaneous brightness contrast [Ware, 1988]
- 90. Simultaneous contrast and errors in reading maps Gravity map of the North Atlantic Ocean. Large errors occur when gray-scale maps are read using a key 20% error of the entire scale [Ware, 1988]
- 91. Guideline Avoid using gray scales as a method for representing more than a few (two to four) numerical values [Ware, 2013]
- 92. All colors are equal …but they are not perceived as the same
- 93. All colors are equal …but they are not perceived as the same Luminance Value Perceived lightness
- 95. Spectral sensitivity Slide source: Tamara Munzner
- 96. Color decisions need to consider luminance / contrast Slide adapted from S. Hsiao
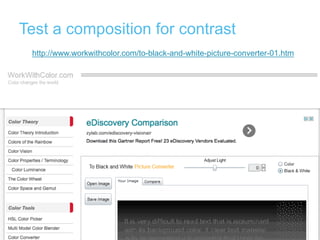
- 97. Test a composition for contrast http://www.workwithcolor.com/to-black-and-white-picture-converter-01.htm
- 99. Haloing effect • Enhancing the edges • Luminance contrast as a highlighting method [Ware, 2013] Slide adapted from S. Hsiao
- 100. Slide adapted from S. Hsiao Saturation
- 101. Highlighting: make small subset clearly distinct from the rest same principles apply to the highlighting of text or other features Slide adapted from S. Hsiao
- 102. Guidelines • Use more saturated colors for small symbols, thin lines, or small areas. • Use less saturated colors for large areas.
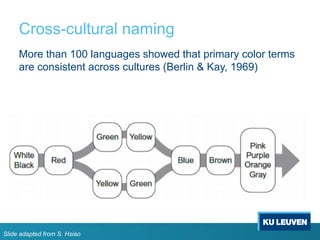
- 103. Cross-cultural naming More than 100 languages showed that primary color terms are consistent across cultures (Berlin & Kay, 1969) Slide adapted from S. Hsiao
- 104. Ware’s Recommended Colors for Labeling Slide adapted from Terrance Brooke Red, Green, Yellow, Blue, Black, White, Pink, Cyan, Gray, Orange, Brown, Purple. The entire set corresponds to the eleven color names found to be the most common in a cross-cultural study, plus cyan (Berlin and Kay)
- 105. Guideline Use easy-to-remember and consistent color codes in color pallets Red, green, blue and yellow are hard-wired into the brain as primaries. If it is necessary to remember a color coding, these colors are the first that should be considered.
- 106. Chromostereopsis Slide adapted from S. Hsiao
- 107. How we used to think it works Old model: Light of different wavelengths is focused differently by the eye. Src: http://luminanze.com/writings/chromostereopsis_in_ux_design.html
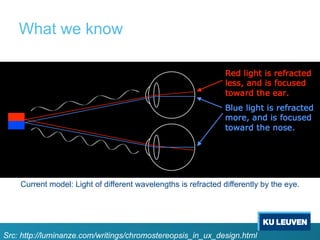
- 108. What we know Current model: Light of different wavelengths is refracted differently by the eye. Src: http://luminanze.com/writings/chromostereopsis_in_ux_design.html
- 109. chromostereopsis If we use in the same image two far pure colors the eye is not able to focus both of them
- 110. Easy to read?
- 111. Easy to read?
- 112. How to use chromostereopsis
- 113. How to use chromostereopsis
- 114. Good or bad?
- 115. Good or bad?
- 116. Solution: use colors that are less saturated
- 117. Guidelines • Beware of interactions between some colors (e.g. red/blue) • Use can be good: for highlighting, creating 3D effect, etc. • Resolve if unintended by: o using colors that are less saturated o surrounding the contrasting colors with a background that moderates the effect of their different wavelengths o separating the contrasting colors. http://desdag.blogspot.be/2012/05/chromostereopsis-design-fails-due-to.html
- 118. We are drawn by colors!
- 119. Do different colors affect mood? http://www.factmonster.com/spot/colors1.html
- 120. Moodjam.com
- 121. some examples
- 122. Good or bad us of colors?
- 123. Good or bad use of colors?
- 124. Good or bad?
- 125. Good or bad?
- 127. Good or bad use of colors?
- 130. Some take away messages • Color is excellent for labeling and categorization. (However, only small number of colors can be used effectively) • To show detail in visualization, always have considerable luminance contrast between background and foreground. • Simultaneous contrast with background colors can dramatically alter color appearance, making color look like another. • Beware of interaction between colors (e.g. red/blue). • Small color coded objects should be given high saturation. • Red, green, blue and yellow are hard-wired into the brain as primaries. If it is necessary to remember a color coding, these colors are the first that should be considered. • Remember that colors have meanings: use appropriate color palettes for qualitative, quantitative and ordinal data. • Respect the color blind.
- 131. Readings Required • Harrower, M., & Brewer, C. A. (2003). ColorBrewer. org: an online tool for selecting colour schemes for maps. Cartographic Journal, The, 40(1), 27- 37. Available at: http://www.albany.edu/faculty/fboscoe/papers/harrower2003.pd f Optional • Ware, C. (2013). Information visualization: Perception for design. Chapter 3: Lightness, Brightness, Contrast, and Constancy. Available at:http://www.diliaranasirova.com/assets/PSYC579/pdfs/01.1-Ware.pdf • Munzner, T. (2014) Visualization Analysis and Design – Chapter 2, 10
- 132. Optical Illusions 132 • Joy of Visual Perception by Pete Kaiser
- 133. Questions?
- 134. References • Pourang Irani and Rasit Eskicioglu. (2003). A Space-filling Visualization Technique for Cellular Network Data. In International Conference on Knowledge Management (IKNOW-03), 115- 120http://hci.cs.umanitoba.ca/assets/publication_files/2003 -Irani-IKNOW-CellularViz.pdf • Ware, C. (2013). Information visualization: Perception for design. Chapter 3-5 • Mackinlay, J. (1986). Automating the design of graphical presentations of relational information. ACM Transactions on Graphics (TOG), 5(2), 110-141.