SlideShare a Scribd company logo
Extending lifespan
with R and Hadoop
    Radek Maciaszek
    Founder of DataMine Lab, CTO
    Ad4Game, studying towards
    PhD in Bioinformatics at UCL
Agenda
●   Project background
●   Parallel computing in R
●   Hadoop + R
●   Future work (Storm)
●   Results and summary


                              2
Project background
●   Lifespan extension - project at UCL during MSc in
    Bioinformatics
●   Bioinformatics – computer science in biology (DNA,
    Proteins, Drug discovery, etc.)
●   Institute of Healthy Ageing at UCL – lifespan is a king.
    Dozens of scientists, dedicated journals.
●
    Ageing is a complex process or is it? C. Elegans (2x by
    a single gene DAF-2, 10x).
●   Goal of the project: find genes responsible for ageing


                                                               3
                    Caenorhabditis Elegans
Primer in Bioinformatics
●   Central dogma of molecular biology
●   Cell (OS+3D), Gene (Program), TF (head on HDD)
●   How to find ageing genes (such as DAF-2)?


                                                                    4
                                                Images: Wikipedia
RNA microarray


   DAF-2 pathway in C. elegans
   Source: Partridge & Gems, 2002   Source: Staal et al, 2003   5
Goal: raw data → network
                         Genes Network
                         ● Pairwise comparisons of
                           10k x 10k genes +
                           clustering


   100 x 100 x 50 x 10
     (~10k genes)

                                                     6
Why R?
●   Incredibly powerful for data science with
    big data
●   Functional, scripting programming
    language with many packages.
●   Popular in mathematics, bioinformatics,
    finance, social science and more.
●   TechCrunch lists R as trendy technology for
    BigData.
●   Designed by statisticians for statisticians
                                                  7
R example
K-Means clustering
require(graphics)

x <- rbind(matrix(rnorm(100, sd = 0.3),
        ncol = 2),
        matrix(rnorm(100, mean = 1,
        sd = 0.3), ncol = 2))
colnames(x) <- c("x", "y")
(cl <- kmeans(x, 2))
plot(x, col = cl$cluster)
points(cl$centers, col = 1:2,
       pch = 8, cex=2)


                                          8
R limitations & Hadoop
●   10k x 10k (100MM) Fisher exact
    correlations is slow
●   Memory allocation is a common problem
●   Single-threaded
●   Hadoop integration:
    –   Hadoop Streaming
    –   Rhipe: http://ml.stat.purdue.edu/rhipe/
    –   Segue: http://code.google.com/p/segue/

                                                  9
Scaling R
●   Explicit
    –   snow, parallel, foreach
●   Implicit
    –   multicore (2.14.0)
●   Hadoop
    –   RHIPE, rmr, Segue, RHadoop
●   Storage
    –   rhbase, rredis, Rcassandra, rhdfs

                                            10
R and Hadoop
  ●   Streaming API (low level)
mapper.R

#!/usr/bin/env Rscript
in <- file(“stdin”, “r”)
while (TRUE) {
   lineStr <- readLines(in, n=1)
   line <- unlist(strsplit(line, “,”))
   ret = expensiveCalculations(line)
   cat(data, “n”, sep=””)
}
close(in)

jar hadoop-streaming-*.jar –input data.csv –output data.out –mapper mapper.R


                                                                               11
RHIPE
●   Can use with your Hadoop cluster
●   Write mappers/reduces using R only
                                    map <- expression({
     z <-                             f <- table(unlist(strsplit(unlist(
     rhmr(map=map,reduce=reduce,           map.values)," ")))
     inout=c("text","sequence")       n <- names(f)
           ,ifolder=filename          p <- as.numeric(f)
           ,ofolder=sprintf("%s-      sapply(seq_along(n),function(r)
            out",filename))                  rhcollect(n[r],p[r]))
                                    })
     job.result <-
     rhstatus(rhex(z,async=TRUE),   reduce <- expression(
              mon.sec=2)               pre={ total <- 0},
                                       reduce = { total <-
                                         total+sum(unlist(reduce.values)) },
                                       post = { rhcollect(reduce.key,total) }
                                     )
                                                                           12
                                      Example from Rhipe Wiki
Segue
●   Works with Amazon Elastic MapReduce.
●   Creates a cluster for you.
●   Designed for Big Computations (rather than
    Big Data)
●   Implements a cloud version of lapply()
●   Parallelization in 2 lines of code!
●   Allowed us to speed up calculations down
    to 2h with the use of 16 servers

                                                 13
Segue workflow (emrlapply)


                             14
lapply()
m <- list(a = 1:10, b = exp(-3:3))

lapply(m, mean)$a
[1] 5.5
$b
[1] 4.535125

lapply(X, FUN)
returns a list of the same length as X, each element of which is
the result of applying FUN to the corresponding element of X.


                                                                   15
Segue in a cluster
> AnalysePearsonCorelation <- function(probe) {
  A.vector <- experiments.matrix[probe,]
  p.values <- c()
  for(probe.name in rownames(experiments.matrix)) {
     B.vector <- experiments.matrix[probe.name,]
     p.values <- c(p.values, cor.test(A.vector, B.vector)$p.value)
  }
  return (p.values)
}

> # pearson.cor <- lapply(probes, AnalysePearsonCorelation)

Moving to the cloud in 3 lines of code!


                                                                     16
Segue in a cluster
> AnalysePearsonCorelation <- function(probe) {
  A.vector <- experiments.matrix[probe,]
  p.values <- c()
  for(probe.name in rownames(experiments.matrix)) {
     B.vector <- experiments.matrix[probe.name,]
     p.values <- c(p.values, cor.test(A.vector, B.vector)$p.value)
  }
  return (p.values)
}

> # pearson.cor <- lapply(probes, AnalysePearsonCorelation)
> myCluster <- createCluster(numInstances=5,
     masterBidPrice="0.68”, slaveBidPrice="0.68”,
     masterInstanceType=”c1.xlarge”,
     slaveInstanceType=”c1.xlarge”, copy.image=TRUE)
> pearson.cor <- emrlapply(myCluster, probes,
   AnalysePearsonCorelation)
> stopCluster(myCluster)


                                                                     17
R + HBase
library(rhbase)
hb.init(serialize="raw")

#create new table
hb.new.table("mytable", "x","y","z",opts=list(y=list(compression='GZ')))

#insert some values into the table
hb.insert("mytable",list( list(1,c("x","y","z"),list("apple","berry","cherry"))))

rows<-hb.scan.ex("mytable",filterstring="ValueFilter(=,'substring:ber')")
rows$get()


    https://github.com/RevolutionAnalytics/RHadoop/wiki/rhbase


                                                                                    18
Discovering genes
                                         Topomaps of clustered genes


  This work was based on:A Gene Expression Map for
  Caenorhabditis elegans, Stuart K. Kim, et al., Science 293,
  2087 (2001)

                                                                       19
Genes clusters


                                 Clusters based on Fisher
                                 exactpairwise genes comparisons


    Green lines represent random probes
    Red lines represent up-regulated probes
    Blue lines are down-regulated probes
    (in daf-2 vs daf-2;daf-16 experiment)                          20
Genes networks


    Network created with Cytoscape, platform
    for complex network analysis:
    http://www.cytoscape.org/
                                               21
Future work - real time R
●   Hadoop has high throughput but for small
    tasks is slow. It is not good for continuous
    calculations.
●   A possible solution is to use Storm
●   Storm multilang can be used with any
    language, including R


                                                   22
Storm R

                                   Storm may be easily integrated with
                                   third party languages and databases:

                                   ●   Java
                                   ●   Python
                                   ●   Ruby

                                   ●   Redis
                                   ●   Hbase
                                   ●   Cassandra


 Image source: Storm github wiki


                                                                          23
Storm R
 source("storm.R")

 initialize <- function()
 {
    emitBolt(list("bolt initializing"))
 }

 process <- function(tup)
 {
   word <- tup$tuple
   rand <- runif(1)
   if (rand < 0.75) {
       emitBolt(list(word + "lalala"))
   } else {
       log(word + " randomly skipped!")
   }
 }

 boltRun(process, initialize)

                          https://github.com/rathko/storm   24
Summary
●   It’s easy to scale R using Hadoop.
●   R is not only great for statistics, it is a versatile
    programming language.
●   Is ageing a disease? Are we all going to live very long
    lives?


                                                              25
Questions?
●   References:
    http://hadoop.apache.org/
    http://hbase.apache.org/
    http://code.google.com/p/segue/
    http://www.datadr.org/
    https://github.com/RevolutionAnalytics/
    https://github.com/rathko/storm


                                              26

More Related Content

What's hot (20)

PDF
Wprowadzenie do technologii Big Data / Intro to Big Data Ecosystem
Sages
 
PDF
Hypertable - massively scalable nosql database
bigdatagurus_meetup
 
PDF
Hypertable
betaisao
 
PDF
Python for R Users
Ajay Ohri
 
PPT
Database Architectures and Hypertable
hypertable
 
PPTX
Practical Hadoop using Pig
David Wellman
 
PDF
Introducción a hadoop
datasalt
 
PPT
Spark training-in-bangalore
Kelly Technologies
 
KEY
Tokyo Cabinet & Tokyo Tyrant
輝 子安
 
PPTX
GraphFrames Access Methods in DSE Graph
Jim Hatcher
 
PPTX
Apache pig presentation_siddharth_mathur
Siddharth Mathur
 
PDF
Spark 4th Meetup Londond - Building a Product with Spark
samthemonad
 
PDF
20141111 파이썬으로 Hadoop MR프로그래밍
Tae Young Lee
 
PDF
Hadoop Pig: MapReduce the easy way!
Nathan Bijnens
 
PPTX
Python for R users
Satyarth Praveen
 
PPTX
Apache pig presentation_siddharth_mathur
Siddharth Mathur
 
PDF
Parquet - Data I/O - Philadelphia 2013
larsgeorge
 
PDF
Introduction to Pig & Pig Latin | Big Data Hadoop Spark Tutorial | CloudxLab
CloudxLab
 
PDF
How to use Parquet as a basis for ETL and analytics
Julien Le Dem
 
Wprowadzenie do technologii Big Data / Intro to Big Data Ecosystem
Sages
 
Hypertable - massively scalable nosql database
bigdatagurus_meetup
 
Hypertable
betaisao
 
Python for R Users
Ajay Ohri
 
Database Architectures and Hypertable
hypertable
 
Practical Hadoop using Pig
David Wellman
 
Introducción a hadoop
datasalt
 
Spark training-in-bangalore
Kelly Technologies
 
Tokyo Cabinet & Tokyo Tyrant
輝 子安
 
GraphFrames Access Methods in DSE Graph
Jim Hatcher
 
Apache pig presentation_siddharth_mathur
Siddharth Mathur
 
Spark 4th Meetup Londond - Building a Product with Spark
samthemonad
 
20141111 파이썬으로 Hadoop MR프로그래밍
Tae Young Lee
 
Hadoop Pig: MapReduce the easy way!
Nathan Bijnens
 
Python for R users
Satyarth Praveen
 
Apache pig presentation_siddharth_mathur
Siddharth Mathur
 
Parquet - Data I/O - Philadelphia 2013
larsgeorge
 
Introduction to Pig & Pig Latin | Big Data Hadoop Spark Tutorial | CloudxLab
CloudxLab
 
How to use Parquet as a basis for ETL and analytics
Julien Le Dem
 

Viewers also liked (9)

PPTX
R Analytics in the Cloud
DataMine Lab
 
PPTX
Data Stream Algorithms in Storm and R
Radek Maciaszek
 
PPTX
Resource Aware Scheduling in Apache Storm
DataWorks Summit/Hadoop Summit
 
PDF
Scaling Apache Storm - Strata + Hadoop World 2014
P. Taylor Goetz
 
PDF
Storm: distributed and fault-tolerant realtime computation
nathanmarz
 
PDF
Realtime Analytics with Storm and Hadoop
DataWorks Summit
 
PPTX
Yahoo compares Storm and Spark
Chicago Hadoop Users Group
 
PPTX
Apache Storm 0.9 basic training - Verisign
Michael Noll
 
PDF
Hadoop Summit Europe 2014: Apache Storm Architecture
P. Taylor Goetz
 
R Analytics in the Cloud
DataMine Lab
 
Data Stream Algorithms in Storm and R
Radek Maciaszek
 
Resource Aware Scheduling in Apache Storm
DataWorks Summit/Hadoop Summit
 
Scaling Apache Storm - Strata + Hadoop World 2014
P. Taylor Goetz
 
Storm: distributed and fault-tolerant realtime computation
nathanmarz
 
Realtime Analytics with Storm and Hadoop
DataWorks Summit
 
Yahoo compares Storm and Spark
Chicago Hadoop Users Group
 
Apache Storm 0.9 basic training - Verisign
Michael Noll
 
Hadoop Summit Europe 2014: Apache Storm Architecture
P. Taylor Goetz
 
Ad

Similar to Extending lifespan with Hadoop and R (20)

PPTX
The Powerful Marriage of Hadoop and R (David Champagne)
Revolution Analytics
 
PPTX
Hadoop World 2011: The Powerful Marriage of R and Hadoop - David Champagne, R...
Cloudera, Inc.
 
PDF
Getting started with R & Hadoop
Jeffrey Breen
 
PDF
Running R on Hadoop - CHUG - 20120815
Chicago Hadoop Users Group
 
PPTX
R for hadoopers
Gwen (Chen) Shapira
 
PDF
R, Hadoop and Amazon Web Services
Portland R User Group
 
PDF
"R, Hadoop, and Amazon Web Services (20 December 2011)"
Portland R User Group
 
PDF
R - the language
Mike Martinez
 
PPTX
A Step Towards Reproducibility in R
Revolution Analytics
 
PDF
Data Hacking with RHadoop
Ed Kohlwey
 
PDF
Microsoft R - Data Science at Scale
Sascha Dittmann
 
PPTX
Integration Method of R and Hadoop and Intro
jokerroyy2023
 
PDF
Open source analytics
Ajay Ohri
 
PPTX
Fundamental of Big Data with Hadoop and Hive
Sharjeel Imtiaz
 
PPTX
Using R on High Performance Computers
Dave Hiltbrand
 
PPTX
Big Data Analysis With RHadoop
David Chiu
 
PDF
Language-agnostic data analysis workflows and reproducible research
Andrew Lowe
 
PDF
Big Data Step-by-Step: Using R & Hadoop (with RHadoop's rmr package)
Jeffrey Breen
 
PPTX
Building a Scalable Data Science Platform with R
DataWorks Summit/Hadoop Summit
 
PDF
Big Data Analysis Starts with R
Revolution Analytics
 
The Powerful Marriage of Hadoop and R (David Champagne)
Revolution Analytics
 
Hadoop World 2011: The Powerful Marriage of R and Hadoop - David Champagne, R...
Cloudera, Inc.
 
Getting started with R & Hadoop
Jeffrey Breen
 
Running R on Hadoop - CHUG - 20120815
Chicago Hadoop Users Group
 
R for hadoopers
Gwen (Chen) Shapira
 
R, Hadoop and Amazon Web Services
Portland R User Group
 
"R, Hadoop, and Amazon Web Services (20 December 2011)"
Portland R User Group
 
R - the language
Mike Martinez
 
A Step Towards Reproducibility in R
Revolution Analytics
 
Data Hacking with RHadoop
Ed Kohlwey
 
Microsoft R - Data Science at Scale
Sascha Dittmann
 
Integration Method of R and Hadoop and Intro
jokerroyy2023
 
Open source analytics
Ajay Ohri
 
Fundamental of Big Data with Hadoop and Hive
Sharjeel Imtiaz
 
Using R on High Performance Computers
Dave Hiltbrand
 
Big Data Analysis With RHadoop
David Chiu
 
Language-agnostic data analysis workflows and reproducible research
Andrew Lowe
 
Big Data Step-by-Step: Using R & Hadoop (with RHadoop's rmr package)
Jeffrey Breen
 
Building a Scalable Data Science Platform with R
DataWorks Summit/Hadoop Summit
 
Big Data Analysis Starts with R
Revolution Analytics
 
Ad

Recently uploaded (20)

PDF
Smart Trailers 2025 Update with History and Overview
Paul Menig
 
PDF
"AI Transformation: Directions and Challenges", Pavlo Shaternik
Fwdays
 
PDF
LOOPS in C Programming Language - Technology
RishabhDwivedi43
 
PDF
Staying Human in a Machine- Accelerated World
Catalin Jora
 
PDF
Using FME to Develop Self-Service CAD Applications for a Major UK Police Force
Safe Software
 
PDF
Transforming Utility Networks: Large-scale Data Migrations with FME
Safe Software
 
PPTX
WooCommerce Workshop: Bring Your Laptop
Laura Hartwig
 
PPTX
From Sci-Fi to Reality: Exploring AI Evolution
Svetlana Meissner
 
PDF
Jak MŚP w Europie Środkowo-Wschodniej odnajdują się w świecie AI
dominikamizerska1
 
PDF
CIFDAQ Market Wrap for the week of 4th July 2025
CIFDAQ
 
PDF
Advancing WebDriver BiDi support in WebKit
Igalia
 
PPTX
AUTOMATION AND ROBOTICS IN PHARMA INDUSTRY.pptx
sameeraaabegumm
 
PPTX
The Project Compass - GDG on Campus MSIT
dscmsitkol
 
PPTX
AI Penetration Testing Essentials: A Cybersecurity Guide for 2025
defencerabbit Team
 
PDF
New from BookNet Canada for 2025: BNC BiblioShare - Tech Forum 2025
BookNet Canada
 
PDF
CIFDAQ Token Spotlight for 9th July 2025
CIFDAQ
 
PDF
July Patch Tuesday
Ivanti
 
PPTX
Webinar: Introduction to LF Energy EVerest
DanBrown980551
 
PDF
POV_ Why Enterprises Need to Find Value in ZERO.pdf
darshakparmar
 
PDF
What Makes Contify’s News API Stand Out: Key Features at a Glance
Contify
 
Smart Trailers 2025 Update with History and Overview
Paul Menig
 
"AI Transformation: Directions and Challenges", Pavlo Shaternik
Fwdays
 
LOOPS in C Programming Language - Technology
RishabhDwivedi43
 
Staying Human in a Machine- Accelerated World
Catalin Jora
 
Using FME to Develop Self-Service CAD Applications for a Major UK Police Force
Safe Software
 
Transforming Utility Networks: Large-scale Data Migrations with FME
Safe Software
 
WooCommerce Workshop: Bring Your Laptop
Laura Hartwig
 
From Sci-Fi to Reality: Exploring AI Evolution
Svetlana Meissner
 
Jak MŚP w Europie Środkowo-Wschodniej odnajdują się w świecie AI
dominikamizerska1
 
CIFDAQ Market Wrap for the week of 4th July 2025
CIFDAQ
 
Advancing WebDriver BiDi support in WebKit
Igalia
 
AUTOMATION AND ROBOTICS IN PHARMA INDUSTRY.pptx
sameeraaabegumm
 
The Project Compass - GDG on Campus MSIT
dscmsitkol
 
AI Penetration Testing Essentials: A Cybersecurity Guide for 2025
defencerabbit Team
 
New from BookNet Canada for 2025: BNC BiblioShare - Tech Forum 2025
BookNet Canada
 
CIFDAQ Token Spotlight for 9th July 2025
CIFDAQ
 
July Patch Tuesday
Ivanti
 
Webinar: Introduction to LF Energy EVerest
DanBrown980551
 
POV_ Why Enterprises Need to Find Value in ZERO.pdf
darshakparmar
 
What Makes Contify’s News API Stand Out: Key Features at a Glance
Contify
 

Extending lifespan with Hadoop and R

  • 1. Extending lifespan with R and Hadoop Radek Maciaszek Founder of DataMine Lab, CTO Ad4Game, studying towards PhD in Bioinformatics at UCL
  • 2. Agenda ● Project background ● Parallel computing in R ● Hadoop + R ● Future work (Storm) ● Results and summary 2
  • 3. Project background ● Lifespan extension - project at UCL during MSc in Bioinformatics ● Bioinformatics – computer science in biology (DNA, Proteins, Drug discovery, etc.) ● Institute of Healthy Ageing at UCL – lifespan is a king. Dozens of scientists, dedicated journals. ● Ageing is a complex process or is it? C. Elegans (2x by a single gene DAF-2, 10x). ● Goal of the project: find genes responsible for ageing 3 Caenorhabditis Elegans
  • 4. Primer in Bioinformatics ● Central dogma of molecular biology ● Cell (OS+3D), Gene (Program), TF (head on HDD) ● How to find ageing genes (such as DAF-2)? 4 Images: Wikipedia
  • 5. RNA microarray DAF-2 pathway in C. elegans Source: Partridge & Gems, 2002 Source: Staal et al, 2003 5
  • 6. Goal: raw data → network Genes Network ● Pairwise comparisons of 10k x 10k genes + clustering 100 x 100 x 50 x 10 (~10k genes) 6
  • 7. Why R? ● Incredibly powerful for data science with big data ● Functional, scripting programming language with many packages. ● Popular in mathematics, bioinformatics, finance, social science and more. ● TechCrunch lists R as trendy technology for BigData. ● Designed by statisticians for statisticians 7
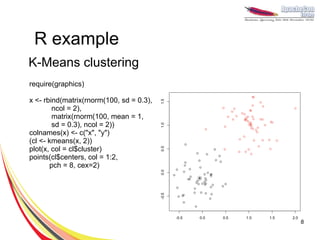
  • 8. R example K-Means clustering require(graphics) x <- rbind(matrix(rnorm(100, sd = 0.3), ncol = 2), matrix(rnorm(100, mean = 1, sd = 0.3), ncol = 2)) colnames(x) <- c("x", "y") (cl <- kmeans(x, 2)) plot(x, col = cl$cluster) points(cl$centers, col = 1:2, pch = 8, cex=2) 8
  • 9. R limitations & Hadoop ● 10k x 10k (100MM) Fisher exact correlations is slow ● Memory allocation is a common problem ● Single-threaded ● Hadoop integration: – Hadoop Streaming – Rhipe: http://ml.stat.purdue.edu/rhipe/ – Segue: http://code.google.com/p/segue/ 9
  • 10. Scaling R ● Explicit – snow, parallel, foreach ● Implicit – multicore (2.14.0) ● Hadoop – RHIPE, rmr, Segue, RHadoop ● Storage – rhbase, rredis, Rcassandra, rhdfs 10
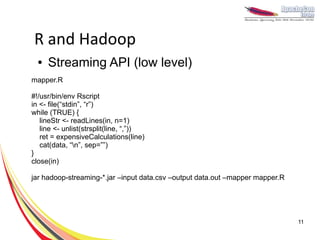
  • 11. R and Hadoop ● Streaming API (low level) mapper.R #!/usr/bin/env Rscript in <- file(“stdin”, “r”) while (TRUE) { lineStr <- readLines(in, n=1) line <- unlist(strsplit(line, “,”)) ret = expensiveCalculations(line) cat(data, “n”, sep=””) } close(in) jar hadoop-streaming-*.jar –input data.csv –output data.out –mapper mapper.R 11
  • 12. RHIPE ● Can use with your Hadoop cluster ● Write mappers/reduces using R only map <- expression({ z <- f <- table(unlist(strsplit(unlist( rhmr(map=map,reduce=reduce, map.values)," "))) inout=c("text","sequence") n <- names(f) ,ifolder=filename p <- as.numeric(f) ,ofolder=sprintf("%s- sapply(seq_along(n),function(r) out",filename)) rhcollect(n[r],p[r])) }) job.result <- rhstatus(rhex(z,async=TRUE), reduce <- expression( mon.sec=2) pre={ total <- 0}, reduce = { total <- total+sum(unlist(reduce.values)) }, post = { rhcollect(reduce.key,total) } ) 12 Example from Rhipe Wiki
  • 13. Segue ● Works with Amazon Elastic MapReduce. ● Creates a cluster for you. ● Designed for Big Computations (rather than Big Data) ● Implements a cloud version of lapply() ● Parallelization in 2 lines of code! ● Allowed us to speed up calculations down to 2h with the use of 16 servers 13
  • 15. lapply() m <- list(a = 1:10, b = exp(-3:3)) lapply(m, mean)$a [1] 5.5 $b [1] 4.535125 lapply(X, FUN) returns a list of the same length as X, each element of which is the result of applying FUN to the corresponding element of X. 15
  • 16. Segue in a cluster > AnalysePearsonCorelation <- function(probe) { A.vector <- experiments.matrix[probe,] p.values <- c() for(probe.name in rownames(experiments.matrix)) { B.vector <- experiments.matrix[probe.name,] p.values <- c(p.values, cor.test(A.vector, B.vector)$p.value) } return (p.values) } > # pearson.cor <- lapply(probes, AnalysePearsonCorelation) Moving to the cloud in 3 lines of code! 16
  • 17. Segue in a cluster > AnalysePearsonCorelation <- function(probe) { A.vector <- experiments.matrix[probe,] p.values <- c() for(probe.name in rownames(experiments.matrix)) { B.vector <- experiments.matrix[probe.name,] p.values <- c(p.values, cor.test(A.vector, B.vector)$p.value) } return (p.values) } > # pearson.cor <- lapply(probes, AnalysePearsonCorelation) > myCluster <- createCluster(numInstances=5, masterBidPrice="0.68”, slaveBidPrice="0.68”, masterInstanceType=”c1.xlarge”, slaveInstanceType=”c1.xlarge”, copy.image=TRUE) > pearson.cor <- emrlapply(myCluster, probes, AnalysePearsonCorelation) > stopCluster(myCluster) 17
  • 18. R + HBase library(rhbase) hb.init(serialize="raw") #create new table hb.new.table("mytable", "x","y","z",opts=list(y=list(compression='GZ'))) #insert some values into the table hb.insert("mytable",list( list(1,c("x","y","z"),list("apple","berry","cherry")))) rows<-hb.scan.ex("mytable",filterstring="ValueFilter(=,'substring:ber')") rows$get() https://github.com/RevolutionAnalytics/RHadoop/wiki/rhbase 18
  • 19. Discovering genes Topomaps of clustered genes This work was based on:A Gene Expression Map for Caenorhabditis elegans, Stuart K. Kim, et al., Science 293, 2087 (2001) 19
  • 20. Genes clusters Clusters based on Fisher exactpairwise genes comparisons Green lines represent random probes Red lines represent up-regulated probes Blue lines are down-regulated probes (in daf-2 vs daf-2;daf-16 experiment) 20
  • 21. Genes networks Network created with Cytoscape, platform for complex network analysis: http://www.cytoscape.org/ 21
  • 22. Future work - real time R ● Hadoop has high throughput but for small tasks is slow. It is not good for continuous calculations. ● A possible solution is to use Storm ● Storm multilang can be used with any language, including R 22
  • 23. Storm R Storm may be easily integrated with third party languages and databases: ● Java ● Python ● Ruby ● Redis ● Hbase ● Cassandra Image source: Storm github wiki 23
  • 24. Storm R source("storm.R") initialize <- function() { emitBolt(list("bolt initializing")) } process <- function(tup) { word <- tup$tuple rand <- runif(1) if (rand < 0.75) { emitBolt(list(word + "lalala")) } else { log(word + " randomly skipped!") } } boltRun(process, initialize) https://github.com/rathko/storm 24
  • 25. Summary ● It’s easy to scale R using Hadoop. ● R is not only great for statistics, it is a versatile programming language. ● Is ageing a disease? Are we all going to live very long lives? 25
  • 26. Questions? ● References: http://hadoop.apache.org/ http://hbase.apache.org/ http://code.google.com/p/segue/ http://www.datadr.org/ https://github.com/RevolutionAnalytics/ https://github.com/rathko/storm 26