08 web-analytics chart-display-and-annotation
Download as PPT, PDF1 like331 views

The document provides an introduction to Google Analytics' report chart display and annotations, detailing how to view data points and associated annotations. Users can create new annotations, share or keep them private, and mark important items with a star feature. The guide emphasizes how to navigate and utilize these features for better data insights.


![Google Analytics Intro - Reports Today we covered: Chart Display and Annotation Contact me for more information on any item in the series . [email_address] Web Analytics Consultants](https://image.slidesharecdn.com/08-web-analyticschart-display-and-annotation-100804230450-phpapp02/85/08-web-analytics-chart-display-and-annotation-10-320.jpg)
08 web-analytics chart-display-and-annotation
- 1. Google Analytics Intro - Reports Chart Display and Annotation
- 2. Google Analytics Intro - Reports Chart Display & Annotations When hovering your mouse over any point on the data-over-time graph a Display pops up. Each one lists it's Date & Value
- 3. Google Analytics Intro - Reports Chart Display & Annotations If your chart is selected to use the Compare to Past feature, then that comparative data will also be in the Display popup when you hover over the a data point.
- 4. Google Analytics Intro - Reports Chart Display & Annotations If a data point has an Annotation the Display will expand to indicate the number of annotations for it. In the example on the left you see this data point has 1 Annotation. An Annotation allows you to add a note regarding anything on your site. Relevant information / insight that applies to that day and possibly affecting that day's data.
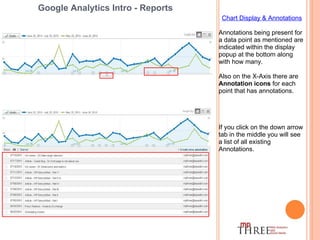
- 5. Google Analytics Intro - Reports Chart Display & Annotations Annotations being present for a data point as mentioned are indicated within the display popup at the bottom along with how many. Also on the X-Axis there are Annotation icons for each point that has annotations. If you click on the down arrow tab in the middle you will see a list of all existing Annotations.
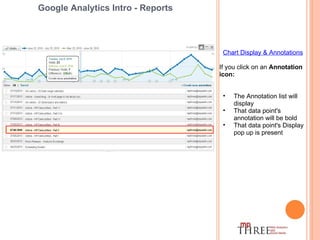
- 6. Google Analytics Intro - Reports Chart Display & Annotations If you click on an Annotation icon: The Annotation list will display That data point's annotation will be bold That data point's Display pop up is present
- 7. Google Analytics Intro - Reports Chart Display & Annotations To create a new Annotation click on the " Create new annotation " option available: At the bottom of the Display pop-up. or Top row on the right of the annotation list.
- 8. Google Analytics Intro - Reports Chart Display & Annotations Options when creating an annotation: Adjust the date Enter notes up to 160 chars Check option to share or keep private based on your login.
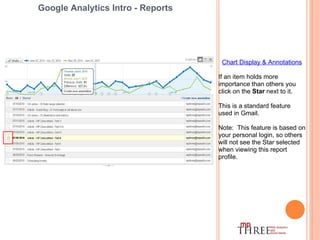
- 9. Google Analytics Intro - Reports Chart Display & Annotations If an item holds more importance than others you click on the Star next to it. This is a standard feature used in Gmail. Note: This feature is based on your personal login, so others will not see the Star selected when viewing this report profile.
- 10. Google Analytics Intro - Reports Today we covered: Chart Display and Annotation Contact me for more information on any item in the series . [email_address] Web Analytics Consultants