


![DEPENDABILITY: MEASURES
• Service accomplishment vs. service interruption
(transitions: failures vs. restorations)
• Module reliability: a measure of the continuous service
accomplishment
• A measure of reliability: MTTF – Mean Time To Failure
(1/[rate of failure]) reported in [failure/1billion hours of operation)
• MTTR – Mean time to repair (a measure for service interruption)
• MTBF – Mean time between failures (MTTF+MTTR)
• Module availability – a measure of the service accomplishment; =
MTTF/(MTTF+MTTR)](https://image.slidesharecdn.com/1-160903171218/85/1-Computer-Architecture-32-320.jpg)


![DEFINITION OF PERFORMANCE
We are primarily concerned with Response Time
Performance [things/sec]
“X is n times faster than Y”
As faster means both increased performance and
decreased execution time, to reduce confusion
will use “improve performance” or
“improve execution time”
)(_
1
)(
xtimeExecution
xePerformanc
)(
)(
)(_
)(_
yePerformanc
xePerformanc
xtimeExecution
ytimeExecution
n ](https://image.slidesharecdn.com/1-160903171218/85/1-Computer-Architecture-36-320.jpg)


1 Computer Architecture
- 2. OUTLINE • Introduction • Classes of Computers • Computer Architecture • Trends in Technology • Trends in Cost • Dependability • Measuring, Reporting and Summarizing Performance • Quantitative Principles of Computer Design
- 3. WHAT IS ARCHITECTURE? • Original sense: – Taking a range of building materials, putting together in desirable ways to achieve a building suited to its purpose • In Computer Science: – Similar: how parts are put together to achieve some overall goal – Examples: the architecture of a chip, of the Internet, of an enterprise database system, an email system, a cable TV distribution system Adapted from David Clark’s, What is “Architecture”?
- 4. WHY COMPUTER ARCHITECTURE? Exploit advances in technology Make things Faster, Smaller, Cheaper, … Which enables new applications Shrek 20 years ago? Make new things possible Accurate one-month weather forecasts? Cure for cancer? Life-like virtual reality? The advancement of computer architecture is vital for the advancement of all other areas of computing!
- 5. MOORE’S LAW (1965) • Transistors per inch square • Twice as many after ~1.5-2 years • Related trends • Processor performance Twice as fast after ~18 months • Memory capacity Twice as much in <2 years
- 6. GROWTH IN PROCESSOR PERFORMANCE 1 10 100 1000 10000 1978 1980 1982 1984 1986 1988 1990 1992 1994 1996 1998 2000 2002 2004 2006 Performance(vs.VAX-11/780) 25%/year 52%/year 20%/year • VAX : 25%/year 1978 to 1986 • RISC + x86: 52%/year 1986 to 2002 • RISC + x86: 20%/year 2002 to present From Hennessy and Patterson, Computer Architecture: A Quantitative Approach, 4th edition, October, 2006
- 7. OUTLINE • Introduction • Classes of Computers • Computer Architecture • Trends in Technology • Trends in Cost • Dependability • Measuring, Reporting and Summarizing Performance • Quantitative Principles of Computer Design
- 8. CHANGING FACE OF COMPUTING In the 1960s mainframes roamed the planet Very expensive, operators oversaw operations Applications: business data processing, large scale scientific computing In the 1970s, minicomputers emerged Less expensive, time sharing In the 1990s, Internet and WWW, handheld devices (PDA), high-performance consumer electronics for video games have emerged Dramatic changes have led to 3 different computing markets Servers, Desktop computing, Embedded Computers
- 9. DEPENDS ON THE CLASS OF PROCESSOR Feature Desktop Server Embedded Price of system (USD) $500-$5K $5K - $5M $10 - $100K (ex. high-end network routers) Price of CPU (per processor) $50 - $500 $200 - $10K $0.01 - $100 Critical design issues Price- performance, graphics performance Throughput, availability, scalability Price, power, application- specific performance
- 10. DESKTOP SYSTEMS • Examples – Intel Core 2 Duo – AMD Opteron • Applications: everything (general purpose) – Office, Internet, Multi-media, Video Games… • Goals – performance, price/performance – power affects cost, size
- 11. SERVERS Examples IBM Power Sun Niagara (T1) Intel Xeon Applications infrastructure: file server, email server, … business: web, e-commerce, databases Goals Throughput (transactions/second) Availability (reliability, dependability, fault tolerance …) Cost not a major issue
- 12. EMBEDDED • Examples – Xscale, ARM, MIPS, x86, … (many varieties) • Applications – cell phones, mp3 players, game consoles, consumer electronics (refrigerator, microwave), automobiles, … (many varieties) • Goals – Cost, Power – Sufficient performance, real-time performance – Size (CPU size, memory footprint, chip count…)
- 13. OUTLINE • Introduction • Classes of Computers • Computer Architecture • Trends in Technology • Trends in Cost • Dependability • Measuring, Reporting and Summarizing Performance • Quantitative Principles of Computer Design
- 14. TASK OF COMPUTER DESIGNER “Determine what attributes are important for a new machine; then design a machine to maximize performance while staying within cost, power, and availability constraints.” • Aspects of this task • Instruction set design • Functional organization • Logic design and implementation (IC design, packaging, power, cooling...)
- 15. WHAT IS COMPUTER ARCHITECTURE? • Instruction Set Architecture • the computer visible to the assembly language programmer or compiler writer (registers, data types, instruction set, instruction formats, addressing modes) • Organization • high level aspects of computer’s design such as the memory system, the bus structure, and the internal CPU (data path + control) design • Hardware • detailed logic design, interconnection and packing technology, external connections Computer Architecture covers all three aspects of computer design
- 16. INSTRUCTION SET ARCHITECTURE: CRITICAL INTERFACE Properties of a good abstraction Lasts through many generations (portability) Used in many different ways (generality) Provides convenient functionality to higher levels Permits an efficient implementation at lower levels instruction set software hardware
- 17. OUTLINE • Introduction • Classes of Computers • Computer Architecture • Trends in Technology • Trends in Cost • Dependability • Measuring, Reporting and Summarizing Performance • Quantitative Principles of Computer Design
- 18. TECHNOLOGY TRENDS Integrated circuit technology – 55% /year Transistor density – 35% per year Die size – 10-20% per year Semiconductor DRAM Density – 40-60% per year (4x in 3-4 years) Cycle time – 33% in 10 years Bandwidth – 66% in 10 years Magnetic disk technology Density – 100% per year Access time – 33% in 10 years Network technology (depends on switches and transmission technology) 10Mb-100Mb (10years) Bandwidth – doubles every year (for USA)
- 19. PROCESSOR TRANSISTOR COUNT Intel 4004, 2300tr (1971) Intel P4 – 55M tr (2001) Intel McKinley – 221M tr. (2001) Intel Core 2 Extreme Quad-core 2x291M tr. (2006)
- 20. OUTLINE • Introduction • Classes of Computers • Computer Architecture • Trends in Technology • Trends in Cost • Dependability • Measuring, Reporting and Summarizing Performance • Quantitative Principles of Computer Design
- 21. WHY DO YOU CARE ABOUT PRICES? • Target market, target prices place a limit on the cost of my processor – price = what I sell the part for – cost = what it costs me • Design decisions affect the cost (and price) – Ex. adding more cache may improve performance, but increase cost • Price-performance is often what we’re trying to balance So what determines price/cost?
- 22. COST, PRICE, AND THEIR TRENDS Price – what you sell a good for Cost – what you spent to produce it Understanding cost Learning curve principle – manufacturing costs decrease over time (even without major improvements in implementation technology) Best measured by change in yield – the percentage of manufactured devices that survives the testing procedure Volume (number of products manufactured) decreases the time needed to get down the learning curve decreases cost since it increases purchasing and manufacturing efficiency Commodities – products sold by multiple vendors in large volumes which are essentially identical Competition among suppliers lower cost
- 23. TRENDS IN COST: THE PRICE OF DRAM AND INTEL PENTIUM III
- 24. TRENDS IN COST: THE PRICE OF PENTIUM4 AND PENTIUMM
- 25. COST OF AN INTEGRATED CIRCUIT • CPU (die) size greatly affects cost of all systems (desktop/server/embedded) – Current CPUs 1-2 cm2 – Embedded much smaller • cost and footprint really matters in cell phone or iPod Silicon Wafer Die
- 26. YIELD 13/16 working chips 81.25% yield 1/4 working chips 25.0% yield Manufacturing Defects
- 27. YIELD (2) 52 die, 81.25% yield 42.25 working parts / wafer 17 die, 25.0% yield 4.25 working parts / wafer Assuming $250 per wafer: $5.92 per die $58.82 per die
- 28. COST OF AN INTEGRATED CIRCUIT Cost of integrated circuit = (Cost of die + cost of testing die + cost of packaging and final test) final test yield
- 29. COST/YIELD EQUATIONS (APPROXIMATIONS) Cost of Die = Cost of wafer Dies per wafer × Die yield Dies per wafer = p × (Wafer diameter / 2)2 p × Wafer diameter Die area sqrt(2 × Die area) Die yield = Wafer yield × (1 + Defects per unit area × Die area a ) -a Number of completely bad wafers Typical: 0.4 defects per cm2 in 90nm, but improves with time Parameter related to complexity of manufacturing, typical a = 0.4
- 30. OUTLINE • Introduction • Classes of Computers • Computer Architecture • Trends in Technology • Trends in Cost • Dependability • Measuring, Reporting and Summarizing Performance • Quantitative Principles of Computer Design
- 31. DEPENDABILITY: SOME DEFINITIONS • Computer system dependability is the quality of delivered service • The service delivered by a system is its observed actual behavior • Each module has an ideal specified behavior, where a service specification is an agreed description of the expected behavior • A failure occurs when the actual behavior deviated from the specified behavior • The failure occurred because of an error • The cause of an error is a fault
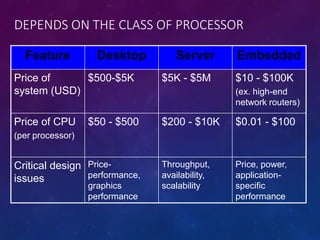
- 32. DEPENDABILITY: MEASURES • Service accomplishment vs. service interruption (transitions: failures vs. restorations) • Module reliability: a measure of the continuous service accomplishment • A measure of reliability: MTTF – Mean Time To Failure (1/[rate of failure]) reported in [failure/1billion hours of operation) • MTTR – Mean time to repair (a measure for service interruption) • MTBF – Mean time between failures (MTTF+MTTR) • Module availability – a measure of the service accomplishment; = MTTF/(MTTF+MTTR)
- 33. OUTLINE • Introduction • Classes of Computers • Computer Architecture • Trends in Technology • Trends in Cost • Dependability • Measuring, Reporting and Summarizing Performance • Quantitative Principles of Computer Design
- 34. COST-PERFORMANCE Purchasing perspective: from a collection of machines, choose one which has best performance? least cost? best performance/cost? Computer designer perspective: faced with design options, select one which has best performance improvement? least cost? best performance/cost? Both require: basis for comparison and metric for evaluation
- 35. TWO “NOTIONS” OF PERFORMANCE Which computer has better performance? User: one which runs a program in less time Computer centre manager: one which completes more jobs in a given time Users are interested in reducing Response time or Execution time the time between the start and the completion of an event Managers are interested in increasing Throughput or Bandwidth total amount of work done in a given time
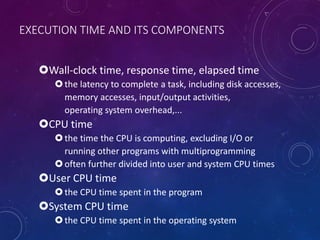
- 36. DEFINITION OF PERFORMANCE We are primarily concerned with Response Time Performance [things/sec] “X is n times faster than Y” As faster means both increased performance and decreased execution time, to reduce confusion will use “improve performance” or “improve execution time” )(_ 1 )( xtimeExecution xePerformanc )( )( )(_ )(_ yePerformanc xePerformanc xtimeExecution ytimeExecution n
- 37. EXECUTION TIME AND ITS COMPONENTS Wall-clock time, response time, elapsed time the latency to complete a task, including disk accesses, memory accesses, input/output activities, operating system overhead,... CPU time the time the CPU is computing, excluding I/O or running other programs with multiprogramming often further divided into user and system CPU times User CPU time the CPU time spent in the program System CPU time the CPU time spent in the operating system
- 38. CPU EXECUTION TIME • Instruction count (IC) = Number of instructions executed • Clock cycles per instruction (CPI) timecycleClockprogramaforcyclesclockCPUtimeCPU rateClock programaforcyclesclockCPU CPUtime IC programaforcyclesclockCPU CPI CPI - one way to compare two machines with same instruction set, since Instruction Count would be the same
- 39. CPU EXECUTION TIME (CONT’D) timecycleClockCPIICtimeCPU rateClock CPIIC timeCPU IC CPI Clock rate Program X Compiler X (X) ISA X X Organisation X X Technology X Program Seconds cycleClock Seconds nInstructio cyclesClock Program nsInstructio timeCPU
- 40. HOW TO CALCULATE CPI • First calculate CPI for each individual instruction (add, sub, and, etc.): CPIi • Next calculate frequency of each individual instr.: Freqi = ICi/IC • Finally multiply these two for each instruction and add them up to get final CPI 2.2 18% 14% 45% 23% % Time 0.4220%Bran. 0.3310%Store 1.0520%Load 0.5150%ALU Prod . CPIiFreqiOp i n i i CPI IC IC CPI 1
- 41. CHOOSING PROGRAMS TO EVALUATE PER. • Ideally run typical programs with typical input before purchase, or before even build machine – Engineer uses compiler, spreadsheet – Author uses word processor, drawing program, compression software • Workload – mixture of programs and OS commands that users run on a machine • Few can do this – Don’t have access to machine to “benchmark” before purchase – Don’t know workload in future
- 42. BENCHMARKS • Different types of benchmarks – Real programs (Ex. MSWord, Excel, Photoshop,...) – Kernels - small pieces from real programs (Linpack,...) – Toy Benchmarks - short, easy to type and run (Sieve of Erathosthenes, Quicksort, Puzzle,...) – Synthetic benchmarks - code that matches frequency of key instructions and operations to real programs (Whetstone, Dhrystone) • Need industry standards so that different processors can be fairly compared • Companies exist that create these benchmarks: “typical” code used to evaluate systems
- 43. BENCHMARK SUITES • SPEC - Standard Performance Evaluation Corporation (www.spec.org) – originally focusing on CPU performance SPEC89|92|95, SPEC CPU2000 (11 Int + 13 FP) – graphics benchmarks: SPECviewperf, SPECapc – server benchmark: SPECSFS, SPECWEB • PC benchmarks (Winbench 99, Business Winstone 99, High-end Winstone 99, CC Winstone 99) (www.zdnet.com/etestinglabs/filters/benchmarks) • Transaction processing benchmarks (www.tpc.org) • Embedded benchmarks (www.eembc.org)
- 44. COMPARING AND SUMMARISING PER. • An Example • What we can learn from these statements? • We know nothing about relative performance of computers A, B, C! • One approach to summarise relative performance: use total execution times of programs Program Com. A Com. B Com. C P1 (sec) 1 10 20 P2 (sec) 1000 100 20 Total (sec) 1001 110 40 – A is 20 times faster than C for program P1 – C is 50 times faster than A for program P2 – B is 2 times faster than C for program P1 – C is 5 times faster than B for program P2
- 45. COMPARING AND SUM. PER. (CONT’D) • Arithmetic mean (AM) or weighted AM to track time n i iTime n 0 1 n i ii Timew 0 Timei – execution time for ith program wi – frequency of that program in workload
- 46. OUTLINE • Introduction • Classes of Computers • Computer Architecture • Trends in Technology • Trends in Cost • Dependability • Measuring, Reporting and Summarizing Performance • Quantitative Principles of Computer Design
- 47. QUANTITATIVE PRINCIPLES OF DESIGN • Where to spend time making improvements? Make the Common Case Fast – Most important principle of computer design: Spend your time on improvements where those improvements will do the most good – Example • Instruction A represents 5% of execution • Instruction B represents 20% of execution • Even if you can drive the time for A to 0, the CPU will only be 5% faster • Key questions – What the frequent case is? – How much performance can be improved by making that case faster?
- 48. AMDAHL’S LAW • Suppose that we make an enhancement to a machine that will improve its performance; Speedup is ratio: • Amdahl’s Law states that the performance improvement that can be gained by a particular enhancement is limited by the amount of time that enhancement can be used tenhancemenusingtaskentireforExTime tenhancemenwithouttaskentireforExTime Speedup tenhancemenwithouttaskentireforePerformanc tenhancemenusingtaskentireforePerformanc Speedup
- 49. COMPUTING SPEEDUP • Fraction enhanced = fraction of execution time in the original machine that can be converted to take advantage of enhancement (E.g., 10/30) • Speedup enhanced = how much faster the enhanced code will run (E.g., 10/2=5) Execution time of enhanced program will be sum of old execution time of the unenhanced part of program and new execution time of the enhanced part of program: enhanced enhanced unenhancednew Speedup ExTime ExTimeExTime 20 10 20 2
- 50. COMPUTING SPEEDUP (CONT’D) • Enhanced part of program is Fraction enhanced, so times are: • Factor out Time old and divide by Speedup enhanced: • Overall speedup is ratio of Time old to Time new: enhancedoldunenhanced FractionExTimeExTime - 1 enhancedoldenhanced FractionExTimeExTime - enhanced enhanced enhancedoldnew Speedup Fraction FractionExTimeExTime 1 enhanced enhanced enhanced Speedup Fraction Fraction Speedup - 1 1
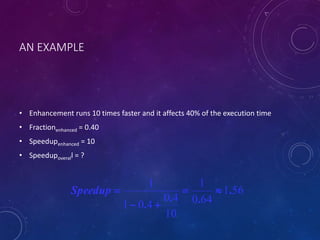
- 51. AN EXAMPLE • Enhancement runs 10 times faster and it affects 40% of the execution time • Fractionenhanced = 0.40 • Speedupenhanced = 10 • Speedupoverall = ? 561 640 1 10 40 401 1 . .. . - Speedup