


![2019-12-26 17:13:23
Full thread dump Java HotSpot(TM) 64-Bit Server VM (23.7-b01 mixed mode):
"Reconnection-1" prio=10 tid=0x00007f0442e10800 nid=0x112a waiting on condition [0x00007f042f719000]
java.lang.Thread.State: WAITING (parking)
at sun.misc.Unsafe.park(Native Method)
- parking to wait for <0x007b3953a98> (a java.util.concurrent.locks.AbstractQueuedSynchr)
at java.util.concurrent.locks.LockSupport.park(LockSupport.java:186)
at java.lang.Thread.run(Thread.java:722)
:
:
1
2
3
1 Timestamp at which thread dump was triggered
2 JVM Version info
3 Thread Details - <<details in following slides>>
Anatomy of thread dump
"InvoiceThread-A996" prio=10 tid=0x00002b7cfc6fb000 nid=0x4479 runnable [0x00002b7d17ab8000]
java.lang.Thread.State: RUNNABLE
at com.buggycompany.rt.util.ItinerarySegmentProcessor.setConnectingFlight(ItinerarySegmentProcessor.java:380)
at com.buggycompany.rt.util.ItinerarySegmentProcessor.processTripType0(ItinerarySegmentProcessor.java:366)
at com.buggycompany.rt.util.ItinerarySegmentProcessor.processItineraryByTripType(ItinerarySegmentProcessor.java:254)
at com.buggycompany.rt.util.ItinerarySegmentProcessor.templateMethod(ItinerarySegmentProcessor.java:399)
at com.buggycompany.qc.gds.InvoiceGeneratedFacade.readTicketImage(InvoiceGeneratedFacade.java:252)
at com.buggycompany.qc.gds.InvoiceGeneratedFacade.doOrchestrate(InvoiceGeneratedFacade.java:151)
at com.buggycompany.framework.gdstask.BaseGDSFacade.orchestrate(BaseGDSFacade.java:32)
at com.buggycompany.framework.gdstask.BaseGDSFacade.doWork(BaseGDSFacade.java:22)
at com.buggycompany.framework.concurrent.BuggycompanyCallable.call(buggycompanyCallable.java:80)
at java.util.concurrent.FutureTask$Sync.innerRun(FutureTask.java:334)
at java.util.concurrent.FutureTask.run(FutureTask.java:166)
at java.util.concurrent.ThreadPoolExecutor.runWorker(ThreadPoolExecutor.java:1145)
at java.util.concurrent.ThreadPoolExecutor$Worker.run(ThreadPoolExecutor.java:615)
at java.lang.Thread.run(Thread.java:722)](https://image.slidesharecdn.com/16-artifacts-220223143655/85/16-artifacts-to-capture-when-there-is-a-production-problem-15-320.jpg)
!["InvoiceThread-A996" prio=10 tid=0x00002b7cfc6fb000 nid=0x4479 runnable [0x00002b7d17ab8000]
java.lang.Thread.State: RUNNABLE
at com.buggycompany.rt.util.ItinerarySegmentProcessor.setConnectingFlight(ItinerarySegmentProcessor.java:380)
at com.buggycompany.rt.util.ItinerarySegmentProcessor.processTripType0(ItinerarySegmentProcessor.java:366)
at com.buggycompany.rt.util.ItinerarySegmentProcessor.processItineraryByTripType(ItinerarySegmentProcessor.java:254)
at com.buggycompany.rt.util.ItinerarySegmentProcessor.templateMethod(ItinerarySegmentProcessor.java:399)
at com.buggycompany.qc.gds.InvoiceGeneratedFacade.readTicketImage(InvoiceGeneratedFacade.java:252)
at com.buggycompany.qc.gds.InvoiceGeneratedFacade.doOrchestrate(InvoiceGeneratedFacade.java:151)
at com.buggycompany.framework.gdstask.BaseGDSFacade.orchestrate(BaseGDSFacade.java:32)
at com.buggycompany.framework.gdstask.BaseGDSFacade.doWork(BaseGDSFacade.java:22)
at com.buggycompany.framework.concurrent.BuggycompanyCallable.call(buggycompanyCallable.java:80)
at java.util.concurrent.FutureTask$Sync.innerRun(FutureTask.java:334)
at java.util.concurrent.FutureTask.run(FutureTask.java:166)
at java.util.concurrent.ThreadPoolExecutor.runWorker(ThreadPoolExecutor.java:1145)
at java.util.concurrent.ThreadPoolExecutor$Worker.run(ThreadPoolExecutor.java:615)
at java.lang.Thread.run(Thread.java:722)
1 2 3 4 5
6
7
1 Thread Name - InvoiceThread-A996
2 Priority - Can have values from 1 to 10
3 Thread Id - 0x00002b7cfc6fb000 – Unique ID assigned by JVM. It's returned by calling the Thread.getId() method.
4 Native Id - 0x4479 - This ID is highly platform dependent. On Linux, it's the pid of the thread. On Windows, it's simply the OS-level
thread ID within a process. On Mac OS X, it is said to be the native pthread_t value.
5 Address space - 0x00002b7d17ab8000 -
6 Thread State - RUNNABLE
7 Stack trace -](https://image.slidesharecdn.com/16-artifacts-220223143655/85/16-artifacts-to-capture-when-there-is-a-production-problem-16-320.jpg)


16 artifacts to capture when there is a production problem
- 1. Ram Lakshmanan | architect: yCrash ‘16 artifacts’ to capture when there is a production problem
- 2. Opensource script https://docs.ycrash.io/ycrash-features/ycrash-faq/only-capture-artifacts.html To capture all 16 artifacts
- 3. 1. GC Log 360-degree data
- 4. What is GC Log? https://tier1app.com/dist/sample/g1-repeatedGC.txt
- 5. How to capture GC Log? -XX:+PrintGCDetails -XX:+PrintGCDateStamps -Xloggc:<file-path> Till Java 8 -Xlog:gc*:file=<file-path> From Java 9
- 6. Why GC log is important? https://blog.ycrash.io/2021/10/15/interesting-garbage-collection-patterns/
- 7. Fig: Healthy Saw-tooth GC pattern
- 8. Fig: Heavy caching GC Pattern
- 9. Fig: Acute Memory Leak Pattern
- 10. Fig: Consecutive Full GC pattern
- 11. Fig: Memory Leak GC pattern
- 12. How to analyze GC Log? https://developer.ibm.com/javas dk/tools/ IBM GC & Memory visualizer GC Viewer https://github.com/chewiebug/G CViewer GCeasy https://gceasy.io/ Google Garbage cat (cms) https://code.google.com/archiv e/a/eclipselabs.org/p/garbagec at HP Jmeter https://h20392.www2.hpe.com/ portal/swdepot/displayProductI nfo.do?productNumber=HPJM ETER 03 02 01 05 04
- 13. 1. GC Log 2. Thread Dump 360-degree data
- 14. What is Thread dump? https://tier1app.com/dist/sample/threaddump_QC1-031214.txt
- 15. 2019-12-26 17:13:23 Full thread dump Java HotSpot(TM) 64-Bit Server VM (23.7-b01 mixed mode): "Reconnection-1" prio=10 tid=0x00007f0442e10800 nid=0x112a waiting on condition [0x00007f042f719000] java.lang.Thread.State: WAITING (parking) at sun.misc.Unsafe.park(Native Method) - parking to wait for <0x007b3953a98> (a java.util.concurrent.locks.AbstractQueuedSynchr) at java.util.concurrent.locks.LockSupport.park(LockSupport.java:186) at java.lang.Thread.run(Thread.java:722) : : 1 2 3 1 Timestamp at which thread dump was triggered 2 JVM Version info 3 Thread Details - <<details in following slides>> Anatomy of thread dump "InvoiceThread-A996" prio=10 tid=0x00002b7cfc6fb000 nid=0x4479 runnable [0x00002b7d17ab8000] java.lang.Thread.State: RUNNABLE at com.buggycompany.rt.util.ItinerarySegmentProcessor.setConnectingFlight(ItinerarySegmentProcessor.java:380) at com.buggycompany.rt.util.ItinerarySegmentProcessor.processTripType0(ItinerarySegmentProcessor.java:366) at com.buggycompany.rt.util.ItinerarySegmentProcessor.processItineraryByTripType(ItinerarySegmentProcessor.java:254) at com.buggycompany.rt.util.ItinerarySegmentProcessor.templateMethod(ItinerarySegmentProcessor.java:399) at com.buggycompany.qc.gds.InvoiceGeneratedFacade.readTicketImage(InvoiceGeneratedFacade.java:252) at com.buggycompany.qc.gds.InvoiceGeneratedFacade.doOrchestrate(InvoiceGeneratedFacade.java:151) at com.buggycompany.framework.gdstask.BaseGDSFacade.orchestrate(BaseGDSFacade.java:32) at com.buggycompany.framework.gdstask.BaseGDSFacade.doWork(BaseGDSFacade.java:22) at com.buggycompany.framework.concurrent.BuggycompanyCallable.call(buggycompanyCallable.java:80) at java.util.concurrent.FutureTask$Sync.innerRun(FutureTask.java:334) at java.util.concurrent.FutureTask.run(FutureTask.java:166) at java.util.concurrent.ThreadPoolExecutor.runWorker(ThreadPoolExecutor.java:1145) at java.util.concurrent.ThreadPoolExecutor$Worker.run(ThreadPoolExecutor.java:615) at java.lang.Thread.run(Thread.java:722)
- 16. "InvoiceThread-A996" prio=10 tid=0x00002b7cfc6fb000 nid=0x4479 runnable [0x00002b7d17ab8000] java.lang.Thread.State: RUNNABLE at com.buggycompany.rt.util.ItinerarySegmentProcessor.setConnectingFlight(ItinerarySegmentProcessor.java:380) at com.buggycompany.rt.util.ItinerarySegmentProcessor.processTripType0(ItinerarySegmentProcessor.java:366) at com.buggycompany.rt.util.ItinerarySegmentProcessor.processItineraryByTripType(ItinerarySegmentProcessor.java:254) at com.buggycompany.rt.util.ItinerarySegmentProcessor.templateMethod(ItinerarySegmentProcessor.java:399) at com.buggycompany.qc.gds.InvoiceGeneratedFacade.readTicketImage(InvoiceGeneratedFacade.java:252) at com.buggycompany.qc.gds.InvoiceGeneratedFacade.doOrchestrate(InvoiceGeneratedFacade.java:151) at com.buggycompany.framework.gdstask.BaseGDSFacade.orchestrate(BaseGDSFacade.java:32) at com.buggycompany.framework.gdstask.BaseGDSFacade.doWork(BaseGDSFacade.java:22) at com.buggycompany.framework.concurrent.BuggycompanyCallable.call(buggycompanyCallable.java:80) at java.util.concurrent.FutureTask$Sync.innerRun(FutureTask.java:334) at java.util.concurrent.FutureTask.run(FutureTask.java:166) at java.util.concurrent.ThreadPoolExecutor.runWorker(ThreadPoolExecutor.java:1145) at java.util.concurrent.ThreadPoolExecutor$Worker.run(ThreadPoolExecutor.java:615) at java.lang.Thread.run(Thread.java:722) 1 2 3 4 5 6 7 1 Thread Name - InvoiceThread-A996 2 Priority - Can have values from 1 to 10 3 Thread Id - 0x00002b7cfc6fb000 – Unique ID assigned by JVM. It's returned by calling the Thread.getId() method. 4 Native Id - 0x4479 - This ID is highly platform dependent. On Linux, it's the pid of the thread. On Windows, it's simply the OS-level thread ID within a process. On Mac OS X, it is said to be the native pthread_t value. 5 Address space - 0x00002b7d17ab8000 - 6 Thread State - RUNNABLE 7 Stack trace -
- 17. 6 Thread states RUNNABLE TERMINATED NEW TIMED_WAITING Thread.sleep(10); WAITING 03 02 01 06 05 public void synchronized getData() { makeDBCall(); } BLOCKED 04 Thread 1: Runnable Thread 2: BLOCKED wait(); Thread 1: Runnable
- 18. How to analyze Thread dump? https://www.ibm.com/support/pages/ibm-thread-and- monitor-dump-analyzer-java-tmda IBM TDMA yCrash https://ycrash.io/ FastThread https://fastthread.io/ 03 02 01 https://tinyurl.com/wq95weo Sample thread report
- 19. 1. GC Log 2. Thread Dump 3. Heap Dump 360-degree data
- 20. What is Heap dump? https://tier1app.com/dist/sample/small-hd.bin
- 21. How to analyze Heap dump? jhat (oracle.com) Jhat Eclipse MAT https://www.eclipse.org/mat HeapHero https://heaphero.io/ 03 02 01 https://tinyurl.com/5sxz7dsr Sample heap report yCrash https://ycrash.io/ 04
- 22. 1. GC Log 2. Thread Dump 3. Heap Dump 4. Heap Substitute 360-degree data
- 23. What is ‘heap substitute’ data? GC.class_histogram: num #instances #bytes class name ---------------------------------------------- 1: 82990 21331670776 [B 2: 93138 7188159200 [I 3: 10054 139610768 [Ljava.lang.Object; 4: 1053236 127593568 [C 5: 1052271 33672672 java.lang.String 6: 825643 33025720 com.tier1app.heaphero.superpower.analysis.DupStringFinder$UniqueStrin g 7: 252122 14118832 com.tier1app.heaphero.superpower.dump.objects.JPrimitiveArray 8: 281097 13492656 com.tier1app.heaphero.superpower.dump.objects.JObject 9: 250384 10015360 com.tier1app.heaphero.superpower.analysis.DupPrimitiveArrayFinder$Uni queArray 10: 262144 8388608 org.apache.logging.log4j.core.async.AsyncLoggerConfigDisruptor$Log4jEv entWrapper : : Total 5765291 28986068816 VM.system_properties: #Tue Feb 22 13:46:41 UTC 2022 app=yc java.runtime.name=Java(TM) SE Runtime Environment sun.boot.library.path=/home/ec2-user/java8/jdk1.8.0_131/jre/lib/amd java.vm.version=25.131-b11 java.vm.vendor=Oracle Corporation java.vendor.url=http://java.oracle.com/ path.separator=: java.vm.name=Java HotSpot(TM) 64-Bit Server VM file.encoding.pkg=sun.io user.country=US sun.java.launcher=SUN_STANDARD : GC.heap_info: VM.flags: -XX:CICompilerCount=12 -XX:InitialHeapSize=2147483648 - XX:MaxHeapSize=118111600640 -XX:MaxNewSize=39370358784 - XX:MinHeapDeltaBytes=524288 -XX:NewSize=715653120 - XX:OldSize=1431830528 -XX:+UseParallelGC
- 24. How to capture Heap Substitute? jcmd GC.class_histogram jcmd VM.system_properties jcmd GC.heap_info
- 25. 1. GC Log 2. Thread Dump 3. Heap Dump 360-degree data 5. top 4. Heap Substitute
- 26. What is ‘top’ data?
- 27. How to capture ‘top’ data? Command: top
- 28. Important sections in ‘top’ 1. Processes CPU & Memory 2. Load Average 3. CPU utilization
- 29. Real problem in trading app Load Avg of an ec2 instance Load Avg of another ec2 instance
- 30. 1. GC Log 2. Thread Dump 3. Heap Dump 360-degree data 6. ps 5. top 4. Heap Substitute
- 31. What is ‘ps’ data?
- 32. How to capture ‘ps’ data? Command: ps -ef
- 33. ‘ps’ ‘top’
- 34. 1. GC Log 2. Thread Dump 3. Heap Dump 360-degree data 6. ps 5. top 4. Heap Substitute 7. top -H
- 35. What is ‘top -H’ data?
- 36. How to capture ‘top -H’ data? Command : top –H –p {PID} Best strategy to troubleshoot ‘‘CPU spikes“
- 37. ‘top –H ’ ‘thread dump’
- 38. 1. GC Log 2. Thread Dump 3. Heap Dump 360-degree data 6. ps 8. Disk Usage 5. top 4. Heap Substitute 7. top -H
- 39. What is ‘disk usage’ data?
- 40. How to capture ‘disk usage’ data? Command : df -h
- 41. Analyze ‘disk’ usage data
- 42. 1. GC Log 2. Thread Dump 9. dmesg 3. Heap Dump 360-degree data 6. ps 8. Disk Usage 5. top 4. Heap Substitute 7. top -H
- 43. What is ‘dmesg’ data?
- 44. How to capture ‘dmesg’ data? Command : dmesg -T
- 45. Real world problems HR Cloud app: CPU spike, puppet password expiration OutOfMemoryError: https://answers.ycrash.io/question/jvm-restarts?q=526
- 46. 1. GC Log 10. netstat 2. Thread Dump 9. dmesg 3. Heap Dump 360-degree data 6. ps 8. Disk Usage 5. top 4. Heap Substitute 7. top -H
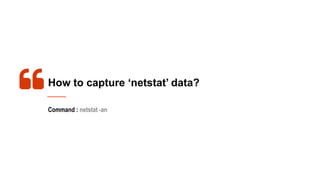
- 47. What is ‘netstat’ data?
- 48. How to capture ‘netstat’ data? Command : netstat -an
- 50. 1. GC Log 10. netstat 2. Thread Dump 9. dmesg 3. Heap Dump 360-degree data 6. ps 8. Disk Usage 5. top 11. ping 4. Heap Substitute 7. top -H
- 51. What is ‘ping’ data?
- 52. How to capture ‘ping’ data? Command : ping <host>
- 54. 1. GC Log 10. netstat 12. vmstat 2. Thread Dump 9. dmesg 3. Heap Dump 360-degree data 6. ps 8. Disk Usage 5. top 11. ping 4. Heap Substitute 7. top -H
- 55. What is ‘vmstat’ data?
- 56. How to capture ‘vmstat’ data? Command : vmstat <interval> <count>
- 58. 1. GC Log 10. netstat 12. vmstat 2. Thread Dump 9. dmesg 3. Heap Dump 360-degree data 6. ps 8. Disk Usage 5. top 13. iostat 11. ping 14. Kernel Params 4. Heap Substitute 7. top -H
- 59. ‘kernel params’?
- 60. How to capture ‘kernel params’? Command : sysctl -a
- 62. 1. GC Log 10. netstat 12. vmstat 2. Thread Dump 9. dmesg 3. Heap Dump 360-degree data 6. ps 8. Disk Usage 5. top 13. iostat 11. ping 14. Kernel Params 15. App Logs 4. Heap Substitute 7. top -H
- 63. Application log Capture last 1000 lines
- 64. 1. GC Log 10. netstat 12. vmstat 2. Thread Dump 9. dmesg 3. Heap Dump 360-degree data 6. ps 8. Disk Usage 5. top 13. iostat 11. ping 14. Kernel Params 15. App Logs 16. metadata 4. Heap Substitute 7. top -H
- 65. What is metada? hostName=ip-172-31-4-96.us-west-1.compute.internal processId=5013 appName=aps whoami=ec2-user javaVersion=java version "1.8.0_131", Java(TM) SE Runtime Environment (build 1.8.0_131-b11), Java HotSpot(TM) 64-Bit Server VM (build 25.131-b11, mixed mode), osVersion=Linux ip-172-31-4-96.us-west-1.compute.internal 4.14.243-185.433.amzn2.x86_64 #1 SMP Mon Aug 9 05:55:52 UTC 2021 x86_64 x86_64 x86_64 GNU/Linux, tags=manualCapture, release 2.01
- 66. Thank You my Friends! Ram Lakshmanan [email protected] @tier1app linkedin.com/company/ycrash This deck will be published in: https://blog.ycrash.io Script to capture: https://docs.ycrash.io/ycrash-features/ycrash-faq/only-capture-artifacts.html
Editor's Notes
- #25: https://ycrash.io/yc-report-trimmed-heap.jsp?ou=ram-tier1app-com&de=host&app=yc&ts=2022-02-22T13-58-24
- #30: High Load Average: https://ycrash.io/yc-report-top.jsp?ou=ram-tier1app-com&de=host&app=yc&ts=2022-02-22T14-19-35 Low Load Average: https://ycrash.io/yc-report-top.jsp?ou=ram-tier1app-com&de=host&app=yc&ts=2022-02-22T14-24-13
- #34: https://ycrash.io/yc-report-top.jsp?ou=ram-tier1app-com&de=host&app=yc&ts=2022-02-22T13-58-24
- #38: https://ycrash.io/yc-load-report-ft?ou=ram-tier1app-com&de=host&app=yc&ts=2022-02-22T13-58-24
- #42: https://ycrash.io/yc-load-report-ft?ou=ram-tier1app-com&de=host&app=yc&ts=2022-02-22T13-58-24
- #50: https://ycrash.io/yc-report-netStat.jsp?ou=ram-tier1app-com&de=host&app=yc&ts=2022-02-22T14-19-35
- #54: https://ycrash.io/yc-report-netStat.jsp?ou=ram-tier1app-com&de=host&app=yc&ts=2022-02-22T13-58-24
- #58: https://ycrash.io/yc-report-vmstat.jsp?ou=ram-tier1app-com&de=host&app=yc&ts=2022-02-22T13-58-24
- #62: https://ycrash.io/yc-report-vmstat.jsp?ou=ram-tier1app-com&de=host&app=yc&ts=2022-02-22T13-58-24