SlideShare a Scribd company logo
Yusuf YIGINI, PhD - FAO, Land and Water Division (CBL)
GSP - Eurasian Soil
Partnership - Dijital
Toprak Haritalama ve
Modelleme Egitimi
Izmir, Turkiye
21-25 Agustos 2017
R - Import , Export
R- Import Data
The easiest way to create a data frame is to read in
data from a file—this is done using the function
read.table, which works with ASCII text files. Data
can be read in from other files as well, using
different functions, but read.table is the most
commonly used approach. R is very flexible in how
it reads in data from text files.
read.csv and read.csv2 are identical to read.table except for
the defaults. They are intended for reading ‘comma separated
value’ files (‘.csv’) or (read.csv2) the variant used in countries
that use a comma as decimal point and a semicolon as field
separator. Similarly, read.delim and read.delim2 are for
reading delimited files, defaulting to the TAB character for the
delimiter.
In various countries, as the comma “,” character
serves as the decimal point, the function
read.csv2 should be used instead!
R- Import Data
read.table("MASIS_SOC.csv", sep = ",")
read.csv("MASIS_SOC.csv", sep = ",")
read.csv2("MASIS_SOC.csv")
read.delim("MASIS_SOC.csv")
read.delim("MASIS_SOC.csv", sep = ",")
R- Import Data
read.table("MASIS_SOC.csv", sep = ",")
read.csv("MASIS_SOC.csv", sep = ",")
read.csv2("MASIS_SOC.csv")
read.delim("MASIS_SOC.csv")
read.delim("MASIS_SOC.csv", sep = ",")
R- Import Data
Unless you take any special action, read.table() reads all the
columns as character vectors and then tries to select a
suitable class for each variable in the data frame. It tries in
logical, integer, numeric and complex. If all of these fail, the
variable is converted to a factor.
More about Factors: https://www.stat.berkeley.edu/classes/s133/factors.html
R- Import Data
> is.na(SOC)
Id UpperDepth LowerDepth SOC Lambda tsme Region
[1,] FALSE FALSE FALSE FALSE FALSE FALSE FALSE
[2,] FALSE FALSE FALSE FALSE FALSE FALSE FALSE
[3,] FALSE FALSE FALSE FALSE FALSE FALSE FALSE
[4,] FALSE FALSE FALSE FALSE FALSE FALSE FALSE
[5,] FALSE FALSE FALSE FALSE FALSE FALSE FALSE
[6,] FALSE FALSE FALSE FALSE FALSE FALSE FALSE
[7,] FALSE FALSE FALSE FALSE FALSE FALSE FALSE
[8,] FALSE FALSE FALSE FALSE FALSE FALSE FALSE
[9,] FALSE FALSE FALSE FALSE FALSE FALSE FALSE
[10,] FALSE FALSE FALSE FALSE FALSE FALSE FALSE
...
R- Import Data
> anyNA(SOC)
[1] TRUE
> sum(is.na(SOC$SOC))
[1] 1
R- Import Data
Importing from other statistical systems
install.packages("foreign")
library(foreign)
stata <- read.dta(“salary.dta”)
spss <- read.spss(“salary.sav”, to.data.frame=TRUE)
sasxport <- read.xport(“salary.xpt”)
epiinfo <- read.epiinfo(“salary.rec”) …
Note: The foreign package is in the standard distribution. It
handles import and export of data.
R- Import Data
Reading Data from Web
> read.table("http://www.cdc.noaa.gov/data/correlation/nao.data",skip=1,
nrow=70, na.strings="-99.90")
V1 V2 V3 V4 V5 V6 V7 V8 V9 V10 V11 V12 V13
1 1948 NA NA NA NA NA NA NA NA NA NA NA NA
2 1949 NA NA NA NA NA NA NA NA NA NA NA NA
3 1950 0.56 0.01 -0.78 0.65 -0.50 0.25 -1.23 -0.19 0.39 1.43 -1.46 -1.03
4 1951 -0.42 0.35 -1.47 -0.38 -0.50 -1.35 1.39 -0.41 -1.18 2.54 -0.54 1.13
5 1952 0.57 -1.38 -1.97 0.95 -0.99 -0.10 -0.06 -0.49 -0.38 -0.28 -1.32 -0.49
6 1953 -0.12 -1.00 -0.45 -1.96 -0.56 1.41 0.43 -1.04 -0.19 1.95 0.96 -0.52
7 1954 -0.08 0.40 -1.27 1.31 -0.03 0.06 -0.57 -2.57 -0.28 1.16 0.29 0.55
8 1955 -2.65 -1.71 -0.96 -0.60 -0.26 -0.80 1.78 1.25 0.46 -1.09 -1.49 0.07
9 1956 -0.76 -1.71 -0.46 -1.30 2.10 0.41 -0.72 -1.89 0.38 1.47 0.40 0.00
R- Import Data
Reading Data from Web
> read.table("http://www.cdc.noaa.gov/data/correlation/nao.data",skip=1,
nrow=70)
V1 V2 V3 V4 V5 V6 V7 V8 V9 V10 V11 V12 V13
1 1948 -99.90 -99.90 -99.90 -99.90 -99.90 -99.90 -99.90 -99.90 -99.90 -99.90 -99.90 -99.90
2 1949 -99.90 -99.90 -99.90 -99.90 -99.90 -99.90 -99.90 -99.90 -99.90 -99.90 -99.90 -99.90
3 1950 0.56 0.01 -0.78 0.65 -0.50 0.25 -1.23 -0.19 0.39 1.43 -1.46 -1.03
4 1951 -0.42 0.35 -1.47 -0.38 -0.50 -1.35 1.39 -0.41 -1.18 2.54 -0.54 1.13
5 1952 0.57 -1.38 -1.97 0.95 -0.99 -0.10 -0.06 -0.49 -0.38 -0.28 -1.32 -0.49
6 1953 -0.12 -1.00 -0.45 -1.96 -0.56 1.41 0.43 -1.04 -0.19 1.95 0.96 -0.52
7 1954 -0.08 0.40 -1.27 1.31 -0.03 0.06 -0.57 -2.57 -0.28 1.16 0.29 0.55
8 1955 -2.65 -1.71 -0.96 -0.60 -0.26 -0.80 1.78 1.25 0.46 -1.09 -1.49 0.07
9 1956 -0.76 -1.71 -0.46 -1.30 2.10 0.41 -0.72 -1.89 0.38 1.47 0.40 0.00
10 1957 0.71 -0.32 -1.73 0.39 -0.68 -0.42 -1.16 -0.83 -1.47 1.95 0.63 0.02
R- Import Data
Reading Data from Web
> read.table("http://www.cdc.noaa.gov/data/correlation/nao.data")
Error in scan(file = file, what = what, sep = sep, quote = quote, dec =
dec, : line 1 did not have 13 elements
R- Import Data
PostGIS Spatial Databases
PostGIS is a spatial database extender for
PostgreSQL object-relational database. It adds
support for geographic objects allowing location
queries to be run in SQL.
R- Import Data
PostGIS Spatial Databases
PostGIS is a spatial database extender for
PostgreSQL object-relational database. It adds
support for geographic objects allowing location
queries to be run in SQL.
R- Import Data
To read data from PostgreSQL into R, postGIStools
provides the get_postgis_query function. Like the
dbGetQuery function in PostgreSQL, it requires a
connection object and a SQL statement, which in
this case must be a SELECT statement. In addition,
the user may identify a geometry and/or hstore field
by name.
R- Read-Import Data
library(RPostgreSQL)
library(postGIStools)
con <- dbConnect(PostgreSQL(), dbname = "gsp_db", user = "GSP",
host = "bla-bla.com",
password = "587vn34m98dhu")
countries <- get_postgis_query(con, "SELECT * FROM country
WHERE SOCStck> 102",
geom_name = "geom", hstore_name =
"translations")
R- Save Data
> write.csv(SOC,file = "SOCData.csv")
The easiest way to do this is to use write.csv(). By default, write.
csv() includes row names, but these are usually unnecessary and
may cause confusion.
R- Save Data
> write.csv(SOC,file = "SOCData.csv")
The easiest way to do this is to use write.csv(). By default, write.
csv() includes row names, but these are usually unnecessary and
may cause confusion.
Saving in R data format
# Save in a text format that can be easily loaded in R
> dump("data", "data.Rdmpd")
# Can save multiple objects:
> dump(c("data", "data1"), "data.Rdmpd")
# To load the data again:
source("data.Rdmpd")
# When loaded, the original data names will automatically be used.
write.csv() and write.table() are best for interoperability with other
data analysis programs. They will not, however, preserve special
attributes of the data structures, such as whether a column is a
character type or factor, or the order of levels in factors. In order to
do that, it should be written out in a special format for R.
More on: Rdmpd: http://www.cookbook-r.com/Data_input_and_output/Writing_data_to_a_file/

More Related Content

Similar to 9. R data-import data-export (20)

PDF
R data-import, data-export
FAO
 
PDF
7. Data Import – Data Export
FAO
 
ODP
Beyond php - it's not (just) about the code
Wim Godden
 
ODP
Beyond php - it's not (just) about the code
Wim Godden
 
PDF
Import and Export Big Data using R Studio
Rupak Roy
 
PDF
R stata
Ajay Ohri
 
PPTX
SAS Mainframe -Program-Tips
Srinimf-Slides
 
PPT
Hands on data science with r.pptx
Nimrita Koul
 
PPTX
ComputeFest 2012: Intro To R for Physical Sciences
alexstorer
 
PDF
Vancouver AWS Meetup Slides 11-20-2018 Apache Spark with Amazon EMR
Allice Shandler
 
PDF
Gur1009
Cdiscount
 
ODP
Beyond PHP - It's not (just) about the code
Wim Godden
 
PDF
Spark Dataframe - Mr. Jyotiska
Sigmoid
 
PPT
OWB11gR2 - Extending ETL
Suraj Bang
 
PDF
Beyond php - it's not (just) about the code
Wim Godden
 
PPTX
Microsoft NERD Talk - R and Tableau - 2-4-2013
Tanya Cashorali
 
PPTX
Don't Repeat Yourself, and Automated Code Reviews
Gramener
 
KEY
Handling Real-time Geostreams
Raffi Krikorian
 
KEY
Handling Real-time Geostreams
guest35660bc
 
ODP
Beyond PHP - it's not (just) about the code
Wim Godden
 
R data-import, data-export
FAO
 
7. Data Import – Data Export
FAO
 
Beyond php - it's not (just) about the code
Wim Godden
 
Beyond php - it's not (just) about the code
Wim Godden
 
Import and Export Big Data using R Studio
Rupak Roy
 
R stata
Ajay Ohri
 
SAS Mainframe -Program-Tips
Srinimf-Slides
 
Hands on data science with r.pptx
Nimrita Koul
 
ComputeFest 2012: Intro To R for Physical Sciences
alexstorer
 
Vancouver AWS Meetup Slides 11-20-2018 Apache Spark with Amazon EMR
Allice Shandler
 
Gur1009
Cdiscount
 
Beyond PHP - It's not (just) about the code
Wim Godden
 
Spark Dataframe - Mr. Jyotiska
Sigmoid
 
OWB11gR2 - Extending ETL
Suraj Bang
 
Beyond php - it's not (just) about the code
Wim Godden
 
Microsoft NERD Talk - R and Tableau - 2-4-2013
Tanya Cashorali
 
Don't Repeat Yourself, and Automated Code Reviews
Gramener
 
Handling Real-time Geostreams
Raffi Krikorian
 
Handling Real-time Geostreams
guest35660bc
 
Beyond PHP - it's not (just) about the code
Wim Godden
 

More from ExternalEvents (20)

PPT
Mauritania
ExternalEvents
 
PPT
Malawi - M. Munthali
ExternalEvents
 
PPT
Malawi (Mbewe)
ExternalEvents
 
PPT
Malawi (Desideri)
ExternalEvents
 
PPT
Lesotho
ExternalEvents
 
PPT
Kenya
ExternalEvents
 
PPT
ICRAF: Soil-plant spectral diagnostics laboratory
ExternalEvents
 
PPT
Ghana
ExternalEvents
 
PPT
Ethiopia
ExternalEvents
 
PDF
Item 15
ExternalEvents
 
PPTX
Item 14
ExternalEvents
 
PDF
Item 13
ExternalEvents
 
PPT
Item 7
ExternalEvents
 
PPT
Item 6
ExternalEvents
 
PPT
Item 3
ExternalEvents
 
PDF
Item 16
ExternalEvents
 
PPT
Item 9: Soil mapping to support sustainable agriculture
ExternalEvents
 
PDF
Item 8: WRB, World Reference Base for Soil Resouces
ExternalEvents
 
PPTX
Item 7: Progress made in Nepal
ExternalEvents
 
PPTX
Item 6: International Center for Biosaline Agriculture
ExternalEvents
 
Mauritania
ExternalEvents
 
Malawi - M. Munthali
ExternalEvents
 
Malawi (Mbewe)
ExternalEvents
 
Malawi (Desideri)
ExternalEvents
 
ICRAF: Soil-plant spectral diagnostics laboratory
ExternalEvents
 
Ethiopia
ExternalEvents
 
Item 9: Soil mapping to support sustainable agriculture
ExternalEvents
 
Item 8: WRB, World Reference Base for Soil Resouces
ExternalEvents
 
Item 7: Progress made in Nepal
ExternalEvents
 
Item 6: International Center for Biosaline Agriculture
ExternalEvents
 
Ad

Recently uploaded (20)

PDF
Biological Bilingual Glossary Hindi and English Medium
World of Wisdom
 
PDF
CONCURSO DE POESIA “POETUFAS – PASSOS SUAVES PELO VERSO.pdf
Colégio Santa Teresinha
 
PPTX
Growth and development and milestones, factors
BHUVANESHWARI BADIGER
 
PPTX
PATIENT ASSIGNMENTS AND NURSING CARE RESPONSIBILITIES.pptx
PRADEEP ABOTHU
 
PDF
LAW OF CONTRACT (5 YEAR LLB & UNITARY LLB )- MODULE - 1.& 2 - LEARN THROUGH P...
APARNA T SHAIL KUMAR
 
PPTX
ASRB NET 2023 PREVIOUS YEAR QUESTION PAPER GENETICS AND PLANT BREEDING BY SAT...
Krashi Coaching
 
PDF
The Different Types of Non-Experimental Research
Thelma Villaflores
 
PDF
ARAL-Orientation_Morning-Session_Day-11.pdf
JoelVilloso1
 
PDF
The History of Phone Numbers in Stoke Newington by Billy Thomas
History of Stoke Newington
 
PDF
QNL June Edition hosted by Pragya the official Quiz Club of the University of...
Pragya - UEM Kolkata Quiz Club
 
PDF
Stokey: A Jewish Village by Rachel Kolsky
History of Stoke Newington
 
PDF
Exploring the Different Types of Experimental Research
Thelma Villaflores
 
PPT
Talk on Critical Theory, Part One, Philosophy of Social Sciences
Soraj Hongladarom
 
PDF
Chapter-V-DED-Entrepreneurship: Institutions Facilitating Entrepreneurship
Dayanand Huded
 
PPTX
Cultivation practice of Litchi in Nepal.pptx
UmeshTimilsina1
 
PDF
LAW OF CONTRACT ( 5 YEAR LLB & UNITARY LLB)- MODULE-3 - LEARN THROUGH PICTURE
APARNA T SHAIL KUMAR
 
PDF
DIGESTION OF CARBOHYDRATES,PROTEINS,LIPIDS
raviralanaresh2
 
PPTX
Neurodivergent Friendly Schools - Slides from training session
Pooky Knightsmith
 
PPTX
SPINA BIFIDA: NURSING MANAGEMENT .pptx
PRADEEP ABOTHU
 
PPTX
Universal immunization Programme (UIP).pptx
Vishal Chanalia
 
Biological Bilingual Glossary Hindi and English Medium
World of Wisdom
 
CONCURSO DE POESIA “POETUFAS – PASSOS SUAVES PELO VERSO.pdf
Colégio Santa Teresinha
 
Growth and development and milestones, factors
BHUVANESHWARI BADIGER
 
PATIENT ASSIGNMENTS AND NURSING CARE RESPONSIBILITIES.pptx
PRADEEP ABOTHU
 
LAW OF CONTRACT (5 YEAR LLB & UNITARY LLB )- MODULE - 1.& 2 - LEARN THROUGH P...
APARNA T SHAIL KUMAR
 
ASRB NET 2023 PREVIOUS YEAR QUESTION PAPER GENETICS AND PLANT BREEDING BY SAT...
Krashi Coaching
 
The Different Types of Non-Experimental Research
Thelma Villaflores
 
ARAL-Orientation_Morning-Session_Day-11.pdf
JoelVilloso1
 
The History of Phone Numbers in Stoke Newington by Billy Thomas
History of Stoke Newington
 
QNL June Edition hosted by Pragya the official Quiz Club of the University of...
Pragya - UEM Kolkata Quiz Club
 
Stokey: A Jewish Village by Rachel Kolsky
History of Stoke Newington
 
Exploring the Different Types of Experimental Research
Thelma Villaflores
 
Talk on Critical Theory, Part One, Philosophy of Social Sciences
Soraj Hongladarom
 
Chapter-V-DED-Entrepreneurship: Institutions Facilitating Entrepreneurship
Dayanand Huded
 
Cultivation practice of Litchi in Nepal.pptx
UmeshTimilsina1
 
LAW OF CONTRACT ( 5 YEAR LLB & UNITARY LLB)- MODULE-3 - LEARN THROUGH PICTURE
APARNA T SHAIL KUMAR
 
DIGESTION OF CARBOHYDRATES,PROTEINS,LIPIDS
raviralanaresh2
 
Neurodivergent Friendly Schools - Slides from training session
Pooky Knightsmith
 
SPINA BIFIDA: NURSING MANAGEMENT .pptx
PRADEEP ABOTHU
 
Universal immunization Programme (UIP).pptx
Vishal Chanalia
 
Ad

9. R data-import data-export

  • 1. Yusuf YIGINI, PhD - FAO, Land and Water Division (CBL) GSP - Eurasian Soil Partnership - Dijital Toprak Haritalama ve Modelleme Egitimi Izmir, Turkiye 21-25 Agustos 2017
  • 2. R - Import , Export
  • 3. R- Import Data The easiest way to create a data frame is to read in data from a file—this is done using the function read.table, which works with ASCII text files. Data can be read in from other files as well, using different functions, but read.table is the most commonly used approach. R is very flexible in how it reads in data from text files.
  • 4. read.csv and read.csv2 are identical to read.table except for the defaults. They are intended for reading ‘comma separated value’ files (‘.csv’) or (read.csv2) the variant used in countries that use a comma as decimal point and a semicolon as field separator. Similarly, read.delim and read.delim2 are for reading delimited files, defaulting to the TAB character for the delimiter. In various countries, as the comma “,” character serves as the decimal point, the function read.csv2 should be used instead!
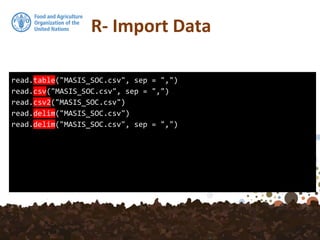
  • 5. R- Import Data read.table("MASIS_SOC.csv", sep = ",") read.csv("MASIS_SOC.csv", sep = ",") read.csv2("MASIS_SOC.csv") read.delim("MASIS_SOC.csv") read.delim("MASIS_SOC.csv", sep = ",")
  • 6. R- Import Data read.table("MASIS_SOC.csv", sep = ",") read.csv("MASIS_SOC.csv", sep = ",") read.csv2("MASIS_SOC.csv") read.delim("MASIS_SOC.csv") read.delim("MASIS_SOC.csv", sep = ",")
  • 7. R- Import Data Unless you take any special action, read.table() reads all the columns as character vectors and then tries to select a suitable class for each variable in the data frame. It tries in logical, integer, numeric and complex. If all of these fail, the variable is converted to a factor. More about Factors: https://www.stat.berkeley.edu/classes/s133/factors.html
  • 8. R- Import Data > is.na(SOC) Id UpperDepth LowerDepth SOC Lambda tsme Region [1,] FALSE FALSE FALSE FALSE FALSE FALSE FALSE [2,] FALSE FALSE FALSE FALSE FALSE FALSE FALSE [3,] FALSE FALSE FALSE FALSE FALSE FALSE FALSE [4,] FALSE FALSE FALSE FALSE FALSE FALSE FALSE [5,] FALSE FALSE FALSE FALSE FALSE FALSE FALSE [6,] FALSE FALSE FALSE FALSE FALSE FALSE FALSE [7,] FALSE FALSE FALSE FALSE FALSE FALSE FALSE [8,] FALSE FALSE FALSE FALSE FALSE FALSE FALSE [9,] FALSE FALSE FALSE FALSE FALSE FALSE FALSE [10,] FALSE FALSE FALSE FALSE FALSE FALSE FALSE ...
  • 9. R- Import Data > anyNA(SOC) [1] TRUE > sum(is.na(SOC$SOC)) [1] 1
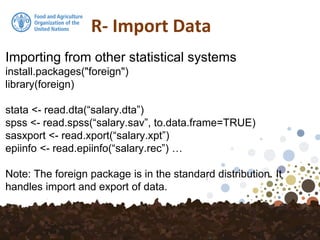
  • 10. R- Import Data Importing from other statistical systems install.packages("foreign") library(foreign) stata <- read.dta(“salary.dta”) spss <- read.spss(“salary.sav”, to.data.frame=TRUE) sasxport <- read.xport(“salary.xpt”) epiinfo <- read.epiinfo(“salary.rec”) … Note: The foreign package is in the standard distribution. It handles import and export of data.
  • 11. R- Import Data Reading Data from Web > read.table("http://www.cdc.noaa.gov/data/correlation/nao.data",skip=1, nrow=70, na.strings="-99.90") V1 V2 V3 V4 V5 V6 V7 V8 V9 V10 V11 V12 V13 1 1948 NA NA NA NA NA NA NA NA NA NA NA NA 2 1949 NA NA NA NA NA NA NA NA NA NA NA NA 3 1950 0.56 0.01 -0.78 0.65 -0.50 0.25 -1.23 -0.19 0.39 1.43 -1.46 -1.03 4 1951 -0.42 0.35 -1.47 -0.38 -0.50 -1.35 1.39 -0.41 -1.18 2.54 -0.54 1.13 5 1952 0.57 -1.38 -1.97 0.95 -0.99 -0.10 -0.06 -0.49 -0.38 -0.28 -1.32 -0.49 6 1953 -0.12 -1.00 -0.45 -1.96 -0.56 1.41 0.43 -1.04 -0.19 1.95 0.96 -0.52 7 1954 -0.08 0.40 -1.27 1.31 -0.03 0.06 -0.57 -2.57 -0.28 1.16 0.29 0.55 8 1955 -2.65 -1.71 -0.96 -0.60 -0.26 -0.80 1.78 1.25 0.46 -1.09 -1.49 0.07 9 1956 -0.76 -1.71 -0.46 -1.30 2.10 0.41 -0.72 -1.89 0.38 1.47 0.40 0.00
  • 12. R- Import Data Reading Data from Web > read.table("http://www.cdc.noaa.gov/data/correlation/nao.data",skip=1, nrow=70) V1 V2 V3 V4 V5 V6 V7 V8 V9 V10 V11 V12 V13 1 1948 -99.90 -99.90 -99.90 -99.90 -99.90 -99.90 -99.90 -99.90 -99.90 -99.90 -99.90 -99.90 2 1949 -99.90 -99.90 -99.90 -99.90 -99.90 -99.90 -99.90 -99.90 -99.90 -99.90 -99.90 -99.90 3 1950 0.56 0.01 -0.78 0.65 -0.50 0.25 -1.23 -0.19 0.39 1.43 -1.46 -1.03 4 1951 -0.42 0.35 -1.47 -0.38 -0.50 -1.35 1.39 -0.41 -1.18 2.54 -0.54 1.13 5 1952 0.57 -1.38 -1.97 0.95 -0.99 -0.10 -0.06 -0.49 -0.38 -0.28 -1.32 -0.49 6 1953 -0.12 -1.00 -0.45 -1.96 -0.56 1.41 0.43 -1.04 -0.19 1.95 0.96 -0.52 7 1954 -0.08 0.40 -1.27 1.31 -0.03 0.06 -0.57 -2.57 -0.28 1.16 0.29 0.55 8 1955 -2.65 -1.71 -0.96 -0.60 -0.26 -0.80 1.78 1.25 0.46 -1.09 -1.49 0.07 9 1956 -0.76 -1.71 -0.46 -1.30 2.10 0.41 -0.72 -1.89 0.38 1.47 0.40 0.00 10 1957 0.71 -0.32 -1.73 0.39 -0.68 -0.42 -1.16 -0.83 -1.47 1.95 0.63 0.02
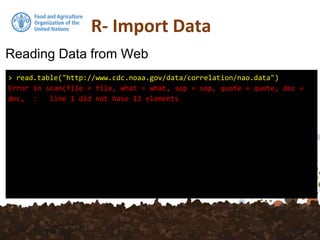
  • 13. R- Import Data Reading Data from Web > read.table("http://www.cdc.noaa.gov/data/correlation/nao.data") Error in scan(file = file, what = what, sep = sep, quote = quote, dec = dec, : line 1 did not have 13 elements
  • 14. R- Import Data PostGIS Spatial Databases PostGIS is a spatial database extender for PostgreSQL object-relational database. It adds support for geographic objects allowing location queries to be run in SQL.
  • 15. R- Import Data PostGIS Spatial Databases PostGIS is a spatial database extender for PostgreSQL object-relational database. It adds support for geographic objects allowing location queries to be run in SQL.
  • 16. R- Import Data To read data from PostgreSQL into R, postGIStools provides the get_postgis_query function. Like the dbGetQuery function in PostgreSQL, it requires a connection object and a SQL statement, which in this case must be a SELECT statement. In addition, the user may identify a geometry and/or hstore field by name.
  • 17. R- Read-Import Data library(RPostgreSQL) library(postGIStools) con <- dbConnect(PostgreSQL(), dbname = "gsp_db", user = "GSP", host = "bla-bla.com", password = "587vn34m98dhu") countries <- get_postgis_query(con, "SELECT * FROM country WHERE SOCStck> 102", geom_name = "geom", hstore_name = "translations")
  • 18. R- Save Data > write.csv(SOC,file = "SOCData.csv") The easiest way to do this is to use write.csv(). By default, write. csv() includes row names, but these are usually unnecessary and may cause confusion.
  • 19. R- Save Data > write.csv(SOC,file = "SOCData.csv") The easiest way to do this is to use write.csv(). By default, write. csv() includes row names, but these are usually unnecessary and may cause confusion.
  • 20. Saving in R data format # Save in a text format that can be easily loaded in R > dump("data", "data.Rdmpd") # Can save multiple objects: > dump(c("data", "data1"), "data.Rdmpd") # To load the data again: source("data.Rdmpd") # When loaded, the original data names will automatically be used. write.csv() and write.table() are best for interoperability with other data analysis programs. They will not, however, preserve special attributes of the data structures, such as whether a column is a character type or factor, or the order of levels in factors. In order to do that, it should be written out in a special format for R. More on: Rdmpd: http://www.cookbook-r.com/Data_input_and_output/Writing_data_to_a_file/
  • 21. Saving in R data format # Save in a text format that can be easily loaded in R > dump("data", "data.Rdmpd") # Can save multiple objects: > dump(c("data", "data1"), "data.Rdmpd") # To load the data again: source("data.Rdmpd") # When loaded, the original data names will automatically be used. write.csv() and write.table() are best for interoperability with other data analysis programs. They will not, however, preserve special attributes of the data structures, such as whether a column is a character type or factor, or the order of levels in factors. In order to do that, it should be written out in a special format for R. More on: Rdmpd: http://www.cookbook-r.com/Data_input_and_output/Writing_data_to_a_file/