SlideShare a Scribd company logo
High-Level Fault Grading
Improving Gate-Level Fault
Coverage by RTL Fault Grading*
* W. Mao and R. K. Gulati, ITC 1996, pp. 150-159.
High-Level Fault Grading 3
Motivation
Gate-level fault simulation is
computationally infeasible for large
circuits
RTL design available early in the design
cycle for fault grading of available
(validation or legacy) test vectors
It would be nice if fault analysis could
be done at RTL level but the results
closely approximated gate-level
coverage.
High-Level Fault Grading 4
Basic Idea
Inject stuck-type faults on all PIs,
internal signals, and their fanouts using
RTL constructs.
Use an RTL fault simulator (e.g.
Verifault for Verilog) for fault grading at
the RTL level
Verify the closeness of approximation
against gate-level fault coverage.
High-Level Fault Grading 5
Example RTL Model and
Signal- Flow Diagram
High-Level Fault Grading 6
RTL Modified for Fault Injection
High-Level Fault Grading 7
Testability Analysis Flow
High-Level Fault Grading 8
Handling Signal Fanouts
(Optimistic Mode)
High-Level Fault Grading 9
Handling Signal Fanouts
(Pessimistic Mode)
High-Level Fault Grading 10
RTL vs. Gate-Level Fault Coverage
High-Level Fault Grading 11
Critique
Technique works well only when the circuit is
simulated at low-level RTL
Errors arise because of:
Differences in fanouts at the two levels
Most signal fanout lot more at the RTL level (exception:
Reset signal)
Complex blocks with only I/O visibility
The last shortcoming is addressed in the
stratified sampling approach of Thaker,
Agrawal, and Zaghloul that we consider next.
Stratified Sampling for Fault
Coverage of VLSI Systems
Vishwani D. Agrawal
Auburn University
Collaborators: Pradip Thaker and Mona Zaghloul
High-Level Fault Grading 14
Problem
Accurately estimate the gate-level fault
coverage for a VLSI system at the RT-level
Advantages:
Improve test
Improve design
Avoid expensive design changes
Previous approaches do not accurately
represent gate-level fault coverage (function
errors, mutation, statement faults, branch
faults, etc.)
High-Level Fault Grading 15
Solution
Model faults as representative sample
of the targeted (gate-level stuck-at)
faults.
Treat the coverage in an RTL module as
a statistical sampling estimate.
For a multi-module VLSI system,
combine module coverages according to
the stratified sampling technique.
High-Level Fault Grading 17
Fault Sampling
A randomly selected subset (sample) of
faults is simulated.
Measured coverage in the sample is
used to estimate fault coverage in the
entire circuit.
Advantage: Saving in computing
resources (CPU time and memory.)
Disadvantage: Limited data on
undetected faults.
High-Level Fault Grading 20
Sampling Error Bounds
C (1 - C )
| x - C | = 3 [ -------------- ] 1/2
Ns
Solving the quadratic equation for C, we get the 3-sigma
(99.8% confidence) estimate (Agrawal-Kato, 1990):
4.5
C 3s = x ------- [1 + 0.44 Ns x (1 - x )]1/2
Ns
Where Ns is sample size and x is the measured fault
coverage in the sample.
Example: A circuit with 39,096 faults has an actual
fault coverage of 87.1%. The measured coverage in
a random sample of 1,000 faults is 88.7%. The above
formula gives an estimate of 88.7% 3%. CPU time for
sample simulation was about 10% of that for all faults.


Millot, 1923
High-Level Fault Grading 21
An RTL Fault Model
(ITC-2000)
Language operators are assumed to be fault-free
Variables (map onto signal lines) contain faults
stuck-at-0
stuck-at-1
Only one fault is applied at a time (single fault
assumption)
High-Level Fault Grading 22
RTL Fault Injection
Not affected by faults:
Synthetic operators + - * >= <= == !=
Boolean operators & | ^ ~
Logical operators && || !
Sequential elements (flip-flops & latches)
Faults introduced in signal variables (stems and
fan-outs)
Separate faults for bits of data words
High-Level Fault Grading 23
Fault Modeling for Boolean
Operators
module mux(c, a, b, s);
assign d = a & s;
assign e = s1 & b;
assign s1 = !s;
assign c = d | e;
endmodule
RTL Description Symbolic Description
a
s
b
d
e
c
s1
High-Level Fault Grading 24
Stem and Fan-out Fault Modeling
RTL fan-out faults: if(X) then Z=Y; else Z=!Y;
Unique RTL fault is placed on each fan-out of each bit of a
variable
Unique RTL fault on each stem
(a)
module
(b)
module
High-Level Fault Grading 25
More RTL Faults
b [1 ]
b [0 ]
a [ 1 ]
d [1 ]
c [ 0 ]
c [ 1 ]
a [ 0 ]
d [0 ]
+
-
*
f [2 :0 ]
e [ 3 : 0 ]
g [2 :0 ]
<
f [2 :0 ]
>
e [3 :0 ]
e [3 :0 ]
g [ 2 :0 ]
f [2 :0 ]
=
h
j
i
M
U
X
c lk
r e s e t _
v
w
k
o u t_ si g 1
o u t_ s ig 2
g [2 :0 ]
High-Level Fault Grading 26
Observations and Assumption: RTL Faults
RTL faults may have detection probability
distribution similar to that of collapsed gate-level
faults
Statistically, an RTL fault-list approximates a
random sample from the gate-level fault-list
Number of RTL faults vs. gate-level faults depends
on
Level of RTL description
Synthesis procedure used to convert RTL to gate level
High-Level Fault Grading 27
RTL Fault Simulation
Analogous to gate-level approach
Faults injected in RTL code of the design
description by a C++ parser; a logic buffer
element inserted at fault site (technique
identical to Mao & Gulati’s).
Fault report contains statistics on detected
and undetected RTL faults
Cadence’s Verifault-XL used as RTL fault
simulator
High-Level Fault Grading 28
Estimation Error for
Module Fault Coverage
RTL fault coverage assumed to be an
estimate of the collapsed gate-fault coverage
within statistical bound [Agrawal and Kato,
D&T, 1990]:
  
 
2
2
1 4 1 2
k
N
Nc c k
( )/
a = 3.00 for confidence probability of 99.8%
c = ratio of detected to total number of RTL faults
M = number of gate faults
N = number of RTL faults, k = 1 - N/M
High-Level Fault Grading 29
DSP Interface Module
(3,168 Gates)
0
10
20
30
40
50
60
70
80
90
100
0 500 1000 1500
Test Vectors
RTL
&
Gate
Fault
Cov
(%)
RTL Cov
Gate Cov
High-Level Fault Grading 30
RTL Faults and VLSI System
Coverage
Experimental results demonstrate RTL fault
coverage of a module to be a good statistical
estimate of the gate-level fault coverage
A VLSI system consists of many
interconnected modules
Overall RTL fault-list of a VLSI system does
not constitute a representative sample of the
gate-level fault-list
High-Level Fault Grading 31
Error at System Level
RTL Coverage = (0.91 x 100 + 0.39 x 100) / 200 = 65%
Gate Coverage = (0.90 x 150 + 0.40 x 400) / 550 = 54%
A correct estimation of gate-level fault coverage from RTL
coverage:
91 x (150 / 550) + 39 x (400 / 550) = 53%
M2
100 faults
39% cov.
M1
100 faults
91% cov.
M1
150 faults
90% cov.
M2
400 faults
40% cov.
RTL Gate-
level
High-Level Fault Grading 32
Application of Stratified Sampling
Fault population of a VLSI system divided into
strata according to RTL module boundaries
RTL faults in each module are considered a
sample of corresponding gate-level faults
The stratified RTL coverage is an estimate of
the gate-level coverage:
Wm = stratum weight of mth module = Gm/G
cm = RTL fault coverage of mth module
Gm = number of gate-level faults in mth module
G = number of all gate-level faults in the system
M = number of RTL modules in the system
M
C = S Wmcm
m=1
High-Level Fault Grading 33
Application of Stratified Sampling
Range of
coverage,
where,
rm = number of RTL faults in mth module
t = value from tables of normal distribution
The technique requires knowledge of stratum weights
and not absolute values of Gm and G
s2
=  cm(1  cm)
S
Wm
rm  1
m=1
M
C + t s
High-Level Fault Grading 34
Stratum Weight Extraction
Techniques
Logic synthesis based weight extraction
Wm = Gm/G
Floor-planning based weight extraction
Wm = Am/A
Entropy-measure based weight extraction
High-Level Fault Grading 35
Experimental Procedure
Technology-dependent weight extraction
Several unique gate-level netlists obtained by logic synthesis from
the same RTL code
Each synthesis run performed using a different set of constraints,
e.g., area optimization (netlist 1), speed optimization (netlist 2), or
combined area and speed optimizations (netlists 3 and 4)
Strata weights calculated using gate-level fault lists of various
synthesized netlists
Technology-independent weight extraction
Stratum weights calculated using area distribution among modules
Each set of stratum weights used to calculate RTL fault
coverage and error bounds
Impact of estimation error investigated
High-Level Fault Grading 36
Experimental Data: Weight
Distributions
0
0.05
0.1
0.15
0.2
0.25
0.3
1 2 3 4 5 6 7 8 9 10 11 12
Modules
Stratum
Weights
Netlist1
Netlist2
Netlist3
Area
Netlist4
High-Level Fault Grading 37
Experimental Data: RTL Fault
Coverage
0
10
20
30
40
50
60
70
80
1 2 3 4 5 6 7
Test Vector Set
Fault
Coverage
(%)
RTL Cov.(Wm from Netlist1)
RTL Cov.(Wm from Netlist2)
RTL Cov.(Wm from Netlist3)
RTL Cov. (Wm from Area)
RTL Cov. (Wm from Netlist4)
Gate Cov.
High-Level Fault Grading 38
Experimental Data: Error
Bounds
0
1
2
3
4
5
6
7
8
9
10
1 2 3 4 5 6 7
Test Vectors
Error
Bounds
(|E|)
|E|(Wm from Netlist1)
|E|(Wm from Netlist2)
|E|(Wm from Netlist3)
|E|(Wm from Area)
|E|(Wm from Netlist4)
High-Level Fault Grading 39
Timing Controller ASIC
(17,126 Gates)
0
10
20
30
40
50
60
70
0 200 400 600
Test Vectors
RTL
&
Gate
Fault
Cov
(%)
RTL Cov
Gate Cov
High-Level Fault Grading 40
A DSP ASIC
(104,881 Gates)
0
10
20
30
40
50
60
70
80
0 200 400 600 800 1000
Test Vectors
RTL
&
Gate
Fault
Cov(%)
RTL Cov
Gate Cov
High-Level Fault Grading 41
Conclusion
Main ideas of RTL fault modeling
A small or high-level RTL module contributes few RTL faults,
but large statistical tolerance gives a correct coverage
estimate
Stratified sampling accounts for varying module sizes and for
different RTL details that may be used
Stratum weights appear to be insensitive to specific details
of synthesis
Advantages of the proposed RTL fault model
High-level test generation and evaluation
Early identification of hard-to-test RTL architectures
Potential for significantly reducing run-time penalty of the
gate-level fault simulation
High-Level Fault Grading 42
References - 1
V. D. Agrawal, “Sampling Techniques for Determining Fault
Coverage in LSI Circuits,” J. Digital Systems, vol. V, no. 3, pp.
189-202, 1981.
V. D. Agrawal and H. Kato, “Fault Sampling Revisited,” IEEE
Design & Test of Computers, vol. 7, no. 4, pp. 32-35, Aug. 1990.
P. A. Thaker, M. E. Zaghloul, and M. B. Amin, “Study of
Correlation of Testability Aspects of RTL Description and Resulting
Structural Implementation,” Proc. 12th Int. Conf. VLSI Design,
Jan. 1999, pp. 256-259.
P. A. Thaker, V. D. Agrawal, and M. E. Zaghloul, “Validation Vector
Grade (VVG): A New Coverage Metric for Validation and Test,”
Proc. 17th IEEE VLSI Test Symp., Apr. 1999, pp. 182-188.
High-Level Fault Grading 43
References - 2
P. A. Thaker, Register-Transfer Level Fault Modeling
and Evaluation Techniques, PhD Thesis, George
Washington University, Washington, D.C., May 2000.
P. A. Thaker, V. D. Agrawal, and M. E. Zaghloul,
“Register-Transfer Level Fault Modeling and Test
Evaluation Techniques for VLSI Circuits,” Proc. Int. Test
Conf., Oct. 2000, pp. 940-949.
This presentation is available from the website
http://cm.bell-labs.com/cm/cs/who/va
High-Level Fault Grading 44
Other Related Papers
1. OCCOM: Fallah et al., IEEE TCAD, Aug.
2001, pp. 1003-1015.
2. IFMB: Santos et al., ITC2001, pp. 377-
385.
3. Probabilistic Testability: Fernandes et
al., DATE04, pp. 10176-10181.
4. Kang et al., VTS07.

More Related Content

Similar to 9-High-Level-Fault-Grading.ppt (20)

PDF
An application specific reconfigurable architecture
eSAT Publishing House
 
PDF
An application specific reconfigurable architecture for fault testing and dia...
eSAT Journals
 
PPT
cupdf.com_chapter-11-system-level-verification-issues-the-importance-of-verif...
SamHoney6
 
PDF
Automated Formal Verification of SystemC/C++ High-Level Synthesis Models
Sergio Marchese
 
PDF
A Simulation Experiment on a Built-In Self Test Equipped with Pseudorandom Te...
VLSICS Design
 
PDF
A Simulation Experiment on a Built-In Self Test Equipped with Pseudorandom Te...
VLSICS Design
 
PDF
A Simulation Experiment on a Built-In Self Test Equipped with Pseudorandom Te...
VLSICS Design
 
PPTX
L1_fault modeling_121.pptx
varshaks3
 
PPT
Dill may-2008
Obsidian Software
 
PDF
All My X’s Come From Texas...Not!!
jgpecor
 
PPTX
VLSI Testing : Logic Simulation Part 1.pptx
Varsha506533
 
PDF
faults.pdf
kabsmedy14
 
PPT
Dealing with the Three Horrible Problems in Verification
DVClub
 
PDF
680report final
Rajesh M
 
PPT
lecture1 (1)nnoubfubufhbsuhbfhubsufb.ppt
ShantulKhandelwal
 
PDF
Fault Simulation (Testing of VLSI Design)
Usha Mehta
 
PPT
02~chapter 01 intro.ppt
SandipSolanki10
 
PPT
testpattern.ppt
thiru17270
 
PPTX
Jeda Hls Hlv Success Story V4
Chun Xia
 
An application specific reconfigurable architecture
eSAT Publishing House
 
An application specific reconfigurable architecture for fault testing and dia...
eSAT Journals
 
cupdf.com_chapter-11-system-level-verification-issues-the-importance-of-verif...
SamHoney6
 
Automated Formal Verification of SystemC/C++ High-Level Synthesis Models
Sergio Marchese
 
A Simulation Experiment on a Built-In Self Test Equipped with Pseudorandom Te...
VLSICS Design
 
A Simulation Experiment on a Built-In Self Test Equipped with Pseudorandom Te...
VLSICS Design
 
A Simulation Experiment on a Built-In Self Test Equipped with Pseudorandom Te...
VLSICS Design
 
L1_fault modeling_121.pptx
varshaks3
 
Dill may-2008
Obsidian Software
 
All My X’s Come From Texas...Not!!
jgpecor
 
VLSI Testing : Logic Simulation Part 1.pptx
Varsha506533
 
faults.pdf
kabsmedy14
 
Dealing with the Three Horrible Problems in Verification
DVClub
 
680report final
Rajesh M
 
lecture1 (1)nnoubfubufhbsuhbfhubsufb.ppt
ShantulKhandelwal
 
Fault Simulation (Testing of VLSI Design)
Usha Mehta
 
02~chapter 01 intro.ppt
SandipSolanki10
 
testpattern.ppt
thiru17270
 
Jeda Hls Hlv Success Story V4
Chun Xia
 

Recently uploaded (20)

PDF
ARC--BUILDING-UTILITIES-2-PART-2 (1).pdf
IzzyBaniquedBusto
 
PDF
MAD Unit - 2 Activity and Fragment Management in Android (Diploma IT)
JappanMavani
 
PPTX
MobileComputingMANET2023 MobileComputingMANET2023.pptx
masterfake98765
 
DOCX
8th International Conference on Electrical Engineering (ELEN 2025)
elelijjournal653
 
PPTX
The Role of Information Technology in Environmental Protectio....pptx
nallamillisriram
 
PPTX
Thermal runway and thermal stability.pptx
godow93766
 
PPTX
REINFORCEMENT AS CONSTRUCTION MATERIALS.pptx
mohaiminulhaquesami
 
PDF
MAD Unit - 1 Introduction of Android IT Department
JappanMavani
 
PPTX
Heart Bleed Bug - A case study (Course: Cryptography and Network Security)
Adri Jovin
 
DOCX
CS-802 (A) BDH Lab manual IPS Academy Indore
thegodhimself05
 
PDF
UNIT-4-FEEDBACK AMPLIFIERS AND OSCILLATORS (1).pdf
Sridhar191373
 
PPTX
Destructive Tests corrosion engineer (1).pptx
zeidali3
 
PDF
International Journal of Information Technology Convergence and services (IJI...
ijitcsjournal4
 
PDF
IoT - Unit 2 (Internet of Things-Concepts) - PPT.pdf
dipakraut82
 
PPTX
ISO/IEC JTC 1/WG 9 (MAR) Convenor Report
Kurata Takeshi
 
PDF
Set Relation Function Practice session 24.05.2025.pdf
DrStephenStrange4
 
PDF
Book.pdf01_Intro.ppt algorithm for preperation stu used
archu26
 
PDF
POWER PLANT ENGINEERING (R17A0326).pdf..
haneefachosa123
 
PDF
monopile foundation seminar topic for civil engineering students
Ahina5
 
PPTX
MPMC_Module-2 xxxxxxxxxxxxxxxxxxxxx.pptx
ShivanshVaidya5
 
ARC--BUILDING-UTILITIES-2-PART-2 (1).pdf
IzzyBaniquedBusto
 
MAD Unit - 2 Activity and Fragment Management in Android (Diploma IT)
JappanMavani
 
MobileComputingMANET2023 MobileComputingMANET2023.pptx
masterfake98765
 
8th International Conference on Electrical Engineering (ELEN 2025)
elelijjournal653
 
The Role of Information Technology in Environmental Protectio....pptx
nallamillisriram
 
Thermal runway and thermal stability.pptx
godow93766
 
REINFORCEMENT AS CONSTRUCTION MATERIALS.pptx
mohaiminulhaquesami
 
MAD Unit - 1 Introduction of Android IT Department
JappanMavani
 
Heart Bleed Bug - A case study (Course: Cryptography and Network Security)
Adri Jovin
 
CS-802 (A) BDH Lab manual IPS Academy Indore
thegodhimself05
 
UNIT-4-FEEDBACK AMPLIFIERS AND OSCILLATORS (1).pdf
Sridhar191373
 
Destructive Tests corrosion engineer (1).pptx
zeidali3
 
International Journal of Information Technology Convergence and services (IJI...
ijitcsjournal4
 
IoT - Unit 2 (Internet of Things-Concepts) - PPT.pdf
dipakraut82
 
ISO/IEC JTC 1/WG 9 (MAR) Convenor Report
Kurata Takeshi
 
Set Relation Function Practice session 24.05.2025.pdf
DrStephenStrange4
 
Book.pdf01_Intro.ppt algorithm for preperation stu used
archu26
 
POWER PLANT ENGINEERING (R17A0326).pdf..
haneefachosa123
 
monopile foundation seminar topic for civil engineering students
Ahina5
 
MPMC_Module-2 xxxxxxxxxxxxxxxxxxxxx.pptx
ShivanshVaidya5
 
Ad

9-High-Level-Fault-Grading.ppt

  • 2. Improving Gate-Level Fault Coverage by RTL Fault Grading* * W. Mao and R. K. Gulati, ITC 1996, pp. 150-159.
  • 3. High-Level Fault Grading 3 Motivation Gate-level fault simulation is computationally infeasible for large circuits RTL design available early in the design cycle for fault grading of available (validation or legacy) test vectors It would be nice if fault analysis could be done at RTL level but the results closely approximated gate-level coverage.
  • 4. High-Level Fault Grading 4 Basic Idea Inject stuck-type faults on all PIs, internal signals, and their fanouts using RTL constructs. Use an RTL fault simulator (e.g. Verifault for Verilog) for fault grading at the RTL level Verify the closeness of approximation against gate-level fault coverage.
  • 5. High-Level Fault Grading 5 Example RTL Model and Signal- Flow Diagram
  • 6. High-Level Fault Grading 6 RTL Modified for Fault Injection
  • 7. High-Level Fault Grading 7 Testability Analysis Flow
  • 8. High-Level Fault Grading 8 Handling Signal Fanouts (Optimistic Mode)
  • 9. High-Level Fault Grading 9 Handling Signal Fanouts (Pessimistic Mode)
  • 10. High-Level Fault Grading 10 RTL vs. Gate-Level Fault Coverage
  • 11. High-Level Fault Grading 11 Critique Technique works well only when the circuit is simulated at low-level RTL Errors arise because of: Differences in fanouts at the two levels Most signal fanout lot more at the RTL level (exception: Reset signal) Complex blocks with only I/O visibility The last shortcoming is addressed in the stratified sampling approach of Thaker, Agrawal, and Zaghloul that we consider next.
  • 12. Stratified Sampling for Fault Coverage of VLSI Systems Vishwani D. Agrawal Auburn University Collaborators: Pradip Thaker and Mona Zaghloul
  • 13. High-Level Fault Grading 14 Problem Accurately estimate the gate-level fault coverage for a VLSI system at the RT-level Advantages: Improve test Improve design Avoid expensive design changes Previous approaches do not accurately represent gate-level fault coverage (function errors, mutation, statement faults, branch faults, etc.)
  • 14. High-Level Fault Grading 15 Solution Model faults as representative sample of the targeted (gate-level stuck-at) faults. Treat the coverage in an RTL module as a statistical sampling estimate. For a multi-module VLSI system, combine module coverages according to the stratified sampling technique.
  • 15. High-Level Fault Grading 17 Fault Sampling A randomly selected subset (sample) of faults is simulated. Measured coverage in the sample is used to estimate fault coverage in the entire circuit. Advantage: Saving in computing resources (CPU time and memory.) Disadvantage: Limited data on undetected faults.
  • 16. High-Level Fault Grading 20 Sampling Error Bounds C (1 - C ) | x - C | = 3 [ -------------- ] 1/2 Ns Solving the quadratic equation for C, we get the 3-sigma (99.8% confidence) estimate (Agrawal-Kato, 1990): 4.5 C 3s = x ------- [1 + 0.44 Ns x (1 - x )]1/2 Ns Where Ns is sample size and x is the measured fault coverage in the sample. Example: A circuit with 39,096 faults has an actual fault coverage of 87.1%. The measured coverage in a random sample of 1,000 faults is 88.7%. The above formula gives an estimate of 88.7% 3%. CPU time for sample simulation was about 10% of that for all faults.   Millot, 1923
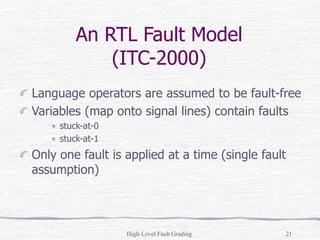
  • 17. High-Level Fault Grading 21 An RTL Fault Model (ITC-2000) Language operators are assumed to be fault-free Variables (map onto signal lines) contain faults stuck-at-0 stuck-at-1 Only one fault is applied at a time (single fault assumption)
  • 18. High-Level Fault Grading 22 RTL Fault Injection Not affected by faults: Synthetic operators + - * >= <= == != Boolean operators & | ^ ~ Logical operators && || ! Sequential elements (flip-flops & latches) Faults introduced in signal variables (stems and fan-outs) Separate faults for bits of data words
  • 19. High-Level Fault Grading 23 Fault Modeling for Boolean Operators module mux(c, a, b, s); assign d = a & s; assign e = s1 & b; assign s1 = !s; assign c = d | e; endmodule RTL Description Symbolic Description a s b d e c s1
  • 20. High-Level Fault Grading 24 Stem and Fan-out Fault Modeling RTL fan-out faults: if(X) then Z=Y; else Z=!Y; Unique RTL fault is placed on each fan-out of each bit of a variable Unique RTL fault on each stem (a) module (b) module
  • 21. High-Level Fault Grading 25 More RTL Faults b [1 ] b [0 ] a [ 1 ] d [1 ] c [ 0 ] c [ 1 ] a [ 0 ] d [0 ] + - * f [2 :0 ] e [ 3 : 0 ] g [2 :0 ] < f [2 :0 ] > e [3 :0 ] e [3 :0 ] g [ 2 :0 ] f [2 :0 ] = h j i M U X c lk r e s e t _ v w k o u t_ si g 1 o u t_ s ig 2 g [2 :0 ]
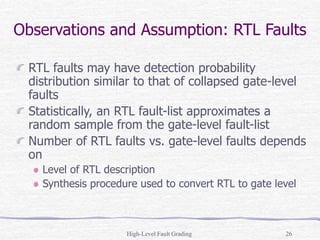
  • 22. High-Level Fault Grading 26 Observations and Assumption: RTL Faults RTL faults may have detection probability distribution similar to that of collapsed gate-level faults Statistically, an RTL fault-list approximates a random sample from the gate-level fault-list Number of RTL faults vs. gate-level faults depends on Level of RTL description Synthesis procedure used to convert RTL to gate level
  • 23. High-Level Fault Grading 27 RTL Fault Simulation Analogous to gate-level approach Faults injected in RTL code of the design description by a C++ parser; a logic buffer element inserted at fault site (technique identical to Mao & Gulati’s). Fault report contains statistics on detected and undetected RTL faults Cadence’s Verifault-XL used as RTL fault simulator
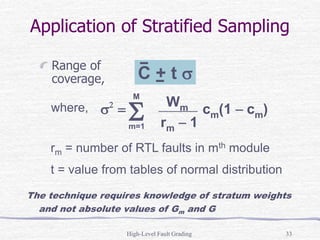
  • 24. High-Level Fault Grading 28 Estimation Error for Module Fault Coverage RTL fault coverage assumed to be an estimate of the collapsed gate-fault coverage within statistical bound [Agrawal and Kato, D&T, 1990]:      2 2 1 4 1 2 k N Nc c k ( )/ a = 3.00 for confidence probability of 99.8% c = ratio of detected to total number of RTL faults M = number of gate faults N = number of RTL faults, k = 1 - N/M
  • 25. High-Level Fault Grading 29 DSP Interface Module (3,168 Gates) 0 10 20 30 40 50 60 70 80 90 100 0 500 1000 1500 Test Vectors RTL & Gate Fault Cov (%) RTL Cov Gate Cov
  • 26. High-Level Fault Grading 30 RTL Faults and VLSI System Coverage Experimental results demonstrate RTL fault coverage of a module to be a good statistical estimate of the gate-level fault coverage A VLSI system consists of many interconnected modules Overall RTL fault-list of a VLSI system does not constitute a representative sample of the gate-level fault-list
  • 27. High-Level Fault Grading 31 Error at System Level RTL Coverage = (0.91 x 100 + 0.39 x 100) / 200 = 65% Gate Coverage = (0.90 x 150 + 0.40 x 400) / 550 = 54% A correct estimation of gate-level fault coverage from RTL coverage: 91 x (150 / 550) + 39 x (400 / 550) = 53% M2 100 faults 39% cov. M1 100 faults 91% cov. M1 150 faults 90% cov. M2 400 faults 40% cov. RTL Gate- level
  • 28. High-Level Fault Grading 32 Application of Stratified Sampling Fault population of a VLSI system divided into strata according to RTL module boundaries RTL faults in each module are considered a sample of corresponding gate-level faults The stratified RTL coverage is an estimate of the gate-level coverage: Wm = stratum weight of mth module = Gm/G cm = RTL fault coverage of mth module Gm = number of gate-level faults in mth module G = number of all gate-level faults in the system M = number of RTL modules in the system M C = S Wmcm m=1
  • 29. High-Level Fault Grading 33 Application of Stratified Sampling Range of coverage, where, rm = number of RTL faults in mth module t = value from tables of normal distribution The technique requires knowledge of stratum weights and not absolute values of Gm and G s2 =  cm(1  cm) S Wm rm  1 m=1 M C + t s
  • 30. High-Level Fault Grading 34 Stratum Weight Extraction Techniques Logic synthesis based weight extraction Wm = Gm/G Floor-planning based weight extraction Wm = Am/A Entropy-measure based weight extraction
  • 31. High-Level Fault Grading 35 Experimental Procedure Technology-dependent weight extraction Several unique gate-level netlists obtained by logic synthesis from the same RTL code Each synthesis run performed using a different set of constraints, e.g., area optimization (netlist 1), speed optimization (netlist 2), or combined area and speed optimizations (netlists 3 and 4) Strata weights calculated using gate-level fault lists of various synthesized netlists Technology-independent weight extraction Stratum weights calculated using area distribution among modules Each set of stratum weights used to calculate RTL fault coverage and error bounds Impact of estimation error investigated
  • 32. High-Level Fault Grading 36 Experimental Data: Weight Distributions 0 0.05 0.1 0.15 0.2 0.25 0.3 1 2 3 4 5 6 7 8 9 10 11 12 Modules Stratum Weights Netlist1 Netlist2 Netlist3 Area Netlist4
  • 33. High-Level Fault Grading 37 Experimental Data: RTL Fault Coverage 0 10 20 30 40 50 60 70 80 1 2 3 4 5 6 7 Test Vector Set Fault Coverage (%) RTL Cov.(Wm from Netlist1) RTL Cov.(Wm from Netlist2) RTL Cov.(Wm from Netlist3) RTL Cov. (Wm from Area) RTL Cov. (Wm from Netlist4) Gate Cov.
  • 34. High-Level Fault Grading 38 Experimental Data: Error Bounds 0 1 2 3 4 5 6 7 8 9 10 1 2 3 4 5 6 7 Test Vectors Error Bounds (|E|) |E|(Wm from Netlist1) |E|(Wm from Netlist2) |E|(Wm from Netlist3) |E|(Wm from Area) |E|(Wm from Netlist4)
  • 35. High-Level Fault Grading 39 Timing Controller ASIC (17,126 Gates) 0 10 20 30 40 50 60 70 0 200 400 600 Test Vectors RTL & Gate Fault Cov (%) RTL Cov Gate Cov
  • 36. High-Level Fault Grading 40 A DSP ASIC (104,881 Gates) 0 10 20 30 40 50 60 70 80 0 200 400 600 800 1000 Test Vectors RTL & Gate Fault Cov(%) RTL Cov Gate Cov
  • 37. High-Level Fault Grading 41 Conclusion Main ideas of RTL fault modeling A small or high-level RTL module contributes few RTL faults, but large statistical tolerance gives a correct coverage estimate Stratified sampling accounts for varying module sizes and for different RTL details that may be used Stratum weights appear to be insensitive to specific details of synthesis Advantages of the proposed RTL fault model High-level test generation and evaluation Early identification of hard-to-test RTL architectures Potential for significantly reducing run-time penalty of the gate-level fault simulation
  • 38. High-Level Fault Grading 42 References - 1 V. D. Agrawal, “Sampling Techniques for Determining Fault Coverage in LSI Circuits,” J. Digital Systems, vol. V, no. 3, pp. 189-202, 1981. V. D. Agrawal and H. Kato, “Fault Sampling Revisited,” IEEE Design & Test of Computers, vol. 7, no. 4, pp. 32-35, Aug. 1990. P. A. Thaker, M. E. Zaghloul, and M. B. Amin, “Study of Correlation of Testability Aspects of RTL Description and Resulting Structural Implementation,” Proc. 12th Int. Conf. VLSI Design, Jan. 1999, pp. 256-259. P. A. Thaker, V. D. Agrawal, and M. E. Zaghloul, “Validation Vector Grade (VVG): A New Coverage Metric for Validation and Test,” Proc. 17th IEEE VLSI Test Symp., Apr. 1999, pp. 182-188.
  • 39. High-Level Fault Grading 43 References - 2 P. A. Thaker, Register-Transfer Level Fault Modeling and Evaluation Techniques, PhD Thesis, George Washington University, Washington, D.C., May 2000. P. A. Thaker, V. D. Agrawal, and M. E. Zaghloul, “Register-Transfer Level Fault Modeling and Test Evaluation Techniques for VLSI Circuits,” Proc. Int. Test Conf., Oct. 2000, pp. 940-949. This presentation is available from the website http://cm.bell-labs.com/cm/cs/who/va
  • 40. High-Level Fault Grading 44 Other Related Papers 1. OCCOM: Fallah et al., IEEE TCAD, Aug. 2001, pp. 1003-1015. 2. IFMB: Santos et al., ITC2001, pp. 377- 385. 3. Probabilistic Testability: Fernandes et al., DATE04, pp. 10176-10181. 4. Kang et al., VTS07.