A22 Introduction to DTrace by Kyle Hailey
0 likes•1,423 views

This document provides an introduction to DTrace and discusses its key features and capabilities. It covers: 1. What DTrace is and how it can be used to trace operating systems and programs with very low overhead. 2. The different ways DTrace can be used, including tracing system calls, kernel functions, user processes, and custom probes added to programs. 3. How DTrace scripts are structured using probes, filters, and actions. Variables that can be used like timestamps. 4. Examples of using DTrace to trace network activity by probe name, argument definitions, and creating DTrace programs.


![How to list Probes?
Two ways to list probes
1. All System and kernel calls
dtrace –l
2. All Process functions
dtrace –l pid[pid]
Output will have 4 part name, colon separated
Provider:module:function:name](https://image.slidesharecdn.com/a22kyleupdatedtraceintroductioninsight-121102023913-phpapp01/85/A22-Introduction-to-DTrace-by-Kyle-Hailey-12-320.jpg)


![Probe arguments: dtrace –lnv
What are the arguments for the probe function
“tcp:ip:tcp_input_data:receive”
$ dtrace -lvn tcp:ip:tcp_input_data:receive
ID PROVIDER MODULE FUNCTION NAME
7301 tcp ip tcp_input_data receive
Argument Types
args[0]: pktinfo_t *
args[1]: csinfo_t *
args[2]: ipinfo_t *
args[3]: tcpsinfo_t *
args[4]: tcpinfo_t *
What is “tcpsinfo_t ” for example ?](https://image.slidesharecdn.com/a22kyleupdatedtraceintroductioninsight-121102023913-phpapp01/85/A22-Introduction-to-DTrace-by-Kyle-Hailey-18-320.jpg)


![Creating a Program
• Find out all the machines we are receiving TCP packets from
$ cat tcpreceive.d
#!/usr/sbin/dtrace -s
#pragma D option quiet
probe tcp:ip:tcp_input_data:receive
action { printf(" address %s ¥n", args[3]->tcps_raddr ); }
args[3]: tcpsinfo_t *
$ sudo ./tcpreceive.d
address 127.0.0.1
address 172.16.103.58 When TCP receive
address 127.0.0.1 Print remote address
address 172.16.100.187
address 172.16.103.58
address 127.0.0.1
^C](https://image.slidesharecdn.com/a22kyleupdatedtraceintroductioninsight-121102023913-phpapp01/85/A22-Introduction-to-DTrace-by-Kyle-Hailey-22-320.jpg)


![Variables
1. Globals
• Not thread save
X=1;
A[1]=1;
2. Aggregates
• Thread safe scalars and arrays
• Special operations, Count, average, quantize
@ct = count() ;
@sm = sum(value);
@sm[type]=sum(value);
@agg = quantize(value);
3. Self-> var
• Thread variable, self->x = value;
4. This->var
• Light weight variable for only this probe firing
• this->x = value;](https://image.slidesharecdn.com/a22kyleupdatedtraceintroductioninsight-121102023913-phpapp01/85/A22-Introduction-to-DTrace-by-Kyle-Hailey-25-320.jpg)

![What is an aggregate?
• Multi CPU safe variable
• Light weight
• Array or scalar
• Denoted by @
– @var= function(value);
– @var[array_indice]=function(value);
• Functions pre-defined only, such as
– sum()
– count()
– max()
– quantize()***
• Print out with “printa”](https://image.slidesharecdn.com/a22kyleupdatedtraceintroductioninsight-121102023913-phpapp01/85/A22-Introduction-to-DTrace-by-Kyle-Hailey-27-320.jpg)
![Using Aggregates: count()
What program writes the most often?
syscall::write:entry {
@counts[execname] = count();
}
expr 72
sh 291
tee 814
make.bin 2010
execname = session Count of occurrences doing writes
https://wikis.oracle.com/display/DTrace/Aggregations](https://image.slidesharecdn.com/a22kyleupdatedtraceintroductioninsight-121102023913-phpapp01/85/A22-Introduction-to-DTrace-by-Kyle-Hailey-28-320.jpg)

![Aggregate : quantize()
What if we wanted a distribution of all I/O sizes?
bio = block I/O
$ sudo dtrace -ln io:::
ID PROVIDER MODULE FUNCTION NAME
6281 io genunix biodone done
6282 io genunix biowait wait-done
6283 io genunix biowait wait-start
7868 io nfs nfs_bio done NFS
7871 io nfs nfs_bio start module
$ sudo dtrace -lvn io:genunix:biodone:done
ID PROVIDER MODULE FUNCTION NAME What is
6281 io genunix biodone done bufinfo_t?
Argument Types
args[0]: bufinfo_t * Sounds like
args[1]: devinfo_t * Buffer
args[2]: fileinfo_t information](https://image.slidesharecdn.com/a22kyleupdatedtraceintroductioninsight-121102023913-phpapp01/85/A22-Introduction-to-DTrace-by-Kyle-Hailey-30-320.jpg)

![bufinfo_t arguments
$ sudo dtrace -lvn io:genunix:biodone:done
ID PROVIDER MODULE FUNCTION NAME
6281 io genunix biodone done
Argument Types
args[0]: bufinfo_t *
args[1]: devinfo_t *
args[2]: fileinfo_t
args[0] = bufinfo_t *
bufinfo_t -> b_bcount= number of bytes
Use in Dtrace
args[0]->b_bcount](https://image.slidesharecdn.com/a22kyleupdatedtraceintroductioninsight-121102023913-phpapp01/85/A22-Introduction-to-DTrace-by-Kyle-Hailey-32-320.jpg)
![Aggregate Example: iosizes.d
#!/usr/sbin/dtrace -s
#pragma D option quiet
io:::done
{ @sizes = quantize(args[0]->b_bcount); }
Size of the
I/O
$ sudo iosizes.d
value --- Distribution -- count
256 | 0
512 |@@@@ 6
1024 |@@@@ 6
2048 |@@@@@@@@@@@@@@@@@@ 31
4096 |@@@ 5
8192 |@@@@@ 9
16384 |@@@@ 6
32768 | 0
65536 | 0
^C](https://image.slidesharecdn.com/a22kyleupdatedtraceintroductioninsight-121102023913-phpapp01/85/A22-Introduction-to-DTrace-by-Kyle-Hailey-33-320.jpg)
![Aggregate : iosizes.d with execname
Kernel land I/O
#!/usr/sbin/dtrace -s
#pragma D option quiet
io:::done
{ @sizes[execname] = quantize(args[0]->b_bcount); }
Size of the
I/O
$ sudo iosizes.d
sched
value --- Distribution -- count
256 | 0
512 |@@@@ 6
Only returns
1024 |@@@@ 6
I/O for sched
2048 |@@@@@@@@@@@@@@@@@@ 31
4096 |@@@ 5
Why?
8192 |@@@@@ 9
16384 |@@@@ 6
32768 | 0
^C](https://image.slidesharecdn.com/a22kyleupdatedtraceintroductioninsight-121102023913-phpapp01/85/A22-Introduction-to-DTrace-by-Kyle-Hailey-34-320.jpg)

![User program system call “read”
Arg0 = fd
Arg1 = *buf
Arg2 = size
Instead of
args[2]->size
Use
arg2
$ sudo dtrace -lvn syscall::read:entry
Argument Types
None](https://image.slidesharecdn.com/a22kyleupdatedtraceintroductioninsight-121102023913-phpapp01/85/A22-Introduction-to-DTrace-by-Kyle-Hailey-37-320.jpg)
![Aggregate Example: readsizes.d
User land I/O
#!/usr/sbin/dtrace -s
#pragma D option quiet
syscall::read:entry
{ @read_sizes[execname] = quantize(arg2); }
Size of the
I/O
java
value ------------- Distribution ------------- count
4096 | 0
8192 |@@@@@@@@@@@@@@@@@@@@@@@@@@@@@@@@@@@@@@@@ 2
16384 | 0
cat
value ------------- Distribution ------------- count
16384 | 0
32768 |@@@@@@@@@@@@@@@@@@@@@@@@@@@@@@@@@@@@@@@@ 1
65536 | 0
sshd
value ------------- Distribution ------------- count
8192 | 0
16384 |@@@@@@@@@@@@@@@@@@@@@@@@@@@@@@@@@@@@@@@@ 931
32768 | 0](https://image.slidesharecdn.com/a22kyleupdatedtraceintroductioninsight-121102023913-phpapp01/85/A22-Introduction-to-DTrace-by-Kyle-Hailey-38-320.jpg)
![Built in variable examples
No function name =
Wild card, all matches Program name
# cat exec.d Function executing
#!/usr/sbin/dtrace -s Records function
That fires
syscall:::entry
{ @num[execname, probefunc] = count(); }
dtrace:::END
{ printa(" %-32s %-32s %@8d¥n", @num);}
# ./syscall.d
dtrace: script './exec.d' matched 236 probes
sleep stat64 32
vmtoolsd pollsys 37
java pollsys 72
java lwp_cond_wait 180
Execname function count](https://image.slidesharecdn.com/a22kyleupdatedtraceintroductioninsight-121102023913-phpapp01/85/A22-Introduction-to-DTrace-by-Kyle-Hailey-40-320.jpg)
![Latency: how long does I/O take?
Latency = delta = end_time – start_time
– start_time io:::start
– end_time io:::done
Array to hold each I/O start time:
• Array needs a unique key for each I/O
• Key could be based on
– device = args[0]->b_edev Look these up in source
– block = args[0]->b_blkno
Array: tm_start[device,block]=timestamp](https://image.slidesharecdn.com/a22kyleupdatedtraceintroductioninsight-121102023913-phpapp01/85/A22-Introduction-to-DTrace-by-Kyle-Hailey-42-320.jpg)
![Latency
Timestamp Array index filter
comment array
#!/usr/sbin/dtrace -s
#pragma D option quiet
start io:::start
/* device block number */
{ tm_start[ args[0]->b_edev, args[0]->b_blkno] = timestamp; }
end io:::done
/ tm_start[ args[0]->b_edev, args[0]->b_blkno] /
{
this->delta =
(timestamp - tm_start[args[0]->b_edev,args[0]->b_blkno] );
@io = quantize(this->delta);
tm_start[ args[0]->b_edev, args[0]->b_blkno] = 0;
}
quantize Clear
Output
array Timestamp
Nano-second
Array entry](https://image.slidesharecdn.com/a22kyleupdatedtraceintroductioninsight-121102023913-phpapp01/85/A22-Introduction-to-DTrace-by-Kyle-Hailey-43-320.jpg)
![Other ways of keying start/end
1. We used a global array
– tm_start[device,block]=timestamp
– Probably best general way
2. Some people use arg0
– tm_start[arg0]=timestamp
– Not as clear that this is valid
3. Others use
– self->start = timestamp;
– This only works if the same thread that does the begin
probe is the same the does the end probe
• Doesn’t work for io:::start , io:::done
• Does work for nfs:::start , nfs:::done](https://image.slidesharecdn.com/a22kyleupdatedtraceintroductioninsight-121102023913-phpapp01/85/A22-Introduction-to-DTrace-by-Kyle-Hailey-44-320.jpg)

![Latency: output every second
#!/usr/sbin/dtrace -s
#pragma D option quiet
io:::start
start /* device block number */
{ tm_start[ args[0]->b_edev, args[0]->b_blkno] = timestamp; }
io:::done
/ tm_start[ args[0]->b_edev, args[0]->b_blkno] /
{
end this->delta =
(timestamp - tm_start[args[0]->b_edev,args[0]->b_blkno] );
@io = quantize(this->delta);
tm_start[ args[0]->b_edev, args[0]->b_blkno] = 0;
}
Every profile:::tick-1sec
{ printa(@io);
second trunc(@io);
}
clear print quantize clear](https://image.slidesharecdn.com/a22kyleupdatedtraceintroductioninsight-121102023913-phpapp01/85/A22-Introduction-to-DTrace-by-Kyle-Hailey-46-320.jpg)
![Tracing User Processes
• What can you trace in Oracle
– $ ps –ef | grep oracle
– Get a process id
– $ dtrace –l pid[process_id]
– Lists program functions
• What do these functions do?
– Source code for Mysql
– Guess if you are on Oracle
– Some good blogs out there](https://image.slidesharecdn.com/a22kyleupdatedtraceintroductioninsight-121102023913-phpapp01/85/A22-Introduction-to-DTrace-by-Kyle-Hailey-48-320.jpg)


A22 Introduction to DTrace by Kyle Hailey
- 2. Agenda 1. Intro … Me … Delphix 2. What is DTrace 3. Why DTrace – Make the Impossible be possible – Low overhead 4. Where DTrace can be used 5. How DTrace is used – Probes – Overhead – Variables – Resources
- 3. Kyle Hailey • OEM 10g Performance Monitoring • Visual SQL Tuning (VST) in DB Optimizer • Delphix
- 4. Delphix 25 TB 2 TB
- 5. What is DTrace • Way of tracing O/S and Programs – Making the impossible possible • Your code unchanged – Optional add static DTrace probes • No overhead when off – Turning on dynamically changes code path • Low overhead when on – 1000s of events per second cause less 1% overhead • Event Driven – Like event 10046, 10053
- 7. Where can we trace • Solaris • OpenSolaris • FreeBSD … • MacOS • Linux – announced from Oracle • AIX – working “probevue”
- 8. What can we trace? Almost anything – All system calls “read” – All kernel calls “biodone” – All function calls in a program – All DTrace stable providers • Example : io:::start • Predefined stable probes • Non-stable Probe names and arguments can change over time – Custom probes • Write custom probes in programs to trace
- 9. Structure (called a probe) $ cat mydtrace.d #!/usr/sbin/dtrace -s Section1 : •Probe Name_of_something_to_trace •Filter / filters / •Clause { actions } # additional tracing Section 2 Something_else_to_trace /optional filters / { take some actions }
- 10. Event Driven • DTrace Code run when probes fire in OS /usr/sbin/dtrace -n ' Probe (multi-threaded, process) #pragma D option quiet when this happens then: io:::start { printf(" timestamp %d ¥n",timestamp); }' Take action • Program runs until canceled Print variable $ sudo ./mydtrace.d timestamp 8135515300287183 timestamp 8135515300328512 timestamp 8135515300346769 ^C
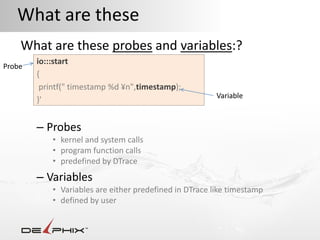
- 11. What are these What are these probes and variables:? io:::start Probe { printf(" timestamp %d ¥n",timestamp); Variable }' – Probes • kernel and system calls • program function calls • predefined by DTrace – Variables • Variables are either predefined in DTrace like timestamp • defined by user
- 12. How to list Probes? Two ways to list probes 1. All System and kernel calls dtrace –l 2. All Process functions dtrace –l pid[pid] Output will have 4 part name, colon separated Provider:module:function:name
- 13. Kernel vs User Space Kernel Functions dtrace –l $ dtrace –l dtrace –l System Calls 899 731 21 User Land $ dtrace –l pid21 User Processes
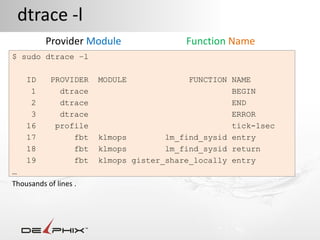
- 14. dtrace -l Provider Module Function Name $ sudo dtrace –l ID PROVIDER MODULE FUNCTION NAME 1 dtrace BEGIN 2 dtrace END 3 dtrace ERROR 16 profile tick-1sec 17 fbt klmops lm_find_sysid entry 18 fbt klmops lm_find_sysid return 19 fbt klmops gister_share_locally entry … Thousands of lines .
- 15. dtrace –l : grouping probes Provider:module:function:name $ sudo dtrace -l | awk '{print $2 }' | sort | uniq -c | sort -nr Count provider area 72095 fbt – kernel functions 1283 sdt - system calls 629 mib - system statistics 473 hotspot_jni, hotspot – JVM 466 syscall – system calls 173 nfsv4,nfsv3,tcp,udp,ip – network 61 sysinfo – kernel statistics 55 sched – CPU, io, scheduling 46 fsinfo - file system info 41 vminfo - memory 40 iscsi,fc - iscsi,fibre channel 22 lockstat - locks 15 proc - fork, exit , create 14 profile - timers tick 12 io - io:::start, done 3 dtrace - BEGIN, END, ERROR
- 16. Providers:defined interfaces Instead of tracing a kernel function, which could change between O/S versions, trace a maintained, stable probe https://wikis.oracle.com/display/DTrace/Providers – I/O io Provider – CPU sched Provider – system calls syscall Provider – memory vminfo Provider – user processes pid Provider – network tcp Provider Provider definition files in /usr/lib/dtrace, such as io.d, nfs.d, sched.d, tcp.d
- 17. Example Network: TCP What if we wanted to look for TCP transmissions for receive ? Probes have 4 part name Provider:module:function:name $ dtrace –l | grep tcp | grep receive tcp:ip:tcp_input_data:receive Or look at wiki https://wikis.oracle.com/display/DTrace/tcp+Provider
- 18. Probe arguments: dtrace –lnv What are the arguments for the probe function “tcp:ip:tcp_input_data:receive” $ dtrace -lvn tcp:ip:tcp_input_data:receive ID PROVIDER MODULE FUNCTION NAME 7301 tcp ip tcp_input_data receive Argument Types args[0]: pktinfo_t * args[1]: csinfo_t * args[2]: ipinfo_t * args[3]: tcpsinfo_t * args[4]: tcpinfo_t * What is “tcpsinfo_t ” for example ?
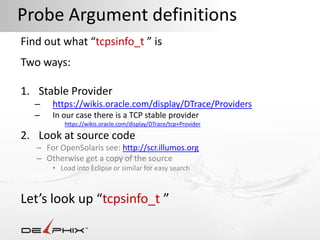
- 19. Probe Argument definitions Find out what “tcpsinfo_t ” is Two ways: 1. Stable Provider – https://wikis.oracle.com/display/DTrace/Providers – In our case there is a TCP stable provider https://wikis.oracle.com/display/DTrace/tcp+Provider 2. Look at source code – For OpenSolaris see: http://scr.illumos.org – Otherwise get a copy of the source • Load into Eclipse or similar for easy search Let’s look up “tcpsinfo_t ”
- 20. src.illumos.org Type in variable Click on Link
- 21. src.illumos.org tcpsinfo_t - points to many things example string tcps_raddr = Remote machines IP address
- 22. Creating a Program • Find out all the machines we are receiving TCP packets from $ cat tcpreceive.d #!/usr/sbin/dtrace -s #pragma D option quiet probe tcp:ip:tcp_input_data:receive action { printf(" address %s ¥n", args[3]->tcps_raddr ); } args[3]: tcpsinfo_t * $ sudo ./tcpreceive.d address 127.0.0.1 address 172.16.103.58 When TCP receive address 127.0.0.1 Print remote address address 172.16.100.187 address 172.16.103.58 address 127.0.0.1 ^C
- 23. Using for TCP Window sizes ip usend ssz send recd 172.16.103.58 564 16028 564 ¥ 172.16.103.58 696 16208 132 ¥ 172.16.103.58 1180 16208 484 ¥ 172.16.103.58 1664 16208 484 ¥ 172.16.103.58 2148 16208 484 ¥ 172.16.103.58 2148 16208 / 0 172.16.103.58 1452 16208 / 0 Remote Unacknowledged Send Receive Machine Bytes Sent Bytes Bytes Send Window Bytes If unacknowleged bytes sent goes above send window then transmissions will be delayed
- 24. Review so far • DTrace – trace O/S and user programs • Solaris and partially on Linux among others • Code is event driven, structure – probe – Include optional filter – Action • Get all event’s with “dtrace –l” • Get event arguments with “dtrace –lnv probe” • Get argument definitions in source or wiki
- 25. Variables 1. Globals • Not thread save X=1; A[1]=1; 2. Aggregates • Thread safe scalars and arrays • Special operations, Count, average, quantize @ct = count() ; @sm = sum(value); @sm[type]=sum(value); @agg = quantize(value); 3. Self-> var • Thread variable, self->x = value; 4. This->var • Light weight variable for only this probe firing • this->x = value;
- 26. Variables: Aggregates are best dtrace.org/blogs/brendan/2011/11/25/dtrace-variable-types/
- 27. What is an aggregate? • Multi CPU safe variable • Light weight • Array or scalar • Denoted by @ – @var= function(value); – @var[array_indice]=function(value); • Functions pre-defined only, such as – sum() – count() – max() – quantize()*** • Print out with “printa”
- 28. Using Aggregates: count() What program writes the most often? syscall::write:entry { @counts[execname] = count(); } expr 72 sh 291 tee 814 make.bin 2010 execname = session Count of occurrences doing writes https://wikis.oracle.com/display/DTrace/Aggregations
- 29. Aggregate: quantize() Get distribution of all I/O sizes If the following returns too many rows $ sudo dtrace -l | grep io Alternately Limit output to specific probes with “-ln” flag: $ sudo dtrace -ln io::: ID PROVIDER MODULE FUNCTION NAME 6281 io genunix biodone done 6282 io genunix biowait wait-done 6283 io genunix biowait wait-start 7868 io nfs nfs_bio done 7871 io nfs nfs_bio start
- 30. Aggregate : quantize() What if we wanted a distribution of all I/O sizes? bio = block I/O $ sudo dtrace -ln io::: ID PROVIDER MODULE FUNCTION NAME 6281 io genunix biodone done 6282 io genunix biowait wait-done 6283 io genunix biowait wait-start 7868 io nfs nfs_bio done NFS 7871 io nfs nfs_bio start module $ sudo dtrace -lvn io:genunix:biodone:done ID PROVIDER MODULE FUNCTION NAME What is 6281 io genunix biodone done bufinfo_t? Argument Types args[0]: bufinfo_t * Sounds like args[1]: devinfo_t * Buffer args[2]: fileinfo_t information
- 31. Finding what bufinfo_t points to
- 32. bufinfo_t arguments $ sudo dtrace -lvn io:genunix:biodone:done ID PROVIDER MODULE FUNCTION NAME 6281 io genunix biodone done Argument Types args[0]: bufinfo_t * args[1]: devinfo_t * args[2]: fileinfo_t args[0] = bufinfo_t * bufinfo_t -> b_bcount= number of bytes Use in Dtrace args[0]->b_bcount
- 33. Aggregate Example: iosizes.d #!/usr/sbin/dtrace -s #pragma D option quiet io:::done { @sizes = quantize(args[0]->b_bcount); } Size of the I/O $ sudo iosizes.d value --- Distribution -- count 256 | 0 512 |@@@@ 6 1024 |@@@@ 6 2048 |@@@@@@@@@@@@@@@@@@ 31 4096 |@@@ 5 8192 |@@@@@ 9 16384 |@@@@ 6 32768 | 0 65536 | 0 ^C
- 34. Aggregate : iosizes.d with execname Kernel land I/O #!/usr/sbin/dtrace -s #pragma D option quiet io:::done { @sizes[execname] = quantize(args[0]->b_bcount); } Size of the I/O $ sudo iosizes.d sched value --- Distribution -- count 256 | 0 512 |@@@@ 6 Only returns 1024 |@@@@ 6 I/O for sched 2048 |@@@@@@@@@@@@@@@@@@ 31 4096 |@@@ 5 Why? 8192 |@@@@@ 9 16384 |@@@@ 6 32768 | 0 ^C
- 35. Kernel vs User Space • I/O is done by the kernel so only see “sched” • User I/O is done via a system call to kernel I/O is in Kernel Functions kernel dtrace –l done by sched dtrace –l System Calls User programs 899 make a 731 21 User Land system call “read”
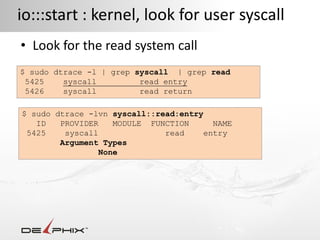
- 36. io:::start : kernel, look for user syscall • Look for the read system call $ sudo dtrace -l | grep syscall | grep read 5425 syscall read entry 5426 syscall read return $ sudo dtrace -lvn syscall::read:entry ID PROVIDER MODULE FUNCTION NAME 5425 syscall read entry Argument Types None
- 37. User program system call “read” Arg0 = fd Arg1 = *buf Arg2 = size Instead of args[2]->size Use arg2 $ sudo dtrace -lvn syscall::read:entry Argument Types None
- 38. Aggregate Example: readsizes.d User land I/O #!/usr/sbin/dtrace -s #pragma D option quiet syscall::read:entry { @read_sizes[execname] = quantize(arg2); } Size of the I/O java value ------------- Distribution ------------- count 4096 | 0 8192 |@@@@@@@@@@@@@@@@@@@@@@@@@@@@@@@@@@@@@@@@ 2 16384 | 0 cat value ------------- Distribution ------------- count 16384 | 0 32768 |@@@@@@@@@@@@@@@@@@@@@@@@@@@@@@@@@@@@@@@@ 1 65536 | 0 sshd value ------------- Distribution ------------- count 8192 | 0 16384 |@@@@@@@@@@@@@@@@@@@@@@@@@@@@@@@@@@@@@@@@ 931 32768 | 0
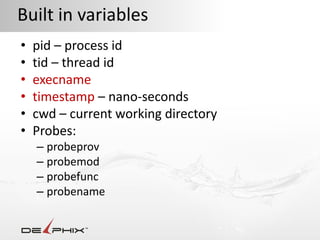
- 39. Built in variables • pid – process id • tid – thread id • execname • timestamp – nano-seconds • cwd – current working directory • Probes: – probeprov – probemod – probefunc – probename
- 40. Built in variable examples No function name = Wild card, all matches Program name # cat exec.d Function executing #!/usr/sbin/dtrace -s Records function That fires syscall:::entry { @num[execname, probefunc] = count(); } dtrace:::END { printa(" %-32s %-32s %@8d¥n", @num);} # ./syscall.d dtrace: script './exec.d' matched 236 probes sleep stat64 32 vmtoolsd pollsys 37 java pollsys 72 java lwp_cond_wait 180 Execname function count
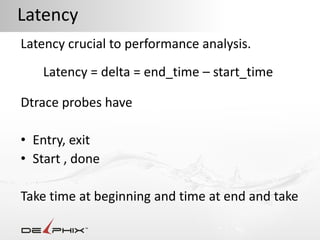
- 41. Latency Latency crucial to performance analysis. Latency = delta = end_time – start_time Dtrace probes have • Entry, exit • Start , done Take time at beginning and time at end and take
- 42. Latency: how long does I/O take? Latency = delta = end_time – start_time – start_time io:::start – end_time io:::done Array to hold each I/O start time: • Array needs a unique key for each I/O • Key could be based on – device = args[0]->b_edev Look these up in source – block = args[0]->b_blkno Array: tm_start[device,block]=timestamp
- 43. Latency Timestamp Array index filter comment array #!/usr/sbin/dtrace -s #pragma D option quiet start io:::start /* device block number */ { tm_start[ args[0]->b_edev, args[0]->b_blkno] = timestamp; } end io:::done / tm_start[ args[0]->b_edev, args[0]->b_blkno] / { this->delta = (timestamp - tm_start[args[0]->b_edev,args[0]->b_blkno] ); @io = quantize(this->delta); tm_start[ args[0]->b_edev, args[0]->b_blkno] = 0; } quantize Clear Output array Timestamp Nano-second Array entry
- 44. Other ways of keying start/end 1. We used a global array – tm_start[device,block]=timestamp – Probably best general way 2. Some people use arg0 – tm_start[arg0]=timestamp – Not as clear that this is valid 3. Others use – self->start = timestamp; – This only works if the same thread that does the begin probe is the same the does the end probe • Doesn’t work for io:::start , io:::done • Does work for nfs:::start , nfs:::done
- 45. Tracing vs Profiling Tracing • Programs run until ^C • Can print every probe • At ^C all unprinted variables are printed Profiling • Take action every X seconds • Special probe name profile:::tick-1sec Can profile at hz or ns, us, ms, sec profile:::tick-1 Hz profile:::tick-1ms ms
- 46. Latency: output every second #!/usr/sbin/dtrace -s #pragma D option quiet io:::start start /* device block number */ { tm_start[ args[0]->b_edev, args[0]->b_blkno] = timestamp; } io:::done / tm_start[ args[0]->b_edev, args[0]->b_blkno] / { end this->delta = (timestamp - tm_start[args[0]->b_edev,args[0]->b_blkno] ); @io = quantize(this->delta); tm_start[ args[0]->b_edev, args[0]->b_blkno] = 0; } Every profile:::tick-1sec { printa(@io); second trunc(@io); } clear print quantize clear
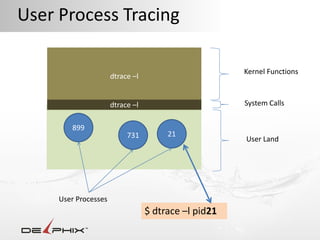
- 47. User Process Tracing Kernel Functions dtrace –l dtrace –l System Calls 899 731 21 User Land User Processes $ dtrace –l pid21
- 48. Tracing User Processes • What can you trace in Oracle – $ ps –ef | grep oracle – Get a process id – $ dtrace –l pid[process_id] – Lists program functions • What do these functions do? – Source code for Mysql – Guess if you are on Oracle – Some good blogs out there
- 49. Overhead User process tracing (from Brendan Gregg ) • Don't worry too much about pid provider probe cost at < 1000 events/sec. • At > 10,000 events/sec, pid provider probe cost will be noticeable. • At > 100,000 events/sec, pid provider probe cost may be painful. User process probes 2-15us typical, could be slower Kernel and system calls are cheaper to trace • > 1,000,000 20% impact For non CPU work loads impact may be greater • TCP tests showed 50% throughput drop at 160K events/sec – 40K interupts/sec
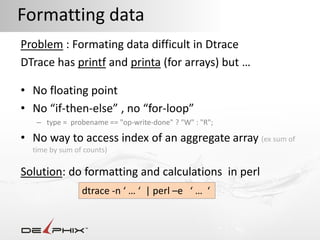
- 50. Formatting data Problem : Formating data difficult in Dtrace DTrace has printf and printa (for arrays) but … • No floating point • No “if-then-else” , no “for-loop” – type = probename == "op-write-done" ? "W" : "R"; • No way to access index of an aggregate array (ex sum of time by sum of counts) Solution: do formatting and calculations in perl dtrace -n ‘ … ‘ | perl –e ‘ … ‘
- 51. Summary • Stucture #!/usr/sbin/dtrace -s Name_of_something_to_trace / filters / { actions } • List of Probes dtrace -l • Arguments to probes dtrace –lnv prov:mod:func:name • Look up args in source code http://scr.illumos.org • Use Aggregates @ – they make DTrace easy • Google Dtrace – Find example programs
- 52. Resources • Oracle Wiki – wikis.oracle.com/display/Dtrace • DTrace book: – www.dtracebook.com • Brendan Gregg’s Blog – dtrace.org/blogs/brendan/ • Oracle examples – alexanderanokhin.wordpress.com/2011/11/13 – andreynikolaev.wordpress.com/2010/10/28/ – blog.tanelpoder.com/2009/04/24