Accelerated Windows Software Trace Analysis training public slides
1 like130 views

The document outlines a training program on Windows software trace analysis aimed at enhancing troubleshooting skills by reviewing tracing fundamentals and analyzing patterns in logs. It introduces key concepts such as processes, threads, and modules, along with practical exercises and examples to illustrate trace analysis techniques. Various tools and patterns for effectively analyzing software traces are discussed, providing a comprehensive overview of best practices in software diagnostics.


![Minimal Trace Graphs
© 2012 Software Diagnostics Services
Time
# PID TID Time Message
No Module PID TID Date Time Message
-----------------------------------------------------------
1 ModuleA 4280 1736 5/28/2012 08:53:50.496 Trace message 1
2 ModuleB 6212 6216 5/28/2012 08:53:52.876 Trace message 2
[…]](https://image.slidesharecdn.com/accelerated-windows-software-trace-analysis-public-171020130114/85/Accelerated-Windows-Software-Trace-Analysis-training-public-slides-20-320.jpg)


![Exception Stack Trace
© 2012 Software Diagnostics Services
No PID TID Message
------------------------
[…]
265799 8984 4216 ComponentA.Store.GetData threw exception: ‘System.Reflection.TargetInvocationException: DCOM connection to
server failed with error: ‘Exception from HRESULT: 0×842D0001′ —> System.Runtime.InteropServices.COMException (0×842D0001):
Exception from HRESULT: 0×842D0001
265800 8984 4216 === Exception Stack Trace ===
265801 8984 4216 at System.Runtime.Remoting.Proxies.RealProxy.HandleReturnMessage(IMessage reqMsg, IMessage retMsg)
265802 8984 4216 at System.Runtime.Remoting.Proxies.RealProxy.PrivateInvoke(MessageData& msgData, Int32 type)
265803 8984 4216 at ComponentA.Store.GetData(Byte[] pKey)
265804 8984 4216 at ComponentA.App.EnumBusinessObjects()
[…]
Related Patterns
Error Message](https://image.slidesharecdn.com/accelerated-windows-software-trace-analysis-public-171020130114/85/Accelerated-Windows-Software-Trace-Analysis-training-public-slides-33-320.jpg)
![Periodic Error ↓
© 2012 Software Diagnostics Services
Related Patterns
Error Message
Error Distribution
False Positive Error
Message Invariant
No PID TID Message
-----------------------
[…]
36495 1788 2250 MyClass::Init: Cannot open connection “Client ID: 310″, status=5
[…]
[…]
36883 1788 1986 MyClass::Init: Cannot open connection “Client ID: 612″, status=5
[…]
Time
# PID TID Time Message](https://image.slidesharecdn.com/accelerated-windows-software-trace-analysis-public-171020130114/85/Accelerated-Windows-Software-Trace-Analysis-training-public-slides-34-320.jpg)


![Circular Trace ↓
© 2012 Software Diagnostics Services
Time
# PID TID Time Message
Problem
Repro
No Module PID TID Date Time Message
---------------------------------------------------------------
1 ModuleA 4280 1736 5/28/2009 08:53:50.496 Trace message 1
2 ModuleB 6212 6216 5/28/2009 08:53:52.876 Trace message 2
3 ModuleA 4280 4776 5/28/2009 08:54:13.537 Trace message 3
[…]
3799 ModuleA 4280 3776 5/28/2009 09:15:00.853 Trace message 3799
3800 ModuleA 4280 1736 5/27/2009 09:42:12.029 Trace message 3800
[…]
579210 ModuleA 4280 4776 5/28/2009 08:53:35.989 Trace message 579210
Related Patterns
Focus of Tracing](https://image.slidesharecdn.com/accelerated-windows-software-trace-analysis-public-171020130114/85/Accelerated-Windows-Software-Trace-Analysis-training-public-slides-39-320.jpg)


![No Trace Metafile
© 2012 Software Diagnostics Services
# Module PID TID Time Message
-------------------------------------------
[…]
21372 dllA 2968 5476 3:55:10.004 Calling foo()
21373 Unknown 2968 5476 3:55:10.004 Unknown GUID=A1E38F24-613D-4D71-B9F5-… (No Format Information found).
21374 Unknown 2968 5476 3:55:10.004 Unknown GUID=A1E38F24-613D-4D71-B9F5-… (No Format Information found)
21375 Unknown 2968 5476 3:55:10.004 Unknown GUID=A1E38F24-613D-4D71-B9F5-… (No Format Information found)
21376 Unknown 2968 5476 3:55:10.004 Unknown GUID=A1E38F24-613D-4D71-B9F5-… (No Format Information found)
21377 Unknown 2968 5476 3:55:10.004 Unknown GUID=A1E38F24-613D-4D71-B9F5-… (No Format Information found)
21378 dllA 2968 5476 3:55:10.004 Calling bar()
[…]
Possible patterns to detect:
Circular Trace
Message Density
Message Current
Discontinuity
Time Delta
Trace Acceleration
Related Patterns
Thread of Activity](https://image.slidesharecdn.com/accelerated-windows-software-trace-analysis-public-171020130114/85/Accelerated-Windows-Software-Trace-Analysis-training-public-slides-43-320.jpg)


![Data Flow ↓
© 2012 Software Diagnostics Services
# PID TID Time Message
Time
Related Patterns
Adjoint Thread
Message Invariant
[…]
DriverA: Device 0xA IRP 0xB
[…]
DriverB: Device 0xC IRP 0xB
[…]
DriverC: Device 0xD IRP 0xB
DriverC: Processing IRP 0xB
[…]](https://image.slidesharecdn.com/accelerated-windows-software-trace-analysis-public-171020130114/85/Accelerated-Windows-Software-Trace-Analysis-training-public-slides-70-320.jpg)


![Message Invariant
© 2012 Software Diagnostics Services
# Module PID TID Time Message
-------------------------------------------------------------------------------------------
[…]
2782 ModuleA 2124 5648 10:58:03.356 CreateObject: pObject 0×00A83D30 data ([…]) version 0×4
[…]
# Module PID TID Time Message
-------------------------------------------------------------------------------------------
[…]
4793 ModuleA 2376 8480 09:22:01.947 CreateObject: pObject 0×00BA4E20 data ([…]) version 0×5
[…]
Related Patterns
Trace Set](https://image.slidesharecdn.com/accelerated-windows-software-trace-analysis-public-171020130114/85/Accelerated-Windows-Software-Trace-Analysis-training-public-slides-80-320.jpg)
![UI Message
© 2012 Software Diagnostics Services
Related Patterns
Activity Region
Significant Event
Thread of Activity
Adjoint Thread
# Module PID TID Time Message
--------------------------------------------------------------------------------
[…]
2782 ModuleA 2124 5648 10:58:03.356 CreateWindow: Title "..." Class "..."
[…]
3512 ModuleA 2124 5648 10:58:08.154 Menu command: Save Data
[…]
3583 ModuleA 2124 5648 10:58:08.155 CreateWindow: Title "Save As" Class "Dialog"
[... Data update and replication related messages ...]
4483 ModuleA 2124 5648 10:58:12.342 DestroyWindow: Title "Save As" Class "Dialog"
[…]
# Module PID TID Time Message
--------------------------------------------------------------------------------
[…]
2782 ModuleA 2124 5648 10:58:03.356 CreateWindow: Title "..." Class "..."
3512 ModuleA 2124 5648 10:58:08.154 Menu command: Save Data
3583 ModuleA 2124 5648 10:58:08.155 CreateWindow: Title "Save As" Class "Dialog"
4483 ModuleA 2124 5648 10:58:12.342 DestroyWindow: Title "Save As" Class "Dialog"
[…]](https://image.slidesharecdn.com/accelerated-windows-software-trace-analysis-public-171020130114/85/Accelerated-Windows-Software-Trace-Analysis-training-public-slides-81-320.jpg)
![Original Message
© 2012 Software Diagnostics Services
# Module PID TID Time Message
---------------------------------------------------------------------------------------------------------
[…]
35835 ModuleA 12332 11640 18:27:28.720 LoadLibrary: Program FilesMyProductSystem32MyDLL.dll PID 12332
[…]
37684 ModuleA 12332 9576 18:27:29.063 LoadLibrary: Program FilesMyProductSystem32MyDLL.dll PID 12332
[…]
37687 ModuleA 12332 9576 18:27:29.064 LoadLibrary: Program FilesMyProductSystem32MyDLL.dll PID 12332
[…]
Related Patterns
Message Invariant
Adjoint Thread](https://image.slidesharecdn.com/accelerated-windows-software-trace-analysis-public-171020130114/85/Accelerated-Windows-Software-Trace-Analysis-training-public-slides-82-320.jpg)
![Linked Messages
© 2012 Software Diagnostics Services
Time
# PID TID Time Func Message
CreateProcess AppB.exe
CreateProcess AppA.exe
ImageLoad AppB.exe
ImageLoad AppC.exe
ImageLoad AppA.exe
CreateProcess AppC.exe
Related Patterns
Adjoint Thread
# PID Message
---------------------------------------------
[…]
128762 1260 CreateProcess: PPID 1260 PID 6356
[…]
128785 6356 ImageLoad: AppA.exe PID 6356
[…]
131137 6356 CreateProcess: PPID 6356 PID 6280
[…]
131239 6280 ImageLoad: AppB.exe PID 6280
[…]
132899 6356 CreateProcess: PPID 6356 PID 8144
[…]
132906 8144 ImageLoad: AppC.exe PID 8144
[…]](https://image.slidesharecdn.com/accelerated-windows-software-trace-analysis-public-171020130114/85/Accelerated-Windows-Software-Trace-Analysis-training-public-slides-83-320.jpg)
![Gossip ↓
© 2012 Software Diagnostics Services
Related Patterns
Adjoint Thread
Event Sequence Order
Message Interleave
# Module PID TID Message
[…]
26875 ModuleA 2172 5284 LoadImage: DeviceHarddiskVolume2WindowsSystem32notepad.exe PID 0x000000000000087C
26876 ModuleB 2172 5284 LoadImage: DeviceHarddiskVolume2WindowsSystem32notepad.exe, PID (2172)
26877 ModuleC 2172 5284 ImageLoad: fileName=notepad.exe, pid: 000000000000087C
[…]
# Module PID TID Message
[…]
26875 ModuleA 2172 5284 LoadImage: DeviceHarddiskVolume2WindowsSystem32notepad.exe PID 0×000000000000087C
[…]
33132 ModuleA 4180 2130 LoadImage: DeviceHarddiskVolume2WindowsSystem32calc.exe PID 0×0000000000001054
[…]](https://image.slidesharecdn.com/accelerated-windows-software-trace-analysis-public-171020130114/85/Accelerated-Windows-Software-Trace-Analysis-training-public-slides-84-320.jpg)


![Marked Messages
© 2012 Software Diagnostics Services
Related Patterns
Master Trace
No Activity
Annotated messages:
session database queries [+]
session initialization [-]
socket activity [+]
process A launched [+]
process B launched [-]
process A exited [-]
[+] activity is present in a trace
[-] activity is undetected or not present](https://image.slidesharecdn.com/accelerated-windows-software-trace-analysis-public-171020130114/85/Accelerated-Windows-Software-Trace-Analysis-training-public-slides-87-320.jpg)


![Macrofunction
© 2012 Software Diagnostics Services
# Module PID TID Time Message
------------------------------------------------------------
[…]
42582 DBClient 5492 9476 11:04:33.398 Opening connection
[…]
42585 DBClient 5492 9476 11:04:33.398 Sending SQL command
[…]
42589 DBServer 6480 10288 11:04:33.399 Executing SQL command
[…]
42592 DBClient 5492 9476 11:04:33.400 Closing connection
[…]](https://image.slidesharecdn.com/accelerated-windows-software-trace-analysis-public-171020130114/85/Accelerated-Windows-Software-Trace-Analysis-training-public-slides-92-320.jpg)
![Intra-Correlation
© 2012 Software Diagnostics Services
Handle: 00050586 Class: "Application A Class" Title: ""
Title changed at 15:52:4:3 to "Application A"
Title changed at 15:52:10:212 to "Application A - File1"
[…]
Process ID: 89c
Thread ID: d6c
[…]
Visible: true
Window placement command: SW_SHOWNORMAL
Placement changed at 15:54:57:506 to SW_SHOWMINIMIZED
Placement changed at 15:55:2:139 to SW_SHOWNORMAL
Foreground: false
Foreground changed at 15:52:4:3 to true
Foreground changed at 15:53:4:625 to false
Foreground changed at 15:53:42:564 to true
Foreground changed at 15:53:44:498 to false
Foreground changed at 15:53:44:498 to true
Foreground changed at 15:53:44:592 to false
Foreground changed at 15:53:45:887 to true
Foreground changed at 15:53:47:244 to false
Foreground changed at 15:53:47:244 to true
Foreground changed at 15:53:47:353 to false
Foreground changed at 15:54:26:416 to true
Foreground changed at 15:54:27:55 to false
Foreground changed at 15:54:27:55 to true
Foreground changed at 15:54:27:180 to false
[…]
Handle: 000D0540 Class: "App B" Title: "Application B"
[...]
Process ID: 3ac
Thread ID: bd4
[...]
Foreground: false
Foreground changed at 15:50:36:972 to true
Foreground changed at 15:50:53:732 to false
Foreground changed at 15:50:53:732 to true
Foreground changed at 15:50:53:826 to false
Foreground changed at 15:51:51:352 to true
Foreground changed at 15:51:53:941 to false
Foreground changed at 15:53:8:135 to true
Foreground changed at 15:53:8:182 to false
Foreground changed at 15:53:10:178 to true
Foreground changed at 15:53:13:938 to false
Foreground changed at 15:53:30:443 to true
Foreground changed at 15:53:31:20 to false
Foreground changed at 15:53:31:20 to true
Foreground changed at 15:53:31:129 to false
[…]
Related Patterns
Basic Facts
Activity Regions
WindowHistory WindowHistory64](https://image.slidesharecdn.com/accelerated-windows-software-trace-analysis-public-171020130114/85/Accelerated-Windows-Software-Trace-Analysis-training-public-slides-94-320.jpg)


![Bifurcation Point
© 2012 Software Diagnostics Services
Software Trace Diagrams
Time
# PID TID Time Message
# PID TID Message
----------------------------------
[…]
25 2768 3056 Trace Statement A
26 3756 2600 Trace Statement B
27 3756 2600 Trace Statement C
[…]
149 3756 836 Query result: X
150 3756 836 Trace Statement 150.1
151 3756 836 Trace Statement 151.1
152 3756 836 Trace Statement 152.1
153 3756 836 Trace Statement 153.1
[…]
# PID TID Message
-----------------------------------
[…]
27 2768 3056 Trace Statement A
28 3756 2176 Trace Statement B
29 3756 2176 Trace Statement C
[…]
151 3756 5940 Query result: Y
152 3756 5940 Trace Statement 152.2
153 3756 5940 Trace Statement 153.2
154 3756 5940 Trace Statement 154.2
155 3756 5940 Trace Statement 155.2
[…]](https://image.slidesharecdn.com/accelerated-windows-software-trace-analysis-public-171020130114/85/Accelerated-Windows-Software-Trace-Analysis-training-public-slides-97-320.jpg)


![Impossible Trace
© 2012 Software Diagnostics Services
# Module PID TID Message
-------------------------------
[…]
1001 ModuleA 202 404 foo: start
1002 ModuleA 202 404 foo: end
[…]
void foo()
{
TRACE("foo: start");
bar();
TRACE("foo: end");
}
void bar()
{
TRACE("bar: start");
// some code ...
TRACE("bar: end");
}
Related Patterns
Sparse Trace](https://image.slidesharecdn.com/accelerated-windows-software-trace-analysis-public-171020130114/85/Accelerated-Windows-Software-Trace-Analysis-training-public-slides-101-320.jpg)


Accelerated Windows Software Trace Analysis training public slides
- 1. Windows Software Trace Analysis Dmitry Vostokov Software Diagnostics Services
- 2. What’s it all About? General Trace Analysis Patterns Windows context © 2012 Software Diagnostics Services
- 3. Prerequisites Basic Windows troubleshooting © 2012 Software Diagnostics Services
- 4. Training Goals Review tracing fundamentals Learn trace analysis patterns Practice finding patterns in logs © 2012 Software Diagnostics Services
- 5. Training Principles Lots of pictures Pattern relationships Practical examples © 2012 Software Diagnostics Services
- 6. Schedule Summary Day 1 Trace Analysis Fundamentals Trace Analysis Patterns Day 2 Trace Analysis Patterns Examples © 2012 Software Diagnostics Services
- 7. Part 1: Fundamentals © 2012 Software Diagnostics Services
- 8. Basic Concepts © 2012 Software Diagnostics Services Software Trace (or Log) Process Thread Adjoint Thread Module (or Source) File Function Message (or Operation) Stack trace
- 9. Software Trace (Log) © 2012 Software Diagnostics Services A sequence of formatted messages Arranged by time A narrative story
- 10. Process © 2012 Software Diagnostics Services PID Session Image Name Modules (DLLs) Examples: svchost.exe notepad.exe PID 1 PID 2 PID 3 PID 4
- 11. Thread © 2012 Software Diagnostics Services TID CPU Context PID CPU 1 CPU 2 TID 1 TID 1 TID 2
- 12. Adjoint Thread © 2012 Software Diagnostics Services Debugging TV Frame 0x14
- 13. Exercise T0 © 2012 Software Diagnostics Services 1. Download Process Monitor 2. Trace system activity 3. Add more columns such as TID 4. Filter a thread based on TID 5. Reset filter 6. Filter an adjoint thread based on image name svchost.exe 7. Filter an adjoint thread based on PID
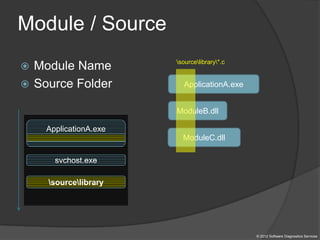
- 14. Module / Source © 2012 Software Diagnostics Services Module Name Source Folder ApplicationA.exe sourcelibrary svchost.exe ApplicationA.exe ModuleB.dll ModuleC.dll sourcelibrary*.c
- 15. File and Function © 2012 Software Diagnostics Services // MainApp.c foo () { trace(“foo: entry”); // do stuff trace(“foo: exit”); } MainApp.c MainApp.c: foo MainApp.c
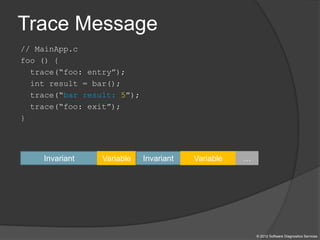
- 16. Trace Message © 2012 Software Diagnostics Services // MainApp.c foo () { trace(“foo: entry”); int result = bar(); trace(“bar result: 5”); trace(“foo: exit”); } Invariant Variable Invariant Variable …
- 17. Stack Trace © 2012 Software Diagnostics Services // MainApp.c main() { trace(“start”); foo(); } foo() { trace(“foo: entry”); bar(); } bar() { trace(“bar: entry”); // do stuff } bar: entry foo: entry start bar foo main foo main
- 18. Trace Recording Tools © 2012 Software Diagnostics Services Process Monitor MessageHistory CDFControl
- 19. Trace Analysis Tools © 2012 Software Diagnostics Services Process Monitor CDFControl CDFAnalyzer MS Office Excel
- 20. Minimal Trace Graphs © 2012 Software Diagnostics Services Time # PID TID Time Message No Module PID TID Date Time Message ----------------------------------------------------------- 1 ModuleA 4280 1736 5/28/2012 08:53:50.496 Trace message 1 2 ModuleB 6212 6216 5/28/2012 08:53:52.876 Trace message 2 […]
- 21. Trace Formats © 2012 Software Diagnostics Services ETW CDF CSV Free Mixed
- 22. Pattern-Driven Analysis Pattern: a common recurrent identifiable problem together with a set of recommendations and possible solutions to apply in a specific context Checklist: http://www.dumpanalysis.org/blog/index.php/2011/03/10/software- trace-analysis-checklist/ Patterns: http://www.dumpanalysis.org/blog/index.php/trace-analysis- patterns/ © 2012 Software Diagnostics Services Trace Collection Checklists Patterns Action
- 23. Pattern-Based Analysis © 2012 Software Diagnostics Services Software Trace New Pattern Discovery Pattern Catalog + Usage
- 24. Pattern Hierarchy © 2012 Software Diagnostics Services Domain Independent from IBM mainframes to mobile and embedded computers Domain Specific
- 25. Pattern Classification © 2012 Software Diagnostics Services Vocabulary Error Trace as a Whole Large Scale Activity Message Block Trace Set
- 26. Part 2: Individual Patterns © 2012 Software Diagnostics Services
- 27. Vocabulary Patterns © 2012 Software Diagnostics Services Basic Facts Vocabulary Index
- 28. Basic Facts © 2012 Software Diagnostics Services Problem Description Application disappears after launch Software Trace PID Message ----------------------------------- … 3f6 Create process AppA: PID 4a5 4a5 AppA loads DLLC … 3f6 Create process AppB: PID 5b8 5b8 AppB loads DLLD … Related Patterns Vocabulary Index
- 29. Basic Facts Taxonomy © 2012 Software Diagnostics Services Functional Facts Example: Expected a dialog to enter data Non-functional Facts Example: CPU consumption 100% Identification Facts Application name, PID, user name
- 30. Vocabulary Index © 2012 Software Diagnostics Services Related Patterns Basic Facts Activity Region Problem Description A user Test123 authentication failed basic fact index Narrowing:
- 31. Error Patterns © 2012 Software Diagnostics Services Error Message Exception Stack Trace False Positive Error Periodic Error ↓* Error Distribution * ‘↓’ sign means that a pattern involves time dependency
- 32. Error Message © 2012 Software Diagnostics Services Related Patterns False Positive Error Periodic Error Error Distribution Adjoint Thread Data Flow Explicit errors Implicit errors WinDbg command !error 0:000> !error c0000017 Error code: (NTSTATUS) 0xc0000017 (3221225495) - {Not Enough Quota} Not enough virtual memory or paging file quota is available to complete the specified operation. 0:000> !error 5 Error code: (Win32) 0x5 (5) - Access is denied.
- 33. Exception Stack Trace © 2012 Software Diagnostics Services No PID TID Message ------------------------ […] 265799 8984 4216 ComponentA.Store.GetData threw exception: ‘System.Reflection.TargetInvocationException: DCOM connection to server failed with error: ‘Exception from HRESULT: 0×842D0001′ —> System.Runtime.InteropServices.COMException (0×842D0001): Exception from HRESULT: 0×842D0001 265800 8984 4216 === Exception Stack Trace === 265801 8984 4216 at System.Runtime.Remoting.Proxies.RealProxy.HandleReturnMessage(IMessage reqMsg, IMessage retMsg) 265802 8984 4216 at System.Runtime.Remoting.Proxies.RealProxy.PrivateInvoke(MessageData& msgData, Int32 type) 265803 8984 4216 at ComponentA.Store.GetData(Byte[] pKey) 265804 8984 4216 at ComponentA.App.EnumBusinessObjects() […] Related Patterns Error Message
- 34. Periodic Error ↓ © 2012 Software Diagnostics Services Related Patterns Error Message Error Distribution False Positive Error Message Invariant No PID TID Message ----------------------- […] 36495 1788 2250 MyClass::Init: Cannot open connection “Client ID: 310″, status=5 […] […] 36883 1788 1986 MyClass::Init: Cannot open connection “Client ID: 612″, status=5 […] Time # PID TID Time Message
- 35. False Positive Error © 2012 Software Diagnostics Services Expected errors Not relevant to our problem Implementation details Related Patterns Error Message Master Trace Activity Region
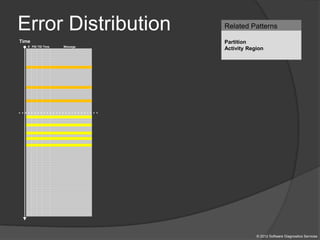
- 36. Error Distribution © 2012 Software Diagnostics Services Time # PID TID Time Message Related Patterns Partition Activity Region
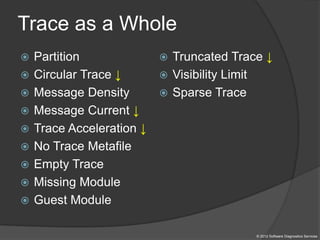
- 37. Trace as a Whole © 2012 Software Diagnostics Services Partition Circular Trace ↓ Message Density Message Current ↓ Trace Acceleration ↓ No Trace Metafile Empty Trace Missing Module Guest Module Truncated Trace ↓ Visibility Limit Sparse Trace
- 38. Partition © 2012 Software Diagnostics Services Related Patterns Significant Event Truncated Trace Adjoint Thread Tail Epilogue Head Time Prologue Core # PID TID Time Message
- 39. Circular Trace ↓ © 2012 Software Diagnostics Services Time # PID TID Time Message Problem Repro No Module PID TID Date Time Message --------------------------------------------------------------- 1 ModuleA 4280 1736 5/28/2009 08:53:50.496 Trace message 1 2 ModuleB 6212 6216 5/28/2009 08:53:52.876 Trace message 2 3 ModuleA 4280 4776 5/28/2009 08:54:13.537 Trace message 3 […] 3799 ModuleA 4280 3776 5/28/2009 09:15:00.853 Trace message 3799 3800 ModuleA 4280 1736 5/27/2009 09:42:12.029 Trace message 3800 […] 579210 ModuleA 4280 4776 5/28/2009 08:53:35.989 Trace message 579210 Related Patterns Focus of Tracing
- 40. Message Density © 2012 Software Diagnostics Services D1 > D2 Similar relative density for 2 traces may shows correlation: D11 / D21 = D12 / D22 For correlated messages different densities from 2 traces may show different partition or system conditions: D11 >> D12 Time # PID TID Time Message Related Patterns Intra-correlation Focus of Tracing Relative Density Partition
- 41. Message Current ↓ © 2012 Software Diagnostics Services J1 > J2 Time # PID TID Time Message Time # PID TID Time Message 10.100 10.200 10.100 12.100 Related Patterns Significant Event Activity Region Message Density
- 42. Trace Acceleration ↓ © 2012 Software Diagnostics Services Message current Ji < Jj, i < j < N Partial message currents: with respect to TID X Jk(TID=x) with respect to PID Y Jk(PID=y) with respect to PID X and TID Z Jk(PID=y & TID=z) Jj Jl JN Time Ji Jk Jm # PID TID Time Message Related Patterns Activity Region Message Current Thread of Activity Adjoint Thread of Activitiy
- 43. No Trace Metafile © 2012 Software Diagnostics Services # Module PID TID Time Message ------------------------------------------- […] 21372 dllA 2968 5476 3:55:10.004 Calling foo() 21373 Unknown 2968 5476 3:55:10.004 Unknown GUID=A1E38F24-613D-4D71-B9F5-… (No Format Information found). 21374 Unknown 2968 5476 3:55:10.004 Unknown GUID=A1E38F24-613D-4D71-B9F5-… (No Format Information found) 21375 Unknown 2968 5476 3:55:10.004 Unknown GUID=A1E38F24-613D-4D71-B9F5-… (No Format Information found) 21376 Unknown 2968 5476 3:55:10.004 Unknown GUID=A1E38F24-613D-4D71-B9F5-… (No Format Information found) 21377 Unknown 2968 5476 3:55:10.004 Unknown GUID=A1E38F24-613D-4D71-B9F5-… (No Format Information found) 21378 dllA 2968 5476 3:55:10.004 Calling bar() […] Possible patterns to detect: Circular Trace Message Density Message Current Discontinuity Time Delta Trace Acceleration Related Patterns Thread of Activity
- 44. Empty Trace © 2012 Software Diagnostics Services Related Patterns Truncated Trace No Activity Missing Module Small file size Very few trace messages Always open a trace before sending to someone else
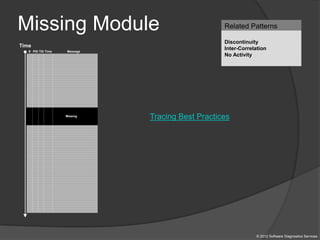
- 45. Missing Module © 2012 Software Diagnostics Services Related Patterns Discontinuity Inter-Correlation No Activity Time # PID TID Time Message Missing Tracing Best Practices
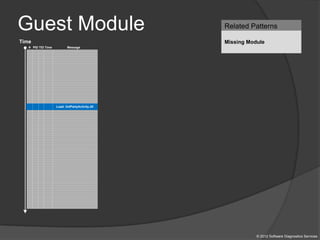
- 46. Guest Module © 2012 Software Diagnostics Services Related Patterns Missing ModuleTime # PID TID Time Message Load: 3rdPartyActivity.dll
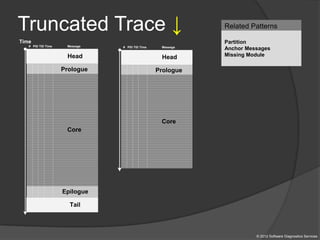
- 47. Truncated Trace ↓ © 2012 Software Diagnostics Services Tail Epilogue Head Time Prologue Core # PID TID Time Message Head Prologue Core # PID TID Time Message Related Patterns Partition Anchor Messages Missing Module
- 48. Visibility Limit © 2012 Software Diagnostics Services Time # PID TID Time Message r Related Patterns Truncated Trace Missing Module Sparse Trace
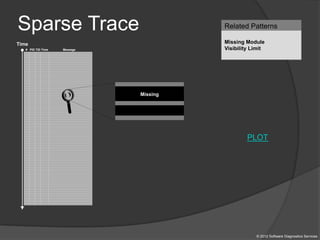
- 49. Sparse Trace © 2012 Software Diagnostics Services Related Patterns Missing Module Visibility Limit Time # PID TID Time Message Missing L PLOT
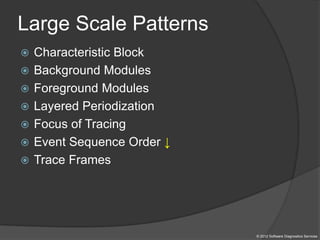
- 50. Large Scale Patterns © 2012 Software Diagnostics Services Characteristic Block Background Modules Foreground Modules Layered Periodization Focus of Tracing Event Sequence Order ↓ Trace Frames
- 51. Bird’s Eye Binary View © 2012 Software Diagnostics Services
- 52. Characteristic Block © 2012 Software Diagnostics Services Time # PID TID Time Message
- 53. Background Modules © 2012 Software Diagnostics Services Background: Foreground: Related Patterns Foreground ModulesTime # PID TID Time Message
- 54. Foreground Modules © 2012 Software Diagnostics Services Time # PID TID Time Message Time # PID TID Time Message Related Patterns Background Modules Module Foregrounding
- 55. Layered Periodization © 2012 Software Diagnostics Services Time # PID TID Time Message Time # PID TID Time Message Time # PID TID Time Message
- 56. Focus of Tracing © 2012 Software Diagnostics Services Activity regions: Jm1, Jm2, Jm3 Related Patterns Activity RegionTime Jm1 Jm2 Jm3 # PID TID Time Message
- 57. Event Sequence Order ↓ © 2012 Software Diagnostics Services Synchronization Race Conditions Deadlock Related Patterns Significant Event Anchor Messages Time # PID TID Time Message E1 E2 E3 E4 E5 Time # PID TID Time Message E2 E3 E4 E5 E1
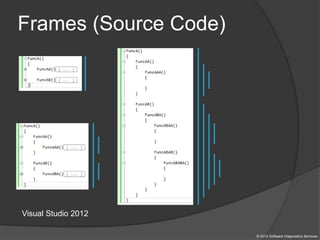
- 58. Frames (Source Code) © 2012 Software Diagnostics Services Visual Studio 2012
- 59. Trace Frames © 2012 Software Diagnostics Services Related Patterns Thread of Activity Adjoint Thread Truncated Trace Discontinuity Time # PID TID Time Message
- 60. Activity Patterns © 2012 Software Diagnostics Services Thread of Activity ↓ Adjoint Thread of Activity ↓ No Activity Activity Region Discontinuity ↓ Time Delta ↓ Glued Activity Break-in Activity ↓ Resume Activity ↓ Data Flow ↓
- 61. Thread of Activity ↓ © 2012 Software Diagnostics Services Related Patterns Discontinuity Sparse Trace Time # PID TID Time Func Message # PID TID Time Func Message
- 62. Adjoint Thread of Activity ↓ © 2012 Software Diagnostics Services Related Patterns Thread of Activity Message Invariant Time # PID TID Time Func Message Time # PID TID Time Func Message
- 63. No Activity © 2012 Software Diagnostics Services Related Patterns Discontinuity Sparse Trace Missing Module Time # PID TID Time Message We expect this process Causes: hang, wait chain, deadlock, terminated threads, CPU loop
- 64. Activity Region © 2012 Software Diagnostics Services Message current : Jm2 > max (Jm1,Jm3) Time Jm1 Jm2 Jm3 # PID TID Time Message Related Patterns Message Current Characteristic Block
- 65. Discontinuity ↓ © 2012 Software Diagnostics Services Time # PID TID Time Message Time # PID TID Time Message Related Patterns Thread of Activity Missing Module Sparse Trace Possible causes: Blocked thread, IPC response delay, wait chains, long computation
- 66. Time Delta ↓ © 2012 Software Diagnostics Services Related Patterns Basic Facts Thread of Activity Discontinuity Significant Event # Module PID TID Time File Function Message --------------------------------------------------------------------------------------------------- 6060 dllA 1604 7108 10:06:21.746 fileA.c DllMain DLL_PROCESS_ATTACH 24480 dllA 1604 7108 10:06:32.262 fileA.c LaunchApp Exec Path: C:Program FilesCompanyAappB.exe 30 seconds of discontinuity till the end of full trace Time # PID TID Time Message
- 67. Glued Activity © 2012 Software Diagnostics Services ATID: Adjoint Thread ID ImageA ATID 2 ImageB ATID 3 Time # ATID TID Time Message Related Patterns Adjoint Thread Time Trace Session 1 # PID TID Time Message Trace Session 2
- 68. Break-in Activity ↓ © 2012 Software Diagnostics Services Related Patterns Thread of Activity Adjoint Thread Discontinuity Resume Activity Time # PID TID Time Message Discontinuity
- 69. Resume Activity ↓ © 2012 Software Diagnostics Services Related Patterns Break-in Activity Thread of Activity Adjoint Thread Time # PID TID Time Message Discontinuity
- 70. Data Flow ↓ © 2012 Software Diagnostics Services # PID TID Time Message Time Related Patterns Adjoint Thread Message Invariant […] DriverA: Device 0xA IRP 0xB […] DriverB: Device 0xC IRP 0xB […] DriverC: Device 0xD IRP 0xB DriverC: Processing IRP 0xB […]
- 71. Message Patterns © 2012 Software Diagnostics Services Significant Event Defamiliarizing Effect Anchor Messages Diegetic Messages Message Change ↓ Message Invariant UI Message Original Message Implementation Discourse Opposition Messages Linked Messages Gossip ↓ Counter Value Message Context Marked Messages Incomplete History Message Interleave Fiber Bundle
- 72. Significant Event © 2012 Software Diagnostics Services Related Patterns Exception Stack Trace Error Message Basic Facts Vocabulary Index Time # PID TID Time Message
- 73. © 2012 Software Diagnostics Services Poetry of Software Traces “Capturing delicate moments, one gives birth to a poetry of traces …” Ange Leccia, Motionless Journeys, by Fabien Danesi
- 74. Defamiliarizing Effect © 2012 Software Diagnostics Services Time # PID TID Time Message Time # PID TID Time Message Related Patterns Characteristic Block Activity Region
- 75. Anchor Messages © 2012 Software Diagnostics Services Related Patterns Vocabulary Index Adjoint Thread Message Interleave Time # PID TID Time Message # PID TID Time Message ---------------------------------------------------------- 24226 2656 3480 10:41:05.774 AppA.exe: DLL_PROCESS_ATTACH 108813 4288 4072 10:41:05.774 AppB.exe: DLL_PROCESS_ATTACH 112246 4180 3836 10:41:05.940 DllHost.exe: DLL_PROCESS_ATTACH 135473 2040 3296 10:41:12.615 AppC.exe: DLL_PROCESS_ATTACH 694723 1112 1992 10:44:23.393 AppD.exe: DLL_PROCESS_ATTACH 703962 5020 1080 10:44:42.014 DllHost.exe: DLL_PROCESS_ATTACH 705511 4680 3564 10:44:42.197 DllHost.exe: DLL_PROCESS_ATTACH 705891 1528 2592 10:44:42.307 regedit.exe: DLL_PROCESS_ATTACH 785231 2992 4912 10:45:26.516 AppE.exe: DLL_PROCESS_ATTACH 786523 3984 1156 10:45:26.605 powershell.exe: DLL_PROCESS_ATTACH 817979 4188 4336 10:45:48.707 wermgr.exe: DLL_PROCESS_ATTACH 834875 3976 1512 10:45:52.342 LogonUI.exe: DLL_PROCESS_ATTACH 835229 4116 3540 10:45:52.420 AppG.exe: DLL_PROCESS_ATTACH
- 76. Message Interleave © 2012 Software Diagnostics Services Related Patterns Adjoint Thread Anchor Messages Time # PID TID Time Message
- 77. Diegetic Messages © 2012 Software Diagnostics Services Time # PID TID Time Func Message Process PID 234 is OK Status OK Status OK Status OK Related Patterns Anchor Messages
- 78. Message Change ↓ © 2012 Software Diagnostics Services Related Patterns Anchor Messages Message Invariant Adjoint Thread Status = 0x0 Time # PID TID Time Message Status = 0x0 Status = 0x0 Status = 0xc0000017 Status = 0xc0000017 Status = 0xc0000017
- 79. Implementation Discourse © 2012 Software Diagnostics Services Win32 API MFC Kernel Development COM C# / .NET C++ Java …
- 80. Message Invariant © 2012 Software Diagnostics Services # Module PID TID Time Message ------------------------------------------------------------------------------------------- […] 2782 ModuleA 2124 5648 10:58:03.356 CreateObject: pObject 0×00A83D30 data ([…]) version 0×4 […] # Module PID TID Time Message ------------------------------------------------------------------------------------------- […] 4793 ModuleA 2376 8480 09:22:01.947 CreateObject: pObject 0×00BA4E20 data ([…]) version 0×5 […] Related Patterns Trace Set
- 81. UI Message © 2012 Software Diagnostics Services Related Patterns Activity Region Significant Event Thread of Activity Adjoint Thread # Module PID TID Time Message -------------------------------------------------------------------------------- […] 2782 ModuleA 2124 5648 10:58:03.356 CreateWindow: Title "..." Class "..." […] 3512 ModuleA 2124 5648 10:58:08.154 Menu command: Save Data […] 3583 ModuleA 2124 5648 10:58:08.155 CreateWindow: Title "Save As" Class "Dialog" [... Data update and replication related messages ...] 4483 ModuleA 2124 5648 10:58:12.342 DestroyWindow: Title "Save As" Class "Dialog" […] # Module PID TID Time Message -------------------------------------------------------------------------------- […] 2782 ModuleA 2124 5648 10:58:03.356 CreateWindow: Title "..." Class "..." 3512 ModuleA 2124 5648 10:58:08.154 Menu command: Save Data 3583 ModuleA 2124 5648 10:58:08.155 CreateWindow: Title "Save As" Class "Dialog" 4483 ModuleA 2124 5648 10:58:12.342 DestroyWindow: Title "Save As" Class "Dialog" […]
- 82. Original Message © 2012 Software Diagnostics Services # Module PID TID Time Message --------------------------------------------------------------------------------------------------------- […] 35835 ModuleA 12332 11640 18:27:28.720 LoadLibrary: Program FilesMyProductSystem32MyDLL.dll PID 12332 […] 37684 ModuleA 12332 9576 18:27:29.063 LoadLibrary: Program FilesMyProductSystem32MyDLL.dll PID 12332 […] 37687 ModuleA 12332 9576 18:27:29.064 LoadLibrary: Program FilesMyProductSystem32MyDLL.dll PID 12332 […] Related Patterns Message Invariant Adjoint Thread
- 83. Linked Messages © 2012 Software Diagnostics Services Time # PID TID Time Func Message CreateProcess AppB.exe CreateProcess AppA.exe ImageLoad AppB.exe ImageLoad AppC.exe ImageLoad AppA.exe CreateProcess AppC.exe Related Patterns Adjoint Thread # PID Message --------------------------------------------- […] 128762 1260 CreateProcess: PPID 1260 PID 6356 […] 128785 6356 ImageLoad: AppA.exe PID 6356 […] 131137 6356 CreateProcess: PPID 6356 PID 6280 […] 131239 6280 ImageLoad: AppB.exe PID 6280 […] 132899 6356 CreateProcess: PPID 6356 PID 8144 […] 132906 8144 ImageLoad: AppC.exe PID 8144 […]
- 84. Gossip ↓ © 2012 Software Diagnostics Services Related Patterns Adjoint Thread Event Sequence Order Message Interleave # Module PID TID Message […] 26875 ModuleA 2172 5284 LoadImage: DeviceHarddiskVolume2WindowsSystem32notepad.exe PID 0x000000000000087C 26876 ModuleB 2172 5284 LoadImage: DeviceHarddiskVolume2WindowsSystem32notepad.exe, PID (2172) 26877 ModuleC 2172 5284 ImageLoad: fileName=notepad.exe, pid: 000000000000087C […] # Module PID TID Message […] 26875 ModuleA 2172 5284 LoadImage: DeviceHarddiskVolume2WindowsSystem32notepad.exe PID 0×000000000000087C […] 33132 ModuleA 4180 2130 LoadImage: DeviceHarddiskVolume2WindowsSystem32calc.exe PID 0×0000000000001054 […]
- 85. Counter Value © 2012 Software Diagnostics Services Module Variable 18:04:06 Explorer.EXE 3280 User Time: 8.4864544 seconds, Kernel Time: 9.5004609 seconds, Private Bytes: 42,311,680, Working Set: 10,530,816 Related Patterns Adjoint Thread Significant Event Activity Region Focus of Tracing Characteristic Message Block Performance-specific patterns: Global Monotonicity Constant Value
- 86. Message Context © 2012 Software Diagnostics Services Related Patterns Significant Event Anchor Message Time # PID TID Time Message Context <- Message
- 87. Marked Messages © 2012 Software Diagnostics Services Related Patterns Master Trace No Activity Annotated messages: session database queries [+] session initialization [-] socket activity [+] process A launched [+] process B launched [-] process A exited [-] [+] activity is present in a trace [-] activity is undetected or not present
- 88. Fiber Bundle © 2012 Software Diagnostics Services I/O stack Thread stack trace Trace messages Related Patterns Exception Stack Trace
- 89. Incomplete History © 2012 Software Diagnostics Services Related Patterns Opposition Messages Sparse Trace Truncated Trace Master Trace Code: Response-complete Exception-complete Call-complete
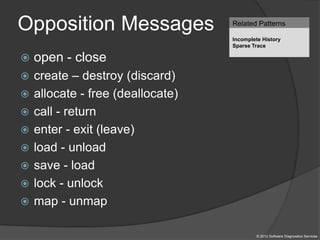
- 90. Opposition Messages © 2012 Software Diagnostics Services open - close create – destroy (discard) allocate - free (deallocate) call - return enter - exit (leave) load - unload save - load lock - unlock map - unmap Related Patterns Incomplete History Sparse Trace
- 91. Block Patterns © 2012 Software Diagnostics Services Macrofunction Periodic Message Block Intra-Correlation
- 92. Macrofunction © 2012 Software Diagnostics Services # Module PID TID Time Message ------------------------------------------------------------ […] 42582 DBClient 5492 9476 11:04:33.398 Opening connection […] 42585 DBClient 5492 9476 11:04:33.398 Sending SQL command […] 42589 DBServer 6480 10288 11:04:33.399 Executing SQL command […] 42592 DBClient 5492 9476 11:04:33.400 Closing connection […]
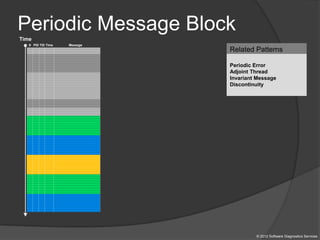
- 93. Periodic Message Block © 2012 Software Diagnostics Services Related Patterns Periodic Error Adjoint Thread Invariant Message Discontinuity Time # PID TID Time Message
- 94. Intra-Correlation © 2012 Software Diagnostics Services Handle: 00050586 Class: "Application A Class" Title: "" Title changed at 15:52:4:3 to "Application A" Title changed at 15:52:10:212 to "Application A - File1" […] Process ID: 89c Thread ID: d6c […] Visible: true Window placement command: SW_SHOWNORMAL Placement changed at 15:54:57:506 to SW_SHOWMINIMIZED Placement changed at 15:55:2:139 to SW_SHOWNORMAL Foreground: false Foreground changed at 15:52:4:3 to true Foreground changed at 15:53:4:625 to false Foreground changed at 15:53:42:564 to true Foreground changed at 15:53:44:498 to false Foreground changed at 15:53:44:498 to true Foreground changed at 15:53:44:592 to false Foreground changed at 15:53:45:887 to true Foreground changed at 15:53:47:244 to false Foreground changed at 15:53:47:244 to true Foreground changed at 15:53:47:353 to false Foreground changed at 15:54:26:416 to true Foreground changed at 15:54:27:55 to false Foreground changed at 15:54:27:55 to true Foreground changed at 15:54:27:180 to false […] Handle: 000D0540 Class: "App B" Title: "Application B" [...] Process ID: 3ac Thread ID: bd4 [...] Foreground: false Foreground changed at 15:50:36:972 to true Foreground changed at 15:50:53:732 to false Foreground changed at 15:50:53:732 to true Foreground changed at 15:50:53:826 to false Foreground changed at 15:51:51:352 to true Foreground changed at 15:51:53:941 to false Foreground changed at 15:53:8:135 to true Foreground changed at 15:53:8:182 to false Foreground changed at 15:53:10:178 to true Foreground changed at 15:53:13:938 to false Foreground changed at 15:53:30:443 to true Foreground changed at 15:53:31:20 to false Foreground changed at 15:53:31:20 to true Foreground changed at 15:53:31:129 to false […] Related Patterns Basic Facts Activity Regions WindowHistory WindowHistory64
- 95. Trace Set Patterns © 2012 Software Diagnostics Services Master Trace Bifurcation Point Inter-Correlation Relative Density News Value Impossible Trace Split Trace
- 96. Master Trace © 2012 Software Diagnostics Services Related Patterns Activity Regions Background Modules Foreground Modules Event Sequence Order Guest Module Implementation Discourse Bifurcation Point
- 97. Bifurcation Point © 2012 Software Diagnostics Services Software Trace Diagrams Time # PID TID Time Message # PID TID Message ---------------------------------- […] 25 2768 3056 Trace Statement A 26 3756 2600 Trace Statement B 27 3756 2600 Trace Statement C […] 149 3756 836 Query result: X 150 3756 836 Trace Statement 150.1 151 3756 836 Trace Statement 151.1 152 3756 836 Trace Statement 152.1 153 3756 836 Trace Statement 153.1 […] # PID TID Message ----------------------------------- […] 27 2768 3056 Trace Statement A 28 3756 2176 Trace Statement B 29 3756 2176 Trace Statement C […] 151 3756 5940 Query result: Y 152 3756 5940 Trace Statement 152.2 153 3756 5940 Trace Statement 153.2 154 3756 5940 Trace Statement 154.2 155 3756 5940 Trace Statement 155.2 […]
- 98. Inter-Correlation © 2012 Software Diagnostics Services System Tracing Tool Tracing Tool Trace File Trace File Related Patterns Intra-Correlation Basic Facts Discontinuity Sparse Trace
- 99. Relative Density © 2012 Software Diagnostics Services # PID TID Time Message Time # PID TID Time Message Time 1 / 1 3 / 1 Related Patterns Message Density
- 100. News Value © 2012 Software Diagnostics Services Related Patterns Inter-Correlation Basic Facts Master Trace 1 2 3 4 Time
- 101. Impossible Trace © 2012 Software Diagnostics Services # Module PID TID Message ------------------------------- […] 1001 ModuleA 202 404 foo: start 1002 ModuleA 202 404 foo: end […] void foo() { TRACE("foo: start"); bar(); TRACE("foo: end"); } void bar() { TRACE("bar: start"); // some code ... TRACE("bar: end"); } Related Patterns Sparse Trace
- 102. Split Trace © 2012 Software Diagnostics Services Time # PID TID Time Message # PID TID Time Message # PID TID Time Message Related Patterns Circular Trace
- 103. 12.12.12 © 2012 Software Diagnostics Services Related Patterns Adjoint Thread Discontinuity Time Delta Periodic Message Block MM=DD=YY
- 104. Part 3: Practice Exercises © 2012 Software Diagnostics Services
- 105. Links Not included in Public Preview version © 2012 Software Diagnostics Services
- 106. Process Monitor Examples Exercises T1-T6 © 2012 Software Diagnostics Services
- 107. Exercise T1 Goal: Learn how to identify application crashes Patterns: Background Modules, Adjoint Thread of Activity, Discontinuity, Guest Module, Fiber Bundle © 2012 Software Diagnostics Services
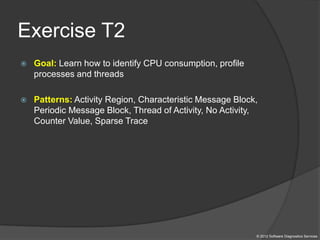
- 108. Exercise T2 © 2012 Software Diagnostics Services Goal: Learn how to identify CPU consumption, profile processes and threads Patterns: Activity Region, Characteristic Message Block, Periodic Message Block, Thread of Activity, No Activity, Counter Value, Sparse Trace
- 109. Exercise T3 © 2012 Software Diagnostics Services Goal: Learn how to calculate message current and density Patterns: Activity Region, Thread of Activity, Time Delta, Message Current, Message Density, Relative Density
- 110. Exercise T4 © 2012 Software Diagnostics Services Goal: Learn how to compare software traces Patterns: Master Trace, Characteristic Message Block, Bifurcation Point
- 111. Exercise T5 © 2012 Software Diagnostics Services Goal: Learn process startup sequence for terminal services session Patterns: Adjoint Thread of Activity, Anchor Messages, Message Interleave
- 112. Exercise T6 © 2012 Software Diagnostics Services Goal: Learn how to work with split traces Patterns: Split Trace, Adjoint Thread of Activity, Fiber Bundle
- 113. Using Excel for Analysis Debugging TV Frame 0x15 © 2012 Software Diagnostics Services
- 114. Resources TraceAnalysis.org Windows Internals, 6th ed. Inside Windows Debugging Introduction to Pattern-Driven Software Problem Solving Software Trace and Memory Dump Analysis Software Narratology: An Applied Science of Software Stories Introduction to Pattern-Driven Software Diagnostics Systemic Software Diagnostics Debugging TV Memory Dump Analysis Anthology (volumes 3, 4, 5, 6) © 2012 Software Diagnostics Services
- 115. Q&A Please send your feedback using the contact form on DumpAnalysis.com © 2012 Software Diagnostics Services
- 116. Thank you for attendance! © 2012 Software Diagnostics Services