Agg framework selectgroup feb2015 v2
Download as PPTX, PDF20 likes11,636 views

The document provides an overview of the aggregation framework in MongoDB, detailing its capabilities for data analytics such as grouping, filtering, and transforming documents through various pipeline operators. It showcases practical applications using U.S. census data, presenting examples of how to calculate population density and analyze population changes over time. Specific MongoDB commands and functionalities are highlighted, including the use of $match, $group, $unwind, and $project to manipulate and visualize data effectively.


![Document Model
{ "_id" : ObjectId("54e23c7b28099359f5661525"),
"name" : "California",
"region" : "West",
"data" : [
{"totalPop" : 33871648,
"totalHouse" : 12214549,
"occHouse" : 11502870,
"year" : 2000},
{"totalPop" : 37253956,
"totalHouse" : 13680081,
"occHouse" : 12577498,
"year" : 2010},
{"totalPop" : 29760021,
"totalHouse" : 11182882,
"occHouse" : 29008161,
"year" : 1990}
],
…
}](https://image.slidesharecdn.com/aggframework-selectgroupfeb2015v2-150218124530-conversion-gate01/85/Agg-framework-selectgroup-feb2015-v2-14-320.jpg)

![Total US Area
db.cData.aggregate([
{"$group" : {"_id" : null,
"totalArea" : {$sum : "$areaM"},
"avgArea" : {$avg : "$areaM"}}}])](https://image.slidesharecdn.com/aggframework-selectgroupfeb2015v2-150218124530-conversion-gate01/85/Agg-framework-selectgroup-feb2015-v2-16-320.jpg)

![Area By Region
db.cData.aggregate([
{"$group" : {"_id" : "$region",
"totalArea" : {$sum : "$areaM"},
"avgArea" : {$avg : "$areaM"},
"numStates" : {$sum : 1},
"states" : {$push : "$name"}}}
])](https://image.slidesharecdn.com/aggframework-selectgroupfeb2015v2-150218124530-conversion-gate01/85/Agg-framework-selectgroup-feb2015-v2-18-320.jpg)


![Total US Population By Year
db.cData.aggregate(
[{$unwind : "$data"},
{$group : {"_id" : "$data.year",
"totalPop" : {$sum : "$data.totalPop"}}},
{$sort : {"totalPop" : 1}}
])](https://image.slidesharecdn.com/aggframework-selectgroupfeb2015v2-150218124530-conversion-gate01/85/Agg-framework-selectgroup-feb2015-v2-21-320.jpg)

![$unwind
{ $unwind: $census }
{ state: “New York,
census: 1990}
{
state: ”New York",
census: [1990, 2000,
2010]
}
{
state: ”New Jersey",
census: [1990, 2000]
}
{
state: “California",
census: [1980, 1990,
2000, 2010]
}
{
state: ”Delaware",
census: [1990, 2000]
}
{ state: “New York,
census: 2000}
{ state: “New York,
census: 2010}
{ state: “New Jersey,
census: 1990}
{ state: “New Jersey,
census: 2000}
…](https://image.slidesharecdn.com/aggframework-selectgroupfeb2015v2-150218124530-conversion-gate01/85/Agg-framework-selectgroup-feb2015-v2-23-320.jpg)
![Southern State Population By Year
db.cData.aggregate(
[{$match : {"region" : "South"}},
{$unwind : "$data"},
{$group : {"_id" : "$data.year",
"totalPop” : {"$sum” :
"$data.totalPop"}}}])](https://image.slidesharecdn.com/aggframework-selectgroupfeb2015v2-150218124530-conversion-gate01/85/Agg-framework-selectgroup-feb2015-v2-24-320.jpg)


![Population Delta By State from 1990 to 2010
db.cData.aggregate(
[{$unwind : "$data"},
{$sort : {"data.year" : 1}},
{$group : {"_id" : "$name",
"pop1990" : {"$first" : "$data.totalPop"},
"pop2010" : {"$last" : "$data.totalPop"}}},
{$project : {"_id" : 0,
"name" : "$_id",
"delta" : {"$subtract" :
["$pop2010", "$pop1990"]},
"pop1990" : 1,
"pop2010” : 1}
}]
)](https://image.slidesharecdn.com/aggframework-selectgroupfeb2015v2-150218124530-conversion-gate01/85/Agg-framework-selectgroup-feb2015-v2-27-320.jpg)
![Population Delta By State from 1990 to 2010
db.cData.aggregate(
[{$unwind : "$data"},
{$sort : {"data.year" : 1}},
{$group : {"_id" : "$name",
"pop1990" : {"$first" : "$data.totalPop"},
"pop2010" : {"$last" : "$data.totalPop"}}},
{$project : {"_id" : 0,
"name" : "$_id",
"delta" : {"$subtract" :
["$pop2010", "$pop1990"]},
"pop1990" : 1,
"pop2010” : 1}
}]
)](https://image.slidesharecdn.com/aggframework-selectgroupfeb2015v2-150218124530-conversion-gate01/85/Agg-framework-selectgroup-feb2015-v2-28-320.jpg)
![Population Delta By State from 1990 to 2010
db.cData.aggregate(
[{$unwind : "$data"},
{$sort : {"data.year" : 1}},
{$group : {"_id" : "$name",
"pop1990" : {"$first" : "$data.totalPop"},
"pop2010" : {"$last" : "$data.totalPop"}}},
{$project : {"_id" : 0,
"name" : "$_id",
"delta" : {"$subtract" :
["$pop2010", "$pop1990"]},
"pop1990" : 1,
"pop2010” : 1}
}]
)](https://image.slidesharecdn.com/aggframework-selectgroupfeb2015v2-150218124530-conversion-gate01/85/Agg-framework-selectgroup-feb2015-v2-30-320.jpg)

![Population Delta By State from 1990 to 2010
db.cData.aggregate(
[{$unwind : "$data"},
{$sort : {"data.year" : 1}},
{$group : {"_id" : "$name",
"pop1990" : {"$first" : "$data.totalPop"},
"pop2010" : {"$last" : "$data.totalPop"}}},
{$project : {"_id" : 0,
"name" : "$_id",
"delta" : {"$subtract" :
["$pop2010", "$pop1990"]},
"pop1990" : 1,
"pop2010” : 1}
}]
)](https://image.slidesharecdn.com/aggframework-selectgroupfeb2015v2-150218124530-conversion-gate01/85/Agg-framework-selectgroup-feb2015-v2-32-320.jpg)


![{
”name" : “South Dakota”,
”delta" : 118176
}
Renaming and Computing Fields
{ $project:
{ “_id” : 0,
“pop1990” : 0,
“pop2010” : 0,
“name” : “$_id”,
"delta" :
{"$subtract" :
["$pop2010",
"$pop1990"]}}
}
{
"_id" : "Virginia”,
"pop1990" : 6187358,
"pop2010" : 8001024
}
{
"_id" : "South Dakota",
"pop1990" : 696004,
"pop2010" : 814180
}
{
”name" : “Virginia”,
”delta" : 1813666
}](https://image.slidesharecdn.com/aggframework-selectgroupfeb2015v2-150218124530-conversion-gate01/85/Agg-framework-selectgroup-feb2015-v2-35-320.jpg)

![Compare number of people living within
500KM of Memphis, TN in 1990, 2000, 2010
db.cData.aggregate([
{$geoNear : {
"near" : {"type" : "Point", "coordinates" : [90, 35]},
“distanceField” : "dist.calculated",
“maxDistance” : 500000,
“includeLocs” : "dist.location",
“spherical” : true }},
{$unwind : "$data"},
{$group : {"_id" : "$data.year",
"totalPop" : {"$sum" : "$data.totalPop"},
"states" : {"$addToSet" : "$name"}}},
{$sort : {"_id" : 1}}
])](https://image.slidesharecdn.com/aggframework-selectgroupfeb2015v2-150218124530-conversion-gate01/85/Agg-framework-selectgroup-feb2015-v2-37-320.jpg)

![{
"_id" : ”Tennessee",
"pop1990" : 4877185,
"pop2010" : 6346105,
“center” :
{“type” : “Point”,
“coordinates” :
[86.6, 37.8]}
}
{
"_id" : "Virginia”,
"pop1990" : 6187358,
"pop2010" : 8001024,
“center” :
{“type” : “Point”,
“coordinates” :
[78.6, 37.5]}
}
$geoNear
{$geoNear : {
"near”: {"type”: "Point",
"coordinates”:
[90, 35]},
maxDistance : 500000,
spherical : true }}
{
"_id" : ”Tennessee",
"pop1990" : 4877185,
"pop2010" : 6346105,
“center” :
{“type” : “Point”,
“coordinates” :
[86.6, 37.8]}
}](https://image.slidesharecdn.com/aggframework-selectgroupfeb2015v2-150218124530-conversion-gate01/85/Agg-framework-selectgroup-feb2015-v2-39-320.jpg)
![What if I want to save the results to a
collection?
db.cData.aggregate([
{$geoNear : {
"near" : {"type" : "Point", "coordinates" : [90, 35]},
“distanceField” : "dist.calculated",
“maxDistance” : 500000,
“includeLocs” : "dist.location",
“spherical” : true }},
{$unwind : "$data"},
{$group : {"_id" : "$data.year",
"totalPop" : {"$sum" : "$data.totalPop"},
"states" : {"$addToSet" : "$name"}}},
{$sort : {"_id" : 1}},
{$out : “peopleNearMemphis”}
])](https://image.slidesharecdn.com/aggframework-selectgroupfeb2015v2-150218124530-conversion-gate01/85/Agg-framework-selectgroup-feb2015-v2-40-320.jpg)
![$out
db.cData.aggregate([<pipeline stages>,
{“$out” : “resultsCollection”}])
• Save aggregation results to a new collection
• New aggregation uses:
• Transform documents - ETL](https://image.slidesharecdn.com/aggframework-selectgroupfeb2015v2-150218124530-conversion-gate01/85/Agg-framework-selectgroup-feb2015-v2-41-320.jpg)

![Division with Fastest Growing Pop Density
db.cData.aggregate(
[{$match : {"data.totalPop" : {"$gt" : 1000000}}},
{$unwind : "$data"},
{$sort : {"data.year" : 1}},
{$group : {"_id" : "$name",
"pop1990" : {"$first" : "$data.totalPop"},
"pop2010" : {"$last" : "$data.totalPop"},
"areaM" : {"$first" : "$areaM"},
"division" : {"$first" : "$division"}}},
{$group : {"_id" : "$division",
"totalPop1990" : {"$sum" : "$pop1990"},
"totalPop2010" : {"$sum" : "$pop2010"},
"totalAreaM" : {"$sum" : "$areaM"}}},
{$match : {"totalAreaM" : {"$gt" : 100000}}},
{$project : {"_id" : 0,
"division" : "$_id",
"density1990" : {"$divide" : ["$totalPop1990", "$totalAreaM"]},
"density2010" : {"$divide" : ["$totalPop2010", "$totalAreaM"]},
"denDelta" : {"$subtract" : [{"$divide" : ["$totalPop2010",
"$totalAreaM"]},
{"$divide" : ["$totalPop1990”,
"$totalAreaM"]}]},
"totalAreaM" : 1,
"totalPop1990" : 1,
"totalPop2010" : 1}},
{$sort : {"denDelta" : -1}}])](https://image.slidesharecdn.com/aggframework-selectgroupfeb2015v2-150218124530-conversion-gate01/85/Agg-framework-selectgroup-feb2015-v2-43-320.jpg)

![Aggregate options
db.cData.aggregate([<pipeline stages>],
{‘explain’ : false
'allowDiskUse' : true,
'cursor' : {'batchSize' : 5}})
explain – similar to find().explain()
allowDiskUse – enable use of disk to store intermediate
results
cursor – specify the size of the initial result](https://image.slidesharecdn.com/aggframework-selectgroupfeb2015v2-150218124530-conversion-gate01/85/Agg-framework-selectgroup-feb2015-v2-45-320.jpg)


Agg framework selectgroup feb2015 v2
- 1. Exploring the Aggregation Framework Jay Runkel Solutions Architect [email protected] @jayrunkel
- 2. Agenda 1. Analytics in MongoDB? 2. Aggregation Framework 3. Aggregation Framework in Action – US Census Data 4. Aggregation Framework Options
- 3. Analytics in MongoDB? Create Read Update Delete Analytics ? Group Count Derive Values Filter Average Sort
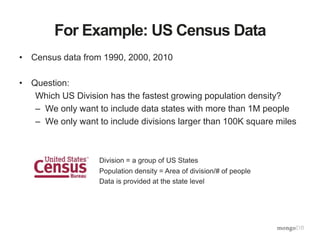
- 4. For Example: US Census Data • Census data from 1990, 2000, 2010 • Question: Which US Division has the fastest growing population density? – We only want to include data states with more than 1M people – We only want to include divisions larger than 100K square miles Division = a group of US States Population density = Area of division/# of people Data is provided at the state level
- 5. US Regions and Divisions
- 6. How would we solve this in SQL? • SELECT GROUP BY HAVING
- 9. What is an Aggregation Pipeline? • A Series of Document Transformations – Executed in stages – Original input is a collection – Output as a cursor or a collection • Rich Library of Functions – Filter, compute, group, and summarize data – Output of one stage sent to input of next – Operations executed in sequential order
- 11. Pipeline Operators • $match Filter documents • $project Reshape documents • $group Summarize documents • $unwind Expand documents • $sort Order documents • $limit/$skip Paginate documents • $redact Restrict documents • $geoNear Proximity sort documents • $let,$map Define variables
- 12. Aggregation Framework in Action (let’s play with the census data)
- 13. MongoDB State Collection • Document For Each State • Name • Region • Division • Census Data For 1990, 2000, 2010 – Population – Housing Units – Occupied Housing Units • Census Data is an array with three subdocuments
- 14. Document Model { "_id" : ObjectId("54e23c7b28099359f5661525"), "name" : "California", "region" : "West", "data" : [ {"totalPop" : 33871648, "totalHouse" : 12214549, "occHouse" : 11502870, "year" : 2000}, {"totalPop" : 37253956, "totalHouse" : 13680081, "occHouse" : 12577498, "year" : 2010}, {"totalPop" : 29760021, "totalHouse" : 11182882, "occHouse" : 29008161, "year" : 1990} ], … }
- 15. Count, Distinct
- 16. Total US Area db.cData.aggregate([ {"$group" : {"_id" : null, "totalArea" : {$sum : "$areaM"}, "avgArea" : {$avg : "$areaM"}}}])
- 17. $group • Group documents by value – Field reference, object, constant – Other output fields are computed • $max, $min, $avg, $sum • $addToSet, $push • $first, $last – Processes all data in memory by default
- 18. Area By Region db.cData.aggregate([ {"$group" : {"_id" : "$region", "totalArea" : {$sum : "$areaM"}, "avgArea" : {$avg : "$areaM"}, "numStates" : {$sum : 1}, "states" : {$push : "$name"}}} ])
- 19. Calculating Average StateArea By Region { $group: { _id: "$region", avgAreaM: {$avg: ”$areaM" } }} { _id: ”North East", avgAreaM: 154 } { _id: “West", avgAreaM: 300 } { state: ”New York", areaM: 218, region: “North East" } { state: ”New Jersey", areaM: 90, region: “North East” } { state: “California", areaM: 300, region: “West" }
- 20. Calculating Total Area and State Count { $group: { _id: "$region", totArea: {$sum: ”$areaM" }, sCount : {$sum : 1}}} { _id: ”North East", totArea: 308 sCount: 2} { _id: “West", totArea: 300, sCount: 1} { state: ”New York", areaM: 218, region: “North East" } { state: ”New Jersey", areaM: 90, region: “North East” } { state: “California", area: 300, region: “West" }
- 21. Total US Population By Year db.cData.aggregate( [{$unwind : "$data"}, {$group : {"_id" : "$data.year", "totalPop" : {$sum : "$data.totalPop"}}}, {$sort : {"totalPop" : 1}} ])
- 22. $unwind • Operate on an array field – Create documents from array elements • Array replaced by element value • Missing/empty fields → no output • Non-array fields → error – Pipe to $group to aggregate
- 23. $unwind { $unwind: $census } { state: “New York, census: 1990} { state: ”New York", census: [1990, 2000, 2010] } { state: ”New Jersey", census: [1990, 2000] } { state: “California", census: [1980, 1990, 2000, 2010] } { state: ”Delaware", census: [1990, 2000] } { state: “New York, census: 2000} { state: “New York, census: 2010} { state: “New Jersey, census: 1990} { state: “New Jersey, census: 2000} …
- 24. Southern State Population By Year db.cData.aggregate( [{$match : {"region" : "South"}}, {$unwind : "$data"}, {$group : {"_id" : "$data.year", "totalPop” : {"$sum” : "$data.totalPop"}}}])
- 25. $match • Filter documents – Uses existing query syntax – No $where (server side Javascript)
- 26. $match { $match: { “region” : “West” } } { state: ”New York", areaM: 218, region: “North East" } { state: ”Oregon", areaM: 245, region: “West” } { state: “California", area: 300, region: “West" } { state: ”Oregon", areaM: 245, region: “West” } { state: “California", area: 300, region: “West" }
- 27. Population Delta By State from 1990 to 2010 db.cData.aggregate( [{$unwind : "$data"}, {$sort : {"data.year" : 1}}, {$group : {"_id" : "$name", "pop1990" : {"$first" : "$data.totalPop"}, "pop2010" : {"$last" : "$data.totalPop"}}}, {$project : {"_id" : 0, "name" : "$_id", "delta" : {"$subtract" : ["$pop2010", "$pop1990"]}, "pop1990" : 1, "pop2010” : 1} }] )
- 28. Population Delta By State from 1990 to 2010 db.cData.aggregate( [{$unwind : "$data"}, {$sort : {"data.year" : 1}}, {$group : {"_id" : "$name", "pop1990" : {"$first" : "$data.totalPop"}, "pop2010" : {"$last" : "$data.totalPop"}}}, {$project : {"_id" : 0, "name" : "$_id", "delta" : {"$subtract" : ["$pop2010", "$pop1990"]}, "pop1990" : 1, "pop2010” : 1} }] )
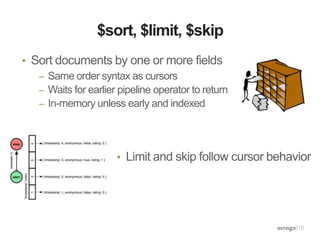
- 29. $sort, $limit, $skip • Sort documents by one or more fields – Same order syntax as cursors – Waits for earlier pipeline operator to return – In-memory unless early and indexed • Limit and skip follow cursor behavior
- 30. Population Delta By State from 1990 to 2010 db.cData.aggregate( [{$unwind : "$data"}, {$sort : {"data.year" : 1}}, {$group : {"_id" : "$name", "pop1990" : {"$first" : "$data.totalPop"}, "pop2010" : {"$last" : "$data.totalPop"}}}, {$project : {"_id" : 0, "name" : "$_id", "delta" : {"$subtract" : ["$pop2010", "$pop1990"]}, "pop1990" : 1, "pop2010” : 1} }] )
- 31. $first, $last • Collection operations like $push and $addToSet • Must be used in $group • $first and $last determined by document order • Typically used with $sort to ensure ordering is known
- 32. Population Delta By State from 1990 to 2010 db.cData.aggregate( [{$unwind : "$data"}, {$sort : {"data.year" : 1}}, {$group : {"_id" : "$name", "pop1990" : {"$first" : "$data.totalPop"}, "pop2010" : {"$last" : "$data.totalPop"}}}, {$project : {"_id" : 0, "name" : "$_id", "delta" : {"$subtract" : ["$pop2010", "$pop1990"]}, "pop1990" : 1, "pop2010” : 1} }] )
- 33. $project • Reshape Documents – Include, exclude or rename fields – Inject computed fields – Create sub-document fields
- 34. Including and Excluding Fields { $project: { “_id” : 0, “pop1990” : 1, “pop2010” : 1 } { "_id" : "Virginia”, "pop1990" : 453588, "pop2010" : 3725789 } { "_id" : "South Dakota", "pop1990" : 453588, "pop2010" : 3725789 } { "pop1990" : 453588, "pop2010" : 3725789 } { "pop1990" : 453588, "pop2010" : 3725789 }
- 35. { ”name" : “South Dakota”, ”delta" : 118176 } Renaming and Computing Fields { $project: { “_id” : 0, “pop1990” : 0, “pop2010” : 0, “name” : “$_id”, "delta" : {"$subtract" : ["$pop2010", "$pop1990"]}} } { "_id" : "Virginia”, "pop1990" : 6187358, "pop2010" : 8001024 } { "_id" : "South Dakota", "pop1990" : 696004, "pop2010" : 814180 } { ”name" : “Virginia”, ”delta" : 1813666 }
- 36. Compare number of people living within 500KM of Memphis, TN in 1990, 2000, 2010
- 37. Compare number of people living within 500KM of Memphis, TN in 1990, 2000, 2010 db.cData.aggregate([ {$geoNear : { "near" : {"type" : "Point", "coordinates" : [90, 35]}, “distanceField” : "dist.calculated", “maxDistance” : 500000, “includeLocs” : "dist.location", “spherical” : true }}, {$unwind : "$data"}, {$group : {"_id" : "$data.year", "totalPop" : {"$sum" : "$data.totalPop"}, "states" : {"$addToSet" : "$name"}}}, {$sort : {"_id" : 1}} ])
- 38. $geoNear • Order/Filter Documents by Location – Requires a geospatial index – Output includes physical distance – Must be first aggregation stage
- 39. { "_id" : ”Tennessee", "pop1990" : 4877185, "pop2010" : 6346105, “center” : {“type” : “Point”, “coordinates” : [86.6, 37.8]} } { "_id" : "Virginia”, "pop1990" : 6187358, "pop2010" : 8001024, “center” : {“type” : “Point”, “coordinates” : [78.6, 37.5]} } $geoNear {$geoNear : { "near”: {"type”: "Point", "coordinates”: [90, 35]}, maxDistance : 500000, spherical : true }} { "_id" : ”Tennessee", "pop1990" : 4877185, "pop2010" : 6346105, “center” : {“type” : “Point”, “coordinates” : [86.6, 37.8]} }
- 40. What if I want to save the results to a collection? db.cData.aggregate([ {$geoNear : { "near" : {"type" : "Point", "coordinates" : [90, 35]}, “distanceField” : "dist.calculated", “maxDistance” : 500000, “includeLocs” : "dist.location", “spherical” : true }}, {$unwind : "$data"}, {$group : {"_id" : "$data.year", "totalPop" : {"$sum" : "$data.totalPop"}, "states" : {"$addToSet" : "$name"}}}, {$sort : {"_id" : 1}}, {$out : “peopleNearMemphis”} ])
- 41. $out db.cData.aggregate([<pipeline stages>, {“$out” : “resultsCollection”}]) • Save aggregation results to a new collection • New aggregation uses: • Transform documents - ETL
- 42. Back To The Original Question • Which US Division has the fastest growing population density? – We only want to include data states with more than 1M people – We only want to include divisions larger than 100K square miles
- 43. Division with Fastest Growing Pop Density db.cData.aggregate( [{$match : {"data.totalPop" : {"$gt" : 1000000}}}, {$unwind : "$data"}, {$sort : {"data.year" : 1}}, {$group : {"_id" : "$name", "pop1990" : {"$first" : "$data.totalPop"}, "pop2010" : {"$last" : "$data.totalPop"}, "areaM" : {"$first" : "$areaM"}, "division" : {"$first" : "$division"}}}, {$group : {"_id" : "$division", "totalPop1990" : {"$sum" : "$pop1990"}, "totalPop2010" : {"$sum" : "$pop2010"}, "totalAreaM" : {"$sum" : "$areaM"}}}, {$match : {"totalAreaM" : {"$gt" : 100000}}}, {$project : {"_id" : 0, "division" : "$_id", "density1990" : {"$divide" : ["$totalPop1990", "$totalAreaM"]}, "density2010" : {"$divide" : ["$totalPop2010", "$totalAreaM"]}, "denDelta" : {"$subtract" : [{"$divide" : ["$totalPop2010", "$totalAreaM"]}, {"$divide" : ["$totalPop1990”, "$totalAreaM"]}]}, "totalAreaM" : 1, "totalPop1990" : 1, "totalPop2010" : 1}}, {$sort : {"denDelta" : -1}}])
- 45. Aggregate options db.cData.aggregate([<pipeline stages>], {‘explain’ : false 'allowDiskUse' : true, 'cursor' : {'batchSize' : 5}}) explain – similar to find().explain() allowDiskUse – enable use of disk to store intermediate results cursor – specify the size of the initial result
- 47. Sharding • Workload split between shards – Shards execute pipeline up to a point – Primary shard merges cursors and continues processing* – Use explain to analyze pipeline split – Early $match may excuse shards – Potential CPU and memory implications for primary shard host *Prior to v2.6 second stage pipeline processing was done by mongos
- 48. Summary
- 49. Analytics in MongoDB? Create Read Update Deletet Analytics ? Group Count Derive Values Filter Average Sort YES!
- 50. Framework Use Cases • Basic aggregation queries • Ad-hoc reporting • Real-time analytics • Visualizing and reshaping data