SlideShare a Scribd company logo
3
Most read
6
Most read
15
Most read
An Introduction To Web Analytics
Web Analytics??? Why use Web Analytics ?? Web analytics  Parlance  Web analytics  and categories Major Tools Of Web Analytics What??
Web analytics  is the study of visitor, navigation, and traffic patterns to determine the success of a given web site.  Focussing only on the amount of traffic might only be helpful in evaluating your bandwidth usage and server’s capabilities, which is not its only purpose. Web analytics  focuses on in-depth comparison of available visitor data, referral data, and site navigation patterns . It also tells us the amount of traffic we receive over any specified period of time. What is Web Analytics
Within search engine marketing campaigns your "investment" can, and must, be broken down to an extremely granular level in order to measure - and more importantly - maximize, your results.  Web analytics : 1) Measures and maximizes ROI  Identifies which referral sources generate the most revenue and orders for your business 2)  Helps in  Targeting Your Marketing Efforts Better Determine which visitor groups are most likely to convert into customers, members or subscribers  Why do we need Web Analytics?
3 )  Optimize Conversions Tracking to maximize the rate at which your Web site visitors convert into customers, subscribers or members.  4)  Save On Customer Support Improving the efficiency of your online support to dramatically reduce your offline costs.   5)  Pinpoint Online Revenue-Enhancing Opportunities Determine upward and downward trends in a particular product, and which products would function best as loss leaders to attract new customers   Why do we need Web Analytics?
Hit   - A request for a file from the web server. The number of hits received by a website is frequently cited to assert its popularity, but this number is extremely misleading and dramatically over-estimates popularity. Impression  - An impression is each time an advertisement loads on a user's screen. Anytime you see a banner, that is an impression. Bounce Rate  - The percentage of visits where the visitor enters and exits at the same page without visiting any other pages on the site in between. Visitor / Unique Visitor / Unique User   - The uniquely identified client generating requests on the web server (log analysis) or viewing pages (page tagging) within a defined time period (i.e. day, week or month). Here, the same person visiting from two different computers will count as two Unique Visitors. Page View Duration / Time on Page   - Average amount of time that visitors spend on each page of the site.  Web Analytics Jargon
The Web analytic tools can be categorized into two parts: Conversion:   Conversion rate is the ratio of visitors who convert casual content views or website visits into desired actions based on subtle or direct requests from marketers, advertisers, and content creators. Some major tools that help assess the conversion rate are: Google analytics Web Trends Compete Stat Counter Quantcast Categorization
2.  Usability:   If a site is usable, it fits its purpose. This typically means that it's convenient to use.  Now there are some tools which can be used to assess the usability of a website. We have discussed two important usability tools: ClickTale Crazyegg Categorization
Google Analytics: Excellent Graphical Representation of Data Provides for Marketing-Based Analysis Helps  you to see what a visitor put into your internal search box and  what page they were on when they made the search. Helps you create a filter to not count anyone from specific domains you add in. Lets you create and save your own custom reports. Lets you pick and choose the metrics you want to track as well as the categories to keep drilling down for further analysis.  While Google Analytics goal conversions are defined by a specific URL, event tracking lets you track and analyze specific actions that are triggered by clicks.  With Site Overlay, you can view user activities and conversions as a visual layer on your site.  Web Analytics Tools(Conversion)
Compete: It is good for checking out the competition. Compare your site against multiple competitors in one easy-to-read report.  You can enter up to five competing Web sites for a detailed report comparing their amount of visitors and growth percentage for the month and year. One can find out which keywords are sending traffic to a Web site or a category, which sites get the most clicks from a keyword, and how two sites compare for competing keywords.  You can see where your site stands with customizable ranked lists of up to 500,000 domains.  The Compete Toolbar automatically creates three alerts for every Web site you visit. a)  Trust Scores  warns you of potentially malicious Web sites; b ) Site Profiles  tells you the site’s popularity, rank, and growth rate;  c)  Deal Light  lights up if there are any special promotions or coupons offered on the Web site.  One can see the latest stats, including the number of unique visitors for up to three sites at a time.  Web Analytics Tools(Conversion)
3)  Quantcast: Quantcast is good for accurately measuring your audience reach and composition, information that can help you attract advertisers.  Graphs for the following demographics: Gender, Age, Household Income, Ethnicity, Education, Estimated Household Income Traffic overview - Visitors passing through -versus- Regulars  and Addicts. Monthly unique U.S. visitors. They provide a central repository for local reporting.  The “holistic” model combines panel-based and directly measured data with its own algorithm.  It has a  free service that measures the usage of your videos, widgets, and games, both on your Web site and elsewhere on the Web.  Unlike many services that offer just the traffic ranking of a Web site, Quantcast delivers a one-sentence summary, such as "The site caters to a slightly female, older, fairly wealthy following.“ Web Analytics Tools (Conversion)
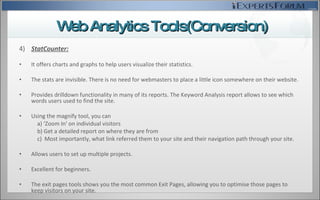
4)  StatCounter: It offers charts and graphs to help users visualize their statistics. The stats are invisible. There is no need for webmasters to place a little icon somewhere on their website.  Provides drilldown functionality in many of its reports. The Keyword Analysis report allows to see which words users used to find the site. Using the magnify tool, you can  a) ‘Zoom In' on individual visitors  b) Get a detailed report on where they are from  c)  Most importantly, what link referred them to your site and their navigation path through your site.  Allows users to set up multiple projects. Excellent for beginners. The exit pages tools  shows you the most common Exit Pages, allowing you to optimise those pages to keep visitors on your site.  Web Analytics Tools(Conversion)
5)  WebTrends: Web analytics reporting is useful .It has some quality features such as: User behaviour on each particular page of the site User navigational behaviour between pages on the site Task execution by users Referrals from search engines One can go  beyond pre-defined segments such as "new visitors" vs. "repeat visitors" and define your own custom segments based on demographics. Drill-Across Related Reporting takes your data exploration to a new level with the related reporting elements in WebTrends. The quick-query tool  focuses on  reports and identifies your top performing initiatives.  Web Analytic Tools(Conversion)
ClickTale :  Unlike traditional web analytics that produce only pure statistics, ClickTale gives webmasters the ability to watch movies of users’ individual browsing sessions. Some essential features: Every mouse movement, every click and every keystroke are recorded for convenient playback.  With ClickTale, webmasters can improve website usability, enhance navigation, and increase website effectiveness. Its  New Advanced Search functionality Optimises your landing pages by watching the visitors who arrive at specific pages Marketing Campaign Tracking watches how visitors respond to your landing pages, and improve the effectiveness of your email and marketing campaigns. Web analytics Tools(Usability)
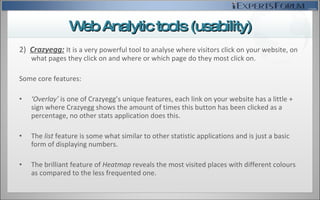
2)  Crazyegg:   I t is a very powerful tool to analyse where visitors click on your website, on what pages they click on and where or which page do they most click on. Some core features:  ‘ Overlay’  is one of Crazyegg’s unique features, each link on your website has a little + sign where Crazyegg shows the amount of times this button has been clicked as a percentage, no other stats application does this. The  list  feature is some what similar to other statistic applications and is just a basic form of displaying numbers. The brilliant feature of  Heatmap  reveals the most visited places with different colours as compared to the less frequented one. Web Analytic tools (usability)
Thank you!!  For watching the presentation To know more about Web Analytics and Conversion Optimization Techniques Please visit www.iexpertsforum.com/smf/

More Related Content

What's hot (20)

PDF
Web Analytics in 10 slides
Aishwarya Saseendran
 
PPTX
Google Analytics ppt
SoftProdigy - We know software!
 
PPTX
Introduction to Google Analytics
Arjun Parekh
 
PPT
Web Analytics 101
Nilotpal Paul
 
PPTX
Google Analytics Ppt Final
barbwhite325
 
PDF
Digital Marketing Workshop Presentation (PPT) by Shamsher Khan
Shamsher Khan
 
PPTX
Pay per click
Projects Kart
 
PPTX
Digital Marketing workshop ppt
Pankaj Solanki
 
PPTX
Web Analytics Concepts & Theories
mattPROv1
 
PPTX
Learning About Keyword Research PPT
Ketaki Gambhir
 
PDF
Marketing Analytics ppt
DarshilJani4
 
PPTX
Mobile Marketing
Daanish Mehra
 
PPTX
LinkedIn Marketing PPT
SoftProdigy - We know software!
 
PPTX
SEARCH ENGINE OPTIMIZATION (SEO)
Preeti Acharya
 
PPTX
Off page seo
safna sakkariya
 
PPTX
Marketing analytics
Akshay Deshmukh
 
PDF
Social Media Analytics
Kelli Burns
 
PDF
Social Media Marketing Presentation.pdf
VanakkamDigital
 
PPTX
Google Analytics - A Brief Intro
Kashyap Shah
 
Web Analytics in 10 slides
Aishwarya Saseendran
 
Google Analytics ppt
SoftProdigy - We know software!
 
Introduction to Google Analytics
Arjun Parekh
 
Web Analytics 101
Nilotpal Paul
 
Google Analytics Ppt Final
barbwhite325
 
Digital Marketing Workshop Presentation (PPT) by Shamsher Khan
Shamsher Khan
 
Pay per click
Projects Kart
 
Digital Marketing workshop ppt
Pankaj Solanki
 
Web Analytics Concepts & Theories
mattPROv1
 
Learning About Keyword Research PPT
Ketaki Gambhir
 
Marketing Analytics ppt
DarshilJani4
 
Mobile Marketing
Daanish Mehra
 
LinkedIn Marketing PPT
SoftProdigy - We know software!
 
SEARCH ENGINE OPTIMIZATION (SEO)
Preeti Acharya
 
Off page seo
safna sakkariya
 
Marketing analytics
Akshay Deshmukh
 
Social Media Analytics
Kelli Burns
 
Social Media Marketing Presentation.pdf
VanakkamDigital
 
Google Analytics - A Brief Intro
Kashyap Shah
 

Similar to An Introduction to Web Analytics (20)

PPTX
Webtrends presentation
citsweb
 
PPTX
Web Analytics Training Course
Business & Enterprise North East
 
PPTX
Web analytics basic
Learning-Catalyst
 
PPSX
Web Analytics Training for Business Link
Business & Enterprise North East
 
PPTX
Data analytics for web
Sai P Mishra
 
PPTX
PPT 3 Web Analytics (1).pptx
DevChaudhari15
 
PPT
Web analytics
racerunner
 
PPTX
Web analytics
PRINSHU SINGH
 
PPTX
Website Analytics
Capturly
 
PDF
Web Analytics 101
Marqui CMS
 
PDF
Government Web Analytics
GovLoop
 
PDF
Web analyticspres -am-long
Anna Long
 
PDF
Google Analytics tutorial by Jay Murphy
Newport Interactive Marketers
 
DOCX
A Practitioner’s Guide to Web Analytics: Designed for the B-to-B Marketer
skijumpman
 
PPTX
Module 1 introduction to web analytics
Gayathri Choda
 
PDF
Google Analytics 101
Francesca Lorenzoni
 
PPS
Web analytics workshop from Web Kinetics
Andrew Atkins
 
PDF
RESEARCH CHALLENGES IN WEB ANALYTICS – A STUDY
IRJET Journal
 
PDF
dabblr_report_final
Sai Kiran Putta
 
Webtrends presentation
citsweb
 
Web Analytics Training Course
Business & Enterprise North East
 
Web analytics basic
Learning-Catalyst
 
Web Analytics Training for Business Link
Business & Enterprise North East
 
Data analytics for web
Sai P Mishra
 
PPT 3 Web Analytics (1).pptx
DevChaudhari15
 
Web analytics
racerunner
 
Web analytics
PRINSHU SINGH
 
Website Analytics
Capturly
 
Web Analytics 101
Marqui CMS
 
Government Web Analytics
GovLoop
 
Web analyticspres -am-long
Anna Long
 
Google Analytics tutorial by Jay Murphy
Newport Interactive Marketers
 
A Practitioner’s Guide to Web Analytics: Designed for the B-to-B Marketer
skijumpman
 
Module 1 introduction to web analytics
Gayathri Choda
 
Google Analytics 101
Francesca Lorenzoni
 
Web analytics workshop from Web Kinetics
Andrew Atkins
 
RESEARCH CHALLENGES IN WEB ANALYTICS – A STUDY
IRJET Journal
 
dabblr_report_final
Sai Kiran Putta
 
Ad

Recently uploaded (20)

PDF
Predicting the unpredictable: re-engineering recommendation algorithms for fr...
Speck&Tech
 
PDF
Chris Elwell Woburn, MA - Passionate About IT Innovation
Chris Elwell Woburn, MA
 
PDF
SFWelly Summer 25 Release Highlights July 2025
Anna Loughnan Colquhoun
 
PDF
Windsurf Meetup Ottawa 2025-07-12 - Planning Mode at Reliza.pdf
Pavel Shukhman
 
PPTX
WooCommerce Workshop: Bring Your Laptop
Laura Hartwig
 
PDF
SWEBOK Guide and Software Services Engineering Education
Hironori Washizaki
 
PPTX
Top iOS App Development Company in the USA for Innovative Apps
SynapseIndia
 
PDF
Complete JavaScript Notes: From Basics to Advanced Concepts.pdf
haydendavispro
 
PDF
NewMind AI - Journal 100 Insights After The 100th Issue
NewMind AI
 
PDF
Building Resilience with Digital Twins : Lessons from Korea
SANGHEE SHIN
 
PDF
Persuasive AI: risks and opportunities in the age of digital debate
Speck&Tech
 
PDF
Transcript: New from BookNet Canada for 2025: BNC BiblioShare - Tech Forum 2025
BookNet Canada
 
PDF
TrustArc Webinar - Data Privacy Trends 2025: Mid-Year Insights & Program Stra...
TrustArc
 
PDF
HubSpot Main Hub: A Unified Growth Platform
Jaswinder Singh
 
PDF
LLMs.txt: Easily Control How AI Crawls Your Site
Keploy
 
PDF
New from BookNet Canada for 2025: BNC BiblioShare - Tech Forum 2025
BookNet Canada
 
PPT
Interview paper part 3, It is based on Interview Prep
SoumyadeepGhosh39
 
PPTX
✨Unleashing Collaboration: Salesforce Channels & Community Power in Patna!✨
SanjeetMishra29
 
PDF
Wojciech Ciemski for Top Cyber News MAGAZINE. June 2025
Dr. Ludmila Morozova-Buss
 
PPTX
Webinar: Introduction to LF Energy EVerest
DanBrown980551
 
Predicting the unpredictable: re-engineering recommendation algorithms for fr...
Speck&Tech
 
Chris Elwell Woburn, MA - Passionate About IT Innovation
Chris Elwell Woburn, MA
 
SFWelly Summer 25 Release Highlights July 2025
Anna Loughnan Colquhoun
 
Windsurf Meetup Ottawa 2025-07-12 - Planning Mode at Reliza.pdf
Pavel Shukhman
 
WooCommerce Workshop: Bring Your Laptop
Laura Hartwig
 
SWEBOK Guide and Software Services Engineering Education
Hironori Washizaki
 
Top iOS App Development Company in the USA for Innovative Apps
SynapseIndia
 
Complete JavaScript Notes: From Basics to Advanced Concepts.pdf
haydendavispro
 
NewMind AI - Journal 100 Insights After The 100th Issue
NewMind AI
 
Building Resilience with Digital Twins : Lessons from Korea
SANGHEE SHIN
 
Persuasive AI: risks and opportunities in the age of digital debate
Speck&Tech
 
Transcript: New from BookNet Canada for 2025: BNC BiblioShare - Tech Forum 2025
BookNet Canada
 
TrustArc Webinar - Data Privacy Trends 2025: Mid-Year Insights & Program Stra...
TrustArc
 
HubSpot Main Hub: A Unified Growth Platform
Jaswinder Singh
 
LLMs.txt: Easily Control How AI Crawls Your Site
Keploy
 
New from BookNet Canada for 2025: BNC BiblioShare - Tech Forum 2025
BookNet Canada
 
Interview paper part 3, It is based on Interview Prep
SoumyadeepGhosh39
 
✨Unleashing Collaboration: Salesforce Channels & Community Power in Patna!✨
SanjeetMishra29
 
Wojciech Ciemski for Top Cyber News MAGAZINE. June 2025
Dr. Ludmila Morozova-Buss
 
Webinar: Introduction to LF Energy EVerest
DanBrown980551
 
Ad

An Introduction to Web Analytics

  • 1. An Introduction To Web Analytics
  • 2. Web Analytics??? Why use Web Analytics ?? Web analytics Parlance Web analytics and categories Major Tools Of Web Analytics What??
  • 3. Web analytics is the study of visitor, navigation, and traffic patterns to determine the success of a given web site. Focussing only on the amount of traffic might only be helpful in evaluating your bandwidth usage and server’s capabilities, which is not its only purpose. Web analytics focuses on in-depth comparison of available visitor data, referral data, and site navigation patterns . It also tells us the amount of traffic we receive over any specified period of time. What is Web Analytics
  • 4. Within search engine marketing campaigns your "investment" can, and must, be broken down to an extremely granular level in order to measure - and more importantly - maximize, your results. Web analytics : 1) Measures and maximizes ROI Identifies which referral sources generate the most revenue and orders for your business 2) Helps in Targeting Your Marketing Efforts Better Determine which visitor groups are most likely to convert into customers, members or subscribers Why do we need Web Analytics?
  • 5. 3 ) Optimize Conversions Tracking to maximize the rate at which your Web site visitors convert into customers, subscribers or members. 4) Save On Customer Support Improving the efficiency of your online support to dramatically reduce your offline costs. 5) Pinpoint Online Revenue-Enhancing Opportunities Determine upward and downward trends in a particular product, and which products would function best as loss leaders to attract new customers Why do we need Web Analytics?
  • 6. Hit - A request for a file from the web server. The number of hits received by a website is frequently cited to assert its popularity, but this number is extremely misleading and dramatically over-estimates popularity. Impression - An impression is each time an advertisement loads on a user's screen. Anytime you see a banner, that is an impression. Bounce Rate - The percentage of visits where the visitor enters and exits at the same page without visiting any other pages on the site in between. Visitor / Unique Visitor / Unique User - The uniquely identified client generating requests on the web server (log analysis) or viewing pages (page tagging) within a defined time period (i.e. day, week or month). Here, the same person visiting from two different computers will count as two Unique Visitors. Page View Duration / Time on Page - Average amount of time that visitors spend on each page of the site. Web Analytics Jargon
  • 7. The Web analytic tools can be categorized into two parts: Conversion: Conversion rate is the ratio of visitors who convert casual content views or website visits into desired actions based on subtle or direct requests from marketers, advertisers, and content creators. Some major tools that help assess the conversion rate are: Google analytics Web Trends Compete Stat Counter Quantcast Categorization
  • 8. 2. Usability: If a site is usable, it fits its purpose. This typically means that it's convenient to use. Now there are some tools which can be used to assess the usability of a website. We have discussed two important usability tools: ClickTale Crazyegg Categorization
  • 9. Google Analytics: Excellent Graphical Representation of Data Provides for Marketing-Based Analysis Helps you to see what a visitor put into your internal search box and what page they were on when they made the search. Helps you create a filter to not count anyone from specific domains you add in. Lets you create and save your own custom reports. Lets you pick and choose the metrics you want to track as well as the categories to keep drilling down for further analysis. While Google Analytics goal conversions are defined by a specific URL, event tracking lets you track and analyze specific actions that are triggered by clicks.  With Site Overlay, you can view user activities and conversions as a visual layer on your site.  Web Analytics Tools(Conversion)
  • 10. Compete: It is good for checking out the competition. Compare your site against multiple competitors in one easy-to-read report. You can enter up to five competing Web sites for a detailed report comparing their amount of visitors and growth percentage for the month and year. One can find out which keywords are sending traffic to a Web site or a category, which sites get the most clicks from a keyword, and how two sites compare for competing keywords. You can see where your site stands with customizable ranked lists of up to 500,000 domains. The Compete Toolbar automatically creates three alerts for every Web site you visit. a) Trust Scores warns you of potentially malicious Web sites; b ) Site Profiles tells you the site’s popularity, rank, and growth rate; c) Deal Light lights up if there are any special promotions or coupons offered on the Web site. One can see the latest stats, including the number of unique visitors for up to three sites at a time. Web Analytics Tools(Conversion)
  • 11. 3) Quantcast: Quantcast is good for accurately measuring your audience reach and composition, information that can help you attract advertisers. Graphs for the following demographics: Gender, Age, Household Income, Ethnicity, Education, Estimated Household Income Traffic overview - Visitors passing through -versus- Regulars and Addicts. Monthly unique U.S. visitors. They provide a central repository for local reporting. The “holistic” model combines panel-based and directly measured data with its own algorithm. It has a free service that measures the usage of your videos, widgets, and games, both on your Web site and elsewhere on the Web. Unlike many services that offer just the traffic ranking of a Web site, Quantcast delivers a one-sentence summary, such as "The site caters to a slightly female, older, fairly wealthy following.“ Web Analytics Tools (Conversion)
  • 12. 4) StatCounter: It offers charts and graphs to help users visualize their statistics. The stats are invisible. There is no need for webmasters to place a little icon somewhere on their website. Provides drilldown functionality in many of its reports. The Keyword Analysis report allows to see which words users used to find the site. Using the magnify tool, you can a) ‘Zoom In' on individual visitors b) Get a detailed report on where they are from c) Most importantly, what link referred them to your site and their navigation path through your site. Allows users to set up multiple projects. Excellent for beginners. The exit pages tools shows you the most common Exit Pages, allowing you to optimise those pages to keep visitors on your site. Web Analytics Tools(Conversion)
  • 13. 5) WebTrends: Web analytics reporting is useful .It has some quality features such as: User behaviour on each particular page of the site User navigational behaviour between pages on the site Task execution by users Referrals from search engines One can go beyond pre-defined segments such as "new visitors" vs. "repeat visitors" and define your own custom segments based on demographics. Drill-Across Related Reporting takes your data exploration to a new level with the related reporting elements in WebTrends. The quick-query tool focuses on reports and identifies your top performing initiatives. Web Analytic Tools(Conversion)
  • 14. ClickTale : Unlike traditional web analytics that produce only pure statistics, ClickTale gives webmasters the ability to watch movies of users’ individual browsing sessions. Some essential features: Every mouse movement, every click and every keystroke are recorded for convenient playback. With ClickTale, webmasters can improve website usability, enhance navigation, and increase website effectiveness. Its New Advanced Search functionality Optimises your landing pages by watching the visitors who arrive at specific pages Marketing Campaign Tracking watches how visitors respond to your landing pages, and improve the effectiveness of your email and marketing campaigns. Web analytics Tools(Usability)
  • 15. 2) Crazyegg: I t is a very powerful tool to analyse where visitors click on your website, on what pages they click on and where or which page do they most click on. Some core features: ‘ Overlay’ is one of Crazyegg’s unique features, each link on your website has a little + sign where Crazyegg shows the amount of times this button has been clicked as a percentage, no other stats application does this. The list feature is some what similar to other statistic applications and is just a basic form of displaying numbers. The brilliant feature of Heatmap reveals the most visited places with different colours as compared to the less frequented one. Web Analytic tools (usability)
  • 16. Thank you!! For watching the presentation To know more about Web Analytics and Conversion Optimization Techniques Please visit www.iexpertsforum.com/smf/

Editor's Notes

  • #2: Offices in UK, USA & India