SlideShare a Scribd company logo
Attack Monitoring Using ELK
@Nullcon Goa 2015
@prajalkulkarni
@mehimansu
About Us
@prajalkulkarni
-Security Analyst @flipkart.com
-Interested in webapps, mobile, loves scripting in python
-Fan of cricket! and a wannabe guitarist!
@mehimansu
-Security Analyst @flipkart.com
-CTF Player - Team SegFault
-Interested in binaries, fuzzing
Attack monitoring using ElasticSearch Logstash and Kibana
Today’s workshop agenda
•Overview & Architecture of ELK
•Setting up & configuring ELK
•Logstash forwarder
•Alerting And Attack monitoring
What does the vm contains?
● Extracted ELK Tar files in /opt/
● java version "1.7.0_76"
● Apache installed
● Logstash-forwarder package
Why ELK?
Why ELK?
Old School
● grep/sed/awk/cut/sort
● manually analyze the output
ELK
● define endpoints(input/output)
● correlate patterns
● store data(search and visualize)
Other SIEM Market Solutions!
● Symantec Security Information Manager
● Splunk
● HP/Arcsight
● Tripwire
● NetIQ
● Quest Software
● IBM/Q1 Labs
● Novell
● Enterprise Security Manager
Overview of Elasticsearch
•Open source search server written in Java
•Used to index any kind of heterogeneous data
•Enables real-time ability to search through index
•Has REST API web-interface with JSON output
Overview of Logstash
•Framework for managing logs
•Founded by Jordan Sissel
•Mainly consists of 3 components:
● input : passing logs to process them into machine understandable
format(file,lumberjack).
● filters: set of conditionals to perform specific action on a
event(grok,geoip).
● output: decision maker for processed event/log(elasticsearch,file)
•Powerful front-end dashboard for visualizing indexed information from
elastic cluster.
•Capable to providing historical data in form of graphs,charts,etc.
•Enables real-time search of indexed information.
Overview of Kibana
Basic ELK Setup
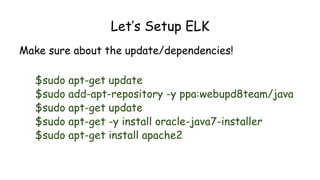
Let’s Setup ELK
Make sure about the update/dependencies!
$sudo apt-get update
$sudo add-apt-repository -y ppa:webupd8team/java
$sudo apt-get update
$sudo apt-get -y install oracle-java7-installer
$sudo apt-get install apache2
Installing Elasticsearch
$cd /opt
$curl –O
https://download.elasticsearch.org/elasticsearch/elasticsearch/elasticsea
rch-1.4.2.tar.gz
$tar -zxvf elasticsearch-1.4.2.tar.gz
$cd elasticsearch-1.4.2/
edit elasticsearch.yml
$sudo nano /opt/elasticsearch/config/elasticsearch.yml
ctrl+w search for ”cluster.name”
Change the cluster name to elastic_yourname
ctrl+x Y
Now start ElasticSearch sudo ./elasticsearch
Verifying Elasticsearch Installation
$curl –XGET http://localhost:9200
Expected Output:
{
"status" : 200,
"name" : "Edwin Jarvis",
"cluster_name" : "elastic_yourname",
"version" : {
"number" : "1.4.2",
"build_hash" : "927caff6f05403e936c20bf4529f144f0c89fd8c",
"build_timestamp" : "2014-12-16T14:11:12Z",
"build_snapshot" : false,
"lucene_version" : "4.10.2"
},
"tagline" : "You Know, for Search"
}
Terminologies of Elastic Search!
Cluster
● A cluster is a collection of one or more nodes (servers) that together
holds your entire data and provides federated indexing and search
capabilities across all nodes
● A cluster is identified by a unique name which by default is
"elasticsearch"
Terminologies of Elastic Search!
Node
● It is an elasticsearch instance (a java process)
● A node is created when a elasticsearch instance is started
● A random Marvel Charater name is allocated by default
Terminologies of Elastic Search!
Index
● An index is a collection of documents that have somewhat similar
characteristics. eg:customer data, product catalog
● Very crucial while performing indexing, search, update, and delete
operations against the documents in it
● One can define as many indexes in one single cluster
Document
● It is the most basic unit of information which can be indexed
● It is expressed in json (key:value) pair. ‘{“user”:”nullcon”}’
● Every Document gets associated with a type and a unique id.
Terminologies of Elastic Search!
Shard
● Every index can be split into multiple shards to be able to distribute data.
● The shard is the atomic part of an index, which can be distributed over the cluster if you
add more nodes.
● By default 5 primary shards and 1 replica shards are created while starting elasticsearch
____ ____ | 1 | | 2 | | 3 | | 4 | | 5 | |____| |____|
● Atleast 2 Nodes are required for replicas to be created
Attack monitoring using ElasticSearch Logstash and Kibana
Plugins of Elasticsearch
head
./plugin -install mobz/elasticsearch-head
HQ
./plugin -install royrusso/elasticsearch-HQ
Bigdesk
./plugin -install lukas-vlcek/bigdesk
Restful API’s over http -- !help curl
curl -X<VERB> '<PROTOCOL>://<HOST>/<PATH>?<QUERY_STRING>' -d '<BODY>'
● VERB-The appropriate HTTP method or verb: GET, POST, PUT, HEAD, or DELETE.
● PROTOCOL-Either http or https (if you have an https proxy in front of Elasticsearch.)
● HOST-The hostname of any node in your Elasticsearch cluster, or localhost for a node on your
local machine.
● PORT-The port running the Elasticsearch HTTP service, which defaults to 9200.
● QUERY_STRING-Any optional query-string parameters (for example ?pretty will pretty-print
the JSON response to make it easier to read.)
● BODY-A JSON encoded request body (if the request needs one.)
!help curl
Simple Index Creation with XPUT:
curl -XPUT 'http://localhost:9200/twitter/'
Add data to your created index:
curl -XPUT 'http://localhost:9200/twitter/tweet/1' -d '{"user":"nullcon"}'
Now check the Index status:
curl -XGET 'http://localhost:9200/twitter/?pretty=true'
!help curl
Automatic doc creation in an index with XPOST:
curl -XPOST ‘http://localhost:9200/twitter/tweet/' -d ‘{“user”:”nullcon”}’
Creating a user profile doc:
curl -XPUT 'http://localhost:9200/twitter/tweet/9' -d '{"user”:”admin”, “role”:”tester”,
“sex”:"male"}'
Searching a doc in an index:
First create 2 docs:
curl -XPOST 'http://localhost:9200/twitter/tester/' -d '{"user":"abcd", "role":"tester",
"sex":"male"}'
curl -XPOST 'http://localhost:9200/twitter/tester/' -d '{"user":"abcd", "role":"admin",
"sex":"male"}'
curl -XGET 'http://localhost:9200/twitter/_search?q=user:abcd&pretty=true'
!help curl
Deleting an doc in an index:
$curl -XDELETE 'http://localhost:9200/twitter/tweet/1'
Cluster Health: (yellow to green)/ Significance of
colours(yellow/green/red)
$curl -XGET ‘http://localhost:9200/_cluster/health?pretty=true’
$./elasticsearch -D es.config=../config/elasticsearch2.yml &
Installing Kibana
$cd /var/www/html
$curl –O https://download.elasticsearch.org/kibana/kibana/kibana-
3.1.2.tar.gz
$tar –xzvf kibana-3.1.2.tar.gz
$mv kibana-3.1.2 kibana
Setting up Elasticsearch & Kibana
•Starting your elasticsearch server(default on 9200)
$cd /opt/elasticsearch-1.4.2/bin/
•Edit elasticsearch.yml and add below 2 lines:
● http.cors.enabled: true
● http.cors.allow-origin to the correct protocol, hostname, and port
For example, http://mycompany.com:8080, not
http://mycompany.com:8080/kibana.
$sudo ./elasticsearch &
Attack monitoring using ElasticSearch Logstash and Kibana
Logstash Configuration
● Managing events and logs
● Collect data
● Parse data
● Enrich data
● Store data (search and
visualizing)
} input
} filter
} output
Logstash Input
collectd drupal_dblog elasticsearch
eventlog exec file ganglia gelf gemfire
generator graphite heroku imap irc jmx
log4j lumberjack pipe puppet_facter
rabbitmq redis relp s3 snmptrap sqlite
sqs stdin stomp syslog tcp twitter udp
unix varnishlog websocket wmi xmpp
zenoss zeromq
Logstash output!
boundary circonus cloudwatch csv datadog
elasticsearch exec email file ganglia gelf
gemfire google_bigquery google_cloud_storage
graphite graphtastic hipchat http irc jira
juggernaut librato loggly lumberjack
metriccatcher mongodb nagios null opentsdb
pagerduty pipe rabbitmq redis riak riemann s3
sns solr_http sqs statsd stdout stomp syslog
tcp udp websocket xmpp zabbix zeromq
Installing & Configuring Logstash
$cd /opt
$curl –O
https://download.elasticsearch.org/logstash/logstash/lo
gstash-1.4.2.tar.gz
$tar zxvf logstash-1.4.2.tar.gz
•Starting logstash
$cd /opt/logstash-1.4.2/bin/
•Lets start the most basic setup
… continued
run this!
./logstash -e 'input { stdin { } } output
{elasticsearch {host => localhost } }'
Check head plugin
http://localhost:9200/_plugin/head
...continued
Setup - Apache access.log
input {
file {
path => [ "/var/log/apache2/access.log" ]
}
}
filter {
grok {
pattern => "%{COMBINEDAPACHELOG}"
}
}
output {
elasticsearch {
host => localhost
protocol => http
index => “indexname”
}
}
Now do it for syslog
Understanding Grok
Why grok?
actual regex to parse apache logs
Understanding Grok
•Understanding grok nomenclature.
•The syntax for a grok pattern is %{SYNTAX:SEMANTIC}
•SYNTAX is the name of the pattern that will match your text.
● E.g 1337 will be matched by the NUMBER pattern, 254.254.254
will be matched by the IP pattern.
•SEMANTIC is the identifier you give to the piece of text being
matched.
● E.g. 1337 could be the count and 254.254.254 could be a client
making a request
%{NUMBER:count} %{IP:client}
Playing with grok filters
•GROK Playground: https://grokdebug.herokuapp.com/
•Apache access.log event:
123.249.19.22 - - [01/Feb/2015:14:12:13 +0000] "GET /manager/html HTTP/1.1" 404 448
"-" "Mozilla/3.0 (compatible; Indy Library)"
•Matching grok:
%{IPV4} %{USER:ident} %{USER:auth} [%{HTTPDATE:timestamp}] "(?:%{WORD:verb}
%{NOTSPACE:request}(?: HTTP/%{NUMBER:httpversion})?)" %{NUMBER:response}
(?:%{NUMBER:bytes}|-)
•Things can get even more simpler using grok:
%{COMBINEDAPACHELOG}
Log Forwarding using logstash-forwarder
Logstash-Indexer Setup
$sudo mkdir -p /etc/pki/tls/certs
$sudo mkdir /etc/pki/tls/private
$cd /etc/pki/tls; sudo openssl req -x509 -batch -nodes -days 3650 -newkey
rsa:2048 -keyout private/logstash-forwarder.key -out certs/logstash-
forwarder.crt
logstash server(indexer) config
input {
lumberjack {
port => 5000
type => "apache-access"
ssl_certificate => "/etc/pki/tls/certs/logstash-forwarder.crt"
ssl_key => "/etc/pki/tls/private/logstash-forwarder.key"
}
}
Logstash-Shipper Setup
cp logstash-forwarder.crt /etc/pki/tls/certs/logstash-forwarder.crt
logstash-forwarder.conf
{
"network": {
"servers": [ "54.149.159.194:5000" ],
"timeout": 15,
"ssl ca": "/etc/pki/tls/certs/logstash-forwarder.crt"
},
"files": [
{
"paths": [
"/var/log/apache2/access.log"
]
}
]
}
./logstash-forwarder -config logstash-forwarder.conf
How Does your company mitigate DoS?
Logstash Alerting!
When to alert?
Alert based on IP count / UA Count
filter {
grok {
type => "elastic-cluster"
pattern => "%{COMBINEDAPACHELOG}"}
throttle {
before_count => 0
after_count => 5
period => 5
key => "%{clientip}"
add_tag => "throttled"
}
}
output {
if "throttled" in [tags] {
email {
from => "logstash@company.com"
subject => "Production System Alert"
to => "me.himansu@gmail.com"
via => "sendmail"
body => "Alert on %{host} from path
%{path}:nn%{message}"
options => { "location" =>
"/usr/sbin/sendmail" }
}
}
elasticsearch {
host => localhost
} }
More Use cases
modsec_audit.log!!
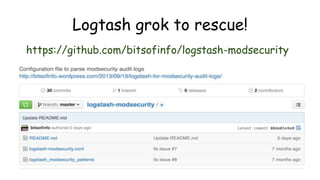
Logtash grok to rescue!
https://github.com/bitsofinfo/logstash-modsecurity
Logstash V/S Fluentd
credits:blog.deimos.fr
fluentd conf file
<source>
type tail
path /var/log/nginx/access.log
pos_file /var/log/td-agent/kibana.log.pos
format nginx
tag nginx.access
</source>
An ELK architecture for Security Monitoring & Alerting
Kibana Dashboard Demo!!
Open monitor.py
Thanks for your time!
Attack monitoring using ElasticSearch Logstash and Kibana

More Related Content

What's hot (20)

PPTX
Log management with ELK
Geert Pante
 
PPTX
WAF Bypass Techniques - Using HTTP Standard and Web Servers’ Behaviour
Soroush Dalili
 
PPTX
Elastic - ELK, Logstash & Kibana
SpringPeople
 
PPTX
An Intro to Elasticsearch and Kibana
ObjectRocket
 
PDF
HTTP Request Smuggling via higher HTTP versions
neexemil
 
PDF
Apache kafka 모니터링을 위한 Metrics 이해 및 최적화 방안
SANG WON PARK
 
PDF
What Is ELK Stack | ELK Tutorial For Beginners | Elasticsearch Kibana | ELK S...
Edureka!
 
PDF
Hacking Adobe Experience Manager sites
Mikhail Egorov
 
PPTX
ELK Elasticsearch Logstash and Kibana Stack for Log Management
El Mahdi Benzekri
 
PPTX
Introduction to ELK
Harshakumar Ummerpillai
 
PDF
Monitoring Microservices
Weaveworks
 
PDF
ELK introduction
Waldemar Neto
 
PDF
How to improve ELK log pipeline performance
Steven Shim
 
PDF
Building Advanced XSS Vectors
Rodolfo Assis (Brute)
 
PDF
Frans Rosén Keynote at BSides Ahmedabad
Security BSides Ahmedabad
 
PDF
Pinot: Realtime Distributed OLAP datastore
Kishore Gopalakrishna
 
PDF
Elasticsearch in Netflix
Danny Yuan
 
PPTX
Alfresco Certificates
Angel Borroy López
 
ODP
Monitoring With Prometheus
Knoldus Inc.
 
PDF
OWASP SD: Deserialize My Shorts: Or How I Learned To Start Worrying and Hate ...
Christopher Frohoff
 
Log management with ELK
Geert Pante
 
WAF Bypass Techniques - Using HTTP Standard and Web Servers’ Behaviour
Soroush Dalili
 
Elastic - ELK, Logstash & Kibana
SpringPeople
 
An Intro to Elasticsearch and Kibana
ObjectRocket
 
HTTP Request Smuggling via higher HTTP versions
neexemil
 
Apache kafka 모니터링을 위한 Metrics 이해 및 최적화 방안
SANG WON PARK
 
What Is ELK Stack | ELK Tutorial For Beginners | Elasticsearch Kibana | ELK S...
Edureka!
 
Hacking Adobe Experience Manager sites
Mikhail Egorov
 
ELK Elasticsearch Logstash and Kibana Stack for Log Management
El Mahdi Benzekri
 
Introduction to ELK
Harshakumar Ummerpillai
 
Monitoring Microservices
Weaveworks
 
ELK introduction
Waldemar Neto
 
How to improve ELK log pipeline performance
Steven Shim
 
Building Advanced XSS Vectors
Rodolfo Assis (Brute)
 
Frans Rosén Keynote at BSides Ahmedabad
Security BSides Ahmedabad
 
Pinot: Realtime Distributed OLAP datastore
Kishore Gopalakrishna
 
Elasticsearch in Netflix
Danny Yuan
 
Alfresco Certificates
Angel Borroy López
 
Monitoring With Prometheus
Knoldus Inc.
 
OWASP SD: Deserialize My Shorts: Or How I Learned To Start Worrying and Hate ...
Christopher Frohoff
 

Viewers also liked (8)

PPTX
Elk stack
Jilles van Gurp
 
PDF
Logging with Elasticsearch, Logstash & Kibana
Amazee Labs
 
PPT
How ElasticSearch lives in my DevOps life
琛琳 饶
 
PDF
Monitoring with Graylog - a modern approach to monitoring?
inovex GmbH
 
PPTX
Webinar usando graylog para la gestión centralizada de logs
atSistemas
 
PPT
Logstash
琛琳 饶
 
PDF
Application Logging With Logstash
benwaine
 
PDF
Advanced troubleshooting linux performance
Forthscale
 
Elk stack
Jilles van Gurp
 
Logging with Elasticsearch, Logstash & Kibana
Amazee Labs
 
How ElasticSearch lives in my DevOps life
琛琳 饶
 
Monitoring with Graylog - a modern approach to monitoring?
inovex GmbH
 
Webinar usando graylog para la gestión centralizada de logs
atSistemas
 
Logstash
琛琳 饶
 
Application Logging With Logstash
benwaine
 
Advanced troubleshooting linux performance
Forthscale
 
Ad

Similar to Attack monitoring using ElasticSearch Logstash and Kibana (20)

PDF
Null Bachaav - May 07 Attack Monitoring workshop.
Prajal Kulkarni
 
PDF
The elastic stack on docker
SmartWave
 
PDF
Anwendungsfälle für Elasticsearch JAX 2015
Florian Hopf
 
PPTX
introduction to node.js
orkaplan
 
PPTX
Managing Your Security Logs with Elasticsearch
Vic Hargrave
 
PPTX
06 integrate elasticsearch
Erhwen Kuo
 
PDF
Workshop: Learning Elasticsearch
Anurag Patel
 
PDF
Learning the basics of Apache NiFi for iot OSS Europe 2020
Timothy Spann
 
PDF
15th Athens Big Data Meetup - 1st Talk - Running Spark On Mesos
Athens Big Data
 
PPTX
Introduction to ELK
YuHsuan Chen
 
PDF
Managing Your Content with Elasticsearch
Samantha Quiñones
 
PDF
Anwendungsfälle für Elasticsearch JavaLand 2015
Florian Hopf
 
PDF
[2D1]Elasticsearch 성능 최적화
NAVER D2
 
PPTX
Introduction to Apache Camel
Claus Ibsen
 
PDF
[2 d1] elasticsearch 성능 최적화
Henry Jeong
 
PDF
Docker Logging and analysing with Elastic Stack
Jakub Hajek
 
PDF
Docker Logging and analysing with Elastic Stack - Jakub Hajek
PROIDEA
 
PPTX
ETL with SPARK - First Spark London meetup
Rafal Kwasny
 
PDF
Rapid Prototyping with Solr
Erik Hatcher
 
PPTX
Scaling Massive Elasticsearch Clusters
Sematext Group, Inc.
 
Null Bachaav - May 07 Attack Monitoring workshop.
Prajal Kulkarni
 
The elastic stack on docker
SmartWave
 
Anwendungsfälle für Elasticsearch JAX 2015
Florian Hopf
 
introduction to node.js
orkaplan
 
Managing Your Security Logs with Elasticsearch
Vic Hargrave
 
06 integrate elasticsearch
Erhwen Kuo
 
Workshop: Learning Elasticsearch
Anurag Patel
 
Learning the basics of Apache NiFi for iot OSS Europe 2020
Timothy Spann
 
15th Athens Big Data Meetup - 1st Talk - Running Spark On Mesos
Athens Big Data
 
Introduction to ELK
YuHsuan Chen
 
Managing Your Content with Elasticsearch
Samantha Quiñones
 
Anwendungsfälle für Elasticsearch JavaLand 2015
Florian Hopf
 
[2D1]Elasticsearch 성능 최적화
NAVER D2
 
Introduction to Apache Camel
Claus Ibsen
 
[2 d1] elasticsearch 성능 최적화
Henry Jeong
 
Docker Logging and analysing with Elastic Stack
Jakub Hajek
 
Docker Logging and analysing with Elastic Stack - Jakub Hajek
PROIDEA
 
ETL with SPARK - First Spark London meetup
Rafal Kwasny
 
Rapid Prototyping with Solr
Erik Hatcher
 
Scaling Massive Elasticsearch Clusters
Sematext Group, Inc.
 
Ad

Recently uploaded (20)

PPTX
apidays Helsinki & North 2025 - APIs at Scale: Designing for Alignment, Trust...
apidays
 
PDF
Driving Employee Engagement in a Hybrid World.pdf
Mia scott
 
PDF
apidays Singapore 2025 - How APIs can make - or break - trust in your AI by S...
apidays
 
PDF
apidays Singapore 2025 - Trustworthy Generative AI: The Role of Observability...
apidays
 
PDF
InformaticsPractices-MS - Google Docs.pdf
seshuashwin0829
 
PDF
Development and validation of the Japanese version of the Organizational Matt...
Yoga Tokuyoshi
 
PPTX
apidays Helsinki & North 2025 - API access control strategies beyond JWT bear...
apidays
 
PPTX
Feb 2021 Ransomware Recovery presentation.pptx
enginsayin1
 
PDF
Technical-Report-GPS_GIS_RS-for-MSF-finalv2.pdf
KPycho
 
PPTX
apidays Singapore 2025 - From Data to Insights: Building AI-Powered Data APIs...
apidays
 
PPTX
03_Ariane BERCKMOES_Ethias.pptx_AIBarometer_release_event
FinTech Belgium
 
PDF
OOPs with Java_unit2.pdf. sarthak bookkk
Sarthak964187
 
PDF
JavaScript - Good or Bad? Tips for Google Tag Manager
📊 Markus Baersch
 
PDF
A GraphRAG approach for Energy Efficiency Q&A
Marco Brambilla
 
PPTX
SHREYAS25 INTERN-I,II,III PPT (1).pptx pre
swapnilherage
 
PPTX
How to Add Columns and Rows in an R Data Frame
subhashenia
 
PPT
tuberculosiship-2106031cyyfuftufufufivifviviv
AkshaiRam
 
PDF
The Best NVIDIA GPUs for LLM Inference in 2025.pdf
Tamanna36
 
PDF
apidays Singapore 2025 - The API Playbook for AI by Shin Wee Chuang (PAND AI)
apidays
 
PPTX
apidays Helsinki & North 2025 - Running a Successful API Program: Best Practi...
apidays
 
apidays Helsinki & North 2025 - APIs at Scale: Designing for Alignment, Trust...
apidays
 
Driving Employee Engagement in a Hybrid World.pdf
Mia scott
 
apidays Singapore 2025 - How APIs can make - or break - trust in your AI by S...
apidays
 
apidays Singapore 2025 - Trustworthy Generative AI: The Role of Observability...
apidays
 
InformaticsPractices-MS - Google Docs.pdf
seshuashwin0829
 
Development and validation of the Japanese version of the Organizational Matt...
Yoga Tokuyoshi
 
apidays Helsinki & North 2025 - API access control strategies beyond JWT bear...
apidays
 
Feb 2021 Ransomware Recovery presentation.pptx
enginsayin1
 
Technical-Report-GPS_GIS_RS-for-MSF-finalv2.pdf
KPycho
 
apidays Singapore 2025 - From Data to Insights: Building AI-Powered Data APIs...
apidays
 
03_Ariane BERCKMOES_Ethias.pptx_AIBarometer_release_event
FinTech Belgium
 
OOPs with Java_unit2.pdf. sarthak bookkk
Sarthak964187
 
JavaScript - Good or Bad? Tips for Google Tag Manager
📊 Markus Baersch
 
A GraphRAG approach for Energy Efficiency Q&A
Marco Brambilla
 
SHREYAS25 INTERN-I,II,III PPT (1).pptx pre
swapnilherage
 
How to Add Columns and Rows in an R Data Frame
subhashenia
 
tuberculosiship-2106031cyyfuftufufufivifviviv
AkshaiRam
 
The Best NVIDIA GPUs for LLM Inference in 2025.pdf
Tamanna36
 
apidays Singapore 2025 - The API Playbook for AI by Shin Wee Chuang (PAND AI)
apidays
 
apidays Helsinki & North 2025 - Running a Successful API Program: Best Practi...
apidays
 

Attack monitoring using ElasticSearch Logstash and Kibana

  • 1. Attack Monitoring Using ELK @Nullcon Goa 2015 @prajalkulkarni @mehimansu
  • 2. About Us @prajalkulkarni -Security Analyst @flipkart.com -Interested in webapps, mobile, loves scripting in python -Fan of cricket! and a wannabe guitarist! @mehimansu -Security Analyst @flipkart.com -CTF Player - Team SegFault -Interested in binaries, fuzzing
  • 4. Today’s workshop agenda •Overview & Architecture of ELK •Setting up & configuring ELK •Logstash forwarder •Alerting And Attack monitoring
  • 5. What does the vm contains? ● Extracted ELK Tar files in /opt/ ● java version "1.7.0_76" ● Apache installed ● Logstash-forwarder package
  • 7. Why ELK? Old School ● grep/sed/awk/cut/sort ● manually analyze the output ELK ● define endpoints(input/output) ● correlate patterns ● store data(search and visualize)
  • 8. Other SIEM Market Solutions! ● Symantec Security Information Manager ● Splunk ● HP/Arcsight ● Tripwire ● NetIQ ● Quest Software ● IBM/Q1 Labs ● Novell ● Enterprise Security Manager
  • 9. Overview of Elasticsearch •Open source search server written in Java •Used to index any kind of heterogeneous data •Enables real-time ability to search through index •Has REST API web-interface with JSON output
  • 10. Overview of Logstash •Framework for managing logs •Founded by Jordan Sissel •Mainly consists of 3 components: ● input : passing logs to process them into machine understandable format(file,lumberjack). ● filters: set of conditionals to perform specific action on a event(grok,geoip). ● output: decision maker for processed event/log(elasticsearch,file)
  • 11. •Powerful front-end dashboard for visualizing indexed information from elastic cluster. •Capable to providing historical data in form of graphs,charts,etc. •Enables real-time search of indexed information. Overview of Kibana
  • 13. Let’s Setup ELK Make sure about the update/dependencies! $sudo apt-get update $sudo add-apt-repository -y ppa:webupd8team/java $sudo apt-get update $sudo apt-get -y install oracle-java7-installer $sudo apt-get install apache2
  • 14. Installing Elasticsearch $cd /opt $curl –O https://download.elasticsearch.org/elasticsearch/elasticsearch/elasticsea rch-1.4.2.tar.gz $tar -zxvf elasticsearch-1.4.2.tar.gz $cd elasticsearch-1.4.2/
  • 15. edit elasticsearch.yml $sudo nano /opt/elasticsearch/config/elasticsearch.yml ctrl+w search for ”cluster.name” Change the cluster name to elastic_yourname ctrl+x Y Now start ElasticSearch sudo ./elasticsearch
  • 16. Verifying Elasticsearch Installation $curl –XGET http://localhost:9200 Expected Output: { "status" : 200, "name" : "Edwin Jarvis", "cluster_name" : "elastic_yourname", "version" : { "number" : "1.4.2", "build_hash" : "927caff6f05403e936c20bf4529f144f0c89fd8c", "build_timestamp" : "2014-12-16T14:11:12Z", "build_snapshot" : false, "lucene_version" : "4.10.2" }, "tagline" : "You Know, for Search" }
  • 17. Terminologies of Elastic Search! Cluster ● A cluster is a collection of one or more nodes (servers) that together holds your entire data and provides federated indexing and search capabilities across all nodes ● A cluster is identified by a unique name which by default is "elasticsearch"
  • 18. Terminologies of Elastic Search! Node ● It is an elasticsearch instance (a java process) ● A node is created when a elasticsearch instance is started ● A random Marvel Charater name is allocated by default
  • 19. Terminologies of Elastic Search! Index ● An index is a collection of documents that have somewhat similar characteristics. eg:customer data, product catalog ● Very crucial while performing indexing, search, update, and delete operations against the documents in it ● One can define as many indexes in one single cluster
  • 20. Document ● It is the most basic unit of information which can be indexed ● It is expressed in json (key:value) pair. ‘{“user”:”nullcon”}’ ● Every Document gets associated with a type and a unique id. Terminologies of Elastic Search!
  • 21. Terminologies of Elastic Search! Shard ● Every index can be split into multiple shards to be able to distribute data. ● The shard is the atomic part of an index, which can be distributed over the cluster if you add more nodes. ● By default 5 primary shards and 1 replica shards are created while starting elasticsearch ____ ____ | 1 | | 2 | | 3 | | 4 | | 5 | |____| |____| ● Atleast 2 Nodes are required for replicas to be created
  • 23. Plugins of Elasticsearch head ./plugin -install mobz/elasticsearch-head HQ ./plugin -install royrusso/elasticsearch-HQ Bigdesk ./plugin -install lukas-vlcek/bigdesk
  • 24. Restful API’s over http -- !help curl curl -X<VERB> '<PROTOCOL>://<HOST>/<PATH>?<QUERY_STRING>' -d '<BODY>' ● VERB-The appropriate HTTP method or verb: GET, POST, PUT, HEAD, or DELETE. ● PROTOCOL-Either http or https (if you have an https proxy in front of Elasticsearch.) ● HOST-The hostname of any node in your Elasticsearch cluster, or localhost for a node on your local machine. ● PORT-The port running the Elasticsearch HTTP service, which defaults to 9200. ● QUERY_STRING-Any optional query-string parameters (for example ?pretty will pretty-print the JSON response to make it easier to read.) ● BODY-A JSON encoded request body (if the request needs one.)
  • 25. !help curl Simple Index Creation with XPUT: curl -XPUT 'http://localhost:9200/twitter/' Add data to your created index: curl -XPUT 'http://localhost:9200/twitter/tweet/1' -d '{"user":"nullcon"}' Now check the Index status: curl -XGET 'http://localhost:9200/twitter/?pretty=true'
  • 26. !help curl Automatic doc creation in an index with XPOST: curl -XPOST ‘http://localhost:9200/twitter/tweet/' -d ‘{“user”:”nullcon”}’ Creating a user profile doc: curl -XPUT 'http://localhost:9200/twitter/tweet/9' -d '{"user”:”admin”, “role”:”tester”, “sex”:"male"}' Searching a doc in an index: First create 2 docs: curl -XPOST 'http://localhost:9200/twitter/tester/' -d '{"user":"abcd", "role":"tester", "sex":"male"}' curl -XPOST 'http://localhost:9200/twitter/tester/' -d '{"user":"abcd", "role":"admin", "sex":"male"}' curl -XGET 'http://localhost:9200/twitter/_search?q=user:abcd&pretty=true'
  • 27. !help curl Deleting an doc in an index: $curl -XDELETE 'http://localhost:9200/twitter/tweet/1' Cluster Health: (yellow to green)/ Significance of colours(yellow/green/red) $curl -XGET ‘http://localhost:9200/_cluster/health?pretty=true’ $./elasticsearch -D es.config=../config/elasticsearch2.yml &
  • 28. Installing Kibana $cd /var/www/html $curl –O https://download.elasticsearch.org/kibana/kibana/kibana- 3.1.2.tar.gz $tar –xzvf kibana-3.1.2.tar.gz $mv kibana-3.1.2 kibana
  • 29. Setting up Elasticsearch & Kibana •Starting your elasticsearch server(default on 9200) $cd /opt/elasticsearch-1.4.2/bin/ •Edit elasticsearch.yml and add below 2 lines: ● http.cors.enabled: true ● http.cors.allow-origin to the correct protocol, hostname, and port For example, http://mycompany.com:8080, not http://mycompany.com:8080/kibana. $sudo ./elasticsearch &
  • 31. Logstash Configuration ● Managing events and logs ● Collect data ● Parse data ● Enrich data ● Store data (search and visualizing) } input } filter } output
  • 32. Logstash Input collectd drupal_dblog elasticsearch eventlog exec file ganglia gelf gemfire generator graphite heroku imap irc jmx log4j lumberjack pipe puppet_facter rabbitmq redis relp s3 snmptrap sqlite sqs stdin stomp syslog tcp twitter udp unix varnishlog websocket wmi xmpp zenoss zeromq
  • 33. Logstash output! boundary circonus cloudwatch csv datadog elasticsearch exec email file ganglia gelf gemfire google_bigquery google_cloud_storage graphite graphtastic hipchat http irc jira juggernaut librato loggly lumberjack metriccatcher mongodb nagios null opentsdb pagerduty pipe rabbitmq redis riak riemann s3 sns solr_http sqs statsd stdout stomp syslog tcp udp websocket xmpp zabbix zeromq
  • 34. Installing & Configuring Logstash $cd /opt $curl –O https://download.elasticsearch.org/logstash/logstash/lo gstash-1.4.2.tar.gz $tar zxvf logstash-1.4.2.tar.gz
  • 35. •Starting logstash $cd /opt/logstash-1.4.2/bin/ •Lets start the most basic setup … continued
  • 36. run this! ./logstash -e 'input { stdin { } } output {elasticsearch {host => localhost } }' Check head plugin http://localhost:9200/_plugin/head
  • 37. ...continued Setup - Apache access.log input { file { path => [ "/var/log/apache2/access.log" ] } } filter { grok { pattern => "%{COMBINEDAPACHELOG}" } } output { elasticsearch { host => localhost protocol => http index => “indexname” } }
  • 38. Now do it for syslog
  • 39. Understanding Grok Why grok? actual regex to parse apache logs
  • 40. Understanding Grok •Understanding grok nomenclature. •The syntax for a grok pattern is %{SYNTAX:SEMANTIC} •SYNTAX is the name of the pattern that will match your text. ● E.g 1337 will be matched by the NUMBER pattern, 254.254.254 will be matched by the IP pattern. •SEMANTIC is the identifier you give to the piece of text being matched. ● E.g. 1337 could be the count and 254.254.254 could be a client making a request %{NUMBER:count} %{IP:client}
  • 41. Playing with grok filters •GROK Playground: https://grokdebug.herokuapp.com/ •Apache access.log event: 123.249.19.22 - - [01/Feb/2015:14:12:13 +0000] "GET /manager/html HTTP/1.1" 404 448 "-" "Mozilla/3.0 (compatible; Indy Library)" •Matching grok: %{IPV4} %{USER:ident} %{USER:auth} [%{HTTPDATE:timestamp}] "(?:%{WORD:verb} %{NOTSPACE:request}(?: HTTP/%{NUMBER:httpversion})?)" %{NUMBER:response} (?:%{NUMBER:bytes}|-) •Things can get even more simpler using grok: %{COMBINEDAPACHELOG}
  • 42. Log Forwarding using logstash-forwarder
  • 43. Logstash-Indexer Setup $sudo mkdir -p /etc/pki/tls/certs $sudo mkdir /etc/pki/tls/private $cd /etc/pki/tls; sudo openssl req -x509 -batch -nodes -days 3650 -newkey rsa:2048 -keyout private/logstash-forwarder.key -out certs/logstash- forwarder.crt
  • 44. logstash server(indexer) config input { lumberjack { port => 5000 type => "apache-access" ssl_certificate => "/etc/pki/tls/certs/logstash-forwarder.crt" ssl_key => "/etc/pki/tls/private/logstash-forwarder.key" } }
  • 45. Logstash-Shipper Setup cp logstash-forwarder.crt /etc/pki/tls/certs/logstash-forwarder.crt logstash-forwarder.conf { "network": { "servers": [ "54.149.159.194:5000" ], "timeout": 15, "ssl ca": "/etc/pki/tls/certs/logstash-forwarder.crt" }, "files": [ { "paths": [ "/var/log/apache2/access.log" ] } ] } ./logstash-forwarder -config logstash-forwarder.conf
  • 46. How Does your company mitigate DoS?
  • 47. Logstash Alerting! When to alert? Alert based on IP count / UA Count
  • 48. filter { grok { type => "elastic-cluster" pattern => "%{COMBINEDAPACHELOG}"} throttle { before_count => 0 after_count => 5 period => 5 key => "%{clientip}" add_tag => "throttled" } } output { if "throttled" in [tags] { email { from => "[email protected]" subject => "Production System Alert" to => "[email protected]" via => "sendmail" body => "Alert on %{host} from path %{path}:nn%{message}" options => { "location" => "/usr/sbin/sendmail" } } } elasticsearch { host => localhost } }
  • 51. Logtash grok to rescue! https://github.com/bitsofinfo/logstash-modsecurity
  • 53. fluentd conf file <source> type tail path /var/log/nginx/access.log pos_file /var/log/td-agent/kibana.log.pos format nginx tag nginx.access </source>
  • 54. An ELK architecture for Security Monitoring & Alerting

Editor's Notes

  • #6: java -version apache2 -version
  • #49: if "throttled" in [tags] { drop { } }