SlideShare a Scribd company logo
7
Most read
8
Most read
14
Most read
Confidential Customized for Lorem Ipsum LLC Version 1.0
Basic of Python for
Data Analysis
Pramod Toraskar.
Why learn Python for data analysis?
Here are some reasons which go in favour of learning Python:
● Open Source – free to install
● Awesome online community
● Very easy to learn
● Can become a common language for data science and production of web based analytics products.
Choosing a development environment
1
Terminal / Shell based
2
IDLE (default environment)
3
iPython notebook – similar to markdown in
R
iPython environment - jupyter
http://jupyter-notebook-beginner-
guide.readthedocs.io/en/latest/install.html
Recall Python libraries and Data Structures
Lists, Strings, Tuples, Dictionary..
Following are a list of libraries, you will need for any scientific computations and data
analysis:
● NumPy (Numerical Python). The most powerful feature of NumPy is n-dimensional array. This library
also contains basic linear algebra functions, Fourier transforms, advanced random number capabilities
and tools for integration with other low level languages like Fortran, C and C++
● SciPy (Scientific Python). SciPy is built on NumPy. It is one of the most useful library for variety of high
level science and engineering modules like discrete Fourier transform, Linear Algebra, Optimization
and Sparse matrices.
● Matplotlib for plotting vast variety of graphs, starting from histograms to line plots to heat plots..
You can use Pylab feature in ipython notebook (ipython notebook –pylab = inline) to use these plotting
features inline. If you ignore the inline option, then pylab converts ipython environment to an
environment, very similar to Matlab. You can also use Latex commands to add math to your plot.
● Pandas for structured data operations and manipulations. It is extensively used for data munging and
preparation. Pandas were added relatively recently to Python and have been instrumental in boosting
Python’s usage in data scientist community.
● Scikit Learn for machine learning. Built on NumPy, SciPy and matplotlib, this library contains a lot of
efficient tools for machine learning and statistical modeling including classification, regression,
clustering and dimensionality reduction.
● Statsmodels (statistical modeling), Seaborn (statistical data visualization), Bokeh (creating interactive
plots, dashboards and data applications on modern web-browsers. It empowers the user to generate
elegant and concise graphics in the style of D3.js.)
Key phases
The 3 key phases
01
Data Exploration:
Finding out more about the data we have
● numpy
● matplotlib
● Pandas
import pandas as pd
import numpy as np
import matplotlib as plt
df = pd.read_csv("/home/ptoraska/Downloads/Loan_Prediction/train.csv")
#Reading the dataset in a dataframe using Pandas
QUICK TIP
Try right clicking on a photo and
using "Replace Image" to show
your own photo.
Data
Exploration
Once you have read the dataset, you can have a look at few top rows by
using the function head()
df.head(10)
The 3 key phases
02
Data Munging:
Cleaning the data and playing with it to make it better suit statistical
modeling.
1. There are missing values in some variables. We should
estimate those values wisely depending on the amount of
missing values and the expected importance of variables.
1. While looking at the distributions, we saw that Applicant
Income and Loan Amount seemed to contain extreme values
at either end. Though they might make intuitive sense, but
should be treated appropriately.
Check missing
values in the
dataset
Let us look at missing values in all the variables because most of the models
don’t work with missing data and even if they do, imputing them helps more
often than not. So, let us check the number of nulls / NaNs in the dataset
df.apply(lambda x: sum(x.isnull()),axis=0)
The 3 key phases
03
Predictive Modeling:
Running the actual algorithms and having fun
After, we have made the data useful for modeling, The Skicit-
Learn (sklearn) is the most commonly used library in Python
for this purpose
Building a
Predictive
Model in Python
sklearn requires all inputs to be numeric, we should convert all our
categorical variables into numeric by encoding the categories.
This can be done using the following code:
from sklearn.preprocessingimport LabelEncoder
var_mod =
['Gender','Married','Dependents','Education','Self_Employed','Property_Are
a','Loan_Status']
le = LabelEncoder()
for i in var_mod:
df[i] = le.fit_transform(df[i])
df.dtypes
Model’s
Logistic
Regression
Is a classification algorithm
Decision Tree
is a type of supervised
learning algorithm (having a
pre-defined target variable)
that is mostly used in
classification problems.
Random Forest
Is a versatile machine learning
method capable of performing
both regression and
classification tasks.
Thank you.

More Related Content

What's hot (20)

ODP
Data Analysis in Python
Richard Herrell
 
PPTX
Map Reduce
Prashant Gupta
 
PPTX
Python pandas Library
Md. Sohag Miah
 
PDF
Introduction to Python Pandas for Data Analytics
Phoenix
 
PPTX
What’s The Difference Between Structured, Semi-Structured And Unstructured Data?
Bernard Marr
 
PPT
Python Pandas
Sunil OS
 
PPTX
Python Seaborn Data Visualization
Sourabh Sahu
 
PPTX
Introduction to pandas
Piyush rai
 
PPTX
Data warehousing
Shruti Dalela
 
PDF
The Data Science Process
Vishal Patel
 
PPTX
Data science life cycle
Manoj Mishra
 
PPTX
introduction to data science
bhavesh lande
 
PDF
pandas: Powerful data analysis tools for Python
Wes McKinney
 
PDF
Hadoop Overview & Architecture
EMC
 
PPTX
Data Visualization & Analytics.pptx
hiralpatel3085
 
PDF
Data Analysis and Visualization using Python
Chariza Pladin
 
PDF
pandas - Python Data Analysis
Andrew Henshaw
 
PPTX
Introduction to data analysis using python
Guido Luz Percú
 
PPTX
1. Data Analytics-introduction
krishna singh
 
PDF
Introduction to Hadoop
Apache Apex
 
Data Analysis in Python
Richard Herrell
 
Map Reduce
Prashant Gupta
 
Python pandas Library
Md. Sohag Miah
 
Introduction to Python Pandas for Data Analytics
Phoenix
 
What’s The Difference Between Structured, Semi-Structured And Unstructured Data?
Bernard Marr
 
Python Pandas
Sunil OS
 
Python Seaborn Data Visualization
Sourabh Sahu
 
Introduction to pandas
Piyush rai
 
Data warehousing
Shruti Dalela
 
The Data Science Process
Vishal Patel
 
Data science life cycle
Manoj Mishra
 
introduction to data science
bhavesh lande
 
pandas: Powerful data analysis tools for Python
Wes McKinney
 
Hadoop Overview & Architecture
EMC
 
Data Visualization & Analytics.pptx
hiralpatel3085
 
Data Analysis and Visualization using Python
Chariza Pladin
 
pandas - Python Data Analysis
Andrew Henshaw
 
Introduction to data analysis using python
Guido Luz Percú
 
1. Data Analytics-introduction
krishna singh
 
Introduction to Hadoop
Apache Apex
 

Similar to Basic of python for data analysis (20)

PPTX
Python ml
Shubham Sharma
 
PPTX
Artificial Intelligence concepts in a Nutshell
kannanalagu1
 
PDF
Python for Data Science: A Comprehensive Guide
priyanka rajput
 
PPTX
Data Science With Python | Python For Data Science | Python Data Science Cour...
Simplilearn
 
PPTX
Data analysis using python in Jupyter notebook.pptx
ssuserc26f8f
 
PPTX
Adarsh_Masekar(2GP19CS003).pptx
hkabir55
 
DOCX
employee turnover prediction document.docx
rohithprabhas1
 
PPTX
Session 2
HarithaAshok3
 
ODP
Five python libraries should know for machine learning
Naveen Davis
 
PPTX
Internship (7)gfytfyugiujhoiipobjhvyuhjkb jh
sidd233245456df
 
PPTX
Internship (7)szgsdgszdssagsagzsvszszvsvszfvsz
sidd233245456df
 
PDF
Big Data Analytics (ML, DL, AI) hands-on
Dony Riyanto
 
PPT
A Hands-on Intro to Data Science and R Presentation.ppt
Sanket Shikhar
 
PDF
Data Analytics with Python: A Comprehensive Approach - CETPA Infotech
Cetpa Infotech Pvt Ltd
 
PPTX
Python libraries
Venkat Projects
 
PPTX
Intellectual technologies
Polad Saruxanov
 
PDF
First Steps in Python Programming
Dozie Agbo
 
PPTX
Python for ML
Reza Sadeghi Jafari
 
PPTX
Intoduction to Python Libraries in detail.pptx
KousarNadaf2
 
PPTX
Introduction to Python Libraries in details.pptx
KousarNadaf2
 
Python ml
Shubham Sharma
 
Artificial Intelligence concepts in a Nutshell
kannanalagu1
 
Python for Data Science: A Comprehensive Guide
priyanka rajput
 
Data Science With Python | Python For Data Science | Python Data Science Cour...
Simplilearn
 
Data analysis using python in Jupyter notebook.pptx
ssuserc26f8f
 
Adarsh_Masekar(2GP19CS003).pptx
hkabir55
 
employee turnover prediction document.docx
rohithprabhas1
 
Session 2
HarithaAshok3
 
Five python libraries should know for machine learning
Naveen Davis
 
Internship (7)gfytfyugiujhoiipobjhvyuhjkb jh
sidd233245456df
 
Internship (7)szgsdgszdssagsagzsvszszvsvszfvsz
sidd233245456df
 
Big Data Analytics (ML, DL, AI) hands-on
Dony Riyanto
 
A Hands-on Intro to Data Science and R Presentation.ppt
Sanket Shikhar
 
Data Analytics with Python: A Comprehensive Approach - CETPA Infotech
Cetpa Infotech Pvt Ltd
 
Python libraries
Venkat Projects
 
Intellectual technologies
Polad Saruxanov
 
First Steps in Python Programming
Dozie Agbo
 
Python for ML
Reza Sadeghi Jafari
 
Intoduction to Python Libraries in detail.pptx
KousarNadaf2
 
Introduction to Python Libraries in details.pptx
KousarNadaf2
 
Ad

Recently uploaded (20)

PPTX
apidays Helsinki & North 2025 - APIs at Scale: Designing for Alignment, Trust...
apidays
 
PPTX
03_Ariane BERCKMOES_Ethias.pptx_AIBarometer_release_event
FinTech Belgium
 
PDF
Development and validation of the Japanese version of the Organizational Matt...
Yoga Tokuyoshi
 
PDF
Using AI/ML for Space Biology Research
VICTOR MAESTRE RAMIREZ
 
PDF
apidays Singapore 2025 - The API Playbook for AI by Shin Wee Chuang (PAND AI)
apidays
 
PPTX
SHREYAS25 INTERN-I,II,III PPT (1).pptx pre
swapnilherage
 
PDF
NIS2 Compliance for MSPs: Roadmap, Benefits & Cybersecurity Trends (2025 Guide)
GRC Kompas
 
PPTX
What Is Data Integration and Transformation?
subhashenia
 
PPTX
apidays Helsinki & North 2025 - Agentic AI: A Friend or Foe?, Merja Kajava (A...
apidays
 
PPTX
b6057ea5-8e8c-4415-90c0-ed8e9666ffcd.pptx
Anees487379
 
PPTX
big data eco system fundamentals of data science
arivukarasi
 
PPTX
Listify-Intelligent-Voice-to-Catalog-Agent.pptx
nareshkottees
 
PDF
Optimizing Large Language Models with vLLM and Related Tools.pdf
Tamanna36
 
PPT
tuberculosiship-2106031cyyfuftufufufivifviviv
AkshaiRam
 
PDF
apidays Singapore 2025 - How APIs can make - or break - trust in your AI by S...
apidays
 
PPTX
Aict presentation on dpplppp sjdhfh.pptx
vabaso5932
 
PPTX
Powerful Uses of Data Analytics You Should Know
subhashenia
 
PDF
apidays Singapore 2025 - Trustworthy Generative AI: The Role of Observability...
apidays
 
PPTX
Feb 2021 Ransomware Recovery presentation.pptx
enginsayin1
 
PDF
Business implication of Artificial Intelligence.pdf
VishalChugh12
 
apidays Helsinki & North 2025 - APIs at Scale: Designing for Alignment, Trust...
apidays
 
03_Ariane BERCKMOES_Ethias.pptx_AIBarometer_release_event
FinTech Belgium
 
Development and validation of the Japanese version of the Organizational Matt...
Yoga Tokuyoshi
 
Using AI/ML for Space Biology Research
VICTOR MAESTRE RAMIREZ
 
apidays Singapore 2025 - The API Playbook for AI by Shin Wee Chuang (PAND AI)
apidays
 
SHREYAS25 INTERN-I,II,III PPT (1).pptx pre
swapnilherage
 
NIS2 Compliance for MSPs: Roadmap, Benefits & Cybersecurity Trends (2025 Guide)
GRC Kompas
 
What Is Data Integration and Transformation?
subhashenia
 
apidays Helsinki & North 2025 - Agentic AI: A Friend or Foe?, Merja Kajava (A...
apidays
 
b6057ea5-8e8c-4415-90c0-ed8e9666ffcd.pptx
Anees487379
 
big data eco system fundamentals of data science
arivukarasi
 
Listify-Intelligent-Voice-to-Catalog-Agent.pptx
nareshkottees
 
Optimizing Large Language Models with vLLM and Related Tools.pdf
Tamanna36
 
tuberculosiship-2106031cyyfuftufufufivifviviv
AkshaiRam
 
apidays Singapore 2025 - How APIs can make - or break - trust in your AI by S...
apidays
 
Aict presentation on dpplppp sjdhfh.pptx
vabaso5932
 
Powerful Uses of Data Analytics You Should Know
subhashenia
 
apidays Singapore 2025 - Trustworthy Generative AI: The Role of Observability...
apidays
 
Feb 2021 Ransomware Recovery presentation.pptx
enginsayin1
 
Business implication of Artificial Intelligence.pdf
VishalChugh12
 
Ad

Basic of python for data analysis

  • 1. Confidential Customized for Lorem Ipsum LLC Version 1.0 Basic of Python for Data Analysis Pramod Toraskar.
  • 2. Why learn Python for data analysis? Here are some reasons which go in favour of learning Python: ● Open Source – free to install ● Awesome online community ● Very easy to learn ● Can become a common language for data science and production of web based analytics products.
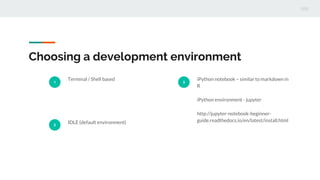
  • 3. Choosing a development environment 1 Terminal / Shell based 2 IDLE (default environment) 3 iPython notebook – similar to markdown in R iPython environment - jupyter http://jupyter-notebook-beginner- guide.readthedocs.io/en/latest/install.html
  • 4. Recall Python libraries and Data Structures Lists, Strings, Tuples, Dictionary.. Following are a list of libraries, you will need for any scientific computations and data analysis: ● NumPy (Numerical Python). The most powerful feature of NumPy is n-dimensional array. This library also contains basic linear algebra functions, Fourier transforms, advanced random number capabilities and tools for integration with other low level languages like Fortran, C and C++ ● SciPy (Scientific Python). SciPy is built on NumPy. It is one of the most useful library for variety of high level science and engineering modules like discrete Fourier transform, Linear Algebra, Optimization and Sparse matrices.
  • 5. ● Matplotlib for plotting vast variety of graphs, starting from histograms to line plots to heat plots.. You can use Pylab feature in ipython notebook (ipython notebook –pylab = inline) to use these plotting features inline. If you ignore the inline option, then pylab converts ipython environment to an environment, very similar to Matlab. You can also use Latex commands to add math to your plot. ● Pandas for structured data operations and manipulations. It is extensively used for data munging and preparation. Pandas were added relatively recently to Python and have been instrumental in boosting Python’s usage in data scientist community. ● Scikit Learn for machine learning. Built on NumPy, SciPy and matplotlib, this library contains a lot of efficient tools for machine learning and statistical modeling including classification, regression, clustering and dimensionality reduction. ● Statsmodels (statistical modeling), Seaborn (statistical data visualization), Bokeh (creating interactive plots, dashboards and data applications on modern web-browsers. It empowers the user to generate elegant and concise graphics in the style of D3.js.)
  • 7. The 3 key phases 01 Data Exploration: Finding out more about the data we have ● numpy ● matplotlib ● Pandas import pandas as pd import numpy as np import matplotlib as plt df = pd.read_csv("/home/ptoraska/Downloads/Loan_Prediction/train.csv") #Reading the dataset in a dataframe using Pandas QUICK TIP Try right clicking on a photo and using "Replace Image" to show your own photo.
  • 8. Data Exploration Once you have read the dataset, you can have a look at few top rows by using the function head() df.head(10)
  • 9. The 3 key phases 02 Data Munging: Cleaning the data and playing with it to make it better suit statistical modeling. 1. There are missing values in some variables. We should estimate those values wisely depending on the amount of missing values and the expected importance of variables. 1. While looking at the distributions, we saw that Applicant Income and Loan Amount seemed to contain extreme values at either end. Though they might make intuitive sense, but should be treated appropriately.
  • 10. Check missing values in the dataset Let us look at missing values in all the variables because most of the models don’t work with missing data and even if they do, imputing them helps more often than not. So, let us check the number of nulls / NaNs in the dataset df.apply(lambda x: sum(x.isnull()),axis=0)
  • 11. The 3 key phases 03 Predictive Modeling: Running the actual algorithms and having fun After, we have made the data useful for modeling, The Skicit- Learn (sklearn) is the most commonly used library in Python for this purpose
  • 12. Building a Predictive Model in Python sklearn requires all inputs to be numeric, we should convert all our categorical variables into numeric by encoding the categories. This can be done using the following code: from sklearn.preprocessingimport LabelEncoder var_mod = ['Gender','Married','Dependents','Education','Self_Employed','Property_Are a','Loan_Status'] le = LabelEncoder() for i in var_mod: df[i] = le.fit_transform(df[i]) df.dtypes
  • 13. Model’s Logistic Regression Is a classification algorithm Decision Tree is a type of supervised learning algorithm (having a pre-defined target variable) that is mostly used in classification problems. Random Forest Is a versatile machine learning method capable of performing both regression and classification tasks.