SlideShare a Scribd company logo
Building useful models for
imbalanced datasets
(without resampling)
Greg Landrum
Feb 2019
T5 Informatics GmbH
greg.landrum@t5informatics.com
@dr_greg_landrum
2T5 Informatics
First things first
● RDKit blog post with initial work:
http://rdkit.blogspot.com/2018/11/working-with-unbalanced-data-part-i.html
● The notebooks I used for this presentation are all in Github:
○ Original notebook: https://bit.ly/2UY2u2K
○ Using the balanced random forest: https://bit.ly/2tuafSc
○ Plotting: https://bit.ly/2GJSeHH
● I have a KNIME workflow that does the same thing. Let me know if you're
interested
● Download links for the datasets are in the blog post
3T5 Informatics
The problem
● Typical datasets for bioactivity prediction tend to have way more inactives
than actives
● This leads to a couple of pathologies:
○ Overall accuracy is really not a good metric for how useful a model is
○ Many learning algorithms produce way too many false negatives
4T5 Informatics
The accuracy problem
Assay: CHEMBL1614421, PUBCHEM_BIOASSAY: qHTS for Inhibitors of Tau Fibril Formation
Predicted inactive Predicted active
Measured inactive 8681 4
Measured active 1102 22
Accuracy is high, but the model is pretty useless for predicting actives
Overall accuracy: 88.7%
5T5 Informatics
The accuracy problem
Assay: CHEMBL1614421, PUBCHEM_BIOASSAY: qHTS for Inhibitors of Tau Fibril Formation
Predicted inactive Predicted active
Measured inactive 8681 4
Measured active 1102 22
Overall accuracy: 88.7%
kappa: 0.033
This one has an easy solution: use Cohen's kappa
https://en.wikipedia.org/wiki/Cohen%27s_kappa
https://link.springer.com/article/10.1007/s10822-014-9759-6
https://www.researchgate.net/publication/258240105_TheKappaStatistic_PaulCzodrowski
kappa makes the problem obvious
6T5 Informatics
Is that model actually useless?
Assay: CHEMBL1614421, PUBCHEM_BIOASSAY: qHTS for Inhibitors of Tau Fibril Formation
Predicted inactive Predicted active
Measured inactive 8681 4
Measured active 1102 22
Overall accuracy: 88.7%
kappa: 0.033
AUC: 0.850
The ROC curve shows that the model has actually
learned something about the bioactivity. Why
aren't we seeing that in the predictions?
7T5 Informatics
Quick diversion on bag classifiers
When making predictions, each tree in the
classifier votes on the result.
Majority wins
In scikit-learn the predicted class probabilities are
the means of the predicted probabilities from the
individual trees
We construct the ROC curve by sorting the
predictions in decreasing order of predicted
probability of being active.
Note that actual predictions are irrelevant for a ROC curve.
As long as true actives tend to have a higher predicted
probability of being active than true inactives the AUC will
be good.
8T5 Informatics
Ok, but who cares?
9T5 Informatics
An idea
● The standard decision rule for a random forest (or any bag classifier) is that
the majority wins1
, i.e. at the predicted probability of being active must be
>=0.5 in order for the model to predict "active"
● Shift that threshold to a lower value for models built on highly imbalanced
datasets2
1
This is only strictly true for binary classifiers
2
F. Provost, T. Fawcett. "Robust classification for imprecise environments." Machine learning 42:203-31 (2001).
10T5 Informatics
How do we come up with a new decision threshold?
1. Generate a random forest for the dataset using a training set
2. Generate out-of-bag predicted probabilities using the training set
3. Try a number of different decision thresholds1
and pick the one that gives the
best kappa
Once we have the decision threshold, use it to generate predictions for the test
set.
1
Here we use: [0.05, 0.1 , 0.15, 0.2 , 0.25, 0.3 , 0.35, 0.4 , 0.45, 0.5 ]
11T5 Informatics
Changing the decision threshold
Assay: CHEMBL1614421, PUBCHEM_BIOASSAY: qHTS for Inhibitors of Tau Fibril Formation
Threshold = 0.5 Predicted inactive Predicted active
Measured inactive 8681 4
Measured active 1101 22
Overall accuracy: 88.7%
kappa: 0.033
Threshold = 0.2 Predicted inactive Predicted active
Measured inactive 8261 424
Measured active 595 528
Overall accuracy: 89.6%
kappa: 0.451kappa has improved dramatically
12T5 Informatics
Why does it work?
Prob(active)
Superimpose Prob(active) on the ROC curve
13T5 Informatics
Why does it work?
The predicted probabilities of being active are clearly carrying
significant information about activity
Prob(active)
Superimpose Prob(active) on the ROC curve Plot TPR and FPR vs -Prob(active)
14T5 Informatics
It works!
● By shifting the decision threshold from 0.5->0.2 we managed to improve the
predictivity of the model, as measured by kappa, from 0.033 to 0.451
● We did not need to retrain/change the model at all.
Yay! We're done!
15T5 Informatics
It works!
● By shifting the decision threshold from 0.5->0.2 we managed to improve the
predictivity of the model, as measured by kappa, from 0.033 to 0.451
● We did not need to retrain/change the model at all.
Not quite done yet!
● This is just one model. Does this approach work broadly?
● Let's try a broad collection of datasets
16T5 Informatics
The datasets (all extracted from ChEMBL_24)
● "Serotonin": 6 datasets with >900 Ki values for human serotonin receptors
○ Active: pKi > 9.0, Inactive: pKi < 8.5
○ If that doesn't yield at least 50 actives: Active: pKi > 8.0, Inactive: pKi < 7.5
● "DS1": 80 "Dataset 1" sets.1
○ Active: 100 diverse measured actives ("standard_value<10uM"); Inactive: 2000 random
compounds from the same property space
● "PubChem": 8 HTS Validation assays with at least 3K "Potency" values
○ Active: "active" in dataset. Inactive: "inactive", "not active", or "inconclusive" in dataset
● "DrugMatrix": 44 DrugMatrix assays with at least 40 actives
○ Active: "active" in dataset. Inactive: "not active" in dataset
1
S. Riniker, N. Fechner, G. A. Landrum. "Heterogeneous classifier fusion for ligand-based virtual screening: or,
how decision making by committee can be a good thing." Journal of chemical information and modeling
53:2829-36 (2013).
17T5 Informatics
Model building and validation
● Fingerprints: 2048 bit MorganFP radius=2
● 80/20 training/test split
● Random forest parameters:
○ cls = RandomForestClassifier(n_estimators=500, max_depth=15, min_samples_leaf=2,
n_jobs=4, oob_score=True)
● Try threshold values of [0.05, 0.1 , 0.15, 0.2 , 0.25, 0.3 , 0.35, 0.4 , 0.45, 0.5 ]
with out-of-bag predictions and pick the best based on kappa
● Generate initial kappa value for the test data using threshold = 0.5
● Generate "balanced" kappa value for the test data with the optimized
threshold
18T5 Informatics
Does shifting the threshold actually help?
Point coloring is based on AUC for
the test set
Yes, it definitely helps
19T5 Informatics
It works!
● When looking across a range of different assays, shifting the decision
threshold improved the predictivity of the model, as measured by kappa, in
most cases. Often significantly so
● We did not need to retrain/change the model at all.
Yay! We're done!
20T5 Informatics
It works!
● When looking across a range of different assays, shifting the decision
threshold improved the predictivity of the model, as measured by kappa, in
most cases. Often significantly so
● We did not need to retrain/change the model at all.
No, wait, there's still more...
● What about other approaches for handling imbalanced datasets?
21T5 Informatics
Quick diversion: How do bag classifiers end up with
different models?
Each tree is built
with a different
dataset
22T5 Informatics
Another approach: Balanced Random Forests1
● Take advantage of the structure of the classifier.
● Learn each tree with a balanced dataset:
○ Select a bootstrap sample of the minority class (actives)
○ Randomly select, with replacement, the same number of points from the majority class
(inactives)
● Prediction works the same as with a normal random forest
● Easy to do in scikit-learn using the imbalanced-learn contrib package:
https://imbalanced-learn.readthedocs.io/en/stable/ensemble.html#forest-of-ra
ndomized-trees
○ cls = BalancedRandomForestClassifier(n_estimators=500, max_depth=15, min_samples_leaf=2, n_jobs=4,
oob_score=True)
1
C. Chen, A. Liaw, L. Breiman. “Using random forest to learn imbalanced data.” University of California,
Berkeley (2004), https://statistics.berkeley.edu/sites/default/files/tech-reports/666.pdf
23T5 Informatics
Does BRF help?
Point coloring is based on AUC for
the test set
Yes, it definitely helps
24T5 Informatics
How does BRF compare to shifting the threshold?
Point coloring is based on AUC for
the test set
Shifting the threshold
tends to do better
25T5 Informatics
Does shifting the threshold with BRF models help?
Point coloring is based on AUC for
the test set
Nope, that doesn't do
anything
26T5 Informatics
It works!
● When looking across a range of different assays, shifting the decision
threshold improved the predictivity of the model, as measured by kappa, in
most cases. Often significantly so
● The approach was generally better than using Balanced Random Forests
● We did not need to retrain/change the model at all.
Yay! We're done!
27T5 Informatics
What comes next
● Try the same thing with other learning methods like logistic regression and
stochastic gradient boosting
○ These are more complicated since they can't do out-of-bag classification
○ We need to add another data split and loop to do calibration and find the best threshold
● More datasets! I need *your* help with this
○ I can put together a script for you to run that takes sets of compounds with activity labels and
outputs summary statistics like what I'm using here
28T5 Informatics
Prelim results: logistic regression
29T5 Informatics
Acknowledgements
● Dean Abbott (Abbott Analytics, @deanabb)
● Daria Goldmann (KNIME)
30T5 Informatics
More info
● RDKit blog post with initial work:
http://rdkit.blogspot.com/2018/11/working-with-unbalanced-data-part-i.html
● The notebooks I used for this presentation are all in Github:
○ Original notebook: https://bit.ly/2UY2u2K
○ Using the balanced random forest: https://bit.ly/2tuafSc
○ Plotting: https://bit.ly/2GJSeHH
● I have a KNIME workflow that does the same thing. Let me know if you're
interested
● Download links for the datasets are in the blog post

More Related Content

Similar to Building useful models for imbalanced datasets (without resampling) (20)

PDF
Random Forest / Bootstrap Aggregation
Rupak Roy
 
PPT
Lecture11_ Evaluation Metrics for classification.ppt
DrMTayyabChaudhry1
 
PPTX
Supervised and Unsupervised Learning .pptx
KerenEvangelineI
 
PDF
Predicting breast cancer: Adrian Valles
Adrián Vallés
 
DOCX
Classification Using Decision Trees and RulesChapter 5.docx
monicafrancis71118
 
PDF
Bank loan purchase modeling
Saleesh Satheeshchandran
 
PDF
Machine learning in the life sciences with knime
Greg Landrum
 
PPTX
13 random forest
Vishal Dutt
 
PDF
Human_Activity_Recognition_Predictive_Model
David Ritchie
 
PDF
Data Science - Part V - Decision Trees & Random Forests
Derek Kane
 
PDF
From decision trees to random forests
Viet-Trung TRAN
 
PDF
MLHEP 2015: Introductory Lecture #4
arogozhnikov
 
PDF
Machine Learning Feature Selection - Random Forest
Rupak Roy
 
PDF
Random forest sgv_ai_talk_oct_2_2018
digitalzombie
 
PPTX
What we got from the Predicting Red Hat Business Value competition
Umaporn Kerdsaeng
 
PDF
M3R.FINAL
Peter Schindler
 
PDF
Module 6: Ensemble Algorithms
Sara Hooker
 
PPTX
Machine Learning Project
Abhishek Singh
 
PPS
Data Mining - Classification Of Breast Cancer Dataset using Decision Tree Ind...
Sunil Nair
 
PDF
Noorbehbahani classification evaluation measure
noorbehbahani
 
Random Forest / Bootstrap Aggregation
Rupak Roy
 
Lecture11_ Evaluation Metrics for classification.ppt
DrMTayyabChaudhry1
 
Supervised and Unsupervised Learning .pptx
KerenEvangelineI
 
Predicting breast cancer: Adrian Valles
Adrián Vallés
 
Classification Using Decision Trees and RulesChapter 5.docx
monicafrancis71118
 
Bank loan purchase modeling
Saleesh Satheeshchandran
 
Machine learning in the life sciences with knime
Greg Landrum
 
13 random forest
Vishal Dutt
 
Human_Activity_Recognition_Predictive_Model
David Ritchie
 
Data Science - Part V - Decision Trees & Random Forests
Derek Kane
 
From decision trees to random forests
Viet-Trung TRAN
 
MLHEP 2015: Introductory Lecture #4
arogozhnikov
 
Machine Learning Feature Selection - Random Forest
Rupak Roy
 
Random forest sgv_ai_talk_oct_2_2018
digitalzombie
 
What we got from the Predicting Red Hat Business Value competition
Umaporn Kerdsaeng
 
M3R.FINAL
Peter Schindler
 
Module 6: Ensemble Algorithms
Sara Hooker
 
Machine Learning Project
Abhishek Singh
 
Data Mining - Classification Of Breast Cancer Dataset using Decision Tree Ind...
Sunil Nair
 
Noorbehbahani classification evaluation measure
noorbehbahani
 

More from Greg Landrum (15)

PDF
Chemical registration
Greg Landrum
 
PDF
Mike Lynch Award Lecture, ICCS 2022
Greg Landrum
 
PDF
ACS San Diego - The RDKit: Open-source cheminformatics
Greg Landrum
 
PDF
Let’s talk about reproducible data analysis
Greg Landrum
 
PDF
How Do You Build and Validate 1500 Models and What Can You Learn from Them?
Greg Landrum
 
PDF
Interactive and reproducible data analysis with the open-source KNIME Analyti...
Greg Landrum
 
PDF
Processing malaria HTS results using KNIME: a tutorial
Greg Landrum
 
PDF
Big (chemical) data? No Problem!
Greg Landrum
 
PDF
Is one enough? Data warehousing for biomedical research
Greg Landrum
 
PDF
Some "challenges" on the open-source/open-data front
Greg Landrum
 
PDF
Large scale classification of chemical reactions from patent data
Greg Landrum
 
PDF
Open-source from/in the enterprise: the RDKit
Greg Landrum
 
PDF
Open-source tools for querying and organizing large reaction databases
Greg Landrum
 
PDF
Is that a scientific report or just some cool pictures from the lab? Reproduc...
Greg Landrum
 
PDF
Reproducibility in cheminformatics and computational chemistry research: cert...
Greg Landrum
 
Chemical registration
Greg Landrum
 
Mike Lynch Award Lecture, ICCS 2022
Greg Landrum
 
ACS San Diego - The RDKit: Open-source cheminformatics
Greg Landrum
 
Let’s talk about reproducible data analysis
Greg Landrum
 
How Do You Build and Validate 1500 Models and What Can You Learn from Them?
Greg Landrum
 
Interactive and reproducible data analysis with the open-source KNIME Analyti...
Greg Landrum
 
Processing malaria HTS results using KNIME: a tutorial
Greg Landrum
 
Big (chemical) data? No Problem!
Greg Landrum
 
Is one enough? Data warehousing for biomedical research
Greg Landrum
 
Some "challenges" on the open-source/open-data front
Greg Landrum
 
Large scale classification of chemical reactions from patent data
Greg Landrum
 
Open-source from/in the enterprise: the RDKit
Greg Landrum
 
Open-source tools for querying and organizing large reaction databases
Greg Landrum
 
Is that a scientific report or just some cool pictures from the lab? Reproduc...
Greg Landrum
 
Reproducibility in cheminformatics and computational chemistry research: cert...
Greg Landrum
 
Ad

Recently uploaded (20)

PPT
Human physiology and digestive system
S.B.P.G. COLLEGE BARAGAON VARANASI
 
PPTX
Vectors and applications of genetic engineering Pptx
Ashwini I Chuncha
 
PDF
Annual report 2024 - Inria - English version.pdf
Inria
 
PDF
A young gas giant and hidden substructures in a protoplanetary disk
Sérgio Sacani
 
PPTX
Q1 - W1 - D2 - Models of matter for science.pptx
RyanCudal3
 
PDF
High-speedBouldersandtheDebrisFieldinDARTEjecta
Sérgio Sacani
 
PDF
WUCHERIA BANCROFTI-converted-compressed.pdf
S.B.P.G. COLLEGE BARAGAON VARANASI
 
PPTX
Cooking Oil Tester How to Measure Quality of Frying Oil.pptx
M-Kube Enterprise
 
PDF
Insect Behaviour : Patterns And Determinants
SheikhArshaqAreeb
 
PPTX
GB1 Q1 04 Life in a Cell (1).pptx GRADE 11
JADE ACOSTA
 
PPTX
Immunopharmaceuticals and microbial Application
xxkaira1
 
PDF
The role of the Lorentz force in sunspot equilibrium
Sérgio Sacani
 
PPTX
formations-of-rock-layers-grade 11_.pptx
GraceSarte
 
PDF
Continuous Model-Based Engineering of Software-Intensive Systems: Approaches,...
Hugo Bruneliere
 
PPTX
PEDIA IDS IN A GIST_6488b6b5-3152-4a4a-a943-20a56efddd43 (2).pptx
tdas83504
 
PPTX
Diagnostic Features of Common Oral Ulcerative Lesions.pptx
Dr Palak borade
 
PPTX
Qualification of DISSOLUTION TEST APPARATUS.pptx
shrutipandit17
 
PDF
GK_GS One Liner For Competitive Exam.pdf
abhi01nm
 
PDF
Carbon-richDustInjectedintotheInterstellarMediumbyGalacticWCBinaries Survives...
Sérgio Sacani
 
PPTX
Phage Therapy and Bacteriophage Biology.pptx
Prachi Virat
 
Human physiology and digestive system
S.B.P.G. COLLEGE BARAGAON VARANASI
 
Vectors and applications of genetic engineering Pptx
Ashwini I Chuncha
 
Annual report 2024 - Inria - English version.pdf
Inria
 
A young gas giant and hidden substructures in a protoplanetary disk
Sérgio Sacani
 
Q1 - W1 - D2 - Models of matter for science.pptx
RyanCudal3
 
High-speedBouldersandtheDebrisFieldinDARTEjecta
Sérgio Sacani
 
WUCHERIA BANCROFTI-converted-compressed.pdf
S.B.P.G. COLLEGE BARAGAON VARANASI
 
Cooking Oil Tester How to Measure Quality of Frying Oil.pptx
M-Kube Enterprise
 
Insect Behaviour : Patterns And Determinants
SheikhArshaqAreeb
 
GB1 Q1 04 Life in a Cell (1).pptx GRADE 11
JADE ACOSTA
 
Immunopharmaceuticals and microbial Application
xxkaira1
 
The role of the Lorentz force in sunspot equilibrium
Sérgio Sacani
 
formations-of-rock-layers-grade 11_.pptx
GraceSarte
 
Continuous Model-Based Engineering of Software-Intensive Systems: Approaches,...
Hugo Bruneliere
 
PEDIA IDS IN A GIST_6488b6b5-3152-4a4a-a943-20a56efddd43 (2).pptx
tdas83504
 
Diagnostic Features of Common Oral Ulcerative Lesions.pptx
Dr Palak borade
 
Qualification of DISSOLUTION TEST APPARATUS.pptx
shrutipandit17
 
GK_GS One Liner For Competitive Exam.pdf
abhi01nm
 
Carbon-richDustInjectedintotheInterstellarMediumbyGalacticWCBinaries Survives...
Sérgio Sacani
 
Phage Therapy and Bacteriophage Biology.pptx
Prachi Virat
 
Ad

Building useful models for imbalanced datasets (without resampling)

  • 1. Building useful models for imbalanced datasets (without resampling) Greg Landrum Feb 2019 T5 Informatics GmbH [email protected] @dr_greg_landrum
  • 2. 2T5 Informatics First things first ● RDKit blog post with initial work: http://rdkit.blogspot.com/2018/11/working-with-unbalanced-data-part-i.html ● The notebooks I used for this presentation are all in Github: ○ Original notebook: https://bit.ly/2UY2u2K ○ Using the balanced random forest: https://bit.ly/2tuafSc ○ Plotting: https://bit.ly/2GJSeHH ● I have a KNIME workflow that does the same thing. Let me know if you're interested ● Download links for the datasets are in the blog post
  • 3. 3T5 Informatics The problem ● Typical datasets for bioactivity prediction tend to have way more inactives than actives ● This leads to a couple of pathologies: ○ Overall accuracy is really not a good metric for how useful a model is ○ Many learning algorithms produce way too many false negatives
  • 4. 4T5 Informatics The accuracy problem Assay: CHEMBL1614421, PUBCHEM_BIOASSAY: qHTS for Inhibitors of Tau Fibril Formation Predicted inactive Predicted active Measured inactive 8681 4 Measured active 1102 22 Accuracy is high, but the model is pretty useless for predicting actives Overall accuracy: 88.7%
  • 5. 5T5 Informatics The accuracy problem Assay: CHEMBL1614421, PUBCHEM_BIOASSAY: qHTS for Inhibitors of Tau Fibril Formation Predicted inactive Predicted active Measured inactive 8681 4 Measured active 1102 22 Overall accuracy: 88.7% kappa: 0.033 This one has an easy solution: use Cohen's kappa https://en.wikipedia.org/wiki/Cohen%27s_kappa https://link.springer.com/article/10.1007/s10822-014-9759-6 https://www.researchgate.net/publication/258240105_TheKappaStatistic_PaulCzodrowski kappa makes the problem obvious
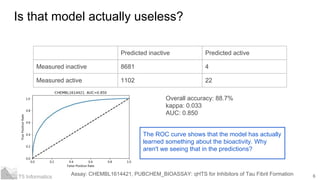
  • 6. 6T5 Informatics Is that model actually useless? Assay: CHEMBL1614421, PUBCHEM_BIOASSAY: qHTS for Inhibitors of Tau Fibril Formation Predicted inactive Predicted active Measured inactive 8681 4 Measured active 1102 22 Overall accuracy: 88.7% kappa: 0.033 AUC: 0.850 The ROC curve shows that the model has actually learned something about the bioactivity. Why aren't we seeing that in the predictions?
  • 7. 7T5 Informatics Quick diversion on bag classifiers When making predictions, each tree in the classifier votes on the result. Majority wins In scikit-learn the predicted class probabilities are the means of the predicted probabilities from the individual trees We construct the ROC curve by sorting the predictions in decreasing order of predicted probability of being active. Note that actual predictions are irrelevant for a ROC curve. As long as true actives tend to have a higher predicted probability of being active than true inactives the AUC will be good.
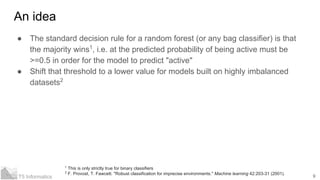
  • 9. 9T5 Informatics An idea ● The standard decision rule for a random forest (or any bag classifier) is that the majority wins1 , i.e. at the predicted probability of being active must be >=0.5 in order for the model to predict "active" ● Shift that threshold to a lower value for models built on highly imbalanced datasets2 1 This is only strictly true for binary classifiers 2 F. Provost, T. Fawcett. "Robust classification for imprecise environments." Machine learning 42:203-31 (2001).
  • 10. 10T5 Informatics How do we come up with a new decision threshold? 1. Generate a random forest for the dataset using a training set 2. Generate out-of-bag predicted probabilities using the training set 3. Try a number of different decision thresholds1 and pick the one that gives the best kappa Once we have the decision threshold, use it to generate predictions for the test set. 1 Here we use: [0.05, 0.1 , 0.15, 0.2 , 0.25, 0.3 , 0.35, 0.4 , 0.45, 0.5 ]
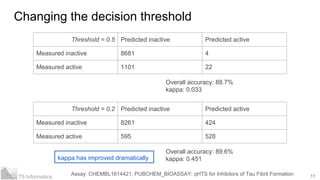
  • 11. 11T5 Informatics Changing the decision threshold Assay: CHEMBL1614421, PUBCHEM_BIOASSAY: qHTS for Inhibitors of Tau Fibril Formation Threshold = 0.5 Predicted inactive Predicted active Measured inactive 8681 4 Measured active 1101 22 Overall accuracy: 88.7% kappa: 0.033 Threshold = 0.2 Predicted inactive Predicted active Measured inactive 8261 424 Measured active 595 528 Overall accuracy: 89.6% kappa: 0.451kappa has improved dramatically
  • 12. 12T5 Informatics Why does it work? Prob(active) Superimpose Prob(active) on the ROC curve
  • 13. 13T5 Informatics Why does it work? The predicted probabilities of being active are clearly carrying significant information about activity Prob(active) Superimpose Prob(active) on the ROC curve Plot TPR and FPR vs -Prob(active)
  • 14. 14T5 Informatics It works! ● By shifting the decision threshold from 0.5->0.2 we managed to improve the predictivity of the model, as measured by kappa, from 0.033 to 0.451 ● We did not need to retrain/change the model at all. Yay! We're done!
  • 15. 15T5 Informatics It works! ● By shifting the decision threshold from 0.5->0.2 we managed to improve the predictivity of the model, as measured by kappa, from 0.033 to 0.451 ● We did not need to retrain/change the model at all. Not quite done yet! ● This is just one model. Does this approach work broadly? ● Let's try a broad collection of datasets
  • 16. 16T5 Informatics The datasets (all extracted from ChEMBL_24) ● "Serotonin": 6 datasets with >900 Ki values for human serotonin receptors ○ Active: pKi > 9.0, Inactive: pKi < 8.5 ○ If that doesn't yield at least 50 actives: Active: pKi > 8.0, Inactive: pKi < 7.5 ● "DS1": 80 "Dataset 1" sets.1 ○ Active: 100 diverse measured actives ("standard_value<10uM"); Inactive: 2000 random compounds from the same property space ● "PubChem": 8 HTS Validation assays with at least 3K "Potency" values ○ Active: "active" in dataset. Inactive: "inactive", "not active", or "inconclusive" in dataset ● "DrugMatrix": 44 DrugMatrix assays with at least 40 actives ○ Active: "active" in dataset. Inactive: "not active" in dataset 1 S. Riniker, N. Fechner, G. A. Landrum. "Heterogeneous classifier fusion for ligand-based virtual screening: or, how decision making by committee can be a good thing." Journal of chemical information and modeling 53:2829-36 (2013).
  • 17. 17T5 Informatics Model building and validation ● Fingerprints: 2048 bit MorganFP radius=2 ● 80/20 training/test split ● Random forest parameters: ○ cls = RandomForestClassifier(n_estimators=500, max_depth=15, min_samples_leaf=2, n_jobs=4, oob_score=True) ● Try threshold values of [0.05, 0.1 , 0.15, 0.2 , 0.25, 0.3 , 0.35, 0.4 , 0.45, 0.5 ] with out-of-bag predictions and pick the best based on kappa ● Generate initial kappa value for the test data using threshold = 0.5 ● Generate "balanced" kappa value for the test data with the optimized threshold
  • 18. 18T5 Informatics Does shifting the threshold actually help? Point coloring is based on AUC for the test set Yes, it definitely helps
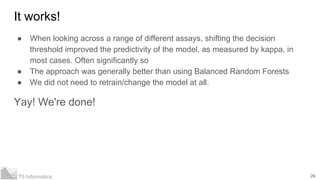
  • 19. 19T5 Informatics It works! ● When looking across a range of different assays, shifting the decision threshold improved the predictivity of the model, as measured by kappa, in most cases. Often significantly so ● We did not need to retrain/change the model at all. Yay! We're done!
  • 20. 20T5 Informatics It works! ● When looking across a range of different assays, shifting the decision threshold improved the predictivity of the model, as measured by kappa, in most cases. Often significantly so ● We did not need to retrain/change the model at all. No, wait, there's still more... ● What about other approaches for handling imbalanced datasets?
  • 21. 21T5 Informatics Quick diversion: How do bag classifiers end up with different models? Each tree is built with a different dataset
  • 22. 22T5 Informatics Another approach: Balanced Random Forests1 ● Take advantage of the structure of the classifier. ● Learn each tree with a balanced dataset: ○ Select a bootstrap sample of the minority class (actives) ○ Randomly select, with replacement, the same number of points from the majority class (inactives) ● Prediction works the same as with a normal random forest ● Easy to do in scikit-learn using the imbalanced-learn contrib package: https://imbalanced-learn.readthedocs.io/en/stable/ensemble.html#forest-of-ra ndomized-trees ○ cls = BalancedRandomForestClassifier(n_estimators=500, max_depth=15, min_samples_leaf=2, n_jobs=4, oob_score=True) 1 C. Chen, A. Liaw, L. Breiman. “Using random forest to learn imbalanced data.” University of California, Berkeley (2004), https://statistics.berkeley.edu/sites/default/files/tech-reports/666.pdf
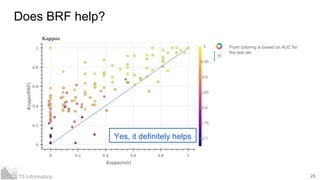
  • 23. 23T5 Informatics Does BRF help? Point coloring is based on AUC for the test set Yes, it definitely helps
  • 24. 24T5 Informatics How does BRF compare to shifting the threshold? Point coloring is based on AUC for the test set Shifting the threshold tends to do better
  • 25. 25T5 Informatics Does shifting the threshold with BRF models help? Point coloring is based on AUC for the test set Nope, that doesn't do anything
  • 26. 26T5 Informatics It works! ● When looking across a range of different assays, shifting the decision threshold improved the predictivity of the model, as measured by kappa, in most cases. Often significantly so ● The approach was generally better than using Balanced Random Forests ● We did not need to retrain/change the model at all. Yay! We're done!
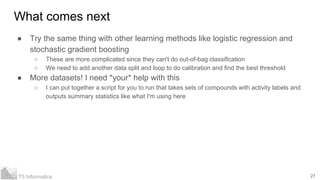
  • 27. 27T5 Informatics What comes next ● Try the same thing with other learning methods like logistic regression and stochastic gradient boosting ○ These are more complicated since they can't do out-of-bag classification ○ We need to add another data split and loop to do calibration and find the best threshold ● More datasets! I need *your* help with this ○ I can put together a script for you to run that takes sets of compounds with activity labels and outputs summary statistics like what I'm using here
  • 28. 28T5 Informatics Prelim results: logistic regression
  • 29. 29T5 Informatics Acknowledgements ● Dean Abbott (Abbott Analytics, @deanabb) ● Daria Goldmann (KNIME)
  • 30. 30T5 Informatics More info ● RDKit blog post with initial work: http://rdkit.blogspot.com/2018/11/working-with-unbalanced-data-part-i.html ● The notebooks I used for this presentation are all in Github: ○ Original notebook: https://bit.ly/2UY2u2K ○ Using the balanced random forest: https://bit.ly/2tuafSc ○ Plotting: https://bit.ly/2GJSeHH ● I have a KNIME workflow that does the same thing. Let me know if you're interested ● Download links for the datasets are in the blog post