SlideShare a Scribd company logo
FAST 2017, Santa Clara
Chronix: Long Term Storage and Retrieval Technology
for Anomaly Detection in Operational Data
Florian Lautenschlager, Michael Philippsen, Andreas Kumlehn, and Josef Adersberger
Florian.Lautenschlager@qaware.de
flolaut
Detecting Anomalies in Running Software matters
Various kinds of anomalies:
• Resource consumption: anomalous memory consumption, high CPU usage, …
• Sporadic failure: blocking state, deadlock, dirty read, …
• Security: port scanning activity, short frequent login attempts, …
Economic or reputation loss.
Detection is a complex task:
• Multiple components: Database, Service Discovery, Configuration Service, …
• Different technologies: Go, Java, Java-Script, Python, …
• Various transport protocols: HTTP, Protocol Buffers, Thrift, JSON, …
1
Anomaly Detection Tool Chain for Operational Data
Types of operational data:
• Metrics: scalar values, e.g.,
rates, runtimes, total hits,
counters, …
• Events: single occurrences,
e.g., a user’s login, product
order, …
• Traces: sequences within a
software system, e.g., the
called methods, …
2
Operational
Data
Application
Collection
Framework
Analysis
Framework
Time Series
Database
Anomaly Detection Tool Chain for Operational Data
3
Collection
Framework
Analysis
Framework
Time Series
Database
Timestamp V1 V2
25.10.2016 00:00:01.546 218.34 51
… … …
Collects operational data
from a running
application
Asks the database for
data and analyzes the
data
Stores the time series data
Anomaly Detection Tool Chain for Operational Data
3
General-Purpose TSDB
• Brake shoe
• Resource hog
• Productivity obstacle
Domain specific sensors
and adaptors
Domain specific analysis
algorithms and tools
Collection
Framework
Analysis
Framework
Time Series
Database
Chronix:
Domain specific TSDB
Domain specific sensors
and adaptors
Domain specific analysis
algorithms and tools
State of the art: General-purpose TSDBs in Anomaly Detection
4
Graphite
InfluxDB
OpenTSDB
KairosDB
Prometheus
Generic data model
Analysis support
Lossless long
term storage
Chronix
High memory footprint
= Performance hog
High storage demands
= Performance hog
Loss of historical data
= Brake shoe
No support for analyses
= Productivity obstacle
= Brake shoe
No support for data types
= Productivity obstacle
7 Bullets for the domain of Anomaly Detection
Option to pre-compute an extra representation of the data
Optional timestamp compression for almost-periodic time series
Records that meet the needs of the domain
Compression technique that suits the domain’s data
Underlying multi-dimensional storage
Domain specific query language with server-side evaluation
Domain specific commissioning of configuration parameters
5
Collection Framework
Analysis
FrameworkChronix
1
2
3
4
5
6
7
Running Example: Almost-periodic time series with operational data
Timestamp Value Metric Process Host
25.10.2016 00:00:01.546 218.34 ingestertime SmartHub QAMUC
25.10.2016 00:00:06.718 218.37 ingestertime SmartHub QAMUC
25.10.2016 00:00:11.891 218.49 ingestertime SmartHub QAMUC
25.10.2016 00:00:16.964 218.52 ingestertime SmartHub QAMUC
… … … … …
… … … … …
6
Option to pre-compute data to speed up analyses
• Chronix is lossless: it keeps all details because the analyses are ad-hoc and may need them.
• Chronix offers a programming interface for adding extra domain specific “columns”.
Examples: Fourier transformation, Symbolic Aggregate approXimation (SAX), etc.
• Added “columns” speed up anomaly detection queries.
7
Timestamp Value Metric Process Host SAX
25.10.2016 00:00:01.546 218.34 ingestertime SmartHub QAMUC A
25.10.2016 00:00:06.718 218.37 ingestertime SmartHub QAMUC B
25.10.2016 00:00:11.891 218.49 ingestertime SmartHub QAMUC C
25.10.2016 00:00:16.964 218.52 ingestertime SmartHub QAMUC D
… … … … … …
… … … … … …
1
Optional timestamp compaction
• It suffices to be able to reconstruct approximate timestamps for almost-periodic time series.
• Date-Delta-Compaction
• Chronix is functionally lossless as it keeps all relevant details.
• The tolerable degree of inaccuracy is a
8
Timestamp Value Metric Process Host SAX
25.10.2016 00:00:01.546 218.34 ingestertime SmartHub QAMUC A
5.172 218.37 ingestertime SmartHub QAMUC B
- 218.49 ingestertime SmartHub QAMUC C
- 218.52 ingestertime SmartHub QAMUC D
… … … … …
… … … … …
2
Configuration Parameter of 7
Space saved
Date-Delta-Compaction
9
Timestamp
25.10.2016 00:00:01.546
25.10.2016 00:00:06.718
25.10.2016 00:00:11.891
25.10.2016 00:00:16.964
…
…
Timestamp
25.10 … :01.546
5.172
5.173
5.073
…
…
Timestamp
25.10 … :01.546
5.172
0.001
0.1
…
…
Timestamp
25.10 … :01.546
5.172
-
-
…
…
Calculate
deltas
Compute
diffs
between
them
Drop diffs
below
threshold
If accumulated
drift > threshold
store delta.
(Upper bound
on inaccuracy)
Timestamp
25.10 … :01.546
5.172
-
-
…
…
space saved
space
saved
Domain specific data characteristics
10
Timestamp Value Metric Process Host SAX
25.10.2016 00:00:01.546 218.34 ingestertime SmartHub QAMUC A
5.172 218.37 ingestertime SmartHub QAMUC B
- 218.49 ingestertime SmartHub QAMUC C
- 218.52 ingestertime SmartHub QAMUC D
… … … … … …
… … … … … …
Many anomaly
detection tasks
need blocks of data
rather than “lines”.
Repetitive
values.
Repetitive
values.
“Columns” with
repetitive
values.
Some compression
techniques work
better than others.
Records that meet the needs of the domain
Therefore:
Record := Attributes + Start + End + Type + Data Chunk
• Chronix offers a programming interface to implement time series specific records.
• Chronix exploits repetitiveness and bundles “lines” into data chunks.
• The chunk size is a
11
Timestamp Value Metric Process Host SAX
25.10.2016 00:00:01.546 218.34 ingestertime SmartHub QAMUC A
5.172 218.37 ingestertime SmartHub QAMUC B
- 218.49 ingestertime SmartHub QAMUC C
- 218.52 ingestertime SmartHub QAMUC D
… … … … … …
… … … … … …
1 2 1
3
Configuration Parameter of 7
Record
metric: ingestertime
process: SmartHub
host: QAMUC
start: 25.10.2016 00:00:01.546
end: …
type: metric
data: Timestamp Value SAX
25.10.2016 00:00:01.546 218.34 A
5.172 218.37 B
- 218.49 C
- 218.52 D
2
1
chunk & convert
2 21
BLOB
Compression technique that suits the domain’s data
• Chronix exploits that domain data often has small increments, recurring patterns, etc.
• Chronix uses a lossless compression technique that minimizes (record sizes + index sizes).
• The choice of compression technique is a
12
Record
metric: ingestertime
process: SmartHub
host: QAMUC
start: 25.10.2016 00:00:01.546
end: …
type: metric
data: 00105e0 e6b0 343b 9c74 080
7bc 0804 e7d5 0804 00105f0
4
Configuration Parameter of 7
Record
metric: ingestertime
process: SmartHub
host: QAMUC
start: 25.10.2016 00:00:01.546
end: …
type: metric
data: Timestamp Value SAX
25.10.2016 00:00:01.546 218.34 A
5.172 218.37 B
- 218.49 C
- 218.52 D Compressed BLOB
serialize & compress
Underlying multi-dimensional storage
By using a multi-dimensional storage …
• … Chronix supports explorative analyses.
• Attributes are visible to the storage and indexed.
• Users can use any combination to find a record.
• … Chronix supports correlating analyses.
• Every type of data can be stored.
• Queries can use and combine types.
13
q=host:QAMUC AND metric:ingester*
AND type:[metric OR trace]
AND end:NOW-7MONTH
5
Record
metric: ingestertime
process: SmartHub
host: QAMUC
start: 25.10.2016 00:00:01.546
end: …
type: metric
data: 00105e0 e6b0 343b 9c74 080
7bc 0804 e7d5 0804 00105f0
Record
metric: ingestermethods
process: SmartHub
host: QAMUC
start: 25.10.2016 00:00:01.546
end: …
type: trace
data: d65fa01 7ab2 433c 7c8e f123
2ca 0713 a8f5 926b 01006e1
Domain specific query language with server-side evaluation
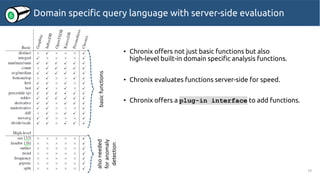
• Chronix offers not just basic functions but also
high-level built-in domain specific analysis functions.
• Chronix evaluates functions server-side for speed.
• Chronix offers a plug-in interface to add functions.
14
basicfunctionsalsoneeded
foranomaly
detection
6
Domain specific query language with server-side evaluation
• Chronix achieves more programming comfort & fast results.
15
6
Chronix
Query 1:
q=metric:ingestertime
& cf=outlier
General-Purpose Time Series Database
query 1
Query 1:
select q(0.25,time),q(0.75,time) from ingester
Calculate threshold
Query 2:
select time from ingester where time >= threshold
high-level
function
query 1
read
result process
read
result process
read
processresult
query 2extra code
1x query
1x latency
2x query
extra code
2x latency
extra codeextra code
Operational data of 5 industry projects
16
Description
Interval
(sec)
Pairs
(mio)
Time
series
P1 Application for searching car
maintenance and repair
instructions.
(8 app sever, 20 search server)
30 2,4 1,080
P2 Retail application for orders,
billing, and customer relations.
(1 database, 2 app server)
60 331.4 8,567
P3 Sales application of a car
manufacturer.
(1 database, 2 app servers)
30 162.6 4,538
P4 Service application for modern
cars (music streaming)
1 metric 3.9
lsof 0.4
strace 12.1
500
P5 Manage the compatibility of
software components in a car.
60 3,762.3 24,055
Total 4,275.1 38,740
used for the Evaluation
7used for
Best threshold for the Date-Delta-Compaction
17
DDC = 200
7
Operational data of 3 (of 5) industry projects
18
Description
Interval
(sec)
Pairs
(mio)
Time
series r q
P1 Application for searching car
maintenance and repair
instructions.
(8 app sever, 20 search server)
30 2,4 1,080
P2 Retail application for orders,
billing, and customer relations.
(1 database, 2 app server)
60 331.4 8,567
P3 Sales application of a car
manufacturer.
(1 database, 2 app servers)
30 162.6 4,538
P4 … … … …
P5 … … … …
Total 4,275.1 38,740
91
2
56
1
28
3
21
5
7
30
1
30
0.5
15
…
…
…
…
Query Mix
r = range (days)
q= # of queries
7
Best compression technique & Best chunk size for query mix
19
C= 128 KB, t= gzip
7
Operational data of 2 of (5) industry projects Evaluation
20
Description
Interval
(sec)
Pairs
(mio)
Time
series r q b h
P1 … … … …
P2 … … … …
P3 … … … …
P4 Service application for
modern cars (music
streaming)
1 metric 3.9
lsof 0.4
strace 12.1
500
P5 Manage the
compatibility of
software components
in a car.
60 3,762.3 24,055
Total 4,275.1 38,740
180
2
2
0
91
2
1
2
56
1
4
3
28
5
4
6
21
12
2
6
14
8
7
8
7
15
5
10
1
11
6
6
0.5
1
1
2
…
…
…
…
…
…
…
…
…
…
…
…
Query Mix
r = range (days)
q= # of queries
b= # of basis
queries
h= # of high-
level queries
TSDBs under test Comparisons
Quantitative comparison
21
General-Purpose TSDB
• Productivity obstacles
• Brake shoe
• Resource hog
Time Series
Database
Chronix:
Domain specific TSDB
InfluxDB
OpenTSDB
KairosDB
Chronix
a) Memory footprint
b) Storage demand
c) Data retrieval times
d) Query mix runtimes
a) Memory footprint
Memory footprint of the databases (in MB)
22
Chronix has a 34% – 69% smaller memory footprint.
InfluxDB OpenTSDB KairosDB Chronix
Initially after startup (processes up and running) 33 2,726 8,763 446
Maximal memory usage during import 10,336 10,111 18,905 7,002
Maximal memory usage during query 8,269 9,712 11,230 4,792
b) Storage demand
23
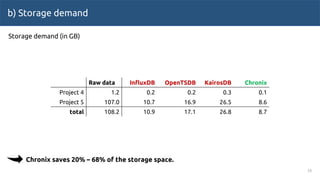
Chronix saves 20% – 68% of the storage space.
Storage demand (in GB)
Raw data InfluxDB OpenTSDB KairosDB Chronix
Project 4 1.2 0.2 0.2 0.3 0.1
Project 5 107.0 10.7 16.9 26.5 8.6
total 108.2 10.9 17.1 26.8 8.7
Data retrieval times for 20 ∙ 58 queries (in s)
c) Data retrieval times
24
r q InfluxDB OpenTSDB KairosDB Chronix
0.5 2 4.3 2.8 4.4 0.9
1 11 5.5 5.6 6.6 5.3
7 15 34.1 17.4 26.8 7.0
14 8 36.2 14.2 25.5 4.0
21 12 76.5 29.8 55.0 6.0
28 5 7.9 3.9 5.6 0.5
56 1 35.4 12.4 24.1 1.2
91 2 47.5 15.5 33.8 1.1
180 2 96.7 36.7 66.6 1.1
total 343.8 138.3 248.4 27.1
Chronix saves 80% – 92% on data retrieval times.
d) Query mix runtimes
Runtimes of 20 ∙ 75 b- and h-queries (in s)
25
q InfluxDB OpenTSDB KairosDB Chronix
Basic(b)
4 avg 0.9 6.1 9.8 4.4
5 max 1.3 8.4 9.1 6.0
3 min 0.7 2.7 5.3 2.8
3 stddev. 6.7 16.7 21.1 2.3
5 sum 0.7 6.0 12.0 2.0
4 count 0.8 5.5 10.5 1.0
8 perc. 10.2 25.8 34.5 8.6
High-level(h)
12 outlier 30.7 29.1 117.6 18.9
14 trend 162.7 50.4 100.6 30.2
11 frequency 47.3 23.9 45.7 16.3
3 grpsize 218.9 2927.8 206.3 29.6
3 split 123.1 2893.9 47.9 37.2
75 total 604.0 5996.3 620.4 159.3
Chronix saves 73% – 97% of the runtime of analyzing queries.
more
important
Chronix unleashes Anomaly Detection tasks
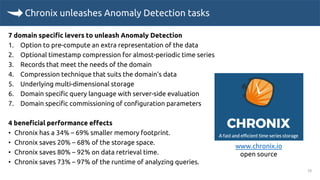
7 domain specific levers to unleash Anomaly Detection
1. Option to pre-compute an extra representation of the data
2. Optional timestamp compression for almost-periodic time series
3. Records that meet the needs of the domain
4. Compression technique that suits the domain’s data
5. Underlying multi-dimensional storage
6. Domain specific query language with server-side evaluation
7. Domain specific commissioning of configuration parameters
4 beneficial performance effects
• Chronix has a 34% – 69% smaller memory footprint.
• Chronix saves 20% – 68% of the storage space.
• Chronix saves 80% – 92% on data retrieval time.
• Chronix saves 73% – 97% of the runtime of analyzing queries.
26
www.chronix.io
open source

More Related Content

What's hot (19)

PDF
JEE on DC/OS
Josef Adersberger
 
PDF
Go and Uber’s time series database m3
Rob Skillington
 
PDF
OSDC 2016 - Chronix - A fast and efficient time series storage based on Apach...
NETWAYS
 
PDF
OpenTSDB for monitoring @ Criteo
Nathaniel Braun
 
PPTX
Update on OpenTSDB and AsyncHBase
HBaseCon
 
PDF
Ted Dunning – Very High Bandwidth Time Series Database Implementation - NoSQL...
NoSQLmatters
 
PDF
OpenTSDB 2.0
HBaseCon
 
PPTX
Real-Time Big Data with Storm, Kafka and GigaSpaces
Oleksii Diagiliev
 
PPTX
Monitoring MySQL with OpenTSDB
Geoffrey Anderson
 
PPTX
Cassandra and Storm at Health Market Sceince
P. Taylor Goetz
 
PDF
Building a Fast, Resilient Time Series Store with Cassandra (Alex Petrov, Dat...
DataStax
 
PDF
Distributed real time stream processing- why and how
Petr Zapletal
 
PDF
Streams processing with Storm
Mariusz Gil
 
PDF
Real time and reliable processing with Apache Storm
Andrea Iacono
 
PDF
Thanos - Prometheus on Scale
Bartłomiej Płotka
 
PDF
HBaseCon 2012 | Lessons learned from OpenTSDB - Benoit Sigoure, StumbleUpon
Cloudera, Inc.
 
KEY
Everything I Ever Learned About JVM Performance Tuning @Twitter
Attila Szegedi
 
PPTX
HBaseCon 2013: OpenTSDB at Box
Cloudera, Inc.
 
PDF
Processing Big Data in Real-Time - Yanai Franchi, Tikal
Codemotion Tel Aviv
 
JEE on DC/OS
Josef Adersberger
 
Go and Uber’s time series database m3
Rob Skillington
 
OSDC 2016 - Chronix - A fast and efficient time series storage based on Apach...
NETWAYS
 
OpenTSDB for monitoring @ Criteo
Nathaniel Braun
 
Update on OpenTSDB and AsyncHBase
HBaseCon
 
Ted Dunning – Very High Bandwidth Time Series Database Implementation - NoSQL...
NoSQLmatters
 
OpenTSDB 2.0
HBaseCon
 
Real-Time Big Data with Storm, Kafka and GigaSpaces
Oleksii Diagiliev
 
Monitoring MySQL with OpenTSDB
Geoffrey Anderson
 
Cassandra and Storm at Health Market Sceince
P. Taylor Goetz
 
Building a Fast, Resilient Time Series Store with Cassandra (Alex Petrov, Dat...
DataStax
 
Distributed real time stream processing- why and how
Petr Zapletal
 
Streams processing with Storm
Mariusz Gil
 
Real time and reliable processing with Apache Storm
Andrea Iacono
 
Thanos - Prometheus on Scale
Bartłomiej Płotka
 
HBaseCon 2012 | Lessons learned from OpenTSDB - Benoit Sigoure, StumbleUpon
Cloudera, Inc.
 
Everything I Ever Learned About JVM Performance Tuning @Twitter
Attila Szegedi
 
HBaseCon 2013: OpenTSDB at Box
Cloudera, Inc.
 
Processing Big Data in Real-Time - Yanai Franchi, Tikal
Codemotion Tel Aviv
 

Similar to Chronix: Long Term Storage and Retrieval Technology for Anomaly Detection in Operational Data (20)

PPTX
Cassandra Tools and Distributed Administration (Jeffrey Berger, Knewton) | C*...
DataStax
 
PPT
Everything You Need to Know About Sharding
MongoDB
 
PDF
Optimizing Tiered Storage for Low-Latency Real-Time Analytics at AI Scale
Alluxio, Inc.
 
PPT
MongoDB Sharding Webinar 2014
Dylan Tong
 
PPTX
End to End Processing of 3.7 Million Telemetry Events per Second using Lambda...
DataWorks Summit/Hadoop Summit
 
PDF
Linux Systems Performance 2016
Brendan Gregg
 
PPTX
Apache Big Data 2016: Next Gen Big Data Analytics with Apache Apex
Apache Apex
 
PDF
Data Stream Processing - Concepts and Frameworks
Matthias Niehoff
 
PDF
ROLE OF DIGITAL SIMULATION IN CONFIGURING NETWORK PARAMETERS
Deepak Shankar
 
PPTX
Large scale, distributed access management deployment with aruba clear pass
Aruba, a Hewlett Packard Enterprise company
 
PDF
High Performance Erlang - Pitfalls and Solutions
Yinghai Lu
 
PDF
Three Perspectives on Measuring Latency
ScyllaDB
 
PDF
Leveraging Cassandra for real-time multi-datacenter public cloud analytics
Julien Anguenot
 
PDF
iland Internet Solutions: Leveraging Cassandra for real-time multi-datacenter...
DataStax Academy
 
PDF
Building a fully-automated Fast Data Platform
Comsysto Reply GmbH
 
PDF
Building a fully-automated Fast Data Platform
Manuel Sehlinger
 
PDF
SREcon 2016 Performance Checklists for SREs
Brendan Gregg
 
PPTX
Intro to Apache Apex - Next Gen Platform for Ingest and Transform
Apache Apex
 
PDF
A Dataflow Processing Chip for Training Deep Neural Networks
inside-BigData.com
 
PPTX
Spark Streaming Early Warning Use Case
random_chance
 
Cassandra Tools and Distributed Administration (Jeffrey Berger, Knewton) | C*...
DataStax
 
Everything You Need to Know About Sharding
MongoDB
 
Optimizing Tiered Storage for Low-Latency Real-Time Analytics at AI Scale
Alluxio, Inc.
 
MongoDB Sharding Webinar 2014
Dylan Tong
 
End to End Processing of 3.7 Million Telemetry Events per Second using Lambda...
DataWorks Summit/Hadoop Summit
 
Linux Systems Performance 2016
Brendan Gregg
 
Apache Big Data 2016: Next Gen Big Data Analytics with Apache Apex
Apache Apex
 
Data Stream Processing - Concepts and Frameworks
Matthias Niehoff
 
ROLE OF DIGITAL SIMULATION IN CONFIGURING NETWORK PARAMETERS
Deepak Shankar
 
Large scale, distributed access management deployment with aruba clear pass
Aruba, a Hewlett Packard Enterprise company
 
High Performance Erlang - Pitfalls and Solutions
Yinghai Lu
 
Three Perspectives on Measuring Latency
ScyllaDB
 
Leveraging Cassandra for real-time multi-datacenter public cloud analytics
Julien Anguenot
 
iland Internet Solutions: Leveraging Cassandra for real-time multi-datacenter...
DataStax Academy
 
Building a fully-automated Fast Data Platform
Comsysto Reply GmbH
 
Building a fully-automated Fast Data Platform
Manuel Sehlinger
 
SREcon 2016 Performance Checklists for SREs
Brendan Gregg
 
Intro to Apache Apex - Next Gen Platform for Ingest and Transform
Apache Apex
 
A Dataflow Processing Chip for Training Deep Neural Networks
inside-BigData.com
 
Spark Streaming Early Warning Use Case
random_chance
 
Ad

Recently uploaded (20)

PPTX
7 Easy Ways to Improve Clarity in Your BI Reports
sophiegracewriter
 
PPTX
Insurance-Analytics-Branch-Dashboard (1).pptx
trivenisapate02
 
PPTX
Fluvial_Civilizations_Presentation (1).pptx
alisslovemendoza7
 
PDF
apidays Munich 2025 - Integrate Your APIs into the New AI Marketplace, Senthi...
apidays
 
PPTX
Probability systematic sampling methods.pptx
PrakashRajput19
 
PPTX
UVA-Ortho-PPT-Final-1.pptx Data analytics relevant to the top
chinnusindhu1
 
PDF
D9110.pdfdsfvsdfvsdfvsdfvfvfsvfsvffsdfvsdfvsd
minhn6673
 
PDF
202501214233242351219 QASS Session 2.pdf
lauramejiamillan
 
PPTX
Introduction to computer chapter one 2017.pptx
mensunmarley
 
PDF
apidays Munich 2025 - Developer Portals, API Catalogs, and Marketplaces, Miri...
apidays
 
PPTX
short term project on AI Driven Data Analytics
JMJCollegeComputerde
 
PPTX
White Blue Simple Modern Enhancing Sales Strategy Presentation_20250724_21093...
RamNeymarjr
 
PDF
apidays Munich 2025 - Making Sense of AI-Ready APIs in a Buzzword World, Andr...
apidays
 
PDF
Blue Futuristic Cyber Security Presentation.pdf
tanvikhunt1003
 
PPTX
M1-T1.pptxM1-T1.pptxM1-T1.pptxM1-T1.pptx
teodoroferiarevanojr
 
PPT
introdution to python with a very little difficulty
HUZAIFABINABDULLAH
 
PPTX
Pipeline Automatic Leak Detection for Water Distribution Systems
Sione Palu
 
PPTX
Data-Users-in-Database-Management-Systems (1).pptx
dharmik832021
 
PDF
Classifcation using Machine Learning and deep learning
bhaveshagrawal35
 
PPTX
Data-Driven Machine Learning for Rail Infrastructure Health Monitoring
Sione Palu
 
7 Easy Ways to Improve Clarity in Your BI Reports
sophiegracewriter
 
Insurance-Analytics-Branch-Dashboard (1).pptx
trivenisapate02
 
Fluvial_Civilizations_Presentation (1).pptx
alisslovemendoza7
 
apidays Munich 2025 - Integrate Your APIs into the New AI Marketplace, Senthi...
apidays
 
Probability systematic sampling methods.pptx
PrakashRajput19
 
UVA-Ortho-PPT-Final-1.pptx Data analytics relevant to the top
chinnusindhu1
 
D9110.pdfdsfvsdfvsdfvsdfvfvfsvfsvffsdfvsdfvsd
minhn6673
 
202501214233242351219 QASS Session 2.pdf
lauramejiamillan
 
Introduction to computer chapter one 2017.pptx
mensunmarley
 
apidays Munich 2025 - Developer Portals, API Catalogs, and Marketplaces, Miri...
apidays
 
short term project on AI Driven Data Analytics
JMJCollegeComputerde
 
White Blue Simple Modern Enhancing Sales Strategy Presentation_20250724_21093...
RamNeymarjr
 
apidays Munich 2025 - Making Sense of AI-Ready APIs in a Buzzword World, Andr...
apidays
 
Blue Futuristic Cyber Security Presentation.pdf
tanvikhunt1003
 
M1-T1.pptxM1-T1.pptxM1-T1.pptxM1-T1.pptx
teodoroferiarevanojr
 
introdution to python with a very little difficulty
HUZAIFABINABDULLAH
 
Pipeline Automatic Leak Detection for Water Distribution Systems
Sione Palu
 
Data-Users-in-Database-Management-Systems (1).pptx
dharmik832021
 
Classifcation using Machine Learning and deep learning
bhaveshagrawal35
 
Data-Driven Machine Learning for Rail Infrastructure Health Monitoring
Sione Palu
 
Ad

Chronix: Long Term Storage and Retrieval Technology for Anomaly Detection in Operational Data

  • 1. FAST 2017, Santa Clara Chronix: Long Term Storage and Retrieval Technology for Anomaly Detection in Operational Data Florian Lautenschlager, Michael Philippsen, Andreas Kumlehn, and Josef Adersberger [email protected] flolaut
  • 2. Detecting Anomalies in Running Software matters Various kinds of anomalies: • Resource consumption: anomalous memory consumption, high CPU usage, … • Sporadic failure: blocking state, deadlock, dirty read, … • Security: port scanning activity, short frequent login attempts, … Economic or reputation loss. Detection is a complex task: • Multiple components: Database, Service Discovery, Configuration Service, … • Different technologies: Go, Java, Java-Script, Python, … • Various transport protocols: HTTP, Protocol Buffers, Thrift, JSON, … 1
  • 3. Anomaly Detection Tool Chain for Operational Data Types of operational data: • Metrics: scalar values, e.g., rates, runtimes, total hits, counters, … • Events: single occurrences, e.g., a user’s login, product order, … • Traces: sequences within a software system, e.g., the called methods, … 2 Operational Data Application Collection Framework Analysis Framework Time Series Database
  • 4. Anomaly Detection Tool Chain for Operational Data 3 Collection Framework Analysis Framework Time Series Database Timestamp V1 V2 25.10.2016 00:00:01.546 218.34 51 … … … Collects operational data from a running application Asks the database for data and analyzes the data Stores the time series data
  • 5. Anomaly Detection Tool Chain for Operational Data 3 General-Purpose TSDB • Brake shoe • Resource hog • Productivity obstacle Domain specific sensors and adaptors Domain specific analysis algorithms and tools Collection Framework Analysis Framework Time Series Database Chronix: Domain specific TSDB Domain specific sensors and adaptors Domain specific analysis algorithms and tools
  • 6. State of the art: General-purpose TSDBs in Anomaly Detection 4 Graphite InfluxDB OpenTSDB KairosDB Prometheus Generic data model Analysis support Lossless long term storage Chronix High memory footprint = Performance hog High storage demands = Performance hog Loss of historical data = Brake shoe No support for analyses = Productivity obstacle = Brake shoe No support for data types = Productivity obstacle
  • 7. 7 Bullets for the domain of Anomaly Detection Option to pre-compute an extra representation of the data Optional timestamp compression for almost-periodic time series Records that meet the needs of the domain Compression technique that suits the domain’s data Underlying multi-dimensional storage Domain specific query language with server-side evaluation Domain specific commissioning of configuration parameters 5 Collection Framework Analysis FrameworkChronix 1 2 3 4 5 6 7
  • 8. Running Example: Almost-periodic time series with operational data Timestamp Value Metric Process Host 25.10.2016 00:00:01.546 218.34 ingestertime SmartHub QAMUC 25.10.2016 00:00:06.718 218.37 ingestertime SmartHub QAMUC 25.10.2016 00:00:11.891 218.49 ingestertime SmartHub QAMUC 25.10.2016 00:00:16.964 218.52 ingestertime SmartHub QAMUC … … … … … … … … … … 6
  • 9. Option to pre-compute data to speed up analyses • Chronix is lossless: it keeps all details because the analyses are ad-hoc and may need them. • Chronix offers a programming interface for adding extra domain specific “columns”. Examples: Fourier transformation, Symbolic Aggregate approXimation (SAX), etc. • Added “columns” speed up anomaly detection queries. 7 Timestamp Value Metric Process Host SAX 25.10.2016 00:00:01.546 218.34 ingestertime SmartHub QAMUC A 25.10.2016 00:00:06.718 218.37 ingestertime SmartHub QAMUC B 25.10.2016 00:00:11.891 218.49 ingestertime SmartHub QAMUC C 25.10.2016 00:00:16.964 218.52 ingestertime SmartHub QAMUC D … … … … … … … … … … … … 1
  • 10. Optional timestamp compaction • It suffices to be able to reconstruct approximate timestamps for almost-periodic time series. • Date-Delta-Compaction • Chronix is functionally lossless as it keeps all relevant details. • The tolerable degree of inaccuracy is a 8 Timestamp Value Metric Process Host SAX 25.10.2016 00:00:01.546 218.34 ingestertime SmartHub QAMUC A 5.172 218.37 ingestertime SmartHub QAMUC B - 218.49 ingestertime SmartHub QAMUC C - 218.52 ingestertime SmartHub QAMUC D … … … … … … … … … … 2 Configuration Parameter of 7 Space saved
  • 11. Date-Delta-Compaction 9 Timestamp 25.10.2016 00:00:01.546 25.10.2016 00:00:06.718 25.10.2016 00:00:11.891 25.10.2016 00:00:16.964 … … Timestamp 25.10 … :01.546 5.172 5.173 5.073 … … Timestamp 25.10 … :01.546 5.172 0.001 0.1 … … Timestamp 25.10 … :01.546 5.172 - - … … Calculate deltas Compute diffs between them Drop diffs below threshold If accumulated drift > threshold store delta. (Upper bound on inaccuracy) Timestamp 25.10 … :01.546 5.172 - - … … space saved space saved
  • 12. Domain specific data characteristics 10 Timestamp Value Metric Process Host SAX 25.10.2016 00:00:01.546 218.34 ingestertime SmartHub QAMUC A 5.172 218.37 ingestertime SmartHub QAMUC B - 218.49 ingestertime SmartHub QAMUC C - 218.52 ingestertime SmartHub QAMUC D … … … … … … … … … … … … Many anomaly detection tasks need blocks of data rather than “lines”. Repetitive values. Repetitive values. “Columns” with repetitive values. Some compression techniques work better than others.
  • 13. Records that meet the needs of the domain Therefore: Record := Attributes + Start + End + Type + Data Chunk • Chronix offers a programming interface to implement time series specific records. • Chronix exploits repetitiveness and bundles “lines” into data chunks. • The chunk size is a 11 Timestamp Value Metric Process Host SAX 25.10.2016 00:00:01.546 218.34 ingestertime SmartHub QAMUC A 5.172 218.37 ingestertime SmartHub QAMUC B - 218.49 ingestertime SmartHub QAMUC C - 218.52 ingestertime SmartHub QAMUC D … … … … … … … … … … … … 1 2 1 3 Configuration Parameter of 7 Record metric: ingestertime process: SmartHub host: QAMUC start: 25.10.2016 00:00:01.546 end: … type: metric data: Timestamp Value SAX 25.10.2016 00:00:01.546 218.34 A 5.172 218.37 B - 218.49 C - 218.52 D 2 1 chunk & convert 2 21 BLOB
  • 14. Compression technique that suits the domain’s data • Chronix exploits that domain data often has small increments, recurring patterns, etc. • Chronix uses a lossless compression technique that minimizes (record sizes + index sizes). • The choice of compression technique is a 12 Record metric: ingestertime process: SmartHub host: QAMUC start: 25.10.2016 00:00:01.546 end: … type: metric data: 00105e0 e6b0 343b 9c74 080 7bc 0804 e7d5 0804 00105f0 4 Configuration Parameter of 7 Record metric: ingestertime process: SmartHub host: QAMUC start: 25.10.2016 00:00:01.546 end: … type: metric data: Timestamp Value SAX 25.10.2016 00:00:01.546 218.34 A 5.172 218.37 B - 218.49 C - 218.52 D Compressed BLOB serialize & compress
  • 15. Underlying multi-dimensional storage By using a multi-dimensional storage … • … Chronix supports explorative analyses. • Attributes are visible to the storage and indexed. • Users can use any combination to find a record. • … Chronix supports correlating analyses. • Every type of data can be stored. • Queries can use and combine types. 13 q=host:QAMUC AND metric:ingester* AND type:[metric OR trace] AND end:NOW-7MONTH 5 Record metric: ingestertime process: SmartHub host: QAMUC start: 25.10.2016 00:00:01.546 end: … type: metric data: 00105e0 e6b0 343b 9c74 080 7bc 0804 e7d5 0804 00105f0 Record metric: ingestermethods process: SmartHub host: QAMUC start: 25.10.2016 00:00:01.546 end: … type: trace data: d65fa01 7ab2 433c 7c8e f123 2ca 0713 a8f5 926b 01006e1
  • 16. Domain specific query language with server-side evaluation • Chronix offers not just basic functions but also high-level built-in domain specific analysis functions. • Chronix evaluates functions server-side for speed. • Chronix offers a plug-in interface to add functions. 14 basicfunctionsalsoneeded foranomaly detection 6
  • 17. Domain specific query language with server-side evaluation • Chronix achieves more programming comfort & fast results. 15 6 Chronix Query 1: q=metric:ingestertime & cf=outlier General-Purpose Time Series Database query 1 Query 1: select q(0.25,time),q(0.75,time) from ingester Calculate threshold Query 2: select time from ingester where time >= threshold high-level function query 1 read result process read result process read processresult query 2extra code 1x query 1x latency 2x query extra code 2x latency extra codeextra code
  • 18. Operational data of 5 industry projects 16 Description Interval (sec) Pairs (mio) Time series P1 Application for searching car maintenance and repair instructions. (8 app sever, 20 search server) 30 2,4 1,080 P2 Retail application for orders, billing, and customer relations. (1 database, 2 app server) 60 331.4 8,567 P3 Sales application of a car manufacturer. (1 database, 2 app servers) 30 162.6 4,538 P4 Service application for modern cars (music streaming) 1 metric 3.9 lsof 0.4 strace 12.1 500 P5 Manage the compatibility of software components in a car. 60 3,762.3 24,055 Total 4,275.1 38,740 used for the Evaluation 7used for
  • 19. Best threshold for the Date-Delta-Compaction 17 DDC = 200 7
  • 20. Operational data of 3 (of 5) industry projects 18 Description Interval (sec) Pairs (mio) Time series r q P1 Application for searching car maintenance and repair instructions. (8 app sever, 20 search server) 30 2,4 1,080 P2 Retail application for orders, billing, and customer relations. (1 database, 2 app server) 60 331.4 8,567 P3 Sales application of a car manufacturer. (1 database, 2 app servers) 30 162.6 4,538 P4 … … … … P5 … … … … Total 4,275.1 38,740 91 2 56 1 28 3 21 5 7 30 1 30 0.5 15 … … … … Query Mix r = range (days) q= # of queries 7
  • 21. Best compression technique & Best chunk size for query mix 19 C= 128 KB, t= gzip 7
  • 22. Operational data of 2 of (5) industry projects Evaluation 20 Description Interval (sec) Pairs (mio) Time series r q b h P1 … … … … P2 … … … … P3 … … … … P4 Service application for modern cars (music streaming) 1 metric 3.9 lsof 0.4 strace 12.1 500 P5 Manage the compatibility of software components in a car. 60 3,762.3 24,055 Total 4,275.1 38,740 180 2 2 0 91 2 1 2 56 1 4 3 28 5 4 6 21 12 2 6 14 8 7 8 7 15 5 10 1 11 6 6 0.5 1 1 2 … … … … … … … … … … … … Query Mix r = range (days) q= # of queries b= # of basis queries h= # of high- level queries
  • 23. TSDBs under test Comparisons Quantitative comparison 21 General-Purpose TSDB • Productivity obstacles • Brake shoe • Resource hog Time Series Database Chronix: Domain specific TSDB InfluxDB OpenTSDB KairosDB Chronix a) Memory footprint b) Storage demand c) Data retrieval times d) Query mix runtimes
  • 24. a) Memory footprint Memory footprint of the databases (in MB) 22 Chronix has a 34% – 69% smaller memory footprint. InfluxDB OpenTSDB KairosDB Chronix Initially after startup (processes up and running) 33 2,726 8,763 446 Maximal memory usage during import 10,336 10,111 18,905 7,002 Maximal memory usage during query 8,269 9,712 11,230 4,792
  • 25. b) Storage demand 23 Chronix saves 20% – 68% of the storage space. Storage demand (in GB) Raw data InfluxDB OpenTSDB KairosDB Chronix Project 4 1.2 0.2 0.2 0.3 0.1 Project 5 107.0 10.7 16.9 26.5 8.6 total 108.2 10.9 17.1 26.8 8.7
  • 26. Data retrieval times for 20 ∙ 58 queries (in s) c) Data retrieval times 24 r q InfluxDB OpenTSDB KairosDB Chronix 0.5 2 4.3 2.8 4.4 0.9 1 11 5.5 5.6 6.6 5.3 7 15 34.1 17.4 26.8 7.0 14 8 36.2 14.2 25.5 4.0 21 12 76.5 29.8 55.0 6.0 28 5 7.9 3.9 5.6 0.5 56 1 35.4 12.4 24.1 1.2 91 2 47.5 15.5 33.8 1.1 180 2 96.7 36.7 66.6 1.1 total 343.8 138.3 248.4 27.1 Chronix saves 80% – 92% on data retrieval times.
  • 27. d) Query mix runtimes Runtimes of 20 ∙ 75 b- and h-queries (in s) 25 q InfluxDB OpenTSDB KairosDB Chronix Basic(b) 4 avg 0.9 6.1 9.8 4.4 5 max 1.3 8.4 9.1 6.0 3 min 0.7 2.7 5.3 2.8 3 stddev. 6.7 16.7 21.1 2.3 5 sum 0.7 6.0 12.0 2.0 4 count 0.8 5.5 10.5 1.0 8 perc. 10.2 25.8 34.5 8.6 High-level(h) 12 outlier 30.7 29.1 117.6 18.9 14 trend 162.7 50.4 100.6 30.2 11 frequency 47.3 23.9 45.7 16.3 3 grpsize 218.9 2927.8 206.3 29.6 3 split 123.1 2893.9 47.9 37.2 75 total 604.0 5996.3 620.4 159.3 Chronix saves 73% – 97% of the runtime of analyzing queries. more important
  • 28. Chronix unleashes Anomaly Detection tasks 7 domain specific levers to unleash Anomaly Detection 1. Option to pre-compute an extra representation of the data 2. Optional timestamp compression for almost-periodic time series 3. Records that meet the needs of the domain 4. Compression technique that suits the domain’s data 5. Underlying multi-dimensional storage 6. Domain specific query language with server-side evaluation 7. Domain specific commissioning of configuration parameters 4 beneficial performance effects • Chronix has a 34% – 69% smaller memory footprint. • Chronix saves 20% – 68% of the storage space. • Chronix saves 80% – 92% on data retrieval time. • Chronix saves 73% – 97% of the runtime of analyzing queries. 26 www.chronix.io open source