Downloaded 1,007 times


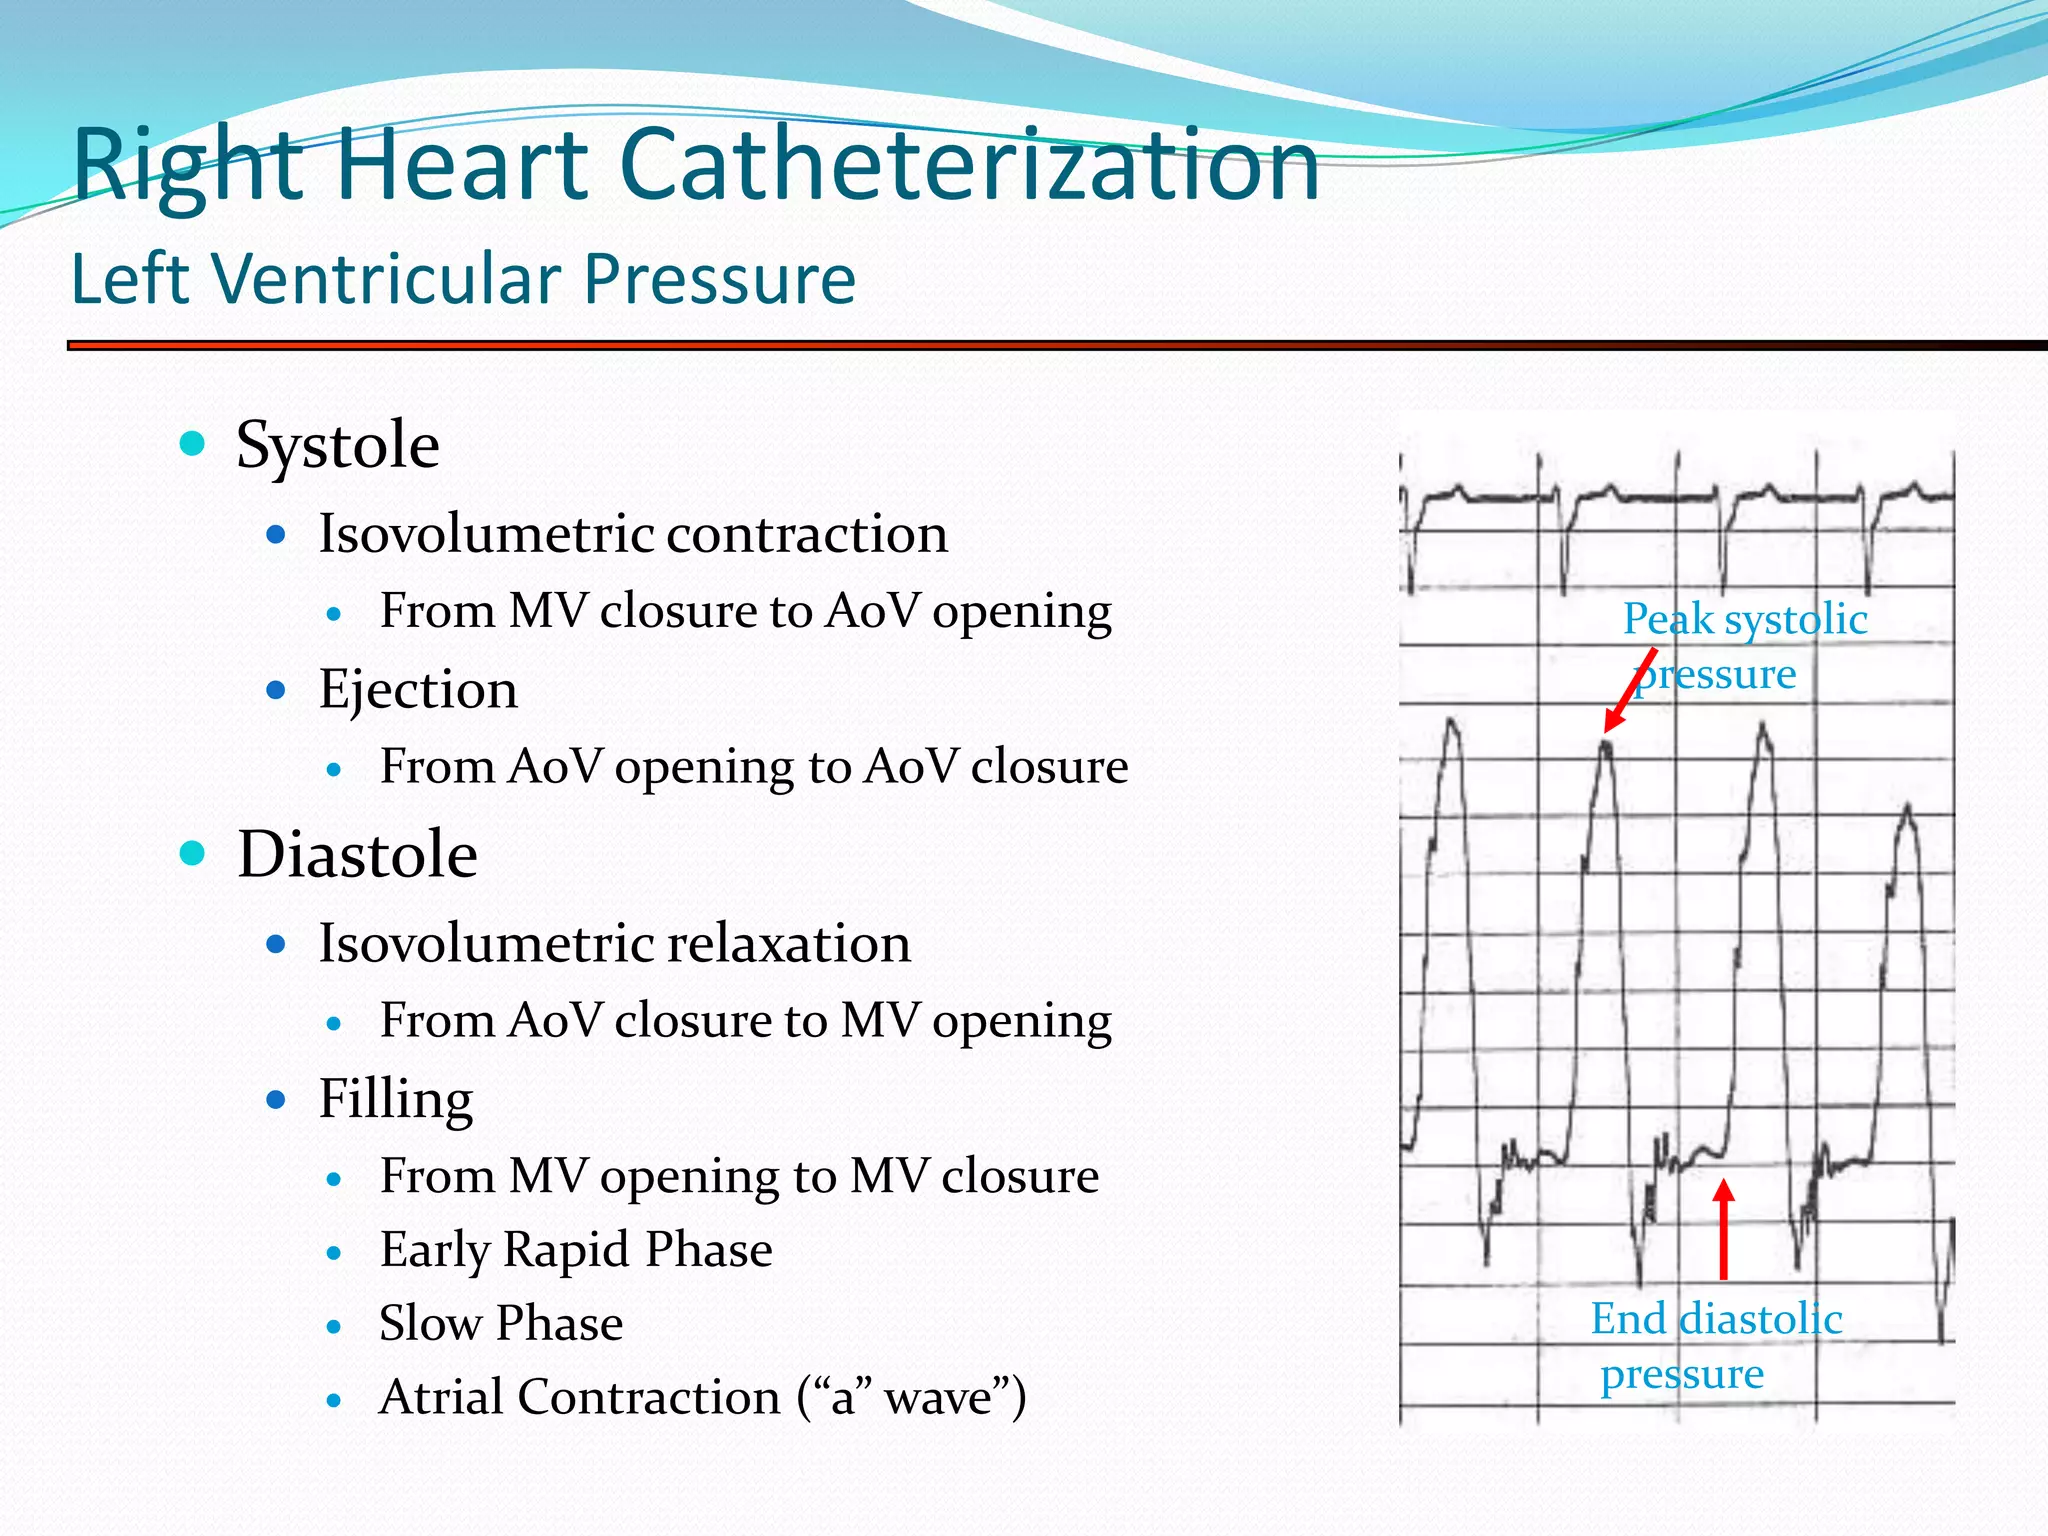


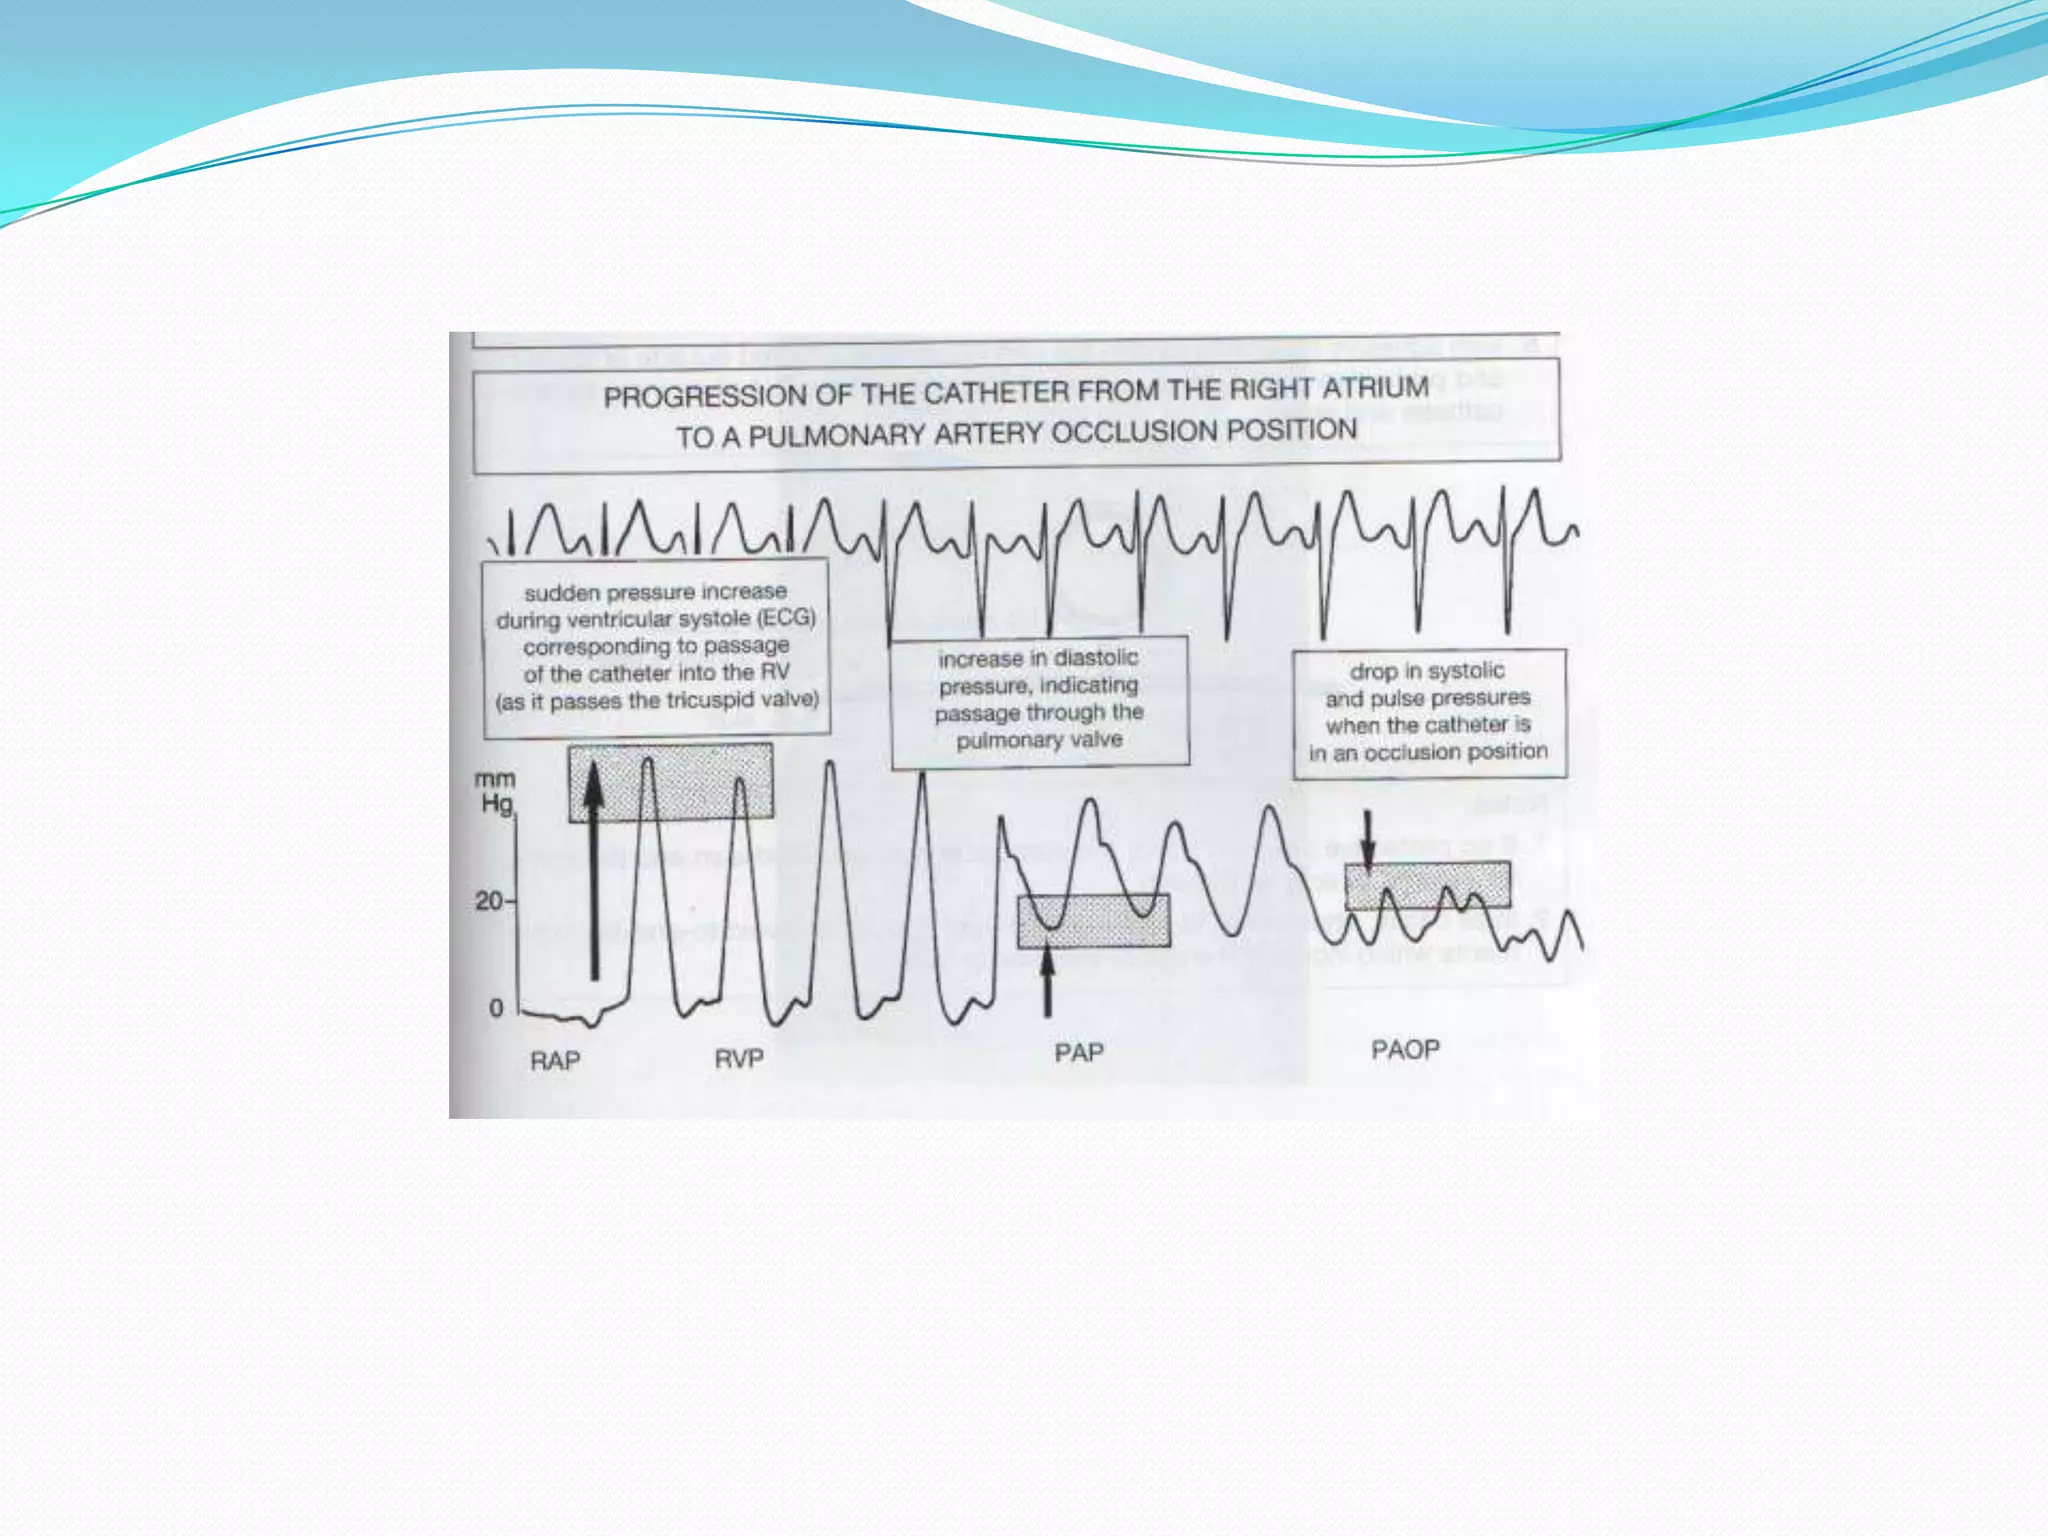


The document describes various hemodynamic measurements and pressure tracings obtained from right heart catheterization. It discusses normal and abnormal left ventricular pressure tracings and their components during systole and diastole. It also describes normal and abnormal right atrial, right ventricular, pulmonary artery, and pulmonary capillary wedge pressure tracings, including how different disease states can affect the pressure waveform morphology. Various concepts in hemodynamic measurements are summarized such as timing of pressure waves, effects of respiration, and identifying features of common cardiac pathologies.


