SlideShare a Scribd company logo
Continuous Probability Distribution
Bipul Kumar Sarker
Lecturer
BBA Professional
Habibullah Bahar University College
Chapter-04
History of Normal Distribution
The normal distribution was first discovered by De Moivre (English
Mathematician) in 1733 as limiting case of binomial distribution. Later it
was applied in natural and social science by Laplace (French
Mathematician) in 1777. The normal distribution is also known as Gaussian
distribution in honor of Karl Friedrich Gauss(1809).
Bipul Kumar Sarker, Lecturer (BBA Professional), HBUC
3.3.1 Definition Of Normal Distribution:
A continuous random variable X is said to follow normal distribution with mean m and
standard deviation s, if its probability density function is define as follow,
Note:
The mean m and standard deviation s are called the parameters of Normal
distribution. The normal distribution is expressed by 𝑋~𝑁 𝜇, 𝜎2 .
Bipul Kumar Sarker, Lecturer (BBA Professional), HBUC
3.3.2 Condition of Normal Distribution:
i. Normal distribution is a limiting form of the binomial distribution under the
following conditions.
a. n, the number of trials is indefinitely large ie., 𝑛 → ∞ and
b. Neither p nor q is very small.
ii. Normal distribution can also be obtained as a limiting form of Poisson distribution
with parameter 𝑚 → ∞
iii. Constants of normal distribution are mean = m, variation = 𝜎2, Standard deviation = s
Bipul Kumar Sarker, Lecturer (BBA Professional), HBUC
3.3.3 Normal Probability Curve:
The curve representing the normal distribution is called the normal probability
curve. The curve is symmetrical about the mean (m), bell-shaped and the two tails
on the right and left sides of the mean extends to the infinity. The shape of the curve
is shown in the following figure.
Bipul Kumar Sarker, Lecturer (BBA Professional), HBUC
3.3.4 Properties of Normal Distribution:
i. The normal curve is bell shaped and is symmetric at x = m.
ii. Mean, median, and mode of the distribution are coincide
i.e., Mean = Median = Mode = m
iii. It has only one mode at x = m (i.e., unimodal)
iv. Since the curve is symmetrical, Skewness = 𝛽1 = 0 and Kurtosis = 𝛽2= 3
v. The points of inflection are at x = m ± s
Bipul Kumar Sarker, Lecturer (BBA Professional), HBUC
vi. The maximum ordinate occurs at x = m and its value is
1
𝜎 2𝜋
vii. The x axis is an asymptote to the curve
i.e. the curve continues to approach but never touches the x axis
viii. The first and third quartiles are equidistant from median.
ix. The mean deviation about mean is 0.8 s
3.3.4 Properties of Normal Distribution:
Bipul Kumar Sarker, Lecturer (BBA Professional), HBUC
X. Quartile deviation = 0.6745 s
XI. If X and Y are independent normal variates with mean 𝜇1 and 𝜇2, and variance 𝜎1 And
𝜎2 respectively then their sum (X + Y) is also a normal variate with mean (𝜇1 + 𝜇2) and
variance 𝜎1
2 + 𝜎2
2
XII. Area Property P(m - s < Z < m + s) = 0.6826
P(m - 2s < Z < m + 2s) = 0.9544
P(m - 3s < Z < m + 3s) = 0.9973
3.3.4 Properties of Normal Distribution:
Bipul Kumar Sarker, Lecturer (BBA Professional), HBUC
3.3.5 Standard Normal distribution:
Let X be random variable which follows normal distribution with mean m and
variance 𝜎2
.The standard normal variate is defined as 𝑍 =
𝑋−𝜇
𝜎
which follows
standard normal distribution with mean 0 and standard deviation 1 i.e., Z ~ N(0,1).
The standard normal distribution is given by
𝚽 𝒁 =
𝟏
𝟐𝝅
𝒆−
𝟏
𝟐
𝒛 𝟐
; −∞ < 𝒁 < ∞
The advantage of the above function is that it doesn’t’ contain any parameter.
This enable us to compute the area under the normal probability curve.
Bipul Kumar Sarker, Lecturer (BBA Professional), HBUC
3.3.6 Area properties of Normal curve:
The total area under the normal probability curve is 1. The curve is also called
standard probability curve. The area under the curve between the ordinates at x = a
and x = b where a < b, represents the probabilities that x lies between x = a and x = b
i.e., P(a  x  b)
Bipul Kumar Sarker, Lecturer (BBA Professional), HBUC
To find any probability value of x, we first standardize it by using 𝑍 =
𝑋−𝜇
𝜎
, and use
the area probability normal table.
Bipul Kumar Sarker, Lecturer (BBA Professional), HBUC
Example:
The probability that the normal random variable x to lie in the interval (m-s , m+s) is given by,
1.
Bipul Kumar Sarker, Lecturer (BBA Professional), HBUC
2.
Bipul Kumar Sarker, Lecturer (BBA Professional), HBUC
3.
Bipul Kumar Sarker, Lecturer (BBA Professional), HBUC
The probability that a normal variate x lies outside the range m ± 3s is given by
Thus we expect that the values in a normal probability curve will lie between the range
m ± 3s, though theoretically it range from -  to .
Bipul Kumar Sarker, Lecturer (BBA Professional), HBUC
Example -01
Find the probability that the standard normal variate lies between 0 and 1.56
Solution:
−∞ 𝑍 = 0 𝑍 = 1.56 +∞
P(0< z< 1.56) = Area between z = 0 and z = 1.56
= 0.4406 (from table)
Bipul Kumar Sarker, Lecturer (BBA Professional), HBUC
Example-02
Find the area of the standard normal variate from –1.96 to 0.
Solution:
−∞ 𝑍 = −1.96 𝑍 = 0 +∞
Area between z = 0 & z =-1.96
is same as the area z = 0 to z = 1.96
P(-1.96 < z < 0) = P(0 < z < 1.96) (by symmetry)
= 0.4750 (from the table)
Bipul Kumar Sarker, Lecturer (BBA Professional), HBUC
P(z >0.25) = P(0<z < ) – P(0<z<0.25)
= 0.5000 - 0.0987 (from the table)
= 0.4013
Example-03
Find the area to the right of z = 0.25
Solution:
Bipul Kumar Sarker, Lecturer (BBA Professional), HBUC
Example-04
Find the area to the left of z = 1.5
Solution:
P(z < 1.5) = P( -  < z < 0 ) + P( 0 < z < 1.5 )
= 0.5 + 0.4332 (from the table)
= 0.9332
Bipul Kumar Sarker, Lecturer (BBA Professional), HBUC
Example-05
Find the area of the standard normal variate
between –1.96 and 1.5
Solution:
P(-1.96 < z < 1.5) = P(-1.96 < z < 0) + P(0 < z < 1.5)
= P(0 < z < 1.96) + P(0 < z < 1.5)
= 0.4750 + 0.4332 (from the table)
= 0.9082
Bipul Kumar Sarker, Lecturer (BBA Professional), HBUC
Example-06
Given a normal distribution with m = 50 and s = 8, find the probability that x assumes a
value between 42 and 64.
Solution:
Given that m = 50 and s = 8
The standard normal variate, 𝑍 =
𝑋−𝜇
𝜎
If X = 42, 𝑍 =
42−50
8
= −1
If X = 64, 𝑍 =
64−50
8
= 1.74
Bipul Kumar Sarker, Lecturer (BBA Professional), HBUC
P(42 < x < 64) = P(-1 < z <1.75)
= P(-1< z < 0) + P(0 < z <1.95)
= P(0<z<1) + P (0 < z <1.75) (by symmetry)
= 0.3413 +0 .4599 (from the table)
= 0 .8012
If X = 42, 𝑍 =
42−50
8
= −1
If X = 64, 𝑍 =
64−50
8
= 1.74
Bipul Kumar Sarker, Lecturer (BBA Professional), HBUC
Example-07
Students of a class were given an aptitude test. Their marks were found to be normally
distributed with mean 60 and standard deviation 5. What percentage of students scored.
i) More than 60 marks
ii) Less than 56 marks
iii)Between 45 and 65 marks
Bipul Kumar Sarker, Lecturer (BBA Professional), HBUC
i. The standard normal variate,𝑍 =
𝑋−𝜇
𝜎
If X = 60, 𝑍 =
60−60
5
= 0
P(x > 60) = P(z > 0)
= P(0 < z <  )
= 0.5
Hence the percentage of students scored more than 60 marks is 0.5×100 = 50 %
Solution:
Given that mean = m = 60 and standard deviation = s = 5
Bipul Kumar Sarker, Lecturer (BBA Professional), HBUC
ii. The standard normal variate,
𝑍 =
𝑋−𝜇
𝜎
If X = 56, 𝑍 =
56−60
5
= −0.8
P(x < 56) = P(z < -0.8)
= P(-  < z < 0) – P(-0.8 < z < 0) (by symmetry)
= P(0 < z < ) – P(0 < z < 0.8)
= 0.5 - 0.2881 (from the table)
= 0.2119
Bipul Kumar Sarker, Lecturer (BBA Professional), HBUC
Hence the percentage of students score less than 56 marks is 0.2119×100 = 21.19 %
Bipul Kumar Sarker, Lecturer (BBA Professional), HBUC
−∞ 𝑍 = −3 𝑍 = 0 𝑍 = 1 +∞
iii. The standard normal variate, 𝑍 =
𝑋−𝜇
𝜎
If X = 45, 𝑍 =
45−60
5
= −3
If X = 65, 𝑍 =
65−60
5
= 1
P(45 < x < 65) = P(-3 < z < 1)
= P(-3 < z < 0 ) + P ( 0 < z < 1)
= P(0 < z < 3) + P(0 < z < 1) ( by symmetry)
= 0.4986 + 0.3413 (from the table)
= 0.8399
Bipul Kumar Sarker, Lecturer (BBA Professional), HBUC
Hence the percentage of students scored between 45 and 65 marks is 0.8399×100 = 83.99 %
Bipul Kumar Sarker, Lecturer (BBA Professional), HBUC
Example-08
X is normal distribution with mean 2 and standard deviation 3. Find the value of the
variable x such that the probability of the interval from mean to that value is 0.4115
Solution:
Given m = 2, s = 3
Suppose z1 is required standard value,
Thus 𝑃 (0 < 𝑧 < 𝑧1) = 0.4115
From the table the value corresponding to the area 0.4115 is 1.35 that is 𝑧1 = 1.35
Bipul Kumar Sarker, Lecturer (BBA Professional), HBUC
Here, 𝑧1 =
𝑋−𝜇
𝜎
⇒ 1.35 =
𝑋 − 2
3
⇒ 1.35 × 3 + 2 = 𝑋
 𝑋 = 6.05
Bipul Kumar Sarker, Lecturer (BBA Professional), HBUC

More Related Content

What's hot (20)

PDF
Basic concepts of probability
Avjinder (Avi) Kaler
 
PPTX
Binomial distribution
Sushmita R Gopinath
 
PPT
Statistics: Probability
Sultan Mahmood
 
PPTX
introduction to probability
lovemucheca
 
PPTX
Probability
var93
 
PPTX
Probability
Rushina Singhi
 
PPTX
Hypergeometric probability distribution
Nadeem Uddin
 
PPTX
Statistics & probability
Suzaan van Heerden
 
PPTX
Bayes rule (Bayes Law)
Tish997
 
PPTX
Conditional probability
suncil0071
 
PPTX
Probability Distribution
Sagar Khairnar
 
PPTX
Basic probability concept
Mmedsc Hahm
 
PPT
probability
Unsa Shakir
 
PPT
Basic concept of probability
Ikhlas Rahman
 
PPT
Probability
Maria Romina Angustia
 
PPTX
Small sample test
Parag Shah
 
PPTX
Binomial distribution
yatin bhardwaj
 
PPTX
Theory of estimation
Tech_MX
 
PDF
Discrete probability distributions
Habibullah Bahar University College
 
Basic concepts of probability
Avjinder (Avi) Kaler
 
Binomial distribution
Sushmita R Gopinath
 
Statistics: Probability
Sultan Mahmood
 
introduction to probability
lovemucheca
 
Probability
var93
 
Probability
Rushina Singhi
 
Hypergeometric probability distribution
Nadeem Uddin
 
Statistics & probability
Suzaan van Heerden
 
Bayes rule (Bayes Law)
Tish997
 
Conditional probability
suncil0071
 
Probability Distribution
Sagar Khairnar
 
Basic probability concept
Mmedsc Hahm
 
probability
Unsa Shakir
 
Basic concept of probability
Ikhlas Rahman
 
Probability
Maria Romina Angustia
 
Small sample test
Parag Shah
 
Binomial distribution
yatin bhardwaj
 
Theory of estimation
Tech_MX
 
Discrete probability distributions
Habibullah Bahar University College
 

Similar to Continuous probability distribution (20)

PDF
Chi-square distribution
Habibullah Bahar University College
 
PDF
learning about statistics lecture fourteen
NamPhmPhng9
 
PDF
Solution to the Practice Test 3A, Chapter 6 Normal Probability Distribution
Long Beach City College
 
PDF
Solution to the Practice Test 3A, Normal Probability Distribution
Long Beach City College
 
PPT
-Normal-Distribution-ppt.ppt-POWER PRESENTATION ON STATISTICS AND PROBABILITY
RODULFOVPAQUINGAN
 
PPTX
Stat Module 3 Normal Distribution ppt.pptx
MaricarDimas2
 
PDF
Module 6 - Continuous Distribution_efcd52595b081d24a9bc3ca31b5f8d05.pdf
NaseebAlii
 
PPTX
NORMAL DISTRIBUTION FIN [Autosaved].pptx
JunBambalan1
 
PDF
10-probability-distribution-sta102.pdfhh
primcejames
 
PDF
슬로우캠퍼스: scikit-learn & 머신러닝 (강박사)
마이캠퍼스
 
PPTX
Regression Analysis
Muhammad Fazeel
 
PDF
Regression analysis
Awais Salman
 
PDF
Lecture 01 probability distributions
mohamed ali
 
PPTX
Normal Distribution.pptx
Ravindra Nath Shukla
 
PPTX
L5.pptx jsnushebdiodjenenehdydyhdhieoskdjdn
DanielleJuliano2
 
PPTX
Statistical computing2
Padma Metta
 
DOCX
How normal distribution is used in heights, blood pressure, measurement error...
Umair Raza
 
PPTX
probalilty and STATistics - PowerPT.pptx
dans15pats
 
PPTX
wk-2.pptx
reneejanetubig1
 
Chi-square distribution
Habibullah Bahar University College
 
learning about statistics lecture fourteen
NamPhmPhng9
 
Solution to the Practice Test 3A, Chapter 6 Normal Probability Distribution
Long Beach City College
 
Solution to the Practice Test 3A, Normal Probability Distribution
Long Beach City College
 
-Normal-Distribution-ppt.ppt-POWER PRESENTATION ON STATISTICS AND PROBABILITY
RODULFOVPAQUINGAN
 
Stat Module 3 Normal Distribution ppt.pptx
MaricarDimas2
 
Module 6 - Continuous Distribution_efcd52595b081d24a9bc3ca31b5f8d05.pdf
NaseebAlii
 
NORMAL DISTRIBUTION FIN [Autosaved].pptx
JunBambalan1
 
10-probability-distribution-sta102.pdfhh
primcejames
 
슬로우캠퍼스: scikit-learn & 머신러닝 (강박사)
마이캠퍼스
 
Regression Analysis
Muhammad Fazeel
 
Regression analysis
Awais Salman
 
Lecture 01 probability distributions
mohamed ali
 
Normal Distribution.pptx
Ravindra Nath Shukla
 
L5.pptx jsnushebdiodjenenehdydyhdhieoskdjdn
DanielleJuliano2
 
Statistical computing2
Padma Metta
 
How normal distribution is used in heights, blood pressure, measurement error...
Umair Raza
 
probalilty and STATistics - PowerPT.pptx
dans15pats
 
wk-2.pptx
reneejanetubig1
 
Ad

More from Habibullah Bahar University College (9)

PDF
Basic Concept of Collection and Presentation of Business Data
Habibullah Bahar University College
 
PDF
Project scheduling (chapter 05)(wp)
Habibullah Bahar University College
 
PDF
Measures of dispersion
Habibullah Bahar University College
 
PDF
Collection and Presentation of Business Data
Habibullah Bahar University College
 
PDF
Introduction of statistics (chapter 01)
Habibullah Bahar University College
 
PDF
Time series Analysis
Habibullah Bahar University College
 
PDF
Concept of probability
Habibullah Bahar University College
 
Basic Concept of Collection and Presentation of Business Data
Habibullah Bahar University College
 
Project scheduling (chapter 05)(wp)
Habibullah Bahar University College
 
Measures of dispersion
Habibullah Bahar University College
 
Collection and Presentation of Business Data
Habibullah Bahar University College
 
Introduction of statistics (chapter 01)
Habibullah Bahar University College
 
Concept of probability
Habibullah Bahar University College
 
Ad

Recently uploaded (20)

PPTX
The Future of Artificial Intelligence Opportunities and Risks Ahead
vaghelajayendra784
 
PPTX
Basics and rules of probability with real-life uses
ravatkaran694
 
PPTX
CONCEPT OF CHILD CARE. pptx
AneetaSharma15
 
PDF
Virat Kohli- the Pride of Indian cricket
kushpar147
 
PPTX
Sonnet 130_ My Mistress’ Eyes Are Nothing Like the Sun By William Shakespear...
DhatriParmar
 
PPTX
Rules and Regulations of Madhya Pradesh Library Part-I
SantoshKumarKori2
 
PPTX
Unlock the Power of Cursor AI: MuleSoft Integrations
Veera Pallapu
 
PPTX
Cleaning Validation Ppt Pharmaceutical validation
Ms. Ashatai Patil
 
PDF
The Minister of Tourism, Culture and Creative Arts, Abla Dzifa Gomashie has e...
nservice241
 
PDF
Module 2: Public Health History [Tutorial Slides]
JonathanHallett4
 
PPTX
YSPH VMOC Special Report - Measles Outbreak Southwest US 7-20-2025.pptx
Yale School of Public Health - The Virtual Medical Operations Center (VMOC)
 
PPTX
Artificial Intelligence in Gastroentrology: Advancements and Future Presprec...
AyanHossain
 
PPTX
Introduction to pediatric nursing in 5th Sem..pptx
AneetaSharma15
 
PPTX
Cybersecurity: How to Protect your Digital World from Hackers
vaidikpanda4
 
PPTX
Introduction to Probability(basic) .pptx
purohitanuj034
 
PDF
TOP 10 AI TOOLS YOU MUST LEARN TO SURVIVE IN 2025 AND ABOVE
digilearnings.com
 
PPTX
Python-Application-in-Drug-Design by R D Jawarkar.pptx
Rahul Jawarkar
 
PPTX
TOP 10 AI TOOLS YOU MUST LEARN TO SURVIVE IN 2025 AND ABOVE
digilearnings.com
 
PPTX
Applications of matrices In Real Life_20250724_091307_0000.pptx
gehlotkrish03
 
PPTX
K-Circle-Weekly-Quiz12121212-May2025.pptx
Pankaj Rodey
 
The Future of Artificial Intelligence Opportunities and Risks Ahead
vaghelajayendra784
 
Basics and rules of probability with real-life uses
ravatkaran694
 
CONCEPT OF CHILD CARE. pptx
AneetaSharma15
 
Virat Kohli- the Pride of Indian cricket
kushpar147
 
Sonnet 130_ My Mistress’ Eyes Are Nothing Like the Sun By William Shakespear...
DhatriParmar
 
Rules and Regulations of Madhya Pradesh Library Part-I
SantoshKumarKori2
 
Unlock the Power of Cursor AI: MuleSoft Integrations
Veera Pallapu
 
Cleaning Validation Ppt Pharmaceutical validation
Ms. Ashatai Patil
 
The Minister of Tourism, Culture and Creative Arts, Abla Dzifa Gomashie has e...
nservice241
 
Module 2: Public Health History [Tutorial Slides]
JonathanHallett4
 
YSPH VMOC Special Report - Measles Outbreak Southwest US 7-20-2025.pptx
Yale School of Public Health - The Virtual Medical Operations Center (VMOC)
 
Artificial Intelligence in Gastroentrology: Advancements and Future Presprec...
AyanHossain
 
Introduction to pediatric nursing in 5th Sem..pptx
AneetaSharma15
 
Cybersecurity: How to Protect your Digital World from Hackers
vaidikpanda4
 
Introduction to Probability(basic) .pptx
purohitanuj034
 
TOP 10 AI TOOLS YOU MUST LEARN TO SURVIVE IN 2025 AND ABOVE
digilearnings.com
 
Python-Application-in-Drug-Design by R D Jawarkar.pptx
Rahul Jawarkar
 
TOP 10 AI TOOLS YOU MUST LEARN TO SURVIVE IN 2025 AND ABOVE
digilearnings.com
 
Applications of matrices In Real Life_20250724_091307_0000.pptx
gehlotkrish03
 
K-Circle-Weekly-Quiz12121212-May2025.pptx
Pankaj Rodey
 

Continuous probability distribution

  • 1. Continuous Probability Distribution Bipul Kumar Sarker Lecturer BBA Professional Habibullah Bahar University College Chapter-04
  • 2. History of Normal Distribution The normal distribution was first discovered by De Moivre (English Mathematician) in 1733 as limiting case of binomial distribution. Later it was applied in natural and social science by Laplace (French Mathematician) in 1777. The normal distribution is also known as Gaussian distribution in honor of Karl Friedrich Gauss(1809). Bipul Kumar Sarker, Lecturer (BBA Professional), HBUC
  • 3. 3.3.1 Definition Of Normal Distribution: A continuous random variable X is said to follow normal distribution with mean m and standard deviation s, if its probability density function is define as follow, Note: The mean m and standard deviation s are called the parameters of Normal distribution. The normal distribution is expressed by 𝑋~𝑁 𝜇, 𝜎2 . Bipul Kumar Sarker, Lecturer (BBA Professional), HBUC
  • 4. 3.3.2 Condition of Normal Distribution: i. Normal distribution is a limiting form of the binomial distribution under the following conditions. a. n, the number of trials is indefinitely large ie., 𝑛 → ∞ and b. Neither p nor q is very small. ii. Normal distribution can also be obtained as a limiting form of Poisson distribution with parameter 𝑚 → ∞ iii. Constants of normal distribution are mean = m, variation = 𝜎2, Standard deviation = s Bipul Kumar Sarker, Lecturer (BBA Professional), HBUC
  • 5. 3.3.3 Normal Probability Curve: The curve representing the normal distribution is called the normal probability curve. The curve is symmetrical about the mean (m), bell-shaped and the two tails on the right and left sides of the mean extends to the infinity. The shape of the curve is shown in the following figure. Bipul Kumar Sarker, Lecturer (BBA Professional), HBUC
  • 6. 3.3.4 Properties of Normal Distribution: i. The normal curve is bell shaped and is symmetric at x = m. ii. Mean, median, and mode of the distribution are coincide i.e., Mean = Median = Mode = m iii. It has only one mode at x = m (i.e., unimodal) iv. Since the curve is symmetrical, Skewness = 𝛽1 = 0 and Kurtosis = 𝛽2= 3 v. The points of inflection are at x = m ± s Bipul Kumar Sarker, Lecturer (BBA Professional), HBUC
  • 7. vi. The maximum ordinate occurs at x = m and its value is 1 𝜎 2𝜋 vii. The x axis is an asymptote to the curve i.e. the curve continues to approach but never touches the x axis viii. The first and third quartiles are equidistant from median. ix. The mean deviation about mean is 0.8 s 3.3.4 Properties of Normal Distribution: Bipul Kumar Sarker, Lecturer (BBA Professional), HBUC
  • 8. X. Quartile deviation = 0.6745 s XI. If X and Y are independent normal variates with mean 𝜇1 and 𝜇2, and variance 𝜎1 And 𝜎2 respectively then their sum (X + Y) is also a normal variate with mean (𝜇1 + 𝜇2) and variance 𝜎1 2 + 𝜎2 2 XII. Area Property P(m - s < Z < m + s) = 0.6826 P(m - 2s < Z < m + 2s) = 0.9544 P(m - 3s < Z < m + 3s) = 0.9973 3.3.4 Properties of Normal Distribution: Bipul Kumar Sarker, Lecturer (BBA Professional), HBUC
  • 9. 3.3.5 Standard Normal distribution: Let X be random variable which follows normal distribution with mean m and variance 𝜎2 .The standard normal variate is defined as 𝑍 = 𝑋−𝜇 𝜎 which follows standard normal distribution with mean 0 and standard deviation 1 i.e., Z ~ N(0,1). The standard normal distribution is given by 𝚽 𝒁 = 𝟏 𝟐𝝅 𝒆− 𝟏 𝟐 𝒛 𝟐 ; −∞ < 𝒁 < ∞ The advantage of the above function is that it doesn’t’ contain any parameter. This enable us to compute the area under the normal probability curve. Bipul Kumar Sarker, Lecturer (BBA Professional), HBUC
  • 10. 3.3.6 Area properties of Normal curve: The total area under the normal probability curve is 1. The curve is also called standard probability curve. The area under the curve between the ordinates at x = a and x = b where a < b, represents the probabilities that x lies between x = a and x = b i.e., P(a  x  b) Bipul Kumar Sarker, Lecturer (BBA Professional), HBUC
  • 11. To find any probability value of x, we first standardize it by using 𝑍 = 𝑋−𝜇 𝜎 , and use the area probability normal table. Bipul Kumar Sarker, Lecturer (BBA Professional), HBUC
  • 12. Example: The probability that the normal random variable x to lie in the interval (m-s , m+s) is given by, 1. Bipul Kumar Sarker, Lecturer (BBA Professional), HBUC
  • 13. 2. Bipul Kumar Sarker, Lecturer (BBA Professional), HBUC
  • 14. 3. Bipul Kumar Sarker, Lecturer (BBA Professional), HBUC
  • 15. The probability that a normal variate x lies outside the range m ± 3s is given by Thus we expect that the values in a normal probability curve will lie between the range m ± 3s, though theoretically it range from -  to . Bipul Kumar Sarker, Lecturer (BBA Professional), HBUC
  • 16. Example -01 Find the probability that the standard normal variate lies between 0 and 1.56 Solution: −∞ 𝑍 = 0 𝑍 = 1.56 +∞ P(0< z< 1.56) = Area between z = 0 and z = 1.56 = 0.4406 (from table) Bipul Kumar Sarker, Lecturer (BBA Professional), HBUC
  • 17. Example-02 Find the area of the standard normal variate from –1.96 to 0. Solution: −∞ 𝑍 = −1.96 𝑍 = 0 +∞ Area between z = 0 & z =-1.96 is same as the area z = 0 to z = 1.96 P(-1.96 < z < 0) = P(0 < z < 1.96) (by symmetry) = 0.4750 (from the table) Bipul Kumar Sarker, Lecturer (BBA Professional), HBUC
  • 18. P(z >0.25) = P(0<z < ) – P(0<z<0.25) = 0.5000 - 0.0987 (from the table) = 0.4013 Example-03 Find the area to the right of z = 0.25 Solution: Bipul Kumar Sarker, Lecturer (BBA Professional), HBUC
  • 19. Example-04 Find the area to the left of z = 1.5 Solution: P(z < 1.5) = P( -  < z < 0 ) + P( 0 < z < 1.5 ) = 0.5 + 0.4332 (from the table) = 0.9332 Bipul Kumar Sarker, Lecturer (BBA Professional), HBUC
  • 20. Example-05 Find the area of the standard normal variate between –1.96 and 1.5 Solution: P(-1.96 < z < 1.5) = P(-1.96 < z < 0) + P(0 < z < 1.5) = P(0 < z < 1.96) + P(0 < z < 1.5) = 0.4750 + 0.4332 (from the table) = 0.9082 Bipul Kumar Sarker, Lecturer (BBA Professional), HBUC
  • 21. Example-06 Given a normal distribution with m = 50 and s = 8, find the probability that x assumes a value between 42 and 64. Solution: Given that m = 50 and s = 8 The standard normal variate, 𝑍 = 𝑋−𝜇 𝜎 If X = 42, 𝑍 = 42−50 8 = −1 If X = 64, 𝑍 = 64−50 8 = 1.74 Bipul Kumar Sarker, Lecturer (BBA Professional), HBUC
  • 22. P(42 < x < 64) = P(-1 < z <1.75) = P(-1< z < 0) + P(0 < z <1.95) = P(0<z<1) + P (0 < z <1.75) (by symmetry) = 0.3413 +0 .4599 (from the table) = 0 .8012 If X = 42, 𝑍 = 42−50 8 = −1 If X = 64, 𝑍 = 64−50 8 = 1.74 Bipul Kumar Sarker, Lecturer (BBA Professional), HBUC
  • 23. Example-07 Students of a class were given an aptitude test. Their marks were found to be normally distributed with mean 60 and standard deviation 5. What percentage of students scored. i) More than 60 marks ii) Less than 56 marks iii)Between 45 and 65 marks Bipul Kumar Sarker, Lecturer (BBA Professional), HBUC
  • 24. i. The standard normal variate,𝑍 = 𝑋−𝜇 𝜎 If X = 60, 𝑍 = 60−60 5 = 0 P(x > 60) = P(z > 0) = P(0 < z <  ) = 0.5 Hence the percentage of students scored more than 60 marks is 0.5×100 = 50 % Solution: Given that mean = m = 60 and standard deviation = s = 5 Bipul Kumar Sarker, Lecturer (BBA Professional), HBUC
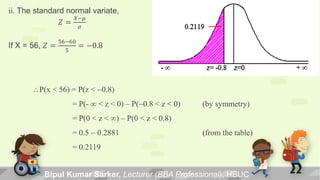
  • 25. ii. The standard normal variate, 𝑍 = 𝑋−𝜇 𝜎 If X = 56, 𝑍 = 56−60 5 = −0.8 P(x < 56) = P(z < -0.8) = P(-  < z < 0) – P(-0.8 < z < 0) (by symmetry) = P(0 < z < ) – P(0 < z < 0.8) = 0.5 - 0.2881 (from the table) = 0.2119 Bipul Kumar Sarker, Lecturer (BBA Professional), HBUC
  • 26. Hence the percentage of students score less than 56 marks is 0.2119×100 = 21.19 % Bipul Kumar Sarker, Lecturer (BBA Professional), HBUC
  • 27. −∞ 𝑍 = −3 𝑍 = 0 𝑍 = 1 +∞ iii. The standard normal variate, 𝑍 = 𝑋−𝜇 𝜎 If X = 45, 𝑍 = 45−60 5 = −3 If X = 65, 𝑍 = 65−60 5 = 1 P(45 < x < 65) = P(-3 < z < 1) = P(-3 < z < 0 ) + P ( 0 < z < 1) = P(0 < z < 3) + P(0 < z < 1) ( by symmetry) = 0.4986 + 0.3413 (from the table) = 0.8399 Bipul Kumar Sarker, Lecturer (BBA Professional), HBUC
  • 28. Hence the percentage of students scored between 45 and 65 marks is 0.8399×100 = 83.99 % Bipul Kumar Sarker, Lecturer (BBA Professional), HBUC
  • 29. Example-08 X is normal distribution with mean 2 and standard deviation 3. Find the value of the variable x such that the probability of the interval from mean to that value is 0.4115 Solution: Given m = 2, s = 3 Suppose z1 is required standard value, Thus 𝑃 (0 < 𝑧 < 𝑧1) = 0.4115 From the table the value corresponding to the area 0.4115 is 1.35 that is 𝑧1 = 1.35 Bipul Kumar Sarker, Lecturer (BBA Professional), HBUC
  • 30. Bipul Kumar Sarker, Lecturer (BBA Professional), HBUC Here, 𝑧1 = 𝑋−𝜇 𝜎 ⇒ 1.35 = 𝑋 − 2 3 ⇒ 1.35 × 3 + 2 = 𝑋 𝑋 = 6.05
  • 31. Bipul Kumar Sarker, Lecturer (BBA Professional), HBUC
  • 32. Bipul Kumar Sarker, Lecturer (BBA Professional), HBUC