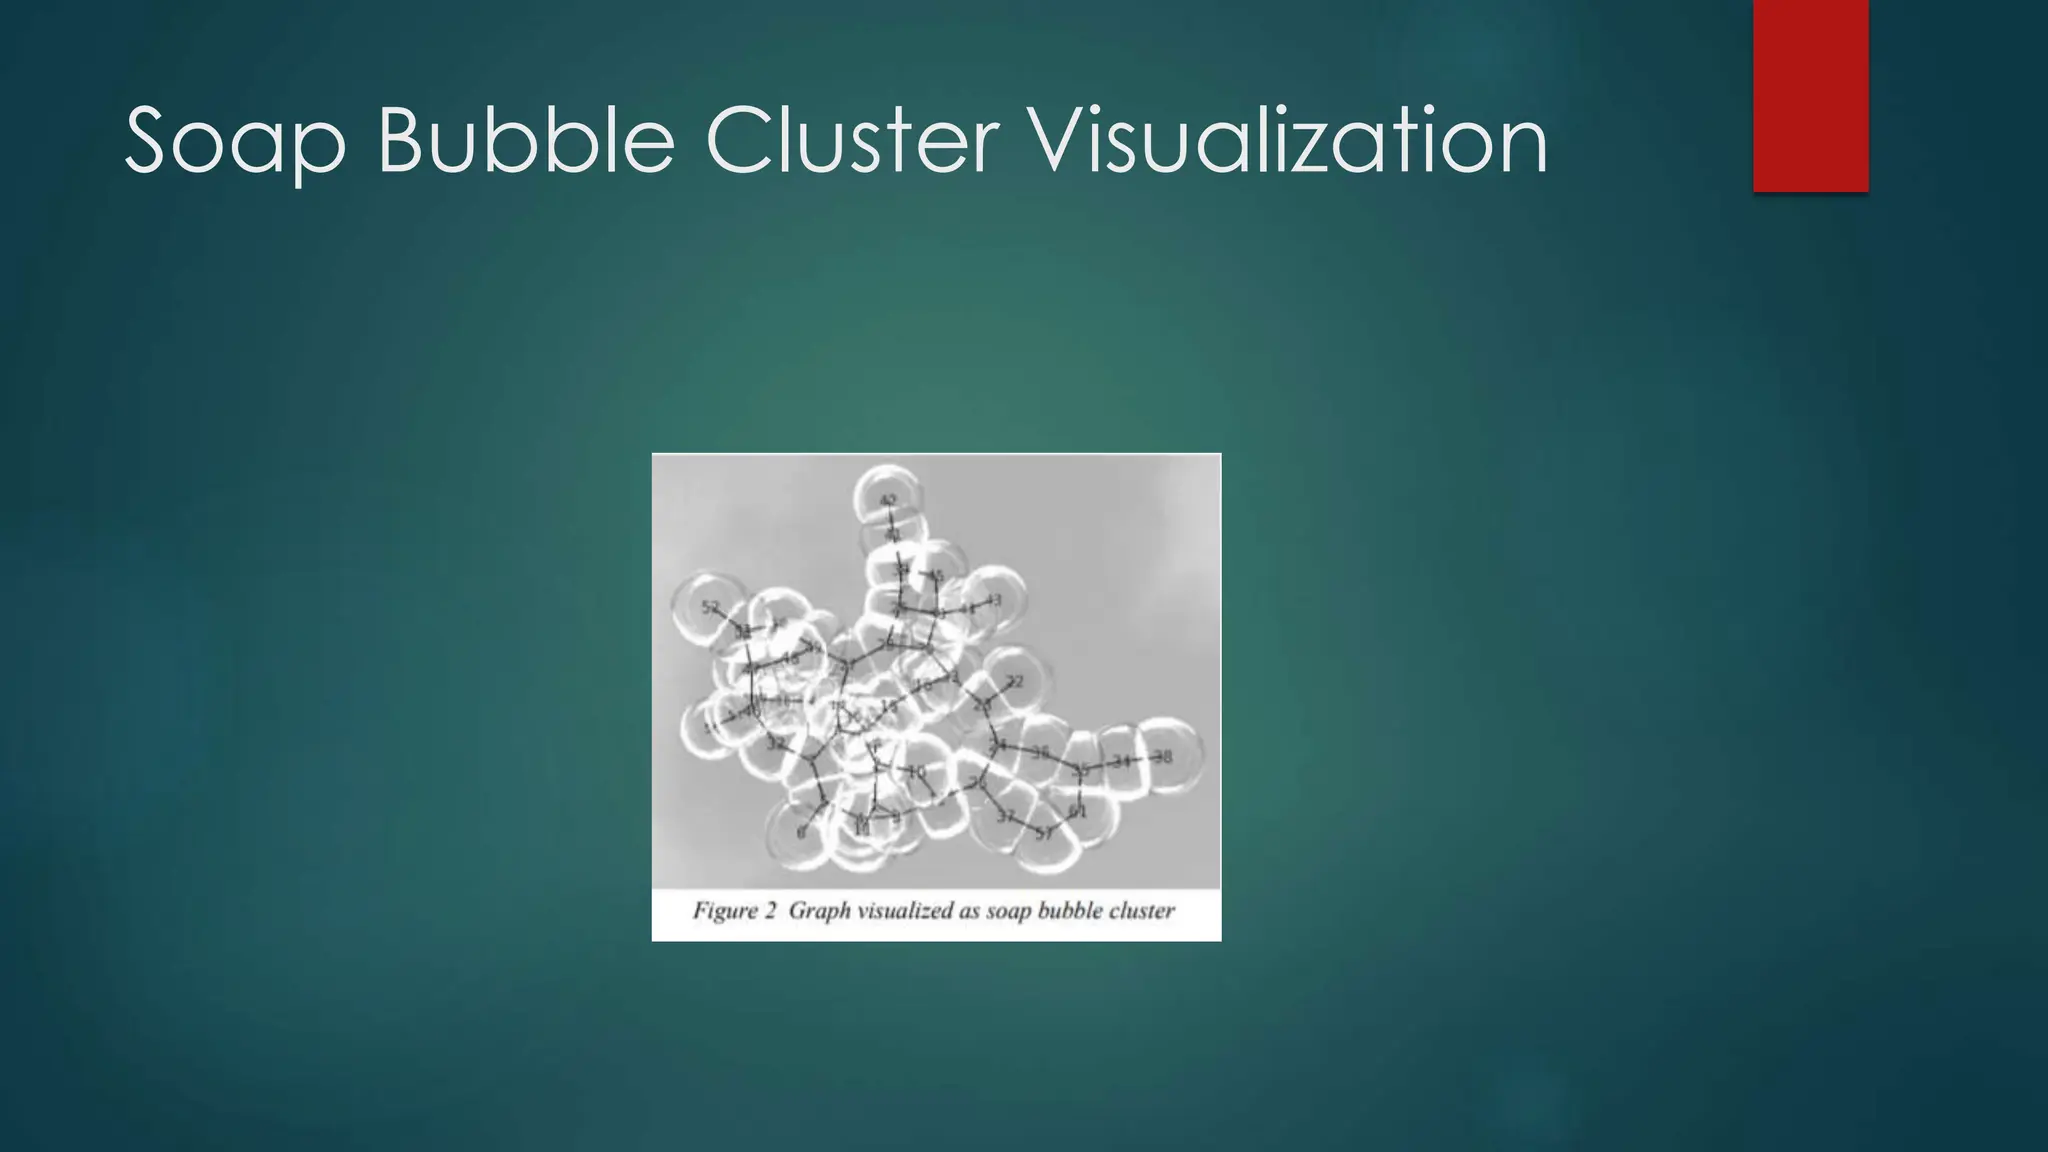
This document discusses data visualization and analytical techniques. It begins by defining data visualization as the graphical representation of data through charts, diagrams and images to communicate insights from data. The main goal is to distill large datasets into visuals to allow for easy understanding of complex relationships. It then covers various visualization techniques and tools for analyzing big data, highlighting traits of meaningful data visualization like being visually appealing, scalable, accessible and enabling rapid development. It also discusses analytical techniques like SWOT and MOST analysis. In closing, it notes that visual perception allows for understanding the environment via sight and is important for cognitive processes like learning.


