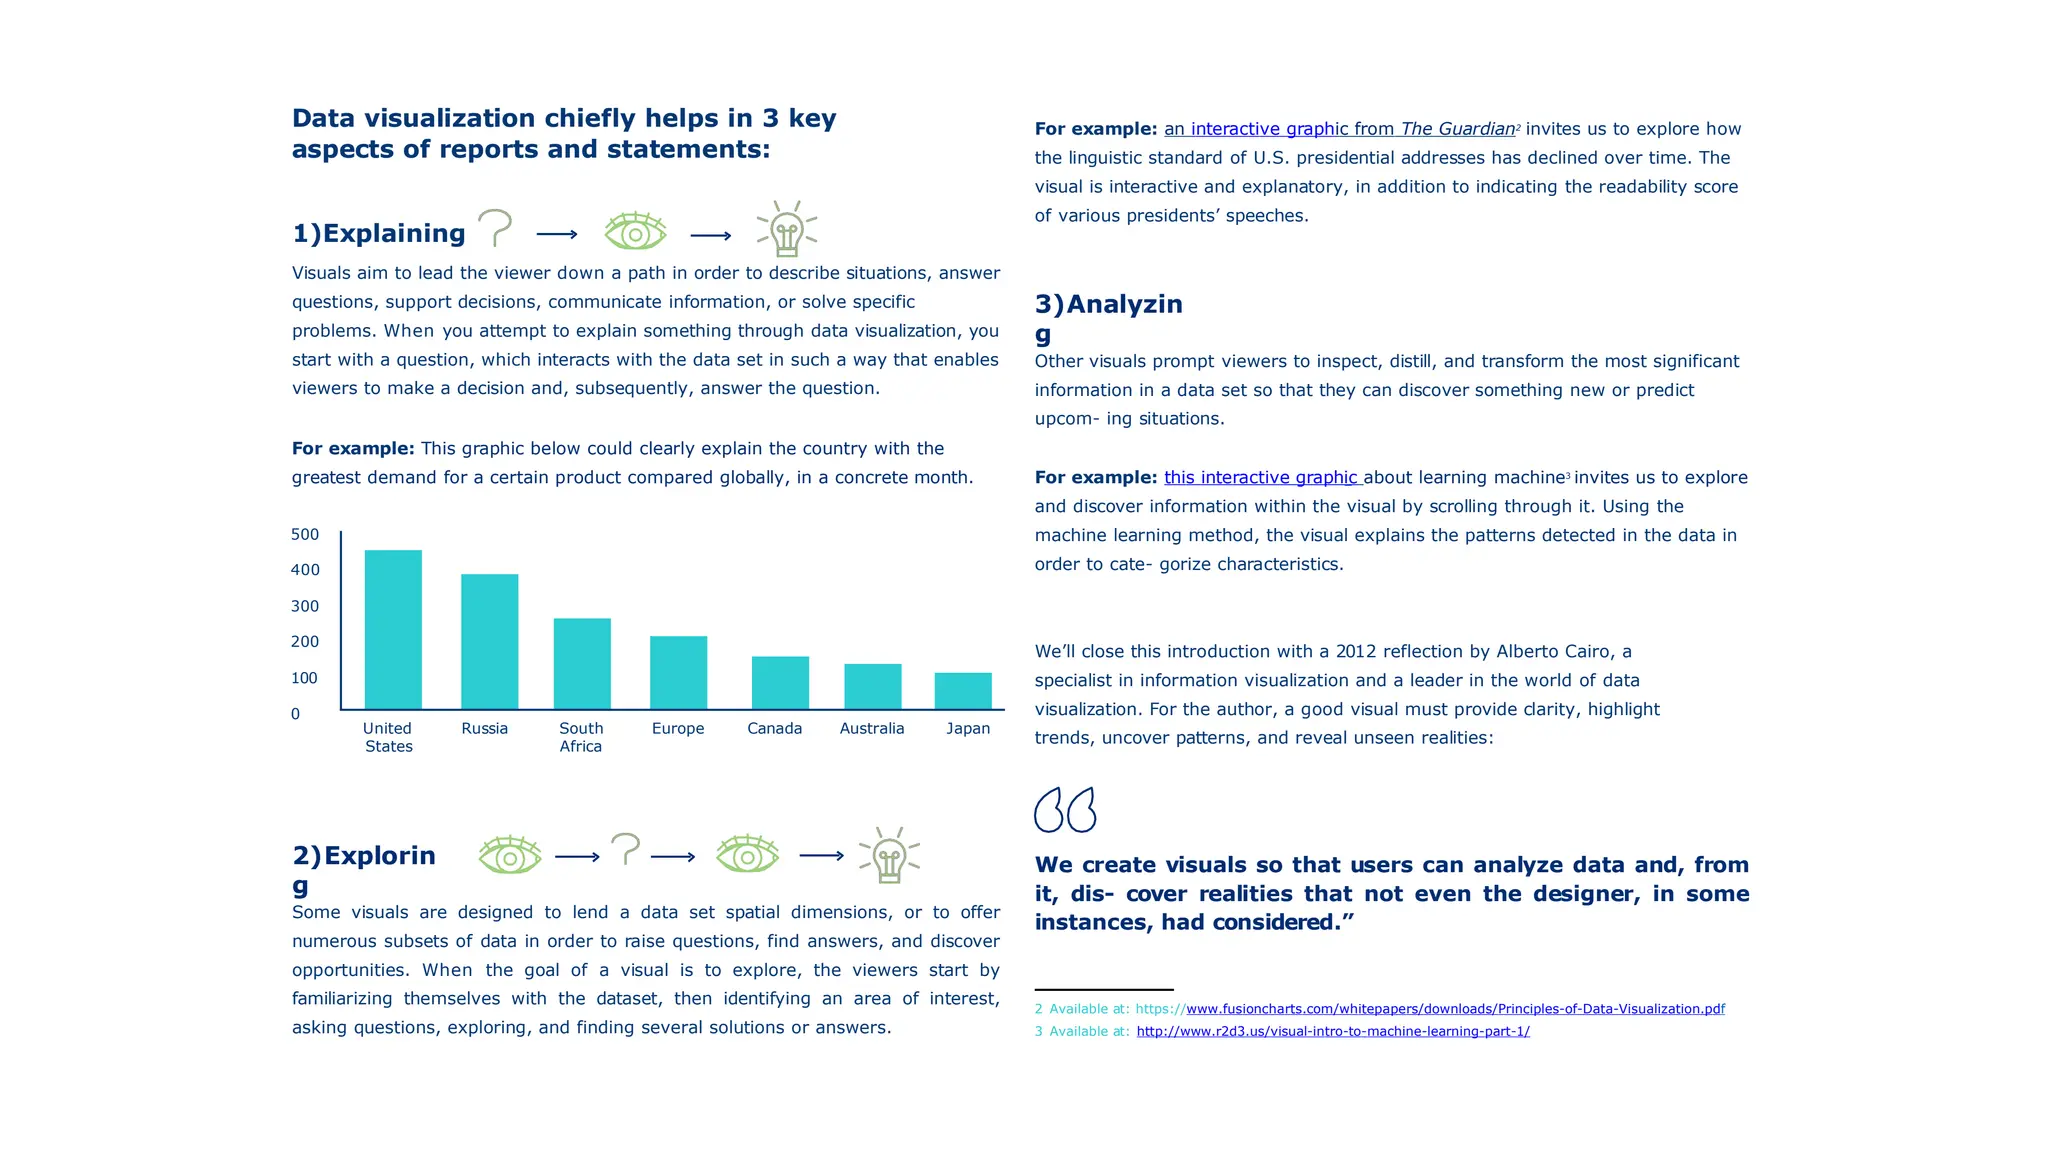
Data visualization is the process of interpreting and presenting data to communicate complex ideas effectively and identify patterns. It involves stages such as data collection, preprocessing, visual representation, and perception, enhancing understanding and decision-making in various fields. The document outlines the advantages of visualization, different data types, relationships, and visualization formats, emphasizing its significance in reports and its ability to convey information more effectively than text.


