Database Fundamental Concepts- Series 1 - Performance Analysis
- 1. www.dageop.com Database Fundamental Concepts ® FC-01: Performance Analysis DR. SUBRAMANI PARAMASIVAM (MANI)
- 2. About me Dr. SubraMANI Paramasivam PhD., MCT, MCSE, MCITP, MCP, MCTS, MCSA CEO, Principal Consultant & Trainer @ DAGEOP (UK) Email: [email protected] Blog: http://dataap.org/blog Follow Us https://www.facebook.com/pages/YOUR-SQL-MAN-LTD/ http://www.youtube.com/user/YourSQLMAN https://twitter.com/dageop https://uk.linkedin.com/in/dageop Proud Sponsor • SQLBits • SQL Saturdays • MCT Summit • SQL Server Geeks Summit • Data Awareness Programme • Dageop’s Data Day ® www.DataAP.org SPEAKER
- 3. Contents FC-01: Performance Analysis • Monitoring Tools • Exploring STATISTICS IO output • Identifying Performance Problems with Profiler data www.dageop.com Fundamental Concepts
- 4. FC-01: Performance Analysis Have you done any? www.dageop.com Fundamental Concepts
- 5. Performance Analysis • How SQL Server & Database performs during all sorts of transactions and heavy loads? • It is one of the important role of a Database Administrator www.dageop.com Fundamental Concepts
- 7. Monitoring Tools List any tool www.dageop.com Fundamental Concepts
- 8. Monitoring Tools SQL Server has bunch of tools • SQL Trace • SQL Server Profiler • Distributed Replay Utility • SQL Server Management Studio Activity Monitor • SQL Server Management Studio Graphical Show plan • Stored procedures • Database Console Commands (DBCC) • Built-in functions • Trace flags • Other tools www.dageop.com Fundamental Concepts
- 9. SQL Trace Have you used? www.dageop.com Fundamental Concepts
- 10. SQL Trace • Information collected from instance through events. • Store the information in File or SQL Server Management objects (SMO). • We can monitor the information about • Locks (Deadlock) • Data File Auto Grow • Objects Altered • Scan started • SQL Batch Started/Completed www.dageop.com Fundamental Concepts
- 11. SQL Trace & Stored Procedure • Stored procedures to create traces • sp_trace_create • sp_trace_generateevent • sp_trace_setevent • sp_trace_setfilter • sp_trace_setstatus • Versions applicable • Prior to 2005: Extended stored procedures that began with xp_trace_... (add, set) • 2005, 2008, 2008R2, 2012: Above sp_trace_... • 2014 onwards: Use extended events • SQL Server Profiler – to see stored trace files. • SQL Server Profiler (GUI) uses the above set of system SP’s. www.dageop.com Fundamental Concepts
- 13. SQL Server Profiler Have you used? www.dageop.com Fundamental Concepts
- 14. SQL Server Profiler • It is used to monitor the SQL server instance of the database engine. • Trace data can be stored in a file or a table. • SQL Server Profiler helps to monitor any specific events. • Also supports auditing the actions performed on SQL Server instances. www.dageop.com Fundamental Concepts
- 15. SQL Server Profiler • Find the cause of the problem in Queries • Finding and diagnosing slow-running queries. • Capturing the series of T-SQL statements that lead to problems. • Replicate the saved trace file in a test server to further diagnose. • Monitoring the performance of SQL Server to tune workloads. • Correlating performance counters to diagnose problems. www.dageop.com Fundamental Concepts
- 17. Distributed Replay Utility Have you used? www.dageop.com Fundamental Concepts
- 18. Distributed Replay Utility • Assess the impact of • future SQL server upgrades. • hardware and OS upgrades and SQL server tuning. • Using Distributed replay, we can replay a workload. • Used mainly for • Application compatibility testing • Performance testing • Capacity planning • SQL Server Profiler (SSP) & Distributed Replay Utility (DRU) overlaps. • SSP allows single computer only • Resource bottleneck • SSP is less scalable solution compared to DRU www.dageop.com Fundamental Concepts
- 20. SSMS Activity Monitor Have you used? www.dageop.com Fundamental Concepts
- 21. SQL Server Management Studio Activity Monitor • Information about SQL server processes • how the processes affects the instance • Tabbed windows with expandable and collapsible panes: • Overview • Processes • Resource Waits • Data File I/O • Recent Expensive Queries www.dageop.com Fundamental Concepts
- 22. Activity Monitor • Customizable • Rearrange the order of the columns • Sort any column • Filter one or more columns, • Refresh interval by default 10 seconds. • Performance affected if <10 secs • VIEW SERVER STATE permission required. • System objects are used. www.dageop.com Fundamental Concepts
- 24. Graphical Show plan Have you used? www.dageop.com Fundamental Concepts
- 25. SSMS Graphical Show plan • SQL Server Management Studio • Interactive • GUI Tool • DBA or Developers interact with DB, SQL Server. • Execute multiple queries simultaneously, view results, analyse the query plan. • Assists to improve the query performance. • Execution Plans • Display Estimated Execution Plan (CTRL + L) • Include Actual Execution Plan (CTRL + M) www.dageop.com Fundamental Concepts
- 26. Graphical Show plan We can Get execution plan for all type of queries www.dageop.com Fundamental Concepts
- 28. System Stored Procedures Have you used? www.dageop.com Fundamental Concepts
- 29. System Stored Procedure • SP_WHO • SP_WHO2 • Custom SP_WHO2 • SP_LOCK • SP_MONITOR • SP_SPACEUSED www.dageop.com Fundamental Concepts
- 30. DBCC Commands Have you used? www.dageop.com Fundamental Concepts
- 31. DBCC • DBCC means Database Console Command • Grouped into following categories • Maintenance • Miscellaneous • Informational • Validation • During the Maintenance Plan almost every DBA will use this DBCC www.dageop.com Fundamental Concepts
- 32. DBCC OR www.dageop.com Fundamental Concepts Internal Database Snapshot Exclusive DB Lock for Allocation checks & Catalogs & Shared Table locks for table checks • DBCC CHECKDB • DBCC CHECKALLOC • DBCC CHECKTABLE • DBCC CHECKCATALOG • DBCC CHECKFILEGROUP
- 33. DBCC WITH DATABASE SNAPSHOT - Exclusions www.dageop.com Fundamental Concepts Snapshot not created for below conditions • Master database • Single-user mode • Read-only database • Emergency mode • Tempdb
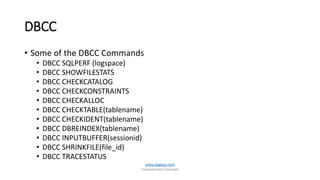
- 34. DBCC • Some of the DBCC Commands • DBCC SQLPERF (logspace) • DBCC SHOWFILESTATS • DBCC CHECKCATALOG • DBCC CHECKCONSTRAINTS • DBCC CHECKALLOC • DBCC CHECKTABLE(tablename) • DBCC CHECKIDENT(tablename) • DBCC DBREINDEX(tablename) • DBCC INPUTBUFFER(sessionid) • DBCC SHRINKFILE(file_id) • DBCC TRACESTATUS www.dageop.com Fundamental Concepts
- 36. Built-in Functions Have you used? www.dageop.com Fundamental Concepts
- 37. Built-In Functions • Built-In functions are installed by default. • Helps getting system information. • Some of the Built-In Functions • @@io_busy – It will show I/O processing time in milliseconds • @@cpu_busy -- It will show CPU processing time in milliseconds • @@connections -- It will return no of connections/attempted connections • @@idle – It will return SQL Server idle time in milliseconds www.dageop.com Fundamental Concepts
- 39. Trace Flags Have you used? www.dageop.com Fundamental Concepts
- 40. Trace Flags • Frequently used to diagnose performance issues • Debug stored procedures or complex computer systems. • Trace flags are valuable tools as they allow DBA to enable or disable a database function temporarily. • Once a trace flag is turned ON, manual turn OFF or restart SQL Server. • -TXXXX can be used as startup parameter to enable trace when SS starts. • sysadmin fixed server role permission required. For full list of Trace flags. http://technet.Microsoft.com/en-us/library/ms188396.aspx www.dageop.com Fundamental Concepts
- 41. OTHER TOOLS Any guess? www.dageop.com Fundamental Concepts
- 42. Other Monitoring Tools • Error Logs • Windows • Applications • SQL Server • Security • Setup • System • DTA (Database Engine Tuning Advisor) www.dageop.com Fundamental Concepts
- 44. Exploring STATISTICS IO Output www.dageop.com Fundamental Concepts
- 45. Exploring STATISTICS IO Output • STATISTICS IO - detailed information about the impact of the Query. • Scan Counts • Logical Reads • Physical Reads • Read-ahead reads • LOB logical reads • LOB Physical reads • LOB Read-ahead reads www.dageop.com Fundamental Concepts
- 46. Exploring STATISTICS IO output • Statistics IO can be set as an option while you execute the query. • Message displayed in results pane. • Cost of the query in terms of • physical reads from the disk and • logical reads from the cache • KEY WORD • SET STATISTICS IO ON www.dageop.com Fundamental Concepts
- 47. STATISTICS IO explained www.dageop.com Fundamental Concepts Scan Count (1) • Optimizer has chosen an execution plan. • This number will be same until you change the query. Logical Reads (1500) • Actual number of page reads from cache. • Will not change unless there is a change in query structure or index used in the table
- 48. STATISTICS IO explained www.dageop.com Fundamental Concepts • Physical Reads ( 2576) • Number of pages actually read from the disk directly. • Reads from disk first time and use the page in cache for next time. • Read-ahead reads (0) • Total physical reads were satisfied by SQL Servers ‘Read-ahead’ mechanism. • Fluctuates, as pages are swapped in/out of memory. • Index fragmentation will affect this number.
- 49. STATISTICS IO explained www.dageop.com Fundamental Concepts • LOB Logical Reads (0) • Count based on text, ntext, image, varchar(max), nvarchar(max) and varbinary(max) data type. • Attention required like the Logical Reads. • LOB Physical Reads (0) • Physical reads of same data type. • LOB Read-Ahead Reads (0) • Number of physical reads satisfied by the Read-Ahead mechanism
- 51. Identifying Performance Problems with Profiler data www.dageop.com Fundamental Concepts
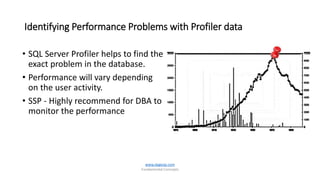
- 52. Identifying Performance Problems with Profiler data • SQL Server Profiler helps to find the exact problem in the database. • Performance will vary depending on the user activity. • SSP - Highly recommend for DBA to monitor the performance www.dageop.com Fundamental Concepts
- 53. Identifying Performance Problems with Profiler data • Major functions of SSP • Creating trace • Watching trace • Storing trace • Replaying trace www.dageop.com Fundamental Concepts
- 55. Review Monitoring Tools SQL Trace SQL Server Profiler Distributed Replay Utility SQL Server Management Studio Activity Monitor SQL Server Management Studio Graphical Show plan Stored procedures Database Console Commands (DBCC) Built-in functions Trace flags STATISTICS IO Performance Problems with Profiler data Creating trace Watching trace Storing trace Replaying trace www.dageop.com Fundamental Concepts
- 56. Q & A www.dageop.com Fundamental Concepts
- 57. ® www.dageop.com


