SlideShare a Scribd company logo
Dealing with Incomplete Data for
Mapping and Spatial Analysis
Aileen Buckley
Esri – Redlands
@mappingcenter
abuckley@esri.com
April 7 | Boston, MA
AAG 2017
Workshop overview
• A little about missing data
• Methods for dealing with missing data
• A focus on imputation methods
• Analyzing the results of imputation methods
Data “values” or lack thereof
VALUE MEANING
" " Blank
"NULL" Null
"NA", "N/A" Not Available or Not Applicable
"?", "UKN", "UNKNOWN" Unknown
"OTHER A selection from a multiple-choice survey or pull-down menu
"Not Answered" or "Not Provided" The question was asked, but the response was not provided
"0" Known zero
"Non-match" Not matched to other internal or external data sources
"Error" or "Undefined" Generated, for example, when dividing by zero
"-9999" or other numeric value out of range Not part of the recorded data or data outside the study area
"No data", "NoData", "NODATA" Data is absent
"---" or some other indicator Who knows? How can you be sure that you interpret this correctly?
Largest (or smallest) double integer
The largest (or smallest) integer that can be stored in a double field;
DBL_MAX or approximately 1.8 × 10308 (if the double is an IEEE 754 64-bit
double)
Raster data
• Raster
- NoData = Outside of mapped
- 0 = Zero value
- -9999 = Masked out (don’t include in the
analysis)
- -9999 = Lack of information (e.g., cloud
cover or sensor malfunction)
Vector data
• Existing data
enumeration units
are used
• Values for features
within the units are
recorded – or not!
Reasons for missing data
Collection problems
• Data may be missing because it cannot be collected
- For example, access to a location is denied or locations cannot be safely
accessed
• Data collection may be thwarted by regulations or restrictions
- For example, the maximum altitude for drones in the United States is currently
400 meters and drones can only be used in areas that are not designated as no-
fly zones
• Other times data cannot be collected because the features of interest
cannot be located
• Sometimes the data are collected and then become compromised
when files are mishandled
- For example, values may be missing if a file was not copied completely
• Data manipulation, conversion, and merging can also result in
missing data
- For example, data stored in spreadsheet format may become corrupted when
converted to another format—values may be converted to NULL; leading or
trailing zeros may be stripped off; numeric values may be converted to strings
which cannot be used in calculations; or certain values may not be converted at
all
Handling problems
• Some data types (for example, shapefiles) do not support null values,
so some other value will be substituted instead (for example, a null
integer is stored as a zero, and a null text string is stored as a space)
Handling problems
See blogs.arcgis.com  Formatting an Excel table for use with ArcGIS
• A dataset may be complete but it does not contain data of the
desired type
- For example, with remote sensing data, clouds or topography may obscure the
data of interest
• Collected data may be questionable if the method of collection is
suspect
- This happens, for example, when sensors malfunction or are incorrectly
calibrated or when a person doesn’t adequately understand or correctly
interpret a survey question
Data problems
• When the numbers of people or families used to compute the
demographic statistics are small, the data may be suppressed:
- to discourage misinterpretation and misuse of the statistics that are unstable
because of small numbers—those percentages and medians tend to have poor
reliability
- to protect the confidentiality of the people whose data are included in a report
by reducing or eliminating the risk of identity disclosure
Data suppression
Source: State Cancer Profiles, https://statecancerprofiles.cancer.gov/suppressed.html
The implications of dealing with missing data
• Analyses of data sets with missing data are more complex than
analyses of complete data sets
• There is a lack of consistency among analyses if analysts compensate
for missing data in different ways or their analyses are based on
different subsets of data
• In some cases, incomplete data cannot be used to compute official
statistics (e.g., census)
• Statistical analyses can produce biased and misleading results
• “Given the expense of collecting data, we cannot afford to start over
or to wait until we have developed foolproof methods of gathering
information (an unachievable goal).
• We find ourselves left with the decision of how to deal with the fact
that we do not have complete information for the entire data set.”
The conundrum
Source: Pigott,T.D. (2001) http://galton.uchicago.edu/~eichler/stat24600/Admin/MissingDataReview.pdf
Dealing with missing data
Statistical methods
Complete datasets
• One approach, and the simplest, is to use only those datasets with
complete information, though this sometimes means that the
question at hand cannot be adequately or fully answered, and if
alternative datasets do not exist, then the answer may not be
answered at all
Complete cases
• Another approach is to use only those cases with complete
information
- Listwise deletion – drop the observation if the value for any variable is
missing; sometimes called “complete case analysis”
- Pairwise deletion – drop the observation if the value for the variable of
interest is missing; sometimes called “available case analysis”
• “Researchers either consciously or by default in a statistical analysis
drop informants who do not have complete data on the variables of
interest.
• In statistical language, if the number of the cases is less than 5% of
the sample, then the researcher can drop them.”
Complete cases
http://www.statisticssolutions.com/missing-values-in-data/
• This can exclude a large fraction of the original sample thereby
reducing the power of the statistical analysis because the number
number of observations (n) is reduced
• It is difficult to compare the results of analyses from pairwise
deletion because the sample will be different for each analysis
Listwise or pairwise deletion
Source: Soley-Bori, M. (2013), http://www.bu.edu/sph/files/2014/05/Marina-tech-report.pdf
Imputation
• An alternative is to fill in a plausible value for the missing
observations, such as using the mean of the observed cases on that
variable; this is called imputation
• This is a way to avoid pitfalls involved with listwise or pariwise
deletion because imputation preserves all cases by replacing missing
data with an estimated value based on other available information
Geoimputation
• Geoimputation or geographical imputation methods are used
to replace missing values in spatial data by assigning a
value for the missing data using both the characteristics of the
and the characteristics from:
- a larger geographic aggregate area (this can be either global or
geoimputation), or
- nearby areas in which the unit is located (this is local geoimputation)
• “More recently, statisticians have advocated methods that are based
on distributional models for the data.”
• These advanced methods include:
- Multiple imputation
- Maximum likelihood
- Baysian simulation
- Hot deck imputation
Other approaches
Source: Pigott,T.D. (2000), http://galton.uchicago.edu/~eichler/stat24600/Admin/MissingDataReview.pdf
• “They lead to an underestimation of standard errors and, thus,
overestimation of test statistics.
• The main reason is that the imputed values are completely
determined by a model applied to the observed data, in other words,
they contain no error.”
Limitations of imputation techniques in general
Source: Allison, P. D. (2000). Multiple Imputation for Missing Data: A CautionaryTale. Sociological Methods & Research, 28(3), 301-309.
A special note about
census data
• There are three common reasons:
- Household or unit nonresponse
- Person nonresponse
- Item nonresponse
Missing values in census data
Source: https://www.census.gov/spd/types.html
• Missing data for a household or unit occurs when an enumerator is
able to find an address but is unable to obtain any census data
- This may happen because no one is at home or no one is willing or able to
participate in the survey
- It can also occurs when the people at the address have moved to an unknown
or unavailable address
• In these cases, a nonresponse is dealt with through weighting
adjustments
Household or unit nonresponse
Source: https://www.census.gov/spd/types.html
• Missing data for a person occurs when data is collected from one but
not all people in a household or unit
- This can happen because someone is not willing, able, or available to
participate in the survey
• Missing values are imputed or edited (logically inferred from other
data that have been provided)
Person nonresponse
Source: https://www.census.gov/spd/types.html
• Missing data for an item or question in the survey occurs when a
person completes part of the survey but does not answer one or more
individual questions
- This can occur if a person is unwilling or unable to provide the requested
information; a person forgets to answer a question; a response is logically
inconsistent; an enumerator fails to ask a question or record an answer; or an
enumerator erroneously records the response
• Missing values are generally imputed in these cases
Item nonresponse
Source: https://www.census.gov/spd/types.html
General principles for
dealing with missing data
Imputation
Map the data
• Determine if the missing data is:
1. Clustered
2. At the core
3. At the perimeters
• All of these are red flags  check the data collection and handling
methods
Dealing with incomplete data for mapping and spatial analysis
Explore the data
• What value(s) are used to represent missing data?
• How many records contain missing values?
• What is the range of values? Are there “hard max or min values?
• What variability is in the values?
• Are there outlier?
• It is risky to work with missing data:
- when there is too much of it  5% of the data or more
- when it is on the tails of the distribution
43/3108 = 1.38%FREQUENCY 3108.00
SUM 546226.90
MEAN 178.56
MIN 59.70
MAX 362.80
RANGE 303.10
STD 506.87
Consider how the data will be used
• If it is for visualization only (e.g., a map), the results of dealing with
missing data (e.g., imputation) may not be visible because of the
mapping process itself (e.g., classification)
• How will the results be used?What are the implications for using
results with data that was “invented”?
Geoimputation methods
Geoimputation methods demonstrated in this workshop
- Global method
- Impute from the a global statistic of the dataset
- Regional method
- Impute from the state rate
- Local methods
- Impute from polygon neighbors
- Impute from an areal interpolation surface
- Impute usingThiessen polygons
- Impute using the Fill MissingValues tool
Impute from a global value
• Substitute the global statistical value for the missing values
• For example, global mean
Impute from a regional value
• Substitute the regional statistical value for the missing values
- For example, state rate
Impute from an areal interpolation surface
• Use areal interpolation to create a surface from the known values
• Substitute the values at the location of the polygon centroid for the
missing values
Impute from polygon neighbors
• Use the values of the neighboring polygons to calculate a mean
• Substitute the neighborhood mean for the missing values
Demos
Impute using the Fill Missing Values tool
• Use the imputation tool available in the next release of ArcGIS Pro
• A variety of options for how to impute the missing values
Fill Missing Values tool
• Easy to use
• Handles both space and time
• Many options for the parameters
- Impute multiple values
- Different neighborhoods
Demo
Best practices for imputing data
Choose the best type to represent the data
• Points
• Lines
- FeatureVerticesTo Points with the MID option -- a point will be created at the
midpoint, not necessarily a vertex, of each input line or polygon boundary
• Polygons
- FeatureTo Point with CENTROID option = the output point
will be located at the center of gravity (centroid) of the polygon
- FeatureTo Point with INSIDE option = the output point will be
inside the polygon
Choose the best fill method
• Average
• Minimum
• Maximum
• Median
• TemporalTrend
Choose the best fill method
• Pick the option that makes the most sense for the data
- Average – useful for many cases
- Minimum – when you don’t want to overexaggerate (% people with a graduate
degree)
- Maximum – when you don’t want to underestimate (e.g., % of children in
school lunch programs)
- Median – when there are extremes or outliers (e.g., housing value)
Choose the best conceptualization of spatial relationships
• Pick the option that
makes the most sense
for the data
- Insect infestation 
Contiguity
- Real estate market 
Distance Band
For inverse distance weighted (with the Fill Missing Values
tool)
• Generate Spatial Weights Matrix
- Use this to generate a matrix that includes the distance to neighboring points
or polygon centroids
• Generate Network Spatial Weights
Evaluating the results
Evaluate the results of imputation
• Check the number and percentage of values imputed
- Are any still missing? If so, where are they?
• Don’t impute from imputed values (otherwise you are “inventing”
data from “invented” data)
- You might be tempted to do this when all missing values are not imputed (e.g.,
a feature with a missing value is surrounded by others with missing values)
- Alternatives:
- Change the parameters (e.g., the number of neighbors or size of neighborhood)
- Use a different method (e.g., global or regional geoimputation; areal interpolation)
Compare distributions
• Examine the distribution of the data set before and after imputation
(i.e., the histogram and descriptive statistics)
- This tells you how much imputation changed the global distribution
• Map the standard deviation
- This tells you how different the imputed values are from those used in the
imputation (the neighbors)
• Look for regional applicability/inapplicability of the imputation
method
- This tells you if the method works in some areas but not others
Perform sensitivity analysis
• Perform sensitivity analyses to assess how sensitive results are to
reasonable changes in the methods and paramters used
1. Perform your analysis
2. Impute the missing values
3. Perform the analysis again
4. Compare the results
Evaluate the results of the sensitivity analysis
• If there is a lot of variability, try a different approach
- For example:
- try using a larger neighborhood or more neighbors
- try using a different method (e.g., areal interpolation)
Consider the implications of imputation on the results
• Imputation fails to acknowledge uncertainty in the imputed values
• Typically, imputation results in narrower confidence intervals,
underestimation of standard errors and, thus, overestimation of
overestimation of test statistics
• Make explicit the assumptions of any methods used to cope with
missing data, for example, that the data were assumed missing at
random, or that missing values were assumed to have a particular
value, such as a poor outcome
• Address the potential impact of missing data on the findings in your
Discussion
• Indicate on the map which features had missing data
When communicating the results
Source: Higgins & Green (2011),
http://handbook.cochrane.org/chapter_16/16_1_2_general_principles_for_dealing_with_missing_data.htm
Thank you!
Aileen Buckley
Esri – Redlands
abuckley@esri.com
@mappingcenter
Dealing with incomplete data for mapping and spatial analysis

More Related Content

What's hot (20)

PDF
Dados espaciais em R (2020)
Vitor Vieira Vasconcelos
 
PPT
Chapter 12. Outlier Detection.ppt
Subrata Kumer Paul
 
PPT
Google Earth Basics
Desiree Caskey
 
PPT
OLAP technology
Dr. Mahendra Srivastava
 
PDF
Evaluation metrics: Precision, Recall, F-Measure, ROC
Big Data Engineering, Faculty of Engineering, Dhurakij Pundit University
 
PDF
Introduction to WebGIS- Esri norsk BK 2014
Geodata AS
 
PDF
Lec8: Medical Image Segmentation (II) (Region Growing/Merging)
Ulaş Bağcı
 
PPT
5.5 graph mining
Krish_ver2
 
PDF
Introduction of Open Source GIS
SANGHEE SHIN
 
PPT
3.7 outlier analysis
Krish_ver2
 
PPTX
Digital image processing techniques
Shab Bi
 
PDF
Image Forgery Detection
nitishkumar883951
 
PPSX
Image Processing Basics
Dr. A. B. Shinde
 
PDF
Lec10: Medical Image Segmentation as an Energy Minimization Problem
Ulaş Bağcı
 
PPT
Data mining techniques unit 1
malathieswaran29
 
PPTX
c,c++,java and python in gis development
Sakthivel R
 
PPTX
DIGITAL IMAGE PROCESSING
KarthicaMarasamy
 
PDF
Morphological operations
National Institute of Technology Durgapur
 
PPTX
Image Enhancement - Point Processing
Gayathri31093
 
PPTX
Spatial Data Models
RajalakshmiS34
 
Dados espaciais em R (2020)
Vitor Vieira Vasconcelos
 
Chapter 12. Outlier Detection.ppt
Subrata Kumer Paul
 
Google Earth Basics
Desiree Caskey
 
OLAP technology
Dr. Mahendra Srivastava
 
Evaluation metrics: Precision, Recall, F-Measure, ROC
Big Data Engineering, Faculty of Engineering, Dhurakij Pundit University
 
Introduction to WebGIS- Esri norsk BK 2014
Geodata AS
 
Lec8: Medical Image Segmentation (II) (Region Growing/Merging)
Ulaş Bağcı
 
5.5 graph mining
Krish_ver2
 
Introduction of Open Source GIS
SANGHEE SHIN
 
3.7 outlier analysis
Krish_ver2
 
Digital image processing techniques
Shab Bi
 
Image Forgery Detection
nitishkumar883951
 
Image Processing Basics
Dr. A. B. Shinde
 
Lec10: Medical Image Segmentation as an Energy Minimization Problem
Ulaş Bağcı
 
Data mining techniques unit 1
malathieswaran29
 
c,c++,java and python in gis development
Sakthivel R
 
DIGITAL IMAGE PROCESSING
KarthicaMarasamy
 
Image Enhancement - Point Processing
Gayathri31093
 
Spatial Data Models
RajalakshmiS34
 

Similar to Dealing with incomplete data for mapping and spatial analysis (20)

PPTX
Missing Data and Causes
akanni azeez olamide
 
PDF
missingpdf
Sunilkumar222171
 
PPTX
Statistical Approaches to Missing Data
DataCards
 
PPTX
Missing Observations and how to deal with them.pptx
Ranjith C
 
PPTX
Analysis-of-data-with-missing-values.pptx
AASTHAJAJOO
 
PDF
SPSS GuideAssessing Normality, Handling Missing Data, and Calculating Total S...
ahmedragab433449
 
DOC
data Sreening.doc
murtaza5500
 
PDF
SPSS GuideAssessing Normality, Handling Missing Data, and Calculating Scores...
ahmedragab433449
 
PDF
Missing data handling
QuantUniversity
 
PPTX
missingdatahandling-160923201313.pptx
DakshKhurana15
 
PDF
Applied Missing Data Analysis Methodology In The Social Sciences 1st Edition ...
kouamobegun
 
PPTX
Missing Data Analysis_Data Analysis Techniques
Prakriti Chandan Sinha
 
PDF
Missing data
mandava57
 
PPT
3 Missing data12256429.ppt
Aravind Reddy
 
PPTX
Guidelines for Data Quality and Preprocessing
Patrick460353
 
PDF
IRJET- Probability based Missing Value Imputation Method and its Analysis
IRJET Journal
 
PPTX
Database ppt.pptx
AASTHAJAJOO
 
PDF
COMPARISION OF PERCENTAGE ERROR BY USING IMPUTATION METHOD ON MID TERM EXAMIN...
ijiert bestjournal
 
PPTX
Missing Data and data imputation techniques
Omar F. Althuwaynee
 
PPTX
Imputation techniques for missing data in clinical trials
Nitin George
 
Missing Data and Causes
akanni azeez olamide
 
missingpdf
Sunilkumar222171
 
Statistical Approaches to Missing Data
DataCards
 
Missing Observations and how to deal with them.pptx
Ranjith C
 
Analysis-of-data-with-missing-values.pptx
AASTHAJAJOO
 
SPSS GuideAssessing Normality, Handling Missing Data, and Calculating Total S...
ahmedragab433449
 
data Sreening.doc
murtaza5500
 
SPSS GuideAssessing Normality, Handling Missing Data, and Calculating Scores...
ahmedragab433449
 
Missing data handling
QuantUniversity
 
missingdatahandling-160923201313.pptx
DakshKhurana15
 
Applied Missing Data Analysis Methodology In The Social Sciences 1st Edition ...
kouamobegun
 
Missing Data Analysis_Data Analysis Techniques
Prakriti Chandan Sinha
 
Missing data
mandava57
 
3 Missing data12256429.ppt
Aravind Reddy
 
Guidelines for Data Quality and Preprocessing
Patrick460353
 
IRJET- Probability based Missing Value Imputation Method and its Analysis
IRJET Journal
 
Database ppt.pptx
AASTHAJAJOO
 
COMPARISION OF PERCENTAGE ERROR BY USING IMPUTATION METHOD ON MID TERM EXAMIN...
ijiert bestjournal
 
Missing Data and data imputation techniques
Omar F. Althuwaynee
 
Imputation techniques for missing data in clinical trials
Nitin George
 
Ad

More from Aileen Buckley (20)

PPTX
Vector tile style editor workshop
Aileen Buckley
 
PPTX
Making the most of raster data from the arcgis living atlas of the world
Aileen Buckley
 
PPTX
Ten telltale signs of novice cartography
Aileen Buckley
 
PPTX
Making the most of raster data from the arcgis living atlas of the world
Aileen Buckley
 
PPTX
Working with space time data in ArcGIS
Aileen Buckley
 
PPTX
Creative cartography
Aileen Buckley
 
PPTX
Compelling cartography with ArcGIS pro
Aileen Buckley
 
PPTX
Atlas apps for online map collections
Aileen Buckley
 
PDF
Geocart workshop
Aileen Buckley
 
PPTX
Science at Esri
Aileen Buckley
 
PPTX
Working with space time data - esri uc 2018
Aileen Buckley
 
PPTX
Making the Most of Raster Analysis with Living Atlas Data - Esri UC 2018
Aileen Buckley
 
PPTX
Communicating spatial information visually
Aileen Buckley
 
PPTX
Learning to leverage the living atlas
Aileen Buckley
 
PPTX
Atlas mapping in the hybrid age
Aileen Buckley
 
PPTX
Analyzing and mapping space-time data
Aileen Buckley
 
PPTX
Compelling Cartography with ArcGIS
Aileen Buckley
 
PPTX
Methods for analyzing and mapping temporal data
Aileen Buckley
 
PPTX
Maps that Engage, Inform, and Inspire
Aileen Buckley
 
PPTX
Sharing historical maps and atlases in web apps
Aileen Buckley
 
Vector tile style editor workshop
Aileen Buckley
 
Making the most of raster data from the arcgis living atlas of the world
Aileen Buckley
 
Ten telltale signs of novice cartography
Aileen Buckley
 
Making the most of raster data from the arcgis living atlas of the world
Aileen Buckley
 
Working with space time data in ArcGIS
Aileen Buckley
 
Creative cartography
Aileen Buckley
 
Compelling cartography with ArcGIS pro
Aileen Buckley
 
Atlas apps for online map collections
Aileen Buckley
 
Geocart workshop
Aileen Buckley
 
Science at Esri
Aileen Buckley
 
Working with space time data - esri uc 2018
Aileen Buckley
 
Making the Most of Raster Analysis with Living Atlas Data - Esri UC 2018
Aileen Buckley
 
Communicating spatial information visually
Aileen Buckley
 
Learning to leverage the living atlas
Aileen Buckley
 
Atlas mapping in the hybrid age
Aileen Buckley
 
Analyzing and mapping space-time data
Aileen Buckley
 
Compelling Cartography with ArcGIS
Aileen Buckley
 
Methods for analyzing and mapping temporal data
Aileen Buckley
 
Maps that Engage, Inform, and Inspire
Aileen Buckley
 
Sharing historical maps and atlases in web apps
Aileen Buckley
 
Ad

Recently uploaded (20)

PDF
apidays Helsinki & North 2025 - APIs in the healthcare sector: hospitals inte...
apidays
 
PDF
Performance Report Sample (Draft7).pdf
AmgadMaher5
 
PDF
Incident Response and Digital Forensics Certificate
VICTOR MAESTRE RAMIREZ
 
PDF
List of all the AI prompt cheat codes.pdf
Avijit Kumar Roy
 
PPTX
Resmed Rady Landis May 4th - analytics.pptx
Adrian Limanto
 
PDF
MusicVideoProjectRubric Animation production music video.pdf
ALBERTIANCASUGA
 
PDF
apidays Helsinki & North 2025 - Monetizing AI APIs: The New API Economy, Alla...
apidays
 
PPTX
Rocket-Launched-PowerPoint-Template.pptx
Arden31
 
PPTX
Climate Action.pptx action plan for climate
justfortalabat
 
PDF
Avatar for apidays apidays PRO June 07, 2025 0 5 apidays Helsinki & North 2...
apidays
 
PPTX
Module-5-Measures-of-Central-Tendency-Grouped-Data-1.pptx
lacsonjhoma0407
 
PPTX
GenAI-Introduction-to-Copilot-for-Bing-March-2025-FOR-HUB.pptx
cleydsonborges1
 
PPTX
apidays Helsinki & North 2025 - Vero APIs - Experiences of API development in...
apidays
 
PDF
Building Production-Ready AI Agents with LangGraph.pdf
Tamanna
 
PPTX
加拿大尼亚加拉学院毕业证书{Niagara在读证明信Niagara成绩单修改}复刻
Taqyea
 
PDF
How to Avoid 7 Costly Mainframe Migration Mistakes
JP Infra Pvt Ltd
 
DOC
MATRIX_AMAN IRAWAN_20227479046.docbbbnnb
vanitafiani1
 
PPTX
Usage of Power BI for Pharmaceutical Data analysis.pptx
Anisha Herala
 
PPTX
AI Project Cycle and Ethical Frameworks.pptx
RiddhimaVarshney1
 
PPTX
Hadoop_EcoSystem slide by CIDAC India.pptx
migbaruget
 
apidays Helsinki & North 2025 - APIs in the healthcare sector: hospitals inte...
apidays
 
Performance Report Sample (Draft7).pdf
AmgadMaher5
 
Incident Response and Digital Forensics Certificate
VICTOR MAESTRE RAMIREZ
 
List of all the AI prompt cheat codes.pdf
Avijit Kumar Roy
 
Resmed Rady Landis May 4th - analytics.pptx
Adrian Limanto
 
MusicVideoProjectRubric Animation production music video.pdf
ALBERTIANCASUGA
 
apidays Helsinki & North 2025 - Monetizing AI APIs: The New API Economy, Alla...
apidays
 
Rocket-Launched-PowerPoint-Template.pptx
Arden31
 
Climate Action.pptx action plan for climate
justfortalabat
 
Avatar for apidays apidays PRO June 07, 2025 0 5 apidays Helsinki & North 2...
apidays
 
Module-5-Measures-of-Central-Tendency-Grouped-Data-1.pptx
lacsonjhoma0407
 
GenAI-Introduction-to-Copilot-for-Bing-March-2025-FOR-HUB.pptx
cleydsonborges1
 
apidays Helsinki & North 2025 - Vero APIs - Experiences of API development in...
apidays
 
Building Production-Ready AI Agents with LangGraph.pdf
Tamanna
 
加拿大尼亚加拉学院毕业证书{Niagara在读证明信Niagara成绩单修改}复刻
Taqyea
 
How to Avoid 7 Costly Mainframe Migration Mistakes
JP Infra Pvt Ltd
 
MATRIX_AMAN IRAWAN_20227479046.docbbbnnb
vanitafiani1
 
Usage of Power BI for Pharmaceutical Data analysis.pptx
Anisha Herala
 
AI Project Cycle and Ethical Frameworks.pptx
RiddhimaVarshney1
 
Hadoop_EcoSystem slide by CIDAC India.pptx
migbaruget
 

Dealing with incomplete data for mapping and spatial analysis

  • 1. Dealing with Incomplete Data for Mapping and Spatial Analysis Aileen Buckley Esri – Redlands @mappingcenter [email protected] April 7 | Boston, MA AAG 2017
  • 2. Workshop overview • A little about missing data • Methods for dealing with missing data • A focus on imputation methods • Analyzing the results of imputation methods
  • 3. Data “values” or lack thereof VALUE MEANING " " Blank "NULL" Null "NA", "N/A" Not Available or Not Applicable "?", "UKN", "UNKNOWN" Unknown "OTHER A selection from a multiple-choice survey or pull-down menu "Not Answered" or "Not Provided" The question was asked, but the response was not provided "0" Known zero "Non-match" Not matched to other internal or external data sources "Error" or "Undefined" Generated, for example, when dividing by zero "-9999" or other numeric value out of range Not part of the recorded data or data outside the study area "No data", "NoData", "NODATA" Data is absent "---" or some other indicator Who knows? How can you be sure that you interpret this correctly? Largest (or smallest) double integer The largest (or smallest) integer that can be stored in a double field; DBL_MAX or approximately 1.8 × 10308 (if the double is an IEEE 754 64-bit double)
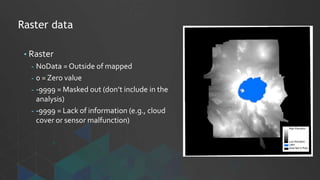
  • 4. Raster data • Raster - NoData = Outside of mapped - 0 = Zero value - -9999 = Masked out (don’t include in the analysis) - -9999 = Lack of information (e.g., cloud cover or sensor malfunction)
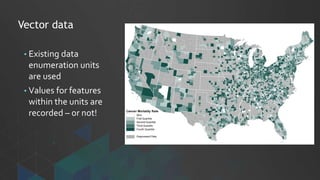
  • 5. Vector data • Existing data enumeration units are used • Values for features within the units are recorded – or not!
  • 7. Collection problems • Data may be missing because it cannot be collected - For example, access to a location is denied or locations cannot be safely accessed • Data collection may be thwarted by regulations or restrictions - For example, the maximum altitude for drones in the United States is currently 400 meters and drones can only be used in areas that are not designated as no- fly zones • Other times data cannot be collected because the features of interest cannot be located
  • 8. • Sometimes the data are collected and then become compromised when files are mishandled - For example, values may be missing if a file was not copied completely • Data manipulation, conversion, and merging can also result in missing data - For example, data stored in spreadsheet format may become corrupted when converted to another format—values may be converted to NULL; leading or trailing zeros may be stripped off; numeric values may be converted to strings which cannot be used in calculations; or certain values may not be converted at all Handling problems
  • 9. • Some data types (for example, shapefiles) do not support null values, so some other value will be substituted instead (for example, a null integer is stored as a zero, and a null text string is stored as a space) Handling problems See blogs.arcgis.com  Formatting an Excel table for use with ArcGIS
  • 10. • A dataset may be complete but it does not contain data of the desired type - For example, with remote sensing data, clouds or topography may obscure the data of interest • Collected data may be questionable if the method of collection is suspect - This happens, for example, when sensors malfunction or are incorrectly calibrated or when a person doesn’t adequately understand or correctly interpret a survey question Data problems
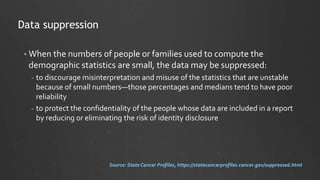
  • 11. • When the numbers of people or families used to compute the demographic statistics are small, the data may be suppressed: - to discourage misinterpretation and misuse of the statistics that are unstable because of small numbers—those percentages and medians tend to have poor reliability - to protect the confidentiality of the people whose data are included in a report by reducing or eliminating the risk of identity disclosure Data suppression Source: State Cancer Profiles, https://statecancerprofiles.cancer.gov/suppressed.html
  • 12. The implications of dealing with missing data • Analyses of data sets with missing data are more complex than analyses of complete data sets • There is a lack of consistency among analyses if analysts compensate for missing data in different ways or their analyses are based on different subsets of data • In some cases, incomplete data cannot be used to compute official statistics (e.g., census) • Statistical analyses can produce biased and misleading results
  • 13. • “Given the expense of collecting data, we cannot afford to start over or to wait until we have developed foolproof methods of gathering information (an unachievable goal). • We find ourselves left with the decision of how to deal with the fact that we do not have complete information for the entire data set.” The conundrum Source: Pigott,T.D. (2001) http://galton.uchicago.edu/~eichler/stat24600/Admin/MissingDataReview.pdf
  • 14. Dealing with missing data Statistical methods
  • 15. Complete datasets • One approach, and the simplest, is to use only those datasets with complete information, though this sometimes means that the question at hand cannot be adequately or fully answered, and if alternative datasets do not exist, then the answer may not be answered at all
  • 16. Complete cases • Another approach is to use only those cases with complete information - Listwise deletion – drop the observation if the value for any variable is missing; sometimes called “complete case analysis” - Pairwise deletion – drop the observation if the value for the variable of interest is missing; sometimes called “available case analysis”
  • 17. • “Researchers either consciously or by default in a statistical analysis drop informants who do not have complete data on the variables of interest. • In statistical language, if the number of the cases is less than 5% of the sample, then the researcher can drop them.” Complete cases http://www.statisticssolutions.com/missing-values-in-data/
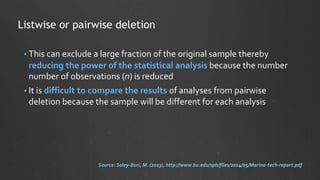
  • 18. • This can exclude a large fraction of the original sample thereby reducing the power of the statistical analysis because the number number of observations (n) is reduced • It is difficult to compare the results of analyses from pairwise deletion because the sample will be different for each analysis Listwise or pairwise deletion Source: Soley-Bori, M. (2013), http://www.bu.edu/sph/files/2014/05/Marina-tech-report.pdf
  • 19. Imputation • An alternative is to fill in a plausible value for the missing observations, such as using the mean of the observed cases on that variable; this is called imputation • This is a way to avoid pitfalls involved with listwise or pariwise deletion because imputation preserves all cases by replacing missing data with an estimated value based on other available information
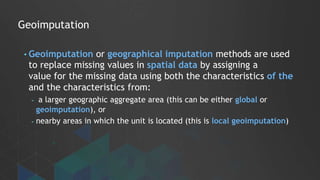
  • 20. Geoimputation • Geoimputation or geographical imputation methods are used to replace missing values in spatial data by assigning a value for the missing data using both the characteristics of the and the characteristics from: - a larger geographic aggregate area (this can be either global or geoimputation), or - nearby areas in which the unit is located (this is local geoimputation)
  • 21. • “More recently, statisticians have advocated methods that are based on distributional models for the data.” • These advanced methods include: - Multiple imputation - Maximum likelihood - Baysian simulation - Hot deck imputation Other approaches Source: Pigott,T.D. (2000), http://galton.uchicago.edu/~eichler/stat24600/Admin/MissingDataReview.pdf
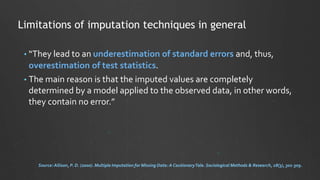
  • 22. • “They lead to an underestimation of standard errors and, thus, overestimation of test statistics. • The main reason is that the imputed values are completely determined by a model applied to the observed data, in other words, they contain no error.” Limitations of imputation techniques in general Source: Allison, P. D. (2000). Multiple Imputation for Missing Data: A CautionaryTale. Sociological Methods & Research, 28(3), 301-309.
  • 23. A special note about census data
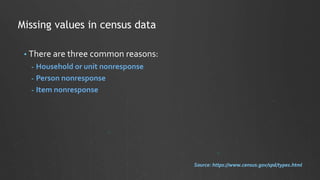
  • 24. • There are three common reasons: - Household or unit nonresponse - Person nonresponse - Item nonresponse Missing values in census data Source: https://www.census.gov/spd/types.html
  • 25. • Missing data for a household or unit occurs when an enumerator is able to find an address but is unable to obtain any census data - This may happen because no one is at home or no one is willing or able to participate in the survey - It can also occurs when the people at the address have moved to an unknown or unavailable address • In these cases, a nonresponse is dealt with through weighting adjustments Household or unit nonresponse Source: https://www.census.gov/spd/types.html
  • 26. • Missing data for a person occurs when data is collected from one but not all people in a household or unit - This can happen because someone is not willing, able, or available to participate in the survey • Missing values are imputed or edited (logically inferred from other data that have been provided) Person nonresponse Source: https://www.census.gov/spd/types.html
  • 27. • Missing data for an item or question in the survey occurs when a person completes part of the survey but does not answer one or more individual questions - This can occur if a person is unwilling or unable to provide the requested information; a person forgets to answer a question; a response is logically inconsistent; an enumerator fails to ask a question or record an answer; or an enumerator erroneously records the response • Missing values are generally imputed in these cases Item nonresponse Source: https://www.census.gov/spd/types.html
  • 28. General principles for dealing with missing data Imputation
  • 29. Map the data • Determine if the missing data is: 1. Clustered 2. At the core 3. At the perimeters • All of these are red flags  check the data collection and handling methods
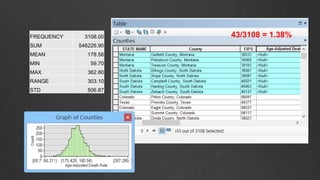
  • 31. Explore the data • What value(s) are used to represent missing data? • How many records contain missing values? • What is the range of values? Are there “hard max or min values? • What variability is in the values? • Are there outlier? • It is risky to work with missing data: - when there is too much of it  5% of the data or more - when it is on the tails of the distribution
  • 32. 43/3108 = 1.38%FREQUENCY 3108.00 SUM 546226.90 MEAN 178.56 MIN 59.70 MAX 362.80 RANGE 303.10 STD 506.87
  • 33. Consider how the data will be used • If it is for visualization only (e.g., a map), the results of dealing with missing data (e.g., imputation) may not be visible because of the mapping process itself (e.g., classification) • How will the results be used?What are the implications for using results with data that was “invented”?
  • 35. Geoimputation methods demonstrated in this workshop - Global method - Impute from the a global statistic of the dataset - Regional method - Impute from the state rate - Local methods - Impute from polygon neighbors - Impute from an areal interpolation surface - Impute usingThiessen polygons - Impute using the Fill MissingValues tool
  • 36. Impute from a global value • Substitute the global statistical value for the missing values • For example, global mean
  • 37. Impute from a regional value • Substitute the regional statistical value for the missing values - For example, state rate
  • 38. Impute from an areal interpolation surface • Use areal interpolation to create a surface from the known values • Substitute the values at the location of the polygon centroid for the missing values
  • 39. Impute from polygon neighbors • Use the values of the neighboring polygons to calculate a mean • Substitute the neighborhood mean for the missing values
  • 40. Demos
  • 41. Impute using the Fill Missing Values tool • Use the imputation tool available in the next release of ArcGIS Pro • A variety of options for how to impute the missing values
  • 42. Fill Missing Values tool • Easy to use • Handles both space and time • Many options for the parameters - Impute multiple values - Different neighborhoods
  • 43. Demo
  • 44. Best practices for imputing data
  • 45. Choose the best type to represent the data • Points • Lines - FeatureVerticesTo Points with the MID option -- a point will be created at the midpoint, not necessarily a vertex, of each input line or polygon boundary • Polygons - FeatureTo Point with CENTROID option = the output point will be located at the center of gravity (centroid) of the polygon - FeatureTo Point with INSIDE option = the output point will be inside the polygon
  • 46. Choose the best fill method • Average • Minimum • Maximum • Median • TemporalTrend
  • 47. Choose the best fill method • Pick the option that makes the most sense for the data - Average – useful for many cases - Minimum – when you don’t want to overexaggerate (% people with a graduate degree) - Maximum – when you don’t want to underestimate (e.g., % of children in school lunch programs) - Median – when there are extremes or outliers (e.g., housing value)
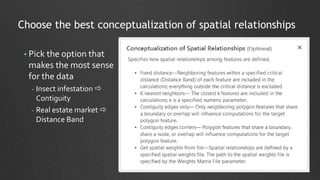
  • 48. Choose the best conceptualization of spatial relationships • Pick the option that makes the most sense for the data - Insect infestation  Contiguity - Real estate market  Distance Band
  • 49. For inverse distance weighted (with the Fill Missing Values tool) • Generate Spatial Weights Matrix - Use this to generate a matrix that includes the distance to neighboring points or polygon centroids • Generate Network Spatial Weights
  • 51. Evaluate the results of imputation • Check the number and percentage of values imputed - Are any still missing? If so, where are they? • Don’t impute from imputed values (otherwise you are “inventing” data from “invented” data) - You might be tempted to do this when all missing values are not imputed (e.g., a feature with a missing value is surrounded by others with missing values) - Alternatives: - Change the parameters (e.g., the number of neighbors or size of neighborhood) - Use a different method (e.g., global or regional geoimputation; areal interpolation)
  • 52. Compare distributions • Examine the distribution of the data set before and after imputation (i.e., the histogram and descriptive statistics) - This tells you how much imputation changed the global distribution • Map the standard deviation - This tells you how different the imputed values are from those used in the imputation (the neighbors) • Look for regional applicability/inapplicability of the imputation method - This tells you if the method works in some areas but not others
  • 53. Perform sensitivity analysis • Perform sensitivity analyses to assess how sensitive results are to reasonable changes in the methods and paramters used 1. Perform your analysis 2. Impute the missing values 3. Perform the analysis again 4. Compare the results
  • 54. Evaluate the results of the sensitivity analysis • If there is a lot of variability, try a different approach - For example: - try using a larger neighborhood or more neighbors - try using a different method (e.g., areal interpolation)
  • 55. Consider the implications of imputation on the results • Imputation fails to acknowledge uncertainty in the imputed values • Typically, imputation results in narrower confidence intervals, underestimation of standard errors and, thus, overestimation of overestimation of test statistics
  • 56. • Make explicit the assumptions of any methods used to cope with missing data, for example, that the data were assumed missing at random, or that missing values were assumed to have a particular value, such as a poor outcome • Address the potential impact of missing data on the findings in your Discussion • Indicate on the map which features had missing data When communicating the results Source: Higgins & Green (2011), http://handbook.cochrane.org/chapter_16/16_1_2_general_principles_for_dealing_with_missing_data.htm
  • 57. Thank you! Aileen Buckley Esri – Redlands [email protected] @mappingcenter

Editor's Notes

  • #2: Many data sets are incomplete causing problems when performing spatial analysis or when mapping. Sometimes the data is unable to be collected, other times the data is collected but its quality is questionable or the method of collection is suspect, and still other times the data is collected but not shared. When data sets are incomplete, they can cause errors or biases in spatial analyses and result in uninformative or incomplete-looking maps. This workshop examines a variety of approaches that can be taken to help to mitigate these problems and evaluates their relative strengths and weaknesses.
  • #77: http://blogs.esri.com/Support/blogs/mappingcenter/archive/2010/11/29/semiology-of-graphics-the-reprint-of-a-classic.aspx?utm_source=feedburner&utm_medium=feed&utm_campaign=Feed%3A+MappingCenter+%28Mapping+Center%29