PublicDisclosureAuthorizedPublicDisclosureAuthorizedPublicDisclosureAuthorizedPublicDisclosureAuthorized
ii
ACKNOWLEDGEMENTS
The Report has been prepared by a team led by Norbert Fiess and consisting of Phillipe Aguera, Eric
Kouevi, Nihal Bayraktar, Cesar Calderon, Leif Jensen, Joanne Gaskell, John Keyser, Hannah Nielsen,
Alberto Portugal and Jose Signoret. A list of background paper commissioned for the report is provided
below.
The team also acknowledges the excellent guidance and support received from Elisabeth Huybens
(Country Director), Francisco Carneiro (Practice Manager) and Mazen Bouri (Program Leader)
throughout the process. Valuable guidance from Seynabou Sakho and Sona Varma at the inception of
the report and helpful comments on technical aspects related to regional financial stability and trade
facilitation from Ashani Chanuka, Myriam Chaudron, Ankur Huria and Cedric Mousset are gratefully
acknowledged. The team would also like to thank the peer reviewers Ivailo Izvorski, Sandeep Mahajan
and Christine Richaud for their very valuable insights.
Research assistance from Soule Sow and Pierre Mandon (consultants), and administrative support from
Silvia Gulino, Claudia Rocio Manrique, Angele Mountou and Irene Sitienei are also gratefully
acknowledged.
List of Background Papers for this Report:
Bayraktar, N. and B. Moreno-Dodson (2018b). “Tax Structure and the Private Sector in CEMAC.”
Calderon, C. and C. Cantu (2018): Foreign trade and growth in CEMAC: Intensity and Concentration”.
Djiofack, C. (2018). “Using a dynamic global CGE model (ENVISAGE) to model the impact of removing
petty harassment costs (“tracasseries”) on intra-regional trade and growth in CEMAC.“
Fiess, N. and A. Kouevi (2018). ”Productivity of non-oil sectors in CEMAC countries”.
Fiess, N. and R. MacDonald (2018). “The CEMAC and Currency Regime Issues.”
Haile. F. and L. Moller (2018). “Explaining Growth in CEMAC (2000-2016).”
Nguh, A. and A. Ndedi (2017): “Factors hindering regional integration in CEMAC and the way forward”.
Nielsen, H. and N. Fiess (2018). “Regional Integration and Convergence in CEMAC.”
iii
ACRONYMS AND ABBREVIATIONS
AU African Union
BEAC Bank of Central African States (Banque des Etats de l'Afrique Centrale)
BEER Behavioral Equilibrium Exchange Rate
CAR Central African Republic
CEMAC Central African Economic and Monetary Community
CEN-SAD Community of Sahel-Saharan States
CET Common External Tariff
CFTA Continental Free Trade Area
CIT Corporate Income Tax
COBAC Central African Banking Commission (Commission Bancaire de l'Afrique Centrale)
EBA Everything but Arms Program
ECCAS Economic Community of Central African States
ECOWAS Economic Community of West African States
EPA Economic Partnership Agreement
EU European Union
FATF Financial Action Task Force
FDI Foreign Direct Investment
FEER Fundamental Equilibrium Exchange Rate
FSA Financial Sector Assessment
GDP Gross Domestic Product
GIABA West Africa Inter-Governmental Action Group Against Money Laundering
HDI Human Development Index
IMF International Monetary Fund
MFN Most favoured Nation
MPC Monetary Policy Committee
NATREX Natural Real Exchange Rate
NEPAD New Partnership for Africa’s Development
NPLs Non-Performing Loans
NTMs Non-tariff Measures
OAU Organization of African Unity
REC Regional Economic Communities
SIPS Systemically Important Payment Systems
SPS Sanitary and Phyto-Sanitary
SSA Sub-Saharan Africa
TBT Technical Barriers to Trade
TFA Trade Facilitation Agreement
TFP Total Factor Productivity
UEAC Central African Economic Union (Union Économique de l'Afrique Centrale)
UMAC Central African Monetary Union (Union Monétaire de l'Afrique Centrale)
VAT Value Added Tax
WAEMU West African Economic and Monetary Union
WTO World Trade Organization
iv
CONTENTS
ACKNOWLEDGEMENTS ......................................................................................................................ii
ACRONYMS AND ABBREVIATIONS.....................................................................................................iii
Executive Summary...........................................................................................................................ix
CHAPTER 1: Economic Developments and Convergence in the CEMAC Region..................................1
A. Introduction ......................................................................................................................................1
B. Economic and social indicators.........................................................................................................1
C. Trade linkages have changed significantly over time .....................................................................13
D. Exchange rate developments..........................................................................................................14
E. Economic convergence remains limited.........................................................................................18
F. Conclusion and policy recommendations.......................................................................................21
Annex ......................................................................................................................................................23
CHAPTER 2: Constraints to Private Sector Development ................................................................28
A. Introduction ....................................................................................................................................28
B. Obstacles to doing business............................................................................................................28
C. The performance and productivity of firms in CEMAC...................................................................35
D. Conclusion and policy recommendations.......................................................................................38
CHAPTER 3: The Financial Sector in CEMAC ...................................................................................39
A. Introduction ....................................................................................................................................39
B. Overview of the financial sector.....................................................................................................39
C. Challenges of the financial sector...................................................................................................42
D. Vulnerabilities and risks..................................................................................................................43
E. Conclusion and policy recommendations.......................................................................................44
CHAPTER 4: Taxation and Regional Integration..............................................................................47
A. Introduction ....................................................................................................................................47
B. The fiscal regime and tax structure in CEMAC................................................................................47
C. The tax revenue performance in CEMAC........................................................................................50
D. Conclusion and policy implications.................................................................................................56
v
CHAPTER 5: Trade Analysis and Trade Policy in CEMAC Countries ..................................................60
A. Introduction ....................................................................................................................................60
B. Trade analysis for CEMAC countries...............................................................................................60
C. Trade policy in CEMAC....................................................................................................................70
D. Conclusion and policy recommendations.......................................................................................76
Annex ......................................................................................................................................................78
CHAPTER 6: Barriers to Regional Trade in Agriculture ....................................................................81
A. Introduction ....................................................................................................................................81
B. Agriculture in CEMAC......................................................................................................................81
C. Bottlenecks to agricultural trade ....................................................................................................85
D. Conclusions and policy recommendations .....................................................................................93
Annex ......................................................................................................................................................95
CHAPTER 7: Political Economy Considerations of Regional Integration in CEMAC............................96
A. Introduction ....................................................................................................................................96
B. CEMAC and regional integration in Central Africa..........................................................................96
C. Political economy aspects affecting regional integration and regional development ...................99
D. Conclusions and policy recommendations ...................................................................................102
REFERENCES ................................................................................................................................104
vi
List of Figures
Figure 1: CEMAC - Real GDP growth rate, GDP and GNI per capita (1984-2016).........................................3
Figure 2: CEMAC – oil and non-oil GDP shares (1990-2016), current prices................................................3
Figure 3: CEMAC – oil volume, value and price (1990-2016)........................................................................3
Figure 4: CEMAC – CPI inflation, annual average (1984-2000), percent ......................................................4
Figure 5: CEMAC – CPI inflation, annual average (2001-2016), percent ......................................................4
Figure 6: CEMAC – Overall fiscal balance as share of GDP (2000-2016), percent........................................5
Figure 7: CEMAC – Current account balance as share of GDP (2000-2016), percent...................................5
Figure 8: Total reserve assets, US$ billion (2001-2016)................................................................................6
Figure 9: Gross total debt as share of total CEMAC GDP (2000-2016).........................................................6
Figure 10: Human Development Index.........................................................................................................7
Figure 11: Education and health statistics....................................................................................................7
Figure 12: Doing Business 2018 report - categories .....................................................................................8
Figure 13: Ibrahim Index – overall governance index...................................................................................9
Figure 14: Ibrahim Index – sub-categories (2015) ........................................................................................9
Figure 15. Key growth drivers in CEMAC (2000-2016)................................................................................12
Figure 16. Structural drivers of growth in CEMAC, WAEMU and SSA ........................................................13
Figure 17: CEMAC - GDP convergence – compared to starting level (1960 and 1984) ..............................19
Figure 18: WAEMU - GDP convergence – compared to starting level (1960 and 1984) ............................19
Figure 19: Top ten constraints to business.................................................................................................29
Figure 20: Cost of bribes, security, crime, and power outages by country ................................................30
Figure 21: Cost of labor per worker............................................................................................................35
Figure 22: Productivity and Value Added per worker.................................................................................35
Figure 23: Contribution to value added by size..........................................................................................36
Figure 24. CEMAC - Total Assets by Country at end-January 2018.............................................................40
Figure 25. Distribution of Total Assets by Country as of September 30, 2017...........................................41
Figure 26. Composition of Government Tax Revenues as a Percent of GDP, CEMAC, 1980–2016............51
Figure 27. Selected Taxes (% of general government taxes, country averages) ........................................52
Figure 28: Effective and corporate income taxes and labor taxes and contributions, 2013-2016.............53
Figure 29. Effective Total Taxes Paid by Enterprises (Labor, Corporate Income and Other), % of Profit,
average between 2005 and 2016 ...............................................................................................................54
Figure 30. Comparison of CIT rates across CEMAC countries (in % of profits), 2009-2015........................55
Figure 31. Total resource taxes (% of GDP) ................................................................................................56
Figure 32: Export value by category and petroleum export share in CEMAC trade...................................61
Figure 33: Concentration of goods exports in 2015 ...................................................................................61
Figure 34: Non-petroleum export value by country...................................................................................62
Figure 35: Petroleum export value by country...........................................................................................62
Figure 36: Extra-community exports of non-petroleum products to various partners..............................63
Figure 37: Extra-community exports of petroleum products to various partners .....................................63
Figure 38: Extra-community imports from various origins.........................................................................64
Figure 39: Share of intra-community exports in CEMAC exports by category ...........................................69
Figure 40. Trade Complementarity Indices for CEMAC countries, 2014 ....................................................70
Figure 41: Frequency of CET bands.............................................................................................................71
Figure 42: MFN duty rates applied by CEMAC countries, 2015..................................................................73
vii
Figure 43. Deviations from the CET by country and HS chapter, 2015.......................................................74
Figure 44. Incidence of import NTMs in Cameroon, 2015..........................................................................76
Figure 45. Net Food Production Value (constant 2004-2006 $).................................................................84
Figure 46: Overlapping regional initiatives in Africa.................................................................................100
List of Tables
Table 1: Overview of economic indicators for CEMAC region......................................................................6
Table 2: Ease of Doing Business indicator - CEMAC......................................................................................8
Table 3: Summary of governance indicators - CEMAC .................................................................................9
Table 4: Summary of governance indicators - WAEMU..............................................................................10
Table 5: Contribution of TFP and physical capital per worker to GDP per worker (in percent).................10
Table 6: Summary of results from convergence analysis ...........................................................................20
Table 7: Top three major or severe obstacles ............................................................................................29
Table 8. Selected Indicators on Access to Finance .....................................................................................31
Table 9. Selected Indicators on Financial Inclusion of Individuals (as percentage of population over 15
years), 2014 and 2017.................................................................................................................................32
Table 10. Firms Identifying Tax Rates or Tax Administration as a Major Constraint (percent of all firms) 33
Table 11. Percent of firms competing with informal firms and identifying this as a problem...................34
Table 12. CEMAC - Number of Registered MFIs by Category and Country as of September 30, 2017......40
Table 13. CEMAC - Evolution of the Number of Members and Clients of MFIs .........................................41
Table 14: Tariff Structure of Existing and Prospective Custom Unions in SSA ...........................................48
Table 15: Statuary Corporate Income Tax Rates in CEMAC in 2016 (% of profits).....................................49
Table 16: Preference utilization rates of exports to the EU by country in 2016 ........................................67
Table 17: Share of intra-regional exports for selected trade blocs. ...........................................................69
Table 18. CEMAC Common External Tariff, by broad sectors.....................................................................72
Table 19: Recorded agricultural exports by destination (%)......................................................................83
Table 20. Key Food Security and Nutrition Indicators in CEMAC................................................................85
Table 21. Price build-up for selected commodities on the Cameroon to Gabon corridor (% of final
consumer prices).........................................................................................................................................91
viii
List of Boxes
Box 1. Monetary and fiscal policy in CEMAC ................................................................................................2
Box 2. Exchange rate regime and economic outcomes for the CFA zone ..................................................16
Box 3. Determinants of productivity – Regression Analysis .......................................................................37
Box 4. BEAC’s Strategic Plan 2017-2020 .....................................................................................................45
Box 5. BEAC’s Governance Reform .............................................................................................................46
Box 6. Investment incentives and codes in the CEMAC region ..................................................................49
Box 7. Trade and economic growth in CEMAC: regression nalysis.............................................................64
Box 8. Agriculture in CEMAC suffers from numerous constraints..............................................................82
Box 9. Unrecorded and informal trade in agricultural products is widespread. ........................................90
Box 10. Simulations of removal or tracasseries on intra- regional trade and growth in CEMAC...............92
Box 11. CEMAC structure and decision making processes……………………………………………………………………..95
ix
Executive Summary
Introduction
1. The Central African Economic and Monetary Community (CEMAC), which consists of
Cameroon, the Central African Republic, Chad, the Republic of Congo, Equatorial Guinea and Gabon, is
one of the oldest regional groupings in Africa. CEMAC’s Vision 2025 calls for making the sub-region “an
emerging and integrated economic space characterized by security, solidarity and good governance in
the service of human development”. The main objectives for achieving this are: (i) the creation of a fully
functional and effective customs union, (ii) the establishment of a robust system of macroeconomic
surveillance, and (iii) the harmonization of sectoral policies and legal frameworks that will create a
common market for goods, capital, and services.
2. Despite this ambitious vision, regional integration in the CEMAC zone remains shallow. The
common external tariff is not effectively utilized; member countries continue to apply different rates to
products depending on their national interests. Numerous obstacles to the free movement of people
and goods remain; and sectoral and economic policies are far from being harmonized. Regional trade
remains very modest compared to regional trade agreements in Africa and elsewhere. Recorded intra-
CEMAC trade is estimated to represent only between 2 and 5 percent of the total trade of the member
countries, the lowest of any regional integration community. CEMAC has also not delivered in terms of
growth, as average growth during the last two decades has been slower than the sub-Saharan African
(SSA) average.
3. The oil price shock of 2014-15 severely affected the six CEMAC economies and promoted re-
commitment to deepening regional integration. In a crisis meeting in Yaoundé on December 23, 2016,
CEMAC’s heads of state committed to fiscal austerity and structural reforms. This meeting set in motion
a regionally-coordinated effort to maintain CEMAC’s external stability and preserve the integrity of its
monetary arrangement, and Heads of State renewed their commitment to the CEMAC 2025 vision of
deeper regional integration and cooperation under the umbrella of the regional economic and financial
reform program (PREF-CEMAC), launched in July 2016. At the regional level, the PREF also aims to: (i)
improve the coordination of public financial management (PFM) and fiscal policy; (ii) accelerate regional
integration through improvements to the regional economic plan; (iii) improve the business climate; (iv)
increase economic diversification; (v) enhance monetary policy transmission mechanisms; and (vi)
improve prudential banking supervision. BEAC and COBAC, CEMAC’s regional central bank and financial
authority, are making good progress in enhancing the transmission mechanism of monetary policy,
supporting the build-up of regional reserves, and promoting financial sector stability. Member countries
need to retain a commitment to fiscal consolidation; adopt community regulations, particularly on PFM,
trade and investment into national legislations; and help CEMAC institutions strengthen regional macro
surveillance.
4. CEMAC is right to focus on reforms to deepening regional integration as a driver of growth.
Analyses conducted as part of this report indicate that there are significant gains to be had from such
reforms. Increasing trade openness and reducing export concentration to the level of the Sub-Saharan
average could increase CEMAC growth rate by 1 to 2 percentage points, while removing informal trade
costs along CEMAC’s main trading corridors is estimated to increase intra-regional trade by 25 percent
and add an additional 1 percentage points to growth over the medium-term. Deepening regional
x
integration will also allow CEMAC countries to overcome the lack of scale economies that is contributing
to low levels of economic diversification and insufficient integration in regional and global value chains.
5. The objective of this Regional Study on CEMAC is to support policy makers in CEMAC in efforts
to strengthen regional integration to support economic growth and to reduce the need for economic
adjustment. The Regional Study focuses mainly on what can be done at the regional level to support
regional integration, macro-stability and long-term growth in the CEMAC area; as such, the Regional
Study aims to complement country-specific policies and initiatives to support macro-stabilization,
economic development and integration.
6. The Regional Study is organized as follows. Chapter 1 takes stock of recent economic
developments in CEMAC and documents low levels of intra-regional trade and convergence; this is a
concern as economic convergence is both a prerequisite for a successful economic and monetary union
and the expected outcome of the regional integration process itself. Increasing trade as an engine for
growth and convergence requires a vibrant and competitive private sector. While structural factors,
such as a poor business environment, can weigh on competitiveness, a misaligned exchange rate could
also undermine competitiveness. As a real effective exchange rate assessment for CEMAC does not
indicate significant misalignment, the lack of competitiveness in CEMAC seems largely due to structural
constraints in the regional business environment. These structural constraints are further explored in
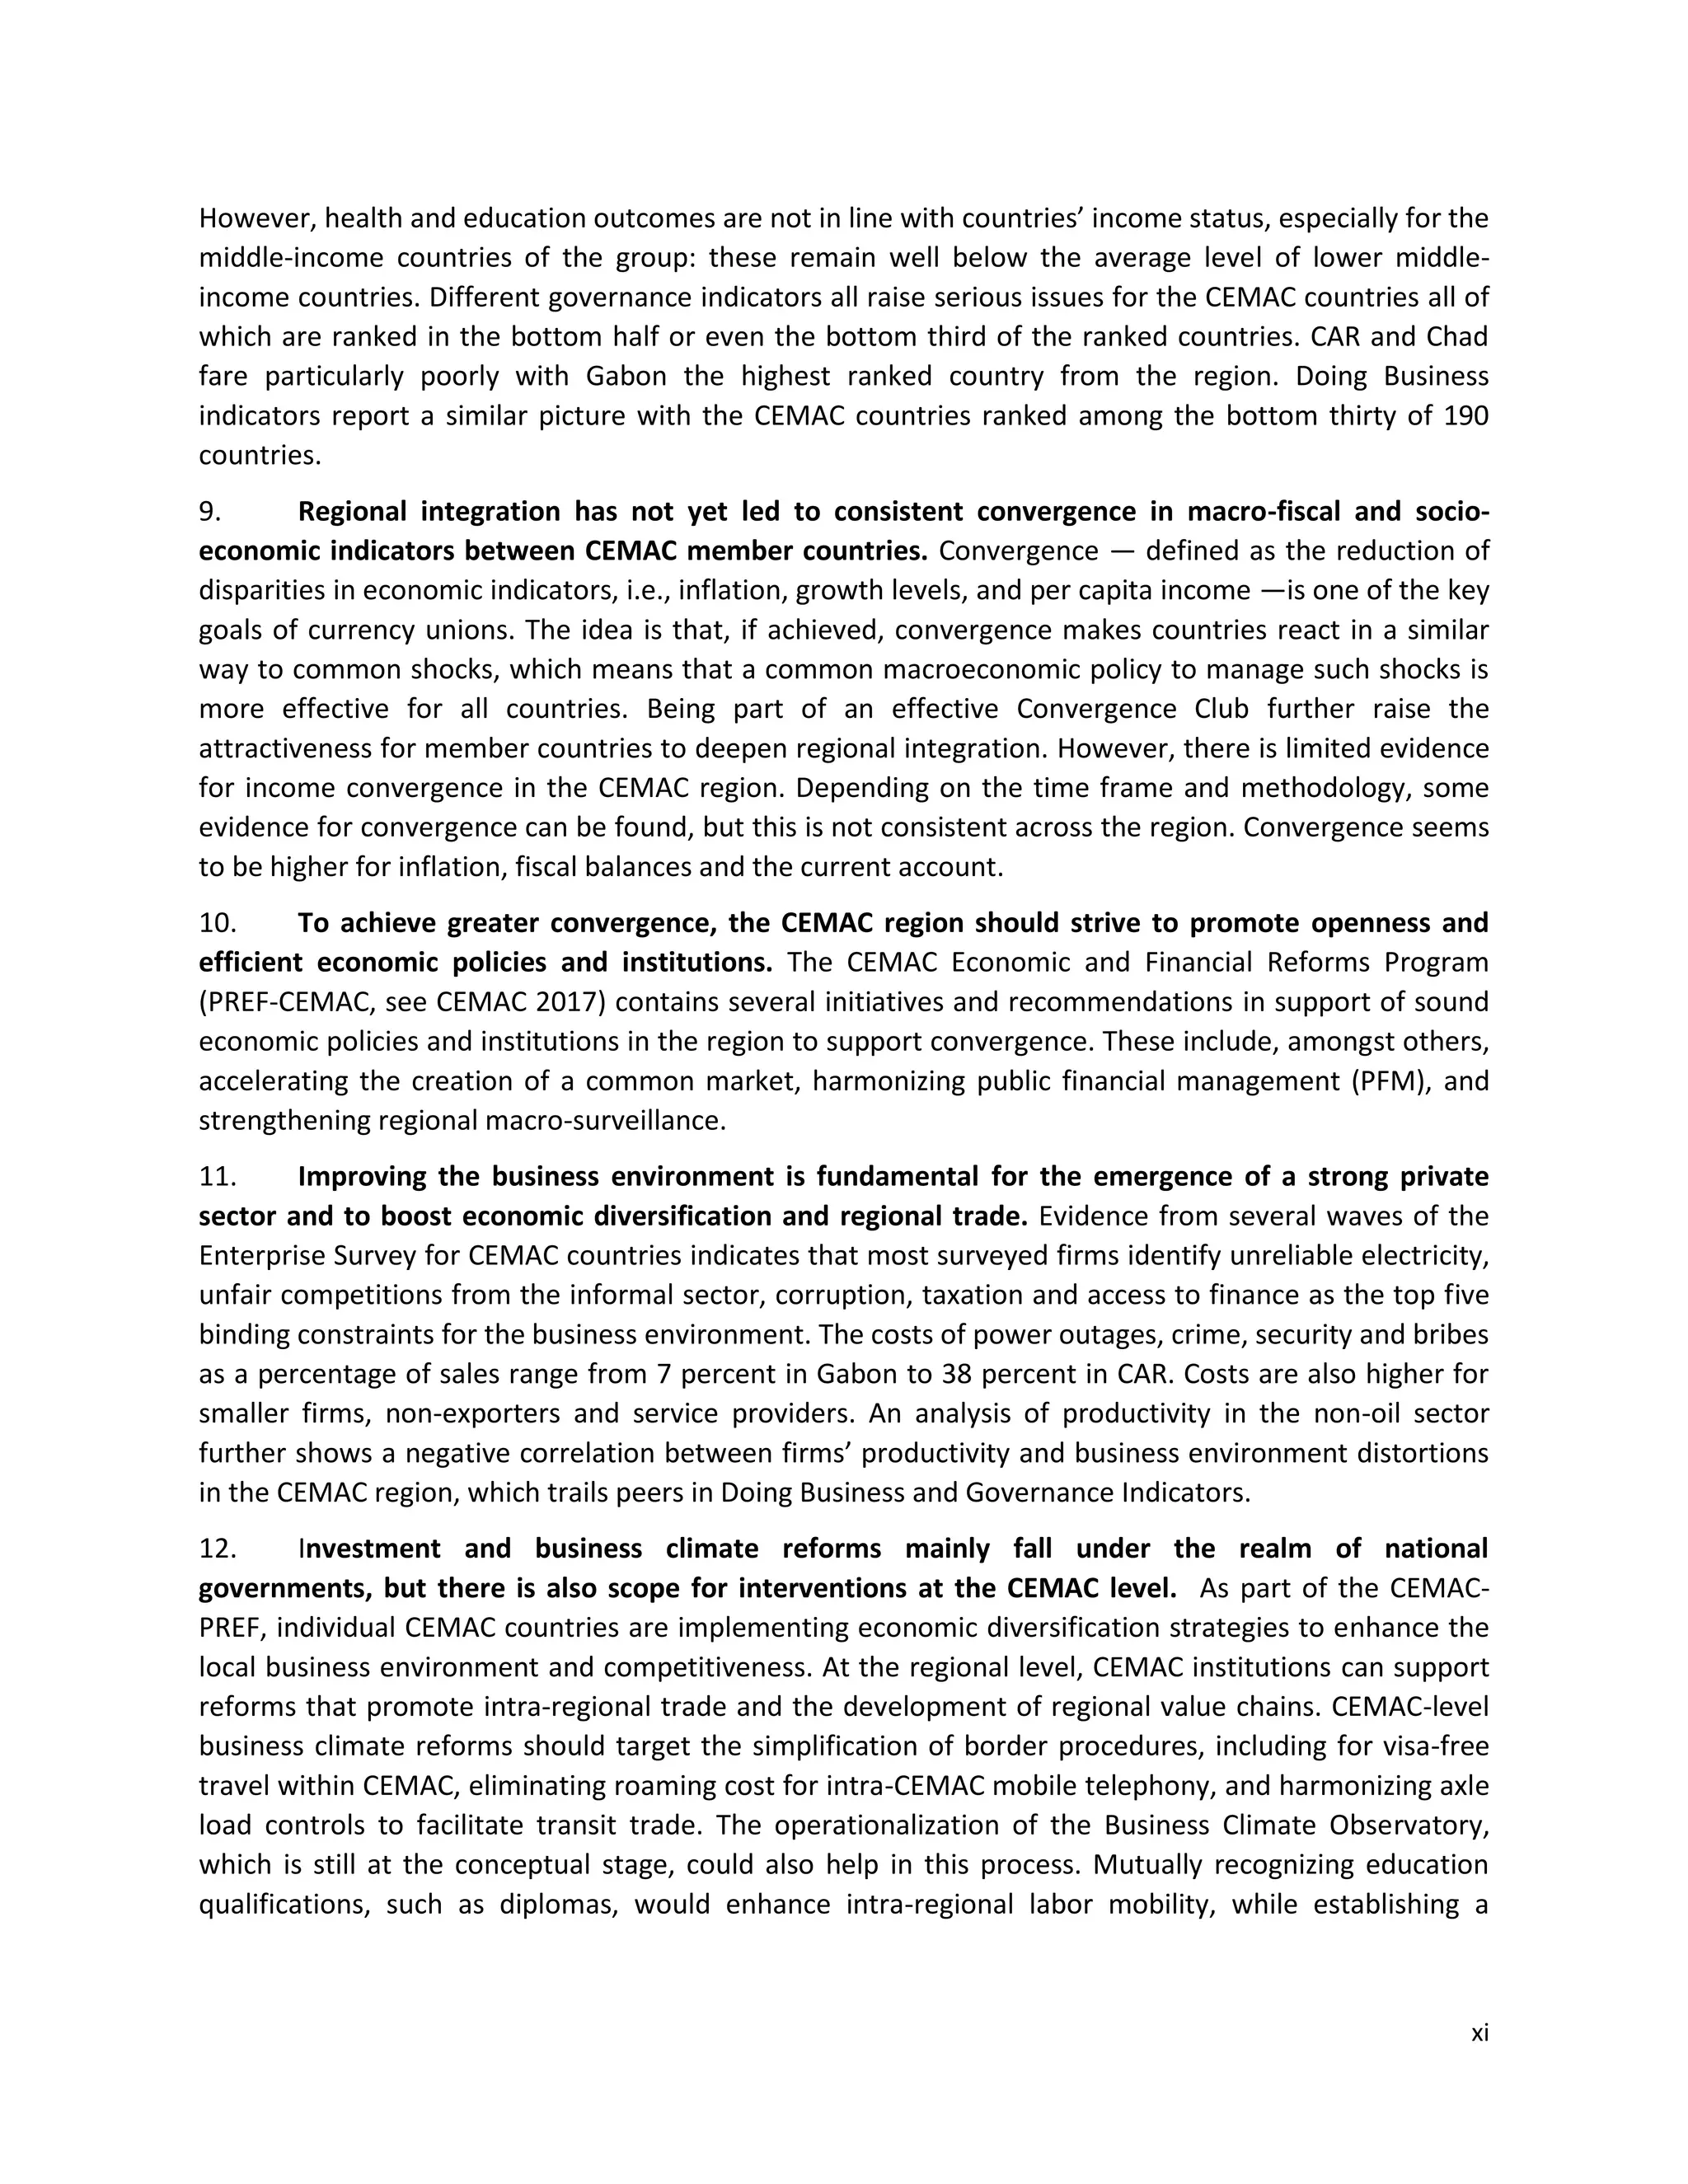
Chapter 2 which identifies unreliable electricity, weak governance and corruption, unfair competitions
from the informal sector, taxation and access to finance as the top five binding constraints for the
CEMAC business environment. While most improvements to the business climate require national policy
reforms, there is also scope for regional interventions to promote regional financial stability and
integration to deepen access to finance (Chapter 3) and to ensure a level playing field for investment
and taxation across CEMAC through a simplified and transparent corporate income tax framework,
countering harmful tax competition, and by strengthening investment into regional supply chains
(Chapter 4). Chapter 5 analyses current trade patterns in CEMAC and explores the role of trade policy in
deepening integration. While CEMAC has a common external tariff, there are significant divergence at
national level. Furthermore, there are significant non-tariff barriers and behind the border restrictions
that prevent intra-regional trade. Non-tariff barriers and non-compliance with CEMAC transit
agreements is particularly visible in regional agricultural trade. This is explored in Chapter 6 which looks
at constraints to agricultural productions and barriers to regional agricultural trade in CEMAC. Chapter 7
complements the analyses in previous chapters by bringing a political economy perspective to regional
integration in CEMAC. It underlines the importance of a political commitment to integrate and
coordinate, but also to comply with regional directives and surveillance.
Recent Developments and Convergence
7. The economy of the CEMAC region has grown substantially in recent decades, but remains
vulnerable to oil price developments. Despite significantly different economic situations, ranging from
low income to upper middle-income countries, five out of six CEMAC countries are oil exporters and
heavily influenced by oil price changes. This was very apparent during the oil price shock of 2014-15,
which severely affected the CEMAC region. As a result, previously high fiscal and external account
balances turned to twin deficits; reserves declined and debt levels, which had been on a continued
downward trend, started to increase.
8. Progress has been made regarding social and governance indicators, but there is significant
room for improvement. Health and education statistics have improved for almost all countries.
xi
However, health and education outcomes are not in line with countries’ income status, especially for the
middle-income countries of the group: these remain well below the average level of lower middle-
income countries. Different governance indicators all raise serious issues for the CEMAC countries all of
which are ranked in the bottom half or even the bottom third of the ranked countries. CAR and Chad
fare particularly poorly with Gabon the highest ranked country from the region. Doing Business
indicators report a similar picture with the CEMAC countries ranked among the bottom thirty of 190
countries.
9. Regional integration has not yet led to consistent convergence in macro-fiscal and socio-
economic indicators between CEMAC member countries. Convergence — defined as the reduction of
disparities in economic indicators, i.e., inflation, growth levels, and per capita income —is one of the key
goals of currency unions. The idea is that, if achieved, convergence makes countries react in a similar
way to common shocks, which means that a common macroeconomic policy to manage such shocks is
more effective for all countries. Being part of an effective Convergence Club further raise the
attractiveness for member countries to deepen regional integration. However, there is limited evidence
for income convergence in the CEMAC region. Depending on the time frame and methodology, some
evidence for convergence can be found, but this is not consistent across the region. Convergence seems
to be higher for inflation, fiscal balances and the current account.
10. To achieve greater convergence, the CEMAC region should strive to promote openness and
efficient economic policies and institutions. The CEMAC Economic and Financial Reforms Program
(PREF-CEMAC, see CEMAC 2017) contains several initiatives and recommendations in support of sound
economic policies and institutions in the region to support convergence. These include, amongst others,
accelerating the creation of a common market, harmonizing public financial management (PFM), and
strengthening regional macro-surveillance.
11. Improving the business environment is fundamental for the emergence of a strong private
sector and to boost economic diversification and regional trade. Evidence from several waves of the
Enterprise Survey for CEMAC countries indicates that most surveyed firms identify unreliable electricity,
unfair competitions from the informal sector, corruption, taxation and access to finance as the top five
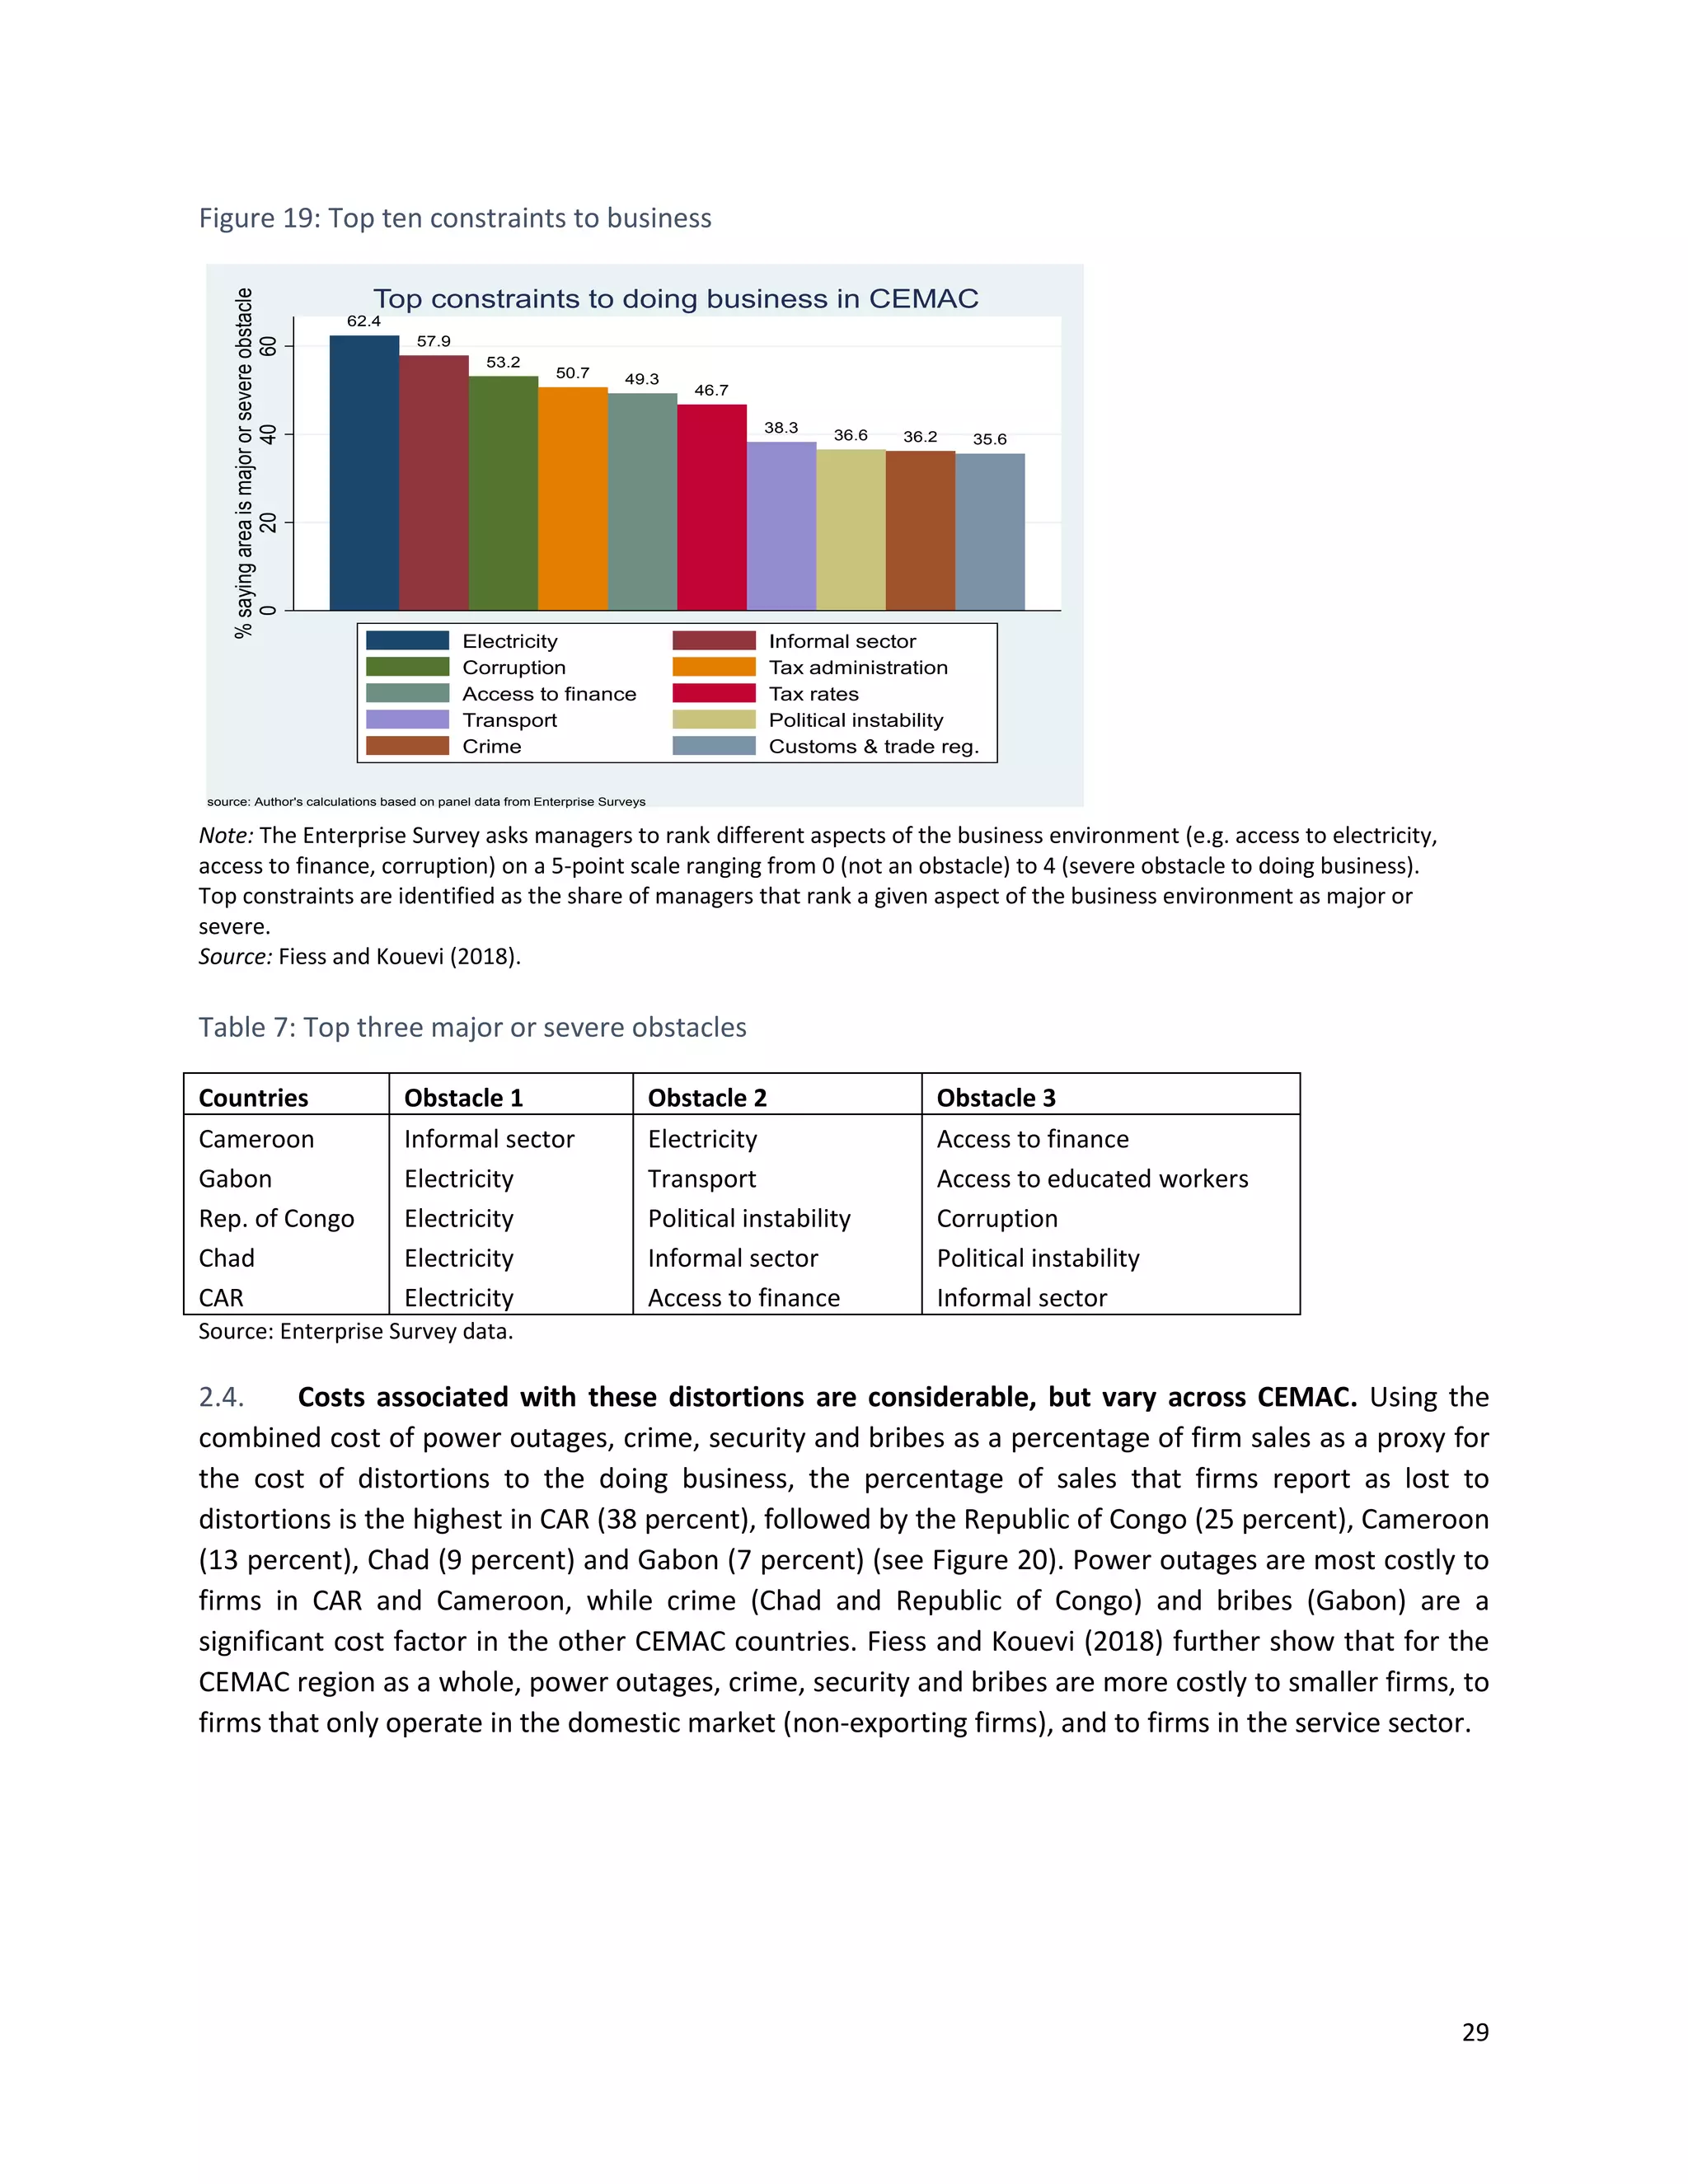
binding constraints for the business environment. The costs of power outages, crime, security and bribes
as a percentage of sales range from 7 percent in Gabon to 38 percent in CAR. Costs are also higher for
smaller firms, non-exporters and service providers. An analysis of productivity in the non-oil sector
further shows a negative correlation between firms’ productivity and business environment distortions
in the CEMAC region, which trails peers in Doing Business and Governance Indicators.
12. Investment and business climate reforms mainly fall under the realm of national
governments, but there is also scope for interventions at the CEMAC level. As part of the CEMAC-
PREF, individual CEMAC countries are implementing economic diversification strategies to enhance the
local business environment and competitiveness. At the regional level, CEMAC institutions can support
reforms that promote intra-regional trade and the development of regional value chains. CEMAC-level
business climate reforms should target the simplification of border procedures, including for visa-free
travel within CEMAC, eliminating roaming cost for intra-CEMAC mobile telephony, and harmonizing axle
load controls to facilitate transit trade. The operationalization of the Business Climate Observatory,
which is still at the conceptual stage, could also help in this process. Mutually recognizing education
qualifications, such as diplomas, would enhance intra-regional labor mobility, while establishing a
xii
CEMAC power pool could support access to reliable electricity, which is one of the main constraint to
private sector development in many CEMAC countries.
13. CEMAC level institution can further support the regional business environment by promoting
regional financial stability and financial integration; leveling the playing field for investment and taxation
across CEMAC; and promoting the free circulation of goods, services and people within the region.
Financial Sector Stability and Access to Finance
14. CEMAC’s financial sector is underdeveloped and access to finance remains a major obstacle to
private sector development. The financial sector remains shallow and mostly bank-based. The depth of
the banking sector is limited and domestic credit to the private sector in the region is low, representing
only 10 percent of GDP. However, the services provided by the financial sector are vital for the success
of the medium-term growth and diversification agenda. Financial deepening and financial sector stability
are an important corner stone for sustainable growth in the sub-region.
15. Regional financial integration in CEMAC also remains underdeveloped. Important progress has
been made with regulating the financial sector at the regional level, but little has been achieved in
facilitating integration of banking markets as regional infrastructure and markets are not sufficiently
developed. Progress on the single banking license, harmonizing parallel legal frameworks for creditor
rights at domestic and regional (OHADA) level, as well as completion of unifying CEMAC’s two parallel
stock exchanges seem important interventions at the regional level.
16. The current economic environment requires effective policy actions by the CEMAC regional
financial institutions to mitigate the impact of the crisis and develop a more resilient and inclusive
financial sector. The BEAC’s Strategic Plan for 2017–2020; the implementation of governance reforms in
the context of the IMF’s safeguards missions; and reforms at COBAC and GABAC to address key banking
sector shortcomings, including related lending, risk concentration and AML/CFT are important measures
in this regard.
17. Monitoring macro-financial risks should be part of regional macro-surveillance. Sub-regional
monetary arrangements, the implementation of a common monetary policy as well as bank regulatory
and supervisory arrangements and the presence of banking groups across the region could be significant
sources of contagion across the sub-region. A regional credit bureau could play an important role in
monitoring interconnected risks. Although none of the banks within CEMAC are currently considered
systemic, and even if banking stress does not lead to a banking crisis, rising NPLs and weakening capital
adequacy will likely restrict financial deepening and prevent the banking sector from becoming an
engine for medium-term growth and economic diversification.
Harmonization of Tax and Investment Codes
18. Tax policies in the CEMAC region are still mostly diverse and uncoordinated and the current
tax structure creates unfair tax competition among member countries. The CEMAC members made
several attempts to improve the structure and coordination of taxes in the region in order to increase
productivity and investment and to achieve the goal of a common market, but the process has been
slow. Some rules to harmonize consumption taxes, investment taxes and international taxes have been
introduced, but exceptions at the national level. Member countries still need tax policies that can lead to
higher efficiency and fewer distortions in their market.
xiii
19. Within a regional integration initiative, harmonizing tax policies and investment codes is
important for avoiding harmful tax competition between jurisdictions. CEMAC has some way to go in
harmonizing taxation and tax exemptions. Even though a regional investment code exists, most member
countries have yet to incorporate it into national legislation; in the context of strengthening regional
supply-chains, the harmonization of taxation, tax exemptions and investment codes is essential. As
many CEMAC countries are engaged in fiscal consolidation, it will be important to ensure that while
efforts to increase taxation are important for fiscal consolidation, reformers should be mindful not to
increase tax competition between jurisdiction.
Intra-regional Trade and Trade Policy
20. Trade within CEMAC remains limited despite a significant regional integration effort. One
objective of regional integration, especially through the creation of a customs union, is the increase in
intra-regional trade flows by eliminating trade barriers. However, this increase in trade has not yet
materialized in the CEMAC region. Exports and imports increased significantly in recent decades, but
recorded trade within the region remains limited. In fact, CEMAC has the lowest percentage of intra-
regional trade recorded for any regionally economic community (REC).
21. Trade policy has an important role to play in deepening integration. Despite a common
external tariff (CET), there is significant divergence at national level. CEMAC countries have established
national tariffs that deviate from the CEMAC CET for several hundred tariff lines. Notable deviations
toward lower tariffs than in the CET include lower duties in Cameroon and Gabon for pharmaceuticals,
and lower tariffs for tin and tin products in all countries except for Chad. Furthermore, while the CET
applies on a most-favorable nation (MFN) basis, bilateral preferences with non-CEMAC parties can
deviate from the CET. Since August 2016, Cameroon has lowered duties on EU imports, but these
bilateral preferences have not been “multi-lateralized” within the community. Thus, Cameroon is
extending preferential tariffs to EU products that face higher CET duty rates in other CEMAC countries.
22. CEMAC’s external tariffs are high when compared internationally. CEMAC’s average CET is 18.1
percent compared to 12.4 percent in ECOWAS. Tariffs are particularly high for certain manufactured
goods (e.g. footwear) and food products. Eliminating the top tariff band of 30 percent and converging to
a tariff schedule with only 4 instead of 5 bands would simplify the tariff regime and lower the average
level of tariff protection to about 14.5 percent. This would reduce import prices for consumers. It would
also reduce the degree of tariff dispersion that would lessen distortions and welfare losses for any given
level of average protection.
23. Beyond tariffs, there are significant non-tariff measures that prevent intra-regional trade. The
CEMAC agreement established a process for the harmonization and mutual recognition of technical
measures certification procedures. This process has not advanced in practice, and standards regimes
tend to differ across CEMAC countries. Data on non-tariff measures (NTMs), which are only available for
Cameroon, indicate that about half of Cameroon’s tariff lines and more than two-thirds of imports are
subject to non-tariff barriers. While some measures serve legitimate purposes (measures for health and
safety), they are often inadequately designed or implemented. A first step towards harmonizing and
streamlining non-tariff barriers within CEMAC require a comprehensive review of existing NTMs which
should assess whether specific NTMs serve legitimate concerns and if they could be replaced with less
distortive measures.
xiv
24. Non-tariff barriers and non-compliance with CEMAC transit agreements is particularly visible
in regional agricultural trade. Field work on transport costs for agricultural goods also show that
corruption is an impediment to regional trade: estimates show that unofficial fees related to bribes and
corruption add around 14 percent to trade costs. Simulations show that a reduction of those fees for
goods transported along CEMAC’s trade corridors would increase intra-regional trade by about 25
percent and add between 1 to 2 percent to the growth rate of CEMAC countries.
25. CEMAC countries should consider negotiating an EPA with the EU as a block. An EPA can
guarantee market access for CEMAC exports in the future and can also serve as an anchor for policy
reform in different areas. Cameroon has ratified the interim EPA and has been liberalizing tariffs on EU
products since August 2016; this has generated tensions with other CEMAC members. It would be
important to assess Cameroon’s experience under the interim EPA, including potential adjustment costs
for sectors affected by import competition. Such an assessment could provide valuable lessons for a
prospective agreement with the CEMAC block to mitigate these costs.
Agriculture and Regional Trade
26. Despite the region’s vast potential for agriculture production and trade, the agriculture sector
in CEMAC remains largely underdeveloped. The oil price shock, prospects for continued low oil prices
and depleting oil resources make a compelling case for economic diversification by reviving agriculture.
Increased investments in agriculture can be a means to increase regional food security, reduce the food
import bill and create jobs for the youth.
27. Agricultural activity in CEMAC faces many constraints, including access to land and finance;
poor rural infrastructure; informality; limited access to improved inputs; insufficient agricultural advisory
services; a high tax and regulatory burden and a high cost of agricultural inputs (seeds, fertilizers, animal
feed). CEMAC’s Common Agriculture Strategy (SAC), adopted in 2003, but not yet implemented,
provides a potential regional framework for economic diversification into agriculture; SAC strives to
improve the regulatory framework for importing agricultural inputs, to adopt regional rules for the trade
of seed and fertilizers, and to reform the regional framework for food safety, quality standards and
product certification.
28. Common standards and harmonization of national and CEMAC policies would benefit regional
trade in agriculture. Within Cameroon, for example, there is no single set of regulations governing
agricultural trade with CEMAC neighbors. Field work also found that official regulations often clash with
border practices. At the CEMAC level, it would be important to reduce border taxes that act as non-tariff
barriers; establish a regional dialogue on SPS declaration requirements; and establish a trade regime for
agricultural products that all governments can follow. The primary political economy obstacle towards
implementing a trade regime for agricultural goods seems to be revenue generation or re-distribution
from border activities. Experience from other trade blocs, including the EU, may be relevant as to how
best to decrease dependency on border taxes.
Political Economy Aspects
29. For regional integration in CEMAC to succeed, the political will for integration needs to go
beyond aspirations that ebb and rise counter-cyclically with oil prices. Regional integration inherently
entails the loss of some sovereignty to the transnational organization. CEMAC member countries often
xv
have seen this as a threat to sovereignty1
, rather than as a necessity to boost trade in an effort to
increase living standards. CEMAC’s national governments have, therefore, often elected to hold fast to
their pre-association independence or to favor national interest over a community agenda. Rivalry over
the location of CEMAC’s stock market, weak enforcement of CEMAC’s regional surveillance framework
and the continued levying of tariff and non-tariff barriers on intra-regional trade reflect insufficient
political will to fully embrace regional integration.
30. Deepening regional integration needs broad political commitment. In the case of Europe,
integration started with the desire to maintain peace in Europe following the devastation of two World
Wars in the first part of the last century. Within CEMAC, push-factors towards deeper regional
integration could come from areas where national and elite interests align and where CEMAC and the
Economic Community of Central African States (ECCAS) can play a supporting role. Such areas could be a
regional response to the threat of overspills for frequent violent conflicts; improving regional food
security; and strengthening sub-regional infrastructure.
Cross-Cutting Policy Issues that Warrant a Regional Response
Policy area Recommendation
Regional Macro-
Surveillance &
Convergence
CEMAC’s regional macro surveillance framework set limits on key
macroeconomic indicators to promote the consistency of national policies with
the sustainability of the common currency. To date there are no sanctions for
non-compliance and enforcement of the framework has not been implemented
consistently. Strengthening regional enforcement by the CEMAC Commission,
including through a mandate for the Commission to validate the data submitted
by national authorities, could significantly increase compliance. Community
regulations on the compilation and provision of regular statistics on economic
and financial data also need to be fully enacted in national legislations. CEMAC
has a harmonized framework for the management of public finances, but the
directives have not been fully transposed into national legislation, nor
implemented. The harmonization of public finance frameworks should be a
regional priority to (i) strengthen regional multilateral surveillance, (ii) promote
financial integration, and (iii) ensure consistency of the monetary union.
Promoting
Economic
Diversification &
Private Sector
Development
Regional initiatives to enhance the business climate should target the
harmonization of tax, investment and trade policies to level the playing field;
avoid harmful competition between member states; and stimulate regional and
global value chains. The operationalization of the Business Climate Observatory,
if adequate private sector participation is assured, could help in this process.
Establishing a CEMAC power pool could ease access to electricity, a key
constraint to private sector development in many countries, while promoting
regional ICT solutions could become an important driver for economic
diversification and cross-border trade; eliminating regional roaming charges
could be a first step. Mutually recognizing professional and educational
qualifications would benefit labor mobility. CEMAC level institution can further
support the regional business environment by promoting regional financial
stability and financial integration.
Deepening Despite an ambitious vision, regional integration in CEMAC remains shallow.
1
https://www.voanews.com/a/central-africa-economic-integration-difficult-after-20-years/1861181.html.
xvi
Regional
Integration
The common external tariff is not effectively utilized and member countries
continue to apply different rates on various products depending on national
interests. Numerous obstacles to the free movement of people and goods also
remain. Sectoral and economic policies are far from being harmonized. Regional
policies should focus on deepening the common market, by: harmonizing
customs exemptions; removing remaining non-tariff barriers; facilitate trade
along trade corridors; implementing the CEMAC transit and customs regime;
and setting and implementing regional standards for border agencies. CEMAC
countries may also want to consider negotiating an EPA with the EU as a block
as an EPA can guarantee market access for CEMAC exports in the future and
can also serve as an anchor for broader policy reforms. Harmonizing integration
policies with ECCAS and other RECs could further set the stage for broadening
integration beyond CEMAC.
1
CHAPTER 1: Economic Developments and Convergence in the CEMAC
Region
A. Introduction
1.1 Economic convergence is both a prerequisite for a successful economic and monetary union
and the outcome of the regional integration process itself. The objectives of regional integration are
increased international trade and improved economic performance and stability through the facilitation
of capital and labor mobility, reduced cost of trade and increased cooperation. The convergence of
countries with low per capita income to richer countries should be enhanced in the context of a regional
integration framework given the liberalization of capital movement among member countries.
1.2 The objective of this chapter is to provide an overview of the economic development, growth
drivers and convergence among the CEMAC member countries. As background, key economic, social
and governance indicators are presented first, followed by an analysis of drivers of growth through the
growth accounting framework. The development of trade linkages between CEMAC countries and the
rest of the world are analyzed, where after the results of different methods to evaluate convergence are
presented.
B. Economic and social indicators
Economic developments show the continued oil dependence of CEMAC countries
1.3 The six CEMAC member countries face different economic and social conditions. According to
their gross national income (GNI) per capita, the country classification ranges from low income countries
(CAR and Chad) to lower middle-income countries (Cameroon and the Republic of Congo) and upper
middle-income countries (Gabon and Equatorial Guinea) for 2017.2
Between 2007 and 2014, Equatorial
Guinea was temporarily classified as high-income country. Out of the total population of 49.5 million in
the CEMAC region in 2016, almost 50 percent live in Cameroon, which has also the largest economy,
another close to 30 percent in Chad with the remaining 4 countries accounting for less than 10 percent
each. Social indicators vary greatly as well, with the landlocked low-income countries CAR and Chad
faring the worst.
2
See Figure A.1 in the appendix for the development of the country specific GNI.
2
Box 1. Monetary and Fiscal Policy in CEMAC
Monetary policy in CEMAC is subordinated to the objective of exchange rate stability of the CFA peg, which is
supported by a monetary cooperation agreement with France that guarantees the convertibility of the CFA franc and
since 1999 the Euro at a given parity; the parity can only be changed after mutual consultations. CFA convertibility is
ensured through an operations account at the French Treasury. CEMAC countries pool their foreign exchange reserves
in the BEAC and a certain share of the reserves (up to 50 percent) must be deposited in the operations account
through which all purchases or sales of foreign currencies or euros against CFA francs are settled. The French Treasury
provides an unlimited overdraft facility through this account, albeit with some institutional safeguards and
restrictions; for instance, BEAC is required to maintain a stock of reserves of at least 20 percent of base money and a
breach over three consecutive months triggers emergency measures.
The monetary policy committee (MPC) formulates policy and manages the pooled foreign exchange reserves. The
MPC relies on a framework of monetary programming to set semi-annual targets on the net international reserve
coverage of the monetary base and of the growth rates of bank credit to the economy and broad money (M2) in each
member state. BEAC also aims to keep the annual inflation rate in the region below 3 percent. Unlike the European
Central Bank, BEAC can extended credit to CEMAC governments when needed. BEAC statutes allow each member
country to draw central bank credit up to a limit of 20 percent of the country’s fiscal revenue in the previous year,
although these statutory advances to governments are being phased out. BEAC does not have an explicit mandate to
provide liquidity assistance (ELA) to illiquid banks under their jurisdiction in a financial crisis.
Bank supervision is conducted at the regional level, but bank resolution involves coordination with the national
authorities concerned. In CEMAC, responsibility for bank supervision lies with the Central African Banking Commission
(COBAC) which was set up in 1993. While the COBAC has the power to withdraw bank licenses, it relies on the
cooperation of national authorities to be effective in dealing with troubled banks. Capital mobility is free in principal
both within CEMAC and between CEMAC and France, but administrative hurdles limit capital mobility in practice.
Fiscal policy and public debt management remain the responsibility of national governments, but they are subject to
regional surveillance by the CEMAC Commissions. CEMAC’s regional macro surveillance framework set limits on key
macroeconomic indicators to promote national policies consistent with the common currency. The regional
convergence framework was initially adopted in 1994 with the objective to prevent excessive fiscal deficits (and deficit
financing) to ensure the sustainability of the peg (IMF, 2009). CEMAC’s regional surveillance framework was refined in
2001, further augmented in 2008, and further revised in 2015. Members with policies that are inconsistent with the
union's objectives are required to adopt adjustment programs to achieve convergence. However, to date there are no
sanctions for noncompliance.
The current regional surveillance framework from 2015, which became effective in January 2017, includes (i) a new
fiscal rule based on a three-year average overall budget deficit; (ii) a public deficit ceiling, reinforced with a debt
brake; (iii) a revised inflation criterion; and (iv) additional secondary criteria. The Commission is also exploring options
to include a budgetary savings mechanism to help build buffers for future commodity shocks. Under the 2002 CEMAC
supra-national framework, pro-cyclical fiscal policy and non-compliance with the convergence criteria has been a
major concern. While the 2017 revised supranational fiscal surveillance framework substantially improves the scope
(buffers), short-term focus, and guidance on corrective fiscal policy actions, the new framework still leaves room for
creative accounting (insufficient data coverage, lack of harmonized definitions and audits of public arrears).
Furthermore, there are no credible monitoring mechanisms or effective sanctions for non-compliance; it is therefore
not clear how effective the new framework will safeguard fiscal and debt sustainability. See Ferdi (2016), Lopez-Calix
and Balima (2017) and IMF (2017) for further details on the new convergence framework.
1 Before 2008, monetary policy in CEMAC was determined by the BEAC’s Board of Directors, assisted at the national level by the
National Monetary Committees chaired by the finance ministers of the member countries. Under the new institutional framework,
responsibility for setting monetary policy in each union now rests with a Monetary Policy Committee chaired by the respective
central bank governor and including members from all member countries plus France (see IMF 2016).
3
Figure 1: CEMAC - Real GDP growth rate, GDP and GNI per capita (1984-2016)
Source: WEO, WDI, author’s calculation
1.4 Five out of six CEMAC countries are oil exporters and are heavily influenced by oil price
changes. Except CAR, all CEMAC countries export petroleum, although Chad (in 2003) and Equatorial
Guinea (in 1991) only more recently joined the ranks of the other three long-standing oil exporters. Even
though the share of oil GDP in total GDP varies and decreased in recent years (see Figure 2 and 3), the
oil price has been an important factor in the economic development of the oil exporting countries (see
Figure 3). This can be seen in the overall GDP development shown in Figure 1. A rapid increase can be
observed after 2000 coinciding with the increased oil production and higher oil prices, bringing average
GDP and GNI per capita to a high level. Similarly, the recent decline in oil prices is reflected in lower
growth rates and declining GDP and GNI per capita.
Figure 2: CEMAC – oil and non-oil GDP shares
(1990-2016), current prices
Figure 3: CEMAC – oil volume, value and price
(1990-2016)
Source: WDI, WEO, author’s calculation; CAR excluded
1.5 Investment levels have been relatively high, mostly driven by private investment. Public
investment levels have increased since 1999 and have averaged about 10.9 percent of GDP over the past
ten years, peaking at 15.0 percent of GDP in 2012 and declining to 9.4 percent of GDP in 2015. Public
investment as share of GDP has been high in Equatorial Guinea and the Republic of Congo and
0
2,000
4,000
6,000
8,000
-10
-5
0
5
10
15
real GDP growth rate (%), WEO
GDP per capita (constant 2010 US$), PPP weighted average
GNI per capita (Atlas, current US$), PPP weighted average
0%
20%
40%
60%
80%
100%
1990
1992
1994
1996
1998
2000
2002
2004
2006
2008
2010
2012
2014
2016
Oil GDP Non-oil GDP
0
50
100
150
0
10
20
30
40
50
1990
1992
1994
1996
1998
2000
2002
2004
2006
2008
2010
2012
2014
2016
Value (US$bn), LHS Volume, LHS
Price (US$/barrel), RHS
4
consistently low in CAR. Private investment levels have increased since 1990, peaking at 25.9 percent of
GDP in 2002 and again at 21.8 percent of GDP in 2014 while declining to 16.8 percent in 2016. Equatorial
Guinea has recorded the highest levels of private investment, while private investment in Chad reached
a peak during 2001 and 2004 (64.5 percent of GDP in 2002), around the time petroleum was discovered
in the country.
1.6 Foreign direct investment (FDI) as share of GDP peaked in the CEMAC region between 2001
and 2004, coinciding with large investments in Chad’s oil sector. FDI peaked at 7.9 percent of GDP in
2002 and has averaged 4.5 percent of GDP thereafter, registering 4.4 percent of GDP in 2016. FDI is
often considered important for industrialization, but Gui-Diby and Renard (2015) show that between
1980 and 2009 FDI did not have a significant impact on the industrialization of 46 African countries. In
the CEMAC region, it can be assumed that FDI was mostly channeled into the petroleum sector or the
exploration and exploitation of other natural resources and has, therefore, not necessarily contributed
to the diversification of the economy.
1.7 Inflation has remained relatively stable over the years. Average inflation (PPP weighted) in the
CEMAC region has been relatively low over the past two decades, following a spike in 1994/1995 after
the devaluation of the CFA franc (Figure 4 and 5). Between 2000 and 2016, inflation averaged only 2.7
percent, but country specific developments, such as the civil war in CAR that started in 2012, cause
temporary divergence. Price stability in CEMAC is largely explained by CEMAC’s monetary policy
framework that consist of a monetary union and CFA fixed currency peg arrangement (see e.g. Patillio et
al. 2008 and Bagnai 2010). Box 1 provides an overview of the monetary and fiscal policy arrangements in
CEMAC.
Figure 4: CEMAC – CPI inflation, annual average
(1984-2000), percent
Source: WEO, author’s calculation
Figure 5: CEMAC – CPI inflation, annual average
(2001-2016), percent
Source: WEO, author’s calculation
1.8 After years of high fiscal and external surpluses, the twin deficits have been widening in
recent years. Driven by high oil prices and production, fiscal and external accounts recorded surpluses
for several years with the exception of CAR. The declining oil prices coupled with high public expenditure
-40
-20
0
20
40
60
80
100
-20
-10
0
10
20
30
40
50
1984 1986 1988 1990 1992 1994 1996 1998 2000
-15
-5
5
15
-15
-5
5
15
2001
2002
2003
2004
2005
2006
2007
2008
2009
2010
2011
2012
2013
2014
2015
2016
Cameroon
Central African Republic
Chad
Congo, Rep.
Gabon
CEMAC (total), weighted by PPP
Equatorial Guines (RHS)
5
led to a significant fall in both the budget balance and the external accounts. The overall budget balance
for the CEMAC region declined from a peak of 18.6 percent of GDP in 2006 to -7.6 percent of GDP in
2016 while the current account balance fell from 9.7 percent of GDP in 2006 to -13.8 percent of GDP in
2016 (see Figure 6 and Figure 7).
Figure 6: CEMAC – Overall fiscal balance as share
of GDP (2000-2016), percent
Figure 7: CEMAC – Current account balance as
share of GDP (2000-2016), percent
Source: WEO, author’s calculation
1.9 A similar development can be observed regarding debt levels and reserves. Given high oil
prices and external and budget surpluses, CEMAC countries accumulated a significant amount of
reserves, reaching US$17.4bn in 2013 before declining drastically to US$4.3bn in 2016. A panel analysis
shows that the level of reserves reacts disproportionally to a variation of oil price (elasticity greater than
1), which makes the region even more susceptible to the negative effect of an oil price decline (World
Bank 2018a). Debt declined substantially during the same time frame, also owing to 4 of the member
countries reaching the HIPC completion point between 2006 and 2015.3
Overall debt in the CEMAC
region as share of total CEMAC GDP was only 17.8 percent in 2010. Due to budget and current account
deficits and the resulting financing needs, debt has been rising again since 2011.
1.10 Reflecting higher oil prices, the economic outlook has slightly improved for the CEMAC region.
Growth has remained close to zero in 2017, but is projected to pick up to about 1.6 percent in 2018,
largely due to increased oil production and moderately higher non-oil growth. The current account
balance has also started to improve in 2017, but debt levels are expected to increase further. Monetary
conditions remain tight, with broad money and credit to the private sector both contracting, but
reserves have improved slightly in 2017 (World Bank 2018b).
3
Cameroon in 2006, CAR in 2009, the Republic of Congo in 2010 and Chad in 2015.
-30
-20
-10
0
10
20
30
2000
2001
2002
2003
2004
2005
2006
2007
2008
2009
2010
2011
2012
2013
2014
2015
2016
-100
-50
0
50
-20
-10
0
10
20
30
2000 2002 2004 2006 2008 2010 2012 2014 2016
Cameroon Central African Republic
Gabon CEMAC (total)
Chad (RHS) Congo, Rep. (RHS)
Equatorial Guines (RHS)
6
Figure 8: Total reserve assets, US$ billion (2001-
2016)
Figure 9: Gross total debt as share of total CEMAC
GDP (2000-2016)
Source: WEO, author’s calculation
Table 1: Overview of economic indicators for CEMAC region
Averages
(percent of GDP, unless otherwise indicated) 1984-2016 1984-93 1994-99 2000-09 2010-16
Real sector
Real GDP growth (%) 3.5 1.1 3.6 6.4 2.8
Oil (%) 5.8 10.5 5.5 6.8 -2.0
Non-oil (%) 4.5 4.0 3.0 6.4 4.0
Real GDP per capita growth (%) 1.4 -1.2 3.5 5.5 -2.7
Real GDP per capita (USD 2010), PPP weighted average 4,608 3,858 4,033 5,121 5,440
Consumer price inflation (%), PPP weighted average 3.4 1.6 8.3 2.9 2.4
External sector
Exports of goods and services 32.2 n/a 22.1 45.1 44.3
Imports of goods and services 28.5 n/a 22.8 34.5 39.6
Current account balance -2.4 n/a -3.7 0.6 -3.5
Fiscal sector
Total revenue 15.5 n/a 11.8 24.2 22.9
Total expenditure (general government) 15.4 n/a 13.5 18.9 25.8
Primary fiscal balance 1.6 -1.0 0.9 7.4 -2.2
Overall fiscal balance 0.1 -2.0 -1.7 5.3 -2.9
Investment
Public investment 5.0 0.6 3.1 5.9 11.8
Private investment 15.3 4.2 18.5 22.1 20.3
Source: WDI, WEO, author’s calculation
0
4
8
12
16
2001
2002
2003
2004
2005
2006
2007
2008
2009
2010
2011
2012
2013
2014
2015
2016
US$billion
Cameroon CAR
Chad Congo, Rep.
Equatorial Guinea Gabon
0
20
40
60
80
100
2000
2001
2002
2003
2004
2005
2006
2007
2008
2009
2010
2011
2012
2013
2014
2015
2016
percent
Cameroon CAR
Chad Congo, Rep.
Equatorial Guinea Gabon
7
Social indicators lag behind middle-income countries
1.11 The CEMAC region has made progress in social areas, but much remains to be done. The UNDP
Human Development Index (HDI) shows improvements for all countries relative to previous years
(Figure 10). However, worldwide, CAR and Chad are ranked as number 188 and 186, respectively, out of
188 countries. The other countries fare slightly better, but all remain in the bottom half of the ranking
(Cameroon 153rd
, the Republic of Congo and Equatorial Guinea 135th
, Gabon 109th
).
Figure 10: Human Development Index
Source: UNDP
1.12 Similarly, health and education statistics have improved, but remain below the level of lower
middle-income countries. Figure 11 shows that school enrolment rates improved and infant mortality
rates declines in the last decades. However, enrolment levels remain worse than those of middle-
income countries and for the case of infant mortality even higher than the Sub-Saharan African average.
This is not in line with the income classification of some of the CEMAC members, such as Equatorial
Guinea or Gabon, which are classified as upper middle-income countries. Developments for the
individual countries are given in Table A.1 in the annex.
Figure 11: Education and health statistics
Source: WDI, author’s calculation
0.0
0.1
0.2
0.3
0.4
0.5
0.6
0.7
1990
2000
2010
2015
0
40
80
120
1980-1989 1990-1999 2000-2009 2010-2015
percent
Gross primary school enrolment rate (%)
CEMAC average (weighted by population)
Sub-Saharan Africa
Lower middle income
Upper middle income
0
40
80
120
1980-1989 1990-1999 2000-2009 2010-2015
percent
Infant mortality (per 1,000 live births)
CEMAC average (weighted by population)
Sub-Saharan Africa
Lower middle income
Upper middle income
8
Governance and Doing Business indicators show a difficult operating environment
1.13 The CEMAC countries have some of the most difficult business operating environments in the
world. According to the Doing Business 2018 report, the CEMAC countries were ranked among the
bottom thirty of 190 countries in 2017 regarding the ease of doing business, showing only slight
improvements for some countries compared to 2016 (see Table 2). The rankings are particularly poor
when compared to the respective income group, Gabon and Equatorial Guinea, for example, are ranked
47th
and 49th
in a sample of 51 upper middle-income countries. Figure 12 shows country’s Doing
Business profiles by DB categories.
Table 2: Ease of Doing Business indicator - CEMAC
Country
Ease of doing business ranking (out of 190)
DB 2018 DB 2017
Cameroon 163 166
CAR 184 185
Chad 180 180
Republic of Congo 179 177
Equatorial Guinea 173 178
Gabon 167 154
Source: World Bank (2017 and 2016)
Figure 12: Doing Business 2018 report - categories
Source: World Bank (2017)
1.14 Governance indicators also show substantial room for improvement. According to the Ibrahim
Index of African Governance for 2016, all six CEMAC member countries are ranked in the bottom half of
the 54 African countries that were evaluated, see Table 3. CAR fared worst with rank 52 out of 54
countries and Gabon best with rank 32. The Ibrahim Index furthermore constructs an overall governance
index out of several sub-categories, which is then normalized between 0 and 100. Figure 13 shows the
development of the overall index, which has generally been improving for most of the CEMAC countries;
CAR is the exception due to the civil war that started in 2012. The sub-categories, given in Figure 14,
0
50
100
150
200
Starting a Business
Dealing with Construction
Permits
Getting Electricity
Registering Property
Getting Credit
Protecting Minority Investors
Paying Taxes
Trading across Borders
Enforcing Contracts
Resolving Insolvency
Gabon Cameroon
Congo, Rep Equatorial Guinea
Chad Central African Republic
9
show substantial differences between the different countries, with generally low values for CAR, but
also Chad and Equatorial Guinea. These developments are confirmed by the World Bank governance
indicators, given in Figure A.2 in the annex, which show particularly low values for CAR, Chad and
Equatorial Guinea. According to the Corruption Perception Index (Transparency International 2017),
corruption can be considered a significant obstacle in most of the CEMAC countries and the Economic
Freedom Index (Miller and Kim 2017) categorizes Cameroon, CAR and Gabon as mostly unfree and Chad,
the Republic of Congo and Equatorial Guinea as repressed.
Table 3: Summary of governance indicators - CEMAC
Country Ibrahim Index Rank
2016
(out of 54)
Corruption Perception Index
Rank 2016
(out of 176)
Economic Freedom Index
Rank 2017
(out of 180)
Cameroon 38 145 150
CAR 52 159 151
Chad 48 159 162
Republic of Congo 42 159 177
Equatorial Guinea 47 no data 174
Gabon 32 101 103
Source: Mo Ibrahim Foundation (2016), Transparency International (2017) and Miller and Kim (2017).
Figure 13: Ibrahim Index – overall governance
index
Figure 14: Ibrahim Index – sub-categories (2015)
Source: Mo Ibrahim Foundation (2016); scores range from 0 to 100 with 100 being the best possible score.
1.15 Compared to the CEMAC region, the WAEMU region fares better in terms of governance
indicators. While all countries in the CEMAC region are in the bottom half of the countries ranked by the
Ibrahim Index of African Governance for 2016, WAEMU countries except for Guinea-Bissau and Togo are
ranked in the top half. In contrast to the CEMAC countries, no WAEMU country is classified as
“repressed” according to the Economic Freedom Index (Miller and Kim 2017), but as “mostly unfree”, or,
in the case of Cote d’Ivoire as “moderately free”. Similarly, WAEMU countries tend to fare better
according to the Corruption Perception Index (Transparency International 2017), although Guinea-Bissau
is ranked worse than the CEMAC countries.
20
70
2000
2001
2002
2003
2004
2005
2006
2007
2008
2009
2010
2011
2012
2013
2014
2015
Cameroon Central African Republic
Chad Congo
Equatorial Guinea Gabon
0
10
20
30
40
50
60
Safety & Rule
of Law
Participation &
Human Rights
Sustainable
Economic
Opportunity
Human
Development
Cameroon Central African Republic
Chad Congo
Equatorial Guinea Gabon
10
Table 4: Summary of governance indicators - WAEMU
Country Ibrahim Index Rank
2016
(out of 54)
Corruption Perception Index
Rank 2016
(out of 176)
Economic Freedom Index
Rank 2017
(out of 180)
Benin 16 95 96
Burkina Faso 23 72 93
Cote d’Ivoire 21 108 75
Guinea-Bissau 44 168 119
Mali 25 116 102
Niger 27 101 154
Senegal 10 64 120
Togo 33 116 138
Source: Mo Ibrahim Foundation (2016), Transparency International (2017) and Miller and Kim (2017).
Physical capital has been the main driver of growth
1.16 The growth accounting framework is used to analyze the contribution of physical capital and
total factor productivity (TFP) to GDP growth. This analysis is done in two steps. First, a Cobb-Douglas
production function is estimated to determine the long-term relationship between GDP growth and the
development of physical capital.4
In a second step, the estimated elasticity between capital and output
is used to decompose GDP growth into contributions of physical capital and a residual component,
capturing changes in TFP as well as other factors such as external shocks, effects of war or institutional
change.5
This decomposition of output growth is carried out for different time periods, the results are
given in Table 5.
Table 5: Contribution of TFP and physical capital per worker to GDP per worker (in percent)
Components
Time period
Growth rate of real
GDP per worker
Growth rate of real physical
capital per worker
Growth rate
of TFP
1982-1990 2.7 2.2 0.5
1991-1994 -3.6 -1.4 -2.2
1995-2000 1.1 0.3 1.4
2001-2005 4.8 1.0 3.8
2006-2010 0.6 1.0 -0.5
2011-2015 0.5 1.2 -0.7
1982-2015 1.4 0.9 0.5
Source: WDI, author’s calculation
1.17 The results show that over the entire period (1982-2015), physical capital has contributed
more to output growth than changes in TFP. The difference is most pronounced in the early period of
4
The estimated elasticity of output per worker with respect to capital per worker for the time period 1981-2015 is
0.37, implying that a one percent increase in physical capital per worker leads to a 0.37 percent increase in GDP
per worker. The coefficient is significant and falls within the range of values found in the literature for comparable
countries (see e.g. Bosworth et al. (1995), Sacerdoti et al. (1998) or Tahari et al. (2004)).
5
The growth rate of real GDP per worker is decomposed into the contribution of real physical capital per worker
growth and changes in TFP (The decomposition is done according to the following equation: Δ𝑦𝑡 = 0.37Δ𝑘 𝑡 +
Δ𝑇𝐹𝑃𝑡. See Ghosh and Kraay (2000) or Akitoby and Cinyabuguma (2004) for a similar application of the growth
accounting methodology). Due to the specification of the long-run relationship, including only physical capital per
worker as explanatory variable, TFP is treated as residual component and captures not only changes in factor
productivity, but, as mentioned above, for example institutional changes and the effects of civil unrest.
11
1982 to 1990, most likely due to the large contribution of oil production, which is highly capital
intensive, to growth. The following period pre-devaluation period (1990-1994) saw a declining of real
physical capital and TFP. A small recovery was recorded between 1995 and 2000, the post-devaluation
period, which also included e.g. political instability in the Republic of Congo. Between 2001 and 2005,
TFP increased again, linked to high TFP growth in Chad due to the discovery of petroleum, whereas the
following period was characterized by declining TFP.
External factors and structural improvements have been important growth determinants
1.18 This section investigates the fundamental determinants of economic growth in CEMAC
countries during 2000-2016. It examines whether, and to what extent, per capita growth can be traced
to structural factors (infrastructure, financial intermediation, trade, education, government size,
institutions), stabilization policies (inflation, exchange rate misalignment), and external conditions
(terms of trade, export commodity prices). Infrastructure development is proxied by a composite index
constructed as a weighted average of three individual indices measuring progress in power generation
capacity, roads, and phone lines. Human capital is controlled for by secondary school enrolment. The
trade-to-GDP ratio is included to capture the growth impact of openness to international trade.
Government consumption (percent of GDP) serves as a measure of government size. Institutional quality
is proxied by the Polity index. The analysis is performed by applying a regression model developed to
explain long-term growth elsewhere (see Haile and Moller (2018)).6
1.19 Growth predictions are made by combining cross-country estimates of the growth impact of
the above-mentioned determinants and country-specific values of the variables for 2000-2016. CEMAC
countries7
have registered respectable growth rates since 2000, notwithstanding substantial variations
across countries and over time. Chad stands out comparatively, with average per capita growth rates of
about 3.8 percent and 3.4 percent, respectively. Cameroon and the Republic of Congo grew at a
relatively slower pace, averaging 1-1.5 percent over 2000-2016. By contrast, CAR and Gabon have
experienced negative average per capita growth rates over the same period (Figure 15).
1.20 Economic growth in CEMAC countries between 2000 and 2016 was primarily driven by
external factors and structural improvements. Structural factors accounted for roughly 0.6 to 1.1
percentage points (ppts) of growth per capita in Chad, Cameroon, and the Republic of Congo –
approximately 20-30 percent of the overall (predicted) growth over 2000-2016. This generally reflects
the progress these countries have made, albeit still limited, in deep domestic growth factors, such as
infrastructure. By contrast, the contribution of structural factors was much smaller in CAR and negative
in Gabon.
1.21 Within structural factors, infrastructure played a relatively significant role in Cameroon and
Chad, while the rest of the CEMAC countries experienced only modest improvements (Figure 16).
Infrastructure contributed roughly 0.35 ppts and 0.26 ppts in Cameroon and Chad, accounting for about
23 percent and 7 percent of growth per capita, respectively. Cameroon has experienced the largest
6
The empirical analysis mainly uses the cross-country growth regression model in Brueckner (2014). See also
Moller and Wacker (2017) and Araujo et al. (2014), and Haile (2016) for applications in the context of Ethiopia,
Latin America, and Tanzania, respectively.
7
The analysis could not be done for Equatorial Guinea given data on the key infrastructure indicators were
missing.
12
growth contribution due to infrastructure, reflecting the country’s large public investment projects in
recent years, albeit at the expense of increase fiscal deficits and debt burden. In contrast, the growth
contribution of infrastructure in other CEMAC countries remained insignificant, which is consistent with
the fact that CEMAC countries, like most SSA economies, saw only limited progress in improving the
quantity and quality of infrastructure, notably power and transport, over the past two decades. Among
CEMAC countries, only Gabon has witnessed a slight deterioration in the infrastructure indicators under
consideration.
Figure 15. Key growth drivers in CEMAC (2000-2016)
Source: Haile and Moller (2018)
1.22 External tailwinds were among the key contributors to growth in CEMAC over 2000-2016.
External factors accounted for roughly 1.3 ppts, 0.48 ppts, and 0.4 ppts of the growth per capita in Chad,
the Republic of Congo and Cameroon. External developments also contributed significantly to the
modest growth in the rest of the CEMAC countries except CAR. Compared to the 1990s, CEMAC’s
growth in the 2000s and early 2010s was propped up by external tailwinds and particularly by the
demand-driven upsurge in global commodity prices, notably oil prices, that started in the early 2000s
and lasted more than a decade – often dubbed commodity price “super-cycle”. In general, the large
contribution of external factors comes as no big surprise given most of these countries have had high
dependence on a single commodity, namely oil. The share of oil exports in total export revenue ranges
from about 75 percent in Chad to 85 percent in the Republic of Congo. Cameroon has a relatively more
diversified economy, with oil accounting for 30-40 percent of export revenue. Similarly, fiscal oil revenue
represents 40-80 percent of total fiscal revenues in CEMAC countries, although somewhat lower for
Cameroon.
1.23 Relatively prudent stabilization policies provided some growth impetus in CEMAC economies.
Growth in the CEMAC zone coincided with relatively sound macroeconomic management,
-1.0
-0.5
0.0
0.5
1.0
1.5
2.0
2.5
3.0
3.5
4.0
AnnualizedGDPp.c.growth(in%)
Persistence Structural
Stabilization External
Residual (unexplained growth)
13
notwithstanding the large fiscal imbalances over the past few years driven by the sharp decline in oil
revenue. CEMAC countries have generally achieved stronger outcomes than other SSA regions, apart
from WAEMU, with inflation remaining low at less than 3 percent and the real effective exchange rate
broadly in line with fundamentals. Recently adopted CEMAC convergence criteria have helped anchor
fiscal policy to reduce fiscal excesses and foster financial stability. However, the oil price shock in recent
years has resulted in large external imbalances in most CEMAC countries.
Figure 16. Structural drivers of growth in CEMAC, WAEMU and SSA
Source: Haile and Moller (2018)
1.24 Unlike WAEMU countries, growth in CEMAC economies was more driven by external factors
(high oil prices) while financial deepening played a much smaller role. CEMAC’s experience contrasts
with those of non-resource-intensive countries where growth was high in recent years (averaging more
than 6 percent in 2011-2017) driven by infrastructure investment and financial deepening. In contrast to
the sharp credit growth WAEMU countries experienced since the early 2010s, the CEMAC region saw
only modest expansion in private sector credit, despite variations across countries. Unlike the average
SSA economy, CEMAC countries generally experienced limited improvements in key infrastructure. The
growth contribution of trade in some CEMAC economies is larger than those for the average WAEMU
and SSA countries. However, the contribution of education in CEMAC was smaller than in WAEMU and
SSA.
C. Trade linkages have changed significantly over time
1.25 Exports and imports increased significantly in the last decades. Exports went from an average
of US$4.8bn in the 1980s, 29.4 percent of GDP, to an average of US$37.7bn between 2010 and 2016,
44.9 percent of GDP (see the chapter on trade analysis and policy for more graphs and details). This was
mostly driven by increased export earnings from the Republic of Congo, Gabon and Equatorial Guinea
due to high oil volumes and prices. Imports increased substantially as well from an average of US$2.7bn
-0.4
-0.2
0.0
0.2
0.4
0.6
0.8
1.0
1.2
AnnualizedGDPp.c.growth(in%)
Schooling Credit/GDP Trade/GDP
Gov Cons./GDP Infrastructure
14
in the 1980s, 16.2 percent of GDP, to an average of US$17.1bn between 2010 and 2016, 19.9 percent of
GDP. The largest increases were seen by Cameroon, the Republic of Congo and Gabon.
1.26 However, despite integration efforts, trade within the CEMAC region remains limited. The
share of exports from the CEMAC region to Sub-Saharan Africa overall has not changed substantially
since 1984, averaging about 2.1 percent of total exports. Only 1.6 percent of total exports from CEMAC
countries went to another CEMAC member country between 1984 and 2015, which is 53.5 percent of all
exports from CEMAC countries to Sub-Saharan Africa. The bulk is exported to Europe and Central Asia
with an increasing share to East Asia and the Pacific, particularly China. The importance of France as
export destination has decreased significantly from an average of 26.3 percent of total exports in the
1980s to an average of 5.2 percent between 2010 and 2016. A small increase in international trade can
be seen after the devaluation in 1994.
1.27 Exports are dominated by natural resources with limited added value, while the CEMAC
countries could potentially be able to produce some of the main imports within their respective
country. The main export commodity of the CEMAC members is crude petroleum followed by other
primary commodities, such as industrial diamonds, raw cotton, raw cocoa beans and aluminum and
products that require limited manufacturing, such as saw-logs or other wood products. On the import
side, processed food (e.g. rice, frozen fish and poultry), medicaments and machinery and specialized
vehicles rank high.
D. Exchange rate developments
1.28 The CFA fixed exchange rate arrangement has provided a stable environment for the CEMAC
region. There is a long tradition in the economics literature which recognizes that macroeconomic
performance can be enhanced by having a fixed exchange rate and particularly a fixed regime that
allows a small open economy to buy into the credibility of another currency. There is little doubt that
the existence of the CFA has given participating countries macroeconomic stability by facilitating the
control of inflation through buying into the monetary credibility of the French franc/euro.
1.29 However, CEMAC has recently come under pressure to reform, also in terms of the CFA fixed
exchange rate arrangement against the euro. Due to exchange rate misalignment in CEMAC after 2007,
the CEMAC countries real non-oil GDP growth has been relatively stagnant and their performance has
lagged that of oil exporting countries without conventional exchange rate pegs (see, for example, IMF
2016). Changing trade patterns; the decline in oil prices; and stagnant non-oil growth have raised a
debate on the best way to improve economic growth in these countries. It could be a question of
moving to a different exchange rate arrangement, as some have argued (see Nubukpo et al. 2016), or
there may be underlying structural issues in the economies that need to be addressed. In addition, there
may be structural and exchange rate misalignment issues at play.
1.30 In this section, the potential degree of exchange rate misalignment is assessed on the bases of
a behavioral real effective exchange rate model (BEER). The BEER approach is not based on any specific
exchange rate model and therefore may be regarded as a very general approach to modelling
equilibrium exchange rates. The BEER produces measures of exchange rate misalignment which are free
of any normative elements and one in which the exchange rate relationship is subject to rigorous
15
statistical testing. The BEER approach here is implemented using the multivariate cointegration methods
of Johansen (1995).8
The results indicate limited misalignment
1.31 The plots of the estimated BEERs alongside the actual real effective exchange rates (REER) are
presented thereby demonstrating any implied misalignment for a country. To aid in the interpretation of
the latter, a simple HP adjusted version of the BEER is also presented to provide a smoother plot of the
estimated equilibrium exchange rate. All the plots discussed here rely on estimates generated using the
period 1995 to 2015; the REER is assessed as overvalued if it exceeds that of the BEER.
8
The full set of results are provided in Fiess and MacDonald (2018).
16
Box 2. Exchange rate regime and economic outcomes for the CFA zone – a brief review of the literature.
There seems to be broad consensus that the monetary union had a positive impact in terms of price stability and
fiscal outcomes. Studies show that the monetary union has contributed positively to price stability in the region
(Agbor 2012, Pattillo et al. 2008, Bagnai 2010). Coulibaly and Davis (2013) find that inflation rates have been 1.5-2.5
percentage points lower in the CFA zone than in other Sub-Saharan African countries. IMF (2016) confirms lower
inflation and better fiscal outcomes for hard pegs in Sub-Saharan Africa for the 1980-2014 period.
Evidence of exchange rate regime / exchange rate misalignment on growth and income convergence is more
mixed. Coulibaly and Davis (2013) find no significant growth differential between the CFA zone and other Sub-
Saharan African countries between 1994 and 2009. The IMF (2016) find that countries with more flexible exchange
rates regimes have since 2000 experienced per capita growth rates that were 1-2 percentage points higher than
those of their counterparts. It is worth pointing out that prior to 2000 there were no significant differences between
growth performance and exchange rate regimes and even during the more recent period several countries with hard
pegs in SSA have registered sizable real per capita growth rates (for example, during 2000–14 Burkina Faso grew at
an annual rate of 2.7 percent, Chad at 5 percent, and the Republic of Congo at 1.9 percent) and even higher growth
rates for shorter durations (such as the ongoing growth surge in Cote d’Ivoire). Grekou (2015) argues that the
relationship between exchange rate undervaluation and growth needs to account for debt dynamics. Analyzing data
from 1985 to 2011 for the CFA zone, he finds that during periods of undervaluation competitiveness gains have been
offset by a negative impact on growth from a higher foreign currency value of debt. The striking difference in non-oil
growth and per capita GDP performance since 2013 between WAEMU and CEMAC, despite sharing the same fixed
exchange rate regime, also seems to suggest that structural factors beyond the exchange regime seem to be at play.
1.1
Figure 1: Comparative assessment of CEMAC's real non-oil GDP
growth (%)
Figure 2: Comparative assessment of CEMAC's real per capita
GDP growth (%)
Source: Authors’ calculation based on WEO. Exchange rate regime classification follows IMF de jure classification. All series are
GDP weighted.
-2
0
2
4
6
8
10
12
14
16
2007 2008 2009 2010 2011 2012 2013 2014 2015 2016 2017
Oil-exporting Countries (SSA)
CEMAC
WAEMU
SSA without conventional exchange rate peg
-6
-4
-2
0
2
4
6
8
2007 2008 2009 2010 2011 2012 2013 2014 2015 2016 2017
17
1.32 The results for Cameroon in Figure A.3 in the annex show a variety of misalignment regimes
over the sample period and a very clear pattern of overvaluation post 2013. At its peak in 2014 the
extent of overvaluation is approximately 7 percent. This would not be regarded as a dramatic
overvaluation and indeed is an amount which would in all likelihood be wiped out due to standard
sampling error. In this regard, it is noteworthy that the actual real exchange rate post 2014 has already
started to depreciate towards the BEER estimate.
1.33 The results for the Central African Republic (CAR), the only non-oil producer in CEMAC, are
given in Figure A.4 in the annex and show that, with exception of a short period post 2013, the currency
is undervalued by approximately 5 percent and it is noteworthy that this has been the pattern since
1999. Again, though, this size of misalignment is probably not statistically significant and would not
signal a serious issue with the exchange rate regime.
1.34 Figure A.5 in the annex reports the results for Chad and this indicates a clear pattern of
overvaluation post 2011. Given that the graphics for Chad show a variable picture over the full sample
period, the smoothed BEER picture shows a large degree of overvaluation in the post 2011 period,
running at approximately 6 percent, on average. Whereas the actual BEER estimates imply a smaller
average overvaluation of around 3 percent.
1.35 Consistent with the other oil producers, the results for Equatorial Guinea in Figure A.6 in the
annex show a persistent overvaluation of the REER, post 2011. Although there is clear evidence of a
reversion of the REER towards the BEER post 2014, it would seem to be chasing a moving target in that
the BEER is on a straight downward trend post 2011; this is perhaps clearest for the HP adjusted BEER
which shows a quite dramatic overvaluation end of sample of approximately 40 percent.9
This is clearly
of a different order to the other overvaluations and is perhaps suggestive of the requirement of a
regime change, in contrast to the other countries.
1.36 The REER based misalignment for Gabon, shown in Figure A.7 in the annex, is quite variable over
the full sample switching from undervaluation at the start to overvaluation with an overvaluation being
the pattern from 2013 (based on the HP BEER) until the sample end. As in the case of EQ the actual REER
seems to be correcting post 2014 in that it is on a downward trajectory, although the estimated BEER is
also on a sharp downward trajectory too, and it is unclear at the time of writing what the final outcome
will be. The approximate overvaluation in 2015 is 14 percent for the Gabon REER which is again
significantly more than some of the other countries.
1.37 The REER misalignment for the Republic of Congo, Figure A.8 in the annex, is again quite
variable over the full sample period with a degree of overvaluation opening up at the end of the sample,
post 2012, and as in the last two countries there is a downward trend for both the REER and the BEER,
creating uncertainty regarding the timing of any correction. The end-point overvaluation for the
Republic of Congo REER is approximately 10 percent in 2015.
1.38 The current valuation of the currency does not justify a short-term move to a different regime.
For all countries there is clear evidence of currency overvaluation, especially for the recent past, but for
most countries the misalignments are not so large that moving to a different currency regime would be
recommended, at least not in the short term. For example, Cameroon, Chad, the Central African
9
The Pooled Mean Group Estimator shows an evaluation of about 20 percent for Equatorial Guinea.
18
Republic and the Republic of Congo are running with overvaluations in the 5-10 percent level, which
cannot be seen as a sufficient gap to trigger a regime change. For these countries the focus should
remain on medium-term fiscal consolidation and structural changes as discussed above. The outlier is
Equatorial Guinea which is running with a current overvaluation of 40 percent which perhaps does
indicate the need for a regime change in addition to structural changes.
E. Economic Convergence remains limited
1.39 Economic convergence, which should be facilitated by regional integration, can be assessed by
different methods. According to neoclassical theory, convergence of the countries with low per capita
income can be observed to catch up with richer countries due to the diminishing marginal productivity
of capital (see e.g. Barro and Sala-i-Martin 1992). In the context of a regional integration framework,
convergence should be enhanced given the liberalization of capital movement among member
countries. Economic integration should also lead to increased labor mobility, improved economic
performance and stability, especially price stability and higher trade volumes between member
countries.
1.40 Different methodologies can be used to assess if and to what extent convergence could be
observed. These methodologies include the evaluation of the convergence of individual countries
towards the CEMAC average, the convergence over time from a fixed starting point, the synchronization
of business cycles for oil and non-oil growth as well as convergence measured by a disparity index to
assess if disparity has decreased over time. In addition, time series models can be used to assess the
extent of stochastic convergence between the CEMAC countries.
1.41 Looking at convergence of the growth performance compared to a starting point, there is little
convergence among the CEMAC member countries. According to neoclassical theory, poorer countries
should experience faster growth to catch up with previously richer countries, also called β–convergence
(Sala-i-Martin 1996). Given 1960 as starting point, the graph is positively sloped, which indicates
divergence rather than convergence (Figure 17 – left panel). With 1984 as initial year, the slope is
negative, but the coefficient is not significant (Figure 17 – right panel), implying that initially poorer
countries did not catch up significantly to their richer peers. This is in line with the findings of Solarin and
Sahu (2013) of a positive coefficient for the CFA Franc region.10
10
The regression has also been run with 1994 as starting point, which yields a positive and insignificant coefficient.
19
Figure 17: CEMAC - GDP convergence – compared to starting level (1960 and 1984)
Source: WDI, author’s calculation
1.42 WAEMU countries, on the other hand, did display significant convergence among member
countries. As seen in Figure 18, both left and right panel, the slope is negative and significant, even
higher in the longer time period starting 1960. This indicates that the poorer WAEMU countries did grow
faster than the richer member countries, pointing to a stronger framework for regional integration.
Figure 18: WAEMU - GDP convergence – compared to starting level (1960 and 1984)
Source: WDI, author’s calculation; No data available for Mali and Guinea-Bissau for 1960
1.43 Overall, there is no significant income convergence between CEMAC members. Although
CEMAC became operational in 1999 and was preceded by UDEAC, different methodologies to assess
income convergence between member countries indicate that there has been some but overall
insufficient convergence. However, convergence seems to be higher for inflation, fiscal balances and the
current account. The inflation rate has shown a much higher degree of convergence and stability over
log(GDP2015/GDP1960)
= -3.79 + 0.58 log(GDP1960)
R2 = 0.55
-0.8
-0.6
-0.4
-0.2
0.0
0.2
0.4
0.6
0.8
1.0
1.2
6.0 6.5 7.0 7.5 8.0 8.5
RealGDPpercapitagrowthrate
log(real GDP per capita in 1960)
1960-2015
log(GDP2015/GDP1984)
= 3.60 - 0.42 log(GDP1984)
R2 = 0.13
-1.0
-0.5
0.0
0.5
1.0
1.5
2.0
2.5
3.0
3.5
6.0 7.0 8.0 9.0 10.0
RealGDPpercapitagrowthrate
log(real GDP per capita in 1984)
1984-2015
log(GDP2015/GDP1960)
= 3.56 - 0.52 log(GDP1960)
R2 = 0.44
-0.6
-0.4
-0.2
0.0
0.2
0.4
0.6
0.8
1.0
1.2
5.0 5.5 6.0 6.5 7.0 7.5
RealGDPpercapitagrowthrate
log(real GDP per capita in 1960)
1960-2015
log(GDP2015/GDP1984)
= 2.38 - 0.34log(GDP1984)
R2 = 0.37
-0.2
-0.1
0.0
0.1
0.2
0.3
0.4
0.5
0.6
0.7
0.8
5.5 6.0 6.5 7.0 7.5
RealGDPpercapitagrowthrate
log(real GDP per capita in 1984)
1984-2015
20
the past decades than GDP.11
Table 6 presents a summary of the convergence analysis (see Nielsen and
Fiess (2018) for more details).
Table 6: Summary of results from convergence analysis
Methodology Time frame Variable Result
Convergence toward
the CEMAC average
over time
1984-2015 Growth Convergence for Cameroon, CAR, Chad and the
Republic of Congo; no convergence for Equatorial
Guinea, some convergence for Gabon, but large
differential
Inflation No systematic divergence for any country
Convergence over
time from fixed
starting point
(e.g. Solarin and Sahu,
2013)
1960-2015 Growth Significant divergence
1984-2015 Growth Insignificant convergence
Business cycle
convergence
(Frankel and Rose,
1998)
1984-2015 Overall growth
(filtered/
unfiltered)
Convergence between Cameroon, Chad, Equatorial
Guinea, Gabon and the CEMAC average; no
convergence between individual countries
Oil growth
(filtered/
unfiltered)
Convergence between Chad and the Republic of
Congo (unfiltered); Gabon and the Republic of
Congo (filtered)
Non-oil growth
(filtered/
unfiltered)
Convergence between Cameroon and the Republic
of Congo and the CEMAC average; convergence
between Chad and Gabon
Disparity index
(Sala-i-Martin, 1996)
1984-2015 Growth Constant disparity (i.e. constant standard deviation)
Inflation Decrease in disparity (i.e. convergence)
2000-2015 Fiscal balance Decrease in disparity
Current account
balance
Decrease in disparity
Stochastic
convergence
(e.g. Bernard and
Durlauf, 1996)
1960-2015 Growth Convergence between Cameroon and CEMAC
average (considering structural break)
1984-2015 Growth Convergence between CAR, Equatorial Guinea,
Gabon and CEMAC average (considering structural
break)
Note: Two sample periods were considered for the convergence analysis: 1985- 2015 includes all six CEMAC countries
(Equatorial Guinea joined UDEAC in 1984. The longer sample (1960 to 2015) excludes Equatorial Guinea for ease of comparison.
See Nielsen and Fiess (2018) for further details.
11
These findings seem aligned with e.g. Boogaerde and Tsangarides (2005), Pattillo et al. (2008), Bagnai (2010),
Dramani (2010) and Solarin and Sahu (2013).
21
F. Conclusion and Policy Recommendations
1.44 The economy of the CEMAC region has grown substantially over the past decades, but remains
vulnerable to oil price developments. Despite significantly different economic situations, ranging from
low income to upper middle-income countries, five out of six CEMAC countries are oil exporters and
heavily influenced by oil price changes. This could particularly be seen in the last few years with the
negative impact of the sharp decline of the oil price. As a result, previously high fiscal and external
account balances turned to twin deficits, reserves declined and debt levels, which had been on a
continued downward trend, started to increase. Inflation, however, has remained relatively stable over
the years.
1.45 Progress has been made regarding social and governance indicators, but there is significant
room for improvement. Health and education statistics have improved for almost all countries.
However, health and education outcomes are not in line with their income status, especially for the
middle-income countries of the group, remaining well below the average level of lower middle-income
countries. Different governance indicators all raise serious issues in the CEMAC countries and rank them
in the bottom half or even third of the ranked countries. CAR and Chad fare particularly poor with
Gabon typically being the highest ranked country from the region. Doing Business indicators report a
similar picture with the CEMAC countries ranked among the bottom thirty of 190 countries.
1.46 Trade within CEMAC remains limited despite regional integration efforts. One objective of
regional integration initiatives, especially through the creation of a customs union, is the increase in
intra-regional trade flows by eliminating trade barriers. However, this has not yet been the case in the
CEMAC region. While exports and imports increased significantly over the past decades, trade within the
region remains limited. Exports from member countries to the CEMAC region only accounted for an
average of 1.6 percent of total exports between 1984 and 2015. The import share increased only slightly
to 3.7 percent of total imports. This confirms the slow progress of regional integration in trade. In
addition, CEMAC members are affected by high costs and time requirements when trading across
borders.
1.47 There is limited evidence for income convergence in the CEMAC region. The evaluation of
income convergence using different methodologies shows that depending on the time frame
considered, some evidence for convergence can be found, however, not consistently across the region.
However, convergence seems to be higher for inflation, fiscal balances and the current account.
1.48 Economic growth convergence also depends on economic policies and institutions. Despite
the adoption of convergence criteria, CEMAC member countries have not reached similar growth and
fiscal levels. Convergence is crucial for the success of the currency union, but recent IMF estimates show
that CEMAC countries have a poor track record in meeting convergence criteria. Low levels of business
cycle correlation in the CEMAC and evidence that business cycles may have become even less
synchronized in recent years (Nielsen and Fiess, 2018) may suggest that fiscal divergence has also played
a role in this. Darvas et al. (2005) find that the Maastricht “convergence criteria,” used to determine
eligibility for EMU, have indirectly moved Europe closer to an optimum currency area by reducing
countries’ abilities to create idiosyncratic fiscal shocks; greater compliance with the CEMAC convergence
criteria may have a similar stabilizing effect for CEMAC. Sachs and Warner (1995) underline the fact that
economic convergence requires efficient economic policies and institutions. The CEMAC Economic and
22
Financial Reforms Program (PREF-CEMAC, see CEMAC 2017) contains several initiatives and
recommendations that would support sound economic policies and institutions in the region to support
convergence. These include, among others, accelerating the creation of a common market, harmonizing
budget rules and improving budget policy coordination.
1.49 The current valuation of the currency does not seem to justify a short-term move to a
different exchange rate regime. A real effective exchange rate assessment provides some evidence of
exchange rate overvaluation in CEMAC, but misalignments are not so large that moving to a different
currency regime would be recommended, at least not in the short term. As such, the lack of
competitiveness in CEMAC seems largely due to structural constraints in the regional business
environment. To support regional competitiveness and the sustainability of the currency peg, CEMAC
countries should remain focused on medium-term fiscal consolidation and promote structural reforms
that enhance productivity.
23
Annex
Figure A.1: Real GDP growth rate, GDP and GNI per capita (1984-2016)
Source: WEO, WDI, author’s calculation
0
500
1,000
1,500
2,000
-10
-5
0
5
10
1984
1986
1988
1990
1992
1994
1996
1998
2000
2002
2004
2006
2008
2010
2012
2014
2016
CAMEROON
real GDP growth rate (%), WEO
GDP per capita (constant 2010 US$), PPP weighted avg.
GNI per capita (Atlas, current US$), PPP weighted avg.
0
200
400
600
-40
-20
0
20
1984
1986
1988
1990
1992
1994
1996
1998
2000
2002
2004
2006
2008
2010
2012
2014
2016
CAR
real GDP growth rate (%), WEO
GDP per capita (constant 2010 US$), PPP weighted avg.
GNI per capita (Atlas, current US$), PPP weighted avg.
0
500
1,000
1,500
-20
0
20
40
1984
1986
1988
1990
1992
1994
1996
1998
2000
2002
2004
2006
2008
2010
2012
2014
2016
CHAD
real GDP growth rate (%), WEO
GDP per capita (constant 2010 US$), PPP weighted avg.
GNI per capita (Atlas, current US$), PPP weighted avg.
0
1,000
2,000
3,000
4,000
-15
-5
5
15
25
1984
1986
1988
1990
1992
1994
1996
1998
2000
2002
2004
2006
2008
2010
2012
2014
2016
CONGO
real GDP growth rate (%), WEO
GDP per capita (constant 2010 US$), PPP weighted avg.
GNI per capita (Atlas, current US$), PPP weighted avg.
0
10,000
20,000
30,000
-50
0
50
100
150
200
EQUATORIAL GUINEA
real GDP growth rate (%), WEO
GDP per capita (constant 2010 US$), PPP weighted avg.
GNI per capita (Atlas, current US$), PPP weighted avg.
0
5,000
10,000
15,000
-20
-10
0
10
20
GABON
real GDP growth rate (%), WEO
GDP per capita (constant 2010 US$), PPP weighted avg.
GNI per capita (Atlas, current US$), PPP weighted avg.
24
Table A.1: Education and health statistics
Gross primary school enrolment rate (%)
Country 1980-1989 1990-1999 2000-2009 2010-2015
Cameroon 97.2 83.7 98.6 111.9
Central African Republic 70.7 64.0 72.6 93.0
Chad 40.5 52.1 72.2 95.0
Congo, Rep. 131.9 111.2 106.4 112.1
Equatorial Guinea 165.3 134.6 96.8 81.7
Gabon 146.3 141.8 104.6 142.0
CEMAC average (weighted by population) 92.7 79.2 89.2 102.6
Sub-Saharan Africa 77.2 75.2 90.7 97.8
Lower middle income 90.4 93.0 100.6 104.8
Upper middle income 113.9 112.9 109.2 108.2
Infant mortality (per 1,000 live births)
Country 1980-1989 1990-1999 2000-2009 2010-2015
Cameroon 95.4 91.2 79.7 60.6
Central African Republic 116.2 115.1 109.4 95.7
Chad 122.0 111.3 100.7 88.4
Congo, Rep. 64.6 68.2 62.8 36.1
Equatorial Guinea 137.8 117.6 93.0 72.3
Gabon 66.4 58.4 50.5 38.4
CEMAC average (weighted by population) 97.8 95.9 86.0 69.0
Sub-Saharan Africa 113.8 103.7 81.2 59.8
Lower middle income 94.5 75.4 56.9 42.6
Upper middle income 47.5 37.3 24.4 16.1
Life expectancy at birth
Country 1980-1989 1990-1999 2000-2009 2010-2015
Cameroon 52.6 53.1 52.1 55.0
Central African Republic 49.5 47.0 45.1 49.9
Chad 45.8 47.3 48.1 51.1
Congo, Rep. 56.2 52.6 53.6 61.6
Equatorial Guinea 46.0 50.1 53.6 57.2
Gabon 58.4 60.7 59.8 63.8
CEMAC average (weighted by population) 51.1 51.2 50.8 54.4
Sub-Saharan Africa 49.3 50.0 52.6 58.0
Lower middle income 57.7 61.1 64.3 67.0
Upper middle income 66.8 69.1 72.0 74.2
Source: WDI, author’s calculation
25
Figure A.2: Governance indicators – 2015
Source: World Bank
0 10 20 30 40 50 60
CAMEROON
CENTRAL AFRICAN…
CHAD
CONGO
EQUATORIAL GUINEA
GABON
Voice and accountability
0 10 20 30 40 50 60
CAMEROON
CENTRAL AFRICAN…
CHAD
CONGO
EQUATORIAL GUINEA
GABON
Political stability
0 10 20 30 40 50 60
CAMEROON
CENTRAL AFRICAN…
CHAD
CONGO
EQUATORIAL GUINEA
GABON
Government effectiveness
0 10 20 30 40 50 60
CAMEROON
CENTRAL AFRICAN…
CHAD
CONGO
EQUATORIAL GUINEA
GABON
Regulatory quality
0 10 20 30 40 50 60
CAMEROON
CENTRAL AFRICAN…
CHAD
CONGO
EQUATORIAL GUINEA
GABON
Rule of law
0 10 20 30 40 50 60
CAMEROON
CENTRAL AFRICAN…
CHAD
CONGO
EQUATORIAL GUINEA
GABON
Control of corruption
26
Figure A.3. Cameroon: BEER, HPBEER and Current Misalignment
Figure A.4. Central African Republic: BEER, HPBEER and Current Misalignment
Figure A.5. Chad: BEER, HPBEER and Current Misalignment
27
Figure A.6. Equatorial Guinea: BEER, HPBEER and Current Misalignment
Figure A.7. Gabon: BEER, HPBEER and Current Misalignment
Figure A.8. Republic of Congo: BEER, HPBEER and Current Misalignment
28
CHAPTER 2: Constraints to Private Sector Development
A. Introduction
2.1. Deepening regional integration in CEMAC requires active private sector participation. One of
the major reasons for the weakness in the Africa regional trade performance has been the lack of a
private sector that is dynamic and vibrant enough to seize existing opportunities in the trading system.
According to UNCTAC (2015), Africa’s private sector faces several challenges linked to high and rising
informality, small size of enterprises, weak inter-firm linkages, low level of export competitiveness and
low innovation capabilities. These challenges are compounded by the fact that regional integration
initiatives often focus on processes, such as the removal of trade barriers, without the commensurate
attention to the building of productive capacities and private sector development that would effectively
address the consequent weaknesses.
2.2. Focusing on CEMAC’s non-oil firms in manufacturing, retail and other services, this chapter
analyzes how distortions of the business climate affect the private sector performance. The main
obstacles to private sector development are identified and evaluated. In addition, the performance of
firms is assessed. Using data from the Enterprise Surveys, the analysis helps to evaluate CEMAC firms’
performance and track business constraints at the firm level.
B. Obstacles to doing business
Main obstacles to doing business
2.3. Improving the business environment implies reducing distortions and obstacles to doing
business, and expanding economic opportunities. Empirical evidence from a wide range of
enterprise-level studies suggests that a poor business environment has a significant and adverse
impact on productivity, growth and economic activity (Escribano et al., 2006; Eiffert et al. 2005). In
Sub-Saharan Africa, specifically, financial and market distortions have a severe impact on business
(Bah and Fang, 2015; Giannetti and Ongena, 2009). Analyzing Enterprise Survey data for CEMAC,
Fiess and Kouevi (2018) find that more than half of surveyed firms in CEMAC identify lack of
electricity, unfair competition from the informal sector and corruption are identified as the top
constraints for doing business in the CEMAC region (see Figure 19). At country-level, access to
finance (Cameroon, CAR), political instability (Republic of Congo, Chad), transport (Gabon) and an
insufficiently skilled workforce (Gabon) also figure among the top three constraints to doing business
(Table 7).
29
Figure 19: Top ten constraints to business
Note: The Enterprise Survey asks managers to rank different aspects of the business environment (e.g. access to electricity,
access to finance, corruption) on a 5-point scale ranging from 0 (not an obstacle) to 4 (severe obstacle to doing business).
Top constraints are identified as the share of managers that rank a given aspect of the business environment as major or
severe.
Source: Fiess and Kouevi (2018).
Table 7: Top three major or severe obstacles
Countries Obstacle 1 Obstacle 2 Obstacle 3
Cameroon Informal sector Electricity Access to finance
Gabon Electricity Transport Access to educated workers
Rep. of Congo Electricity Political instability Corruption
Chad Electricity Informal sector Political instability
CAR Electricity Access to finance Informal sector
Source: Enterprise Survey data.
2.4. Costs associated with these distortions are considerable, but vary across CEMAC. Using the
combined cost of power outages, crime, security and bribes as a percentage of firm sales as a proxy for
the cost of distortions to the doing business, the percentage of sales that firms report as lost to
distortions is the highest in CAR (38 percent), followed by the Republic of Congo (25 percent), Cameroon
(13 percent), Chad (9 percent) and Gabon (7 percent) (see Figure 20). Power outages are most costly to
firms in CAR and Cameroon, while crime (Chad and Republic of Congo) and bribes (Gabon) are a
significant cost factor in the other CEMAC countries. Fiess and Kouevi (2018) further show that for the
CEMAC region as a whole, power outages, crime, security and bribes are more costly to smaller firms, to
firms that only operate in the domestic market (non-exporting firms), and to firms in the service sector.
62.4
57.9
53.2
50.7 49.3
46.7
38.3
36.6 36.2 35.6
0204060
%sayingareaismajororsevereobstacle
source: Author's calculations based on panel data from Enterprise Surveys
Top constraints to doing business in CEMAC
Electricity Informal sector
Corruption Tax administration
Access to finance Tax rates
Transport Political instability
Crime Customs & trade reg.
30
Figure 20: Cost of bribes, security, crime, and power outages by country
Electricity
1.50 The lack of reliable access to electricity is a major constraint for many of the CEMAC countries.
Despite abundant natural resources, access to electricity remains a challenge for several of the CEMAC
countries. Electrification rates vary from 9 percent of the population in Chad and 14 percent in CAR to
68 percent in Equatorial Guinea and 91 percent in Gabon.12
Access to electricity is similarly low in the
WAEMU region with an average of 38 percent of the population compared to 43 percent for the SSA and
91 percent for middle income countries.
1.51 In addition, electricity and fuel prices are relatively high. The price for electricity in Sub-
Saharan Africa is high in general with an average of 20.0 US cents per kWh compared to an average of
16.1 US cents per kWh in upper middle-income countries. The CEMAC average is only slightly lower
(19.1 US cents per kWh) while the WAEMU average is even higher (22.6 US cents per kWh)13
. However,
prices in the CEMAC region vary widely from 11.1 US cents per kWh in CAR and the Republic of Congo to
22.7 US cents per kWh in Equatorial Guinea. Due to low electrification rates, many companies rely on
generators for electricity. Pump prices for diesel fuel of on average 1.1US$/liter are just below the
African average of 1.2 US$/l despite substantial oil production and exports.
Access to finance
2.5. Access to finance in the CEMAC region is hampered by weak credit infrastructure which, in
turn, stifles private sector development. Access to finance is identified as a major constraint by firms
operating in the region (Table 8). Domestic credit to the private sector is low at 15 percent of GDP in
Central African Republic and Cameroon, 14 percent in Gabon, 11 percent in the Republic of Congo, and 6
percent in Chad. The value of collateral needed for a loan is very high. For example, collateral
requirements are 260 percent of the loan amount in Cameroon and 233 percent in the Central African
12
Republic of Congo 57 percent, Cameroon 60 percent; World Development Indicators, data for 2016.
13
Data for electricity and fuel pump prices are from FERDI – Sustainable Competitiveness Observatory:
https://competitivite.ferdi.fr/en/data.
2.91
4.00
7.31
5.58
19.21
11.54
15.71
21.89
9.64
5.425.15
5.75
2.57
3.93
4.58
8.47
3.56
11.87
25.22
13.11
0510152025
Costs(%ofsales)
Cameroon Congo Gabon Chad CAR
source: Author's calculations based on panel data from Enterprise Surveys
Bribe Cost of security
Cost of power outages Cost of crime
31
Republic. Low financial intermediation results from multiple factors including asymmetric information,
insufficient collateral and weak insolvency frameworks. According to Doing Business data, none of the
countries in the region has an operating private credit bureau. The coverage of the regional public credit
registry (PCR) also remains limited.14
Furthermore, collateral frameworks are underdeveloped and not a
single CEMAC member country has a movable collateral registry. Insolvency frameworks are ineffective
due to limited capacity of the judicial system. According to the Doing Business report, it takes on
average 4 years for a firm to go through insolvency proceedings.
Table 8. Selected Indicators on Access to Finance
Cameroon
(2016)
Central
African
Republic
(2011)
Chad
(2009)
Congo,
Rep.
(2009)
Gabon
(2009)
Percentage of firms with a checking or savings account 79 99 96 87 84
Percentage of firms with a bank loan/line of credit 14 26 21 13 9
Proportion of loans requiring collateral (%) 88 84 75 68 53
Value of collateral needed for a loan (% of the loan
amount)
260 233 136 47 n.a.
Percentage of firms not needing a loan 41 25 43 32 49
Percentage of firms whose recent loan application was
rejected
36 24 n.a. n.a. n.a.
Percentage of firms using banks to finance investments 16 25 4 8 6
Proportion of investments financed internally (%) 62 74 84 85 93
Proportion of investments financed by banks (%) 4 5 2 4 3
Percentage of firms using banks to finance working capital 20 25 16 10 9
Percentage of firms using supplier/customer credit to
finance working capital
19 46 17 18 7
Proportion of working capital financed by banks (%) 7 6 5 3 3
Percentage of firms identifying access to finance as a major
constraint
41 46 47 45 30
Source: Enterprise Surveys.
2.6. In the CEMAC countries, the banking system offers limited long-term financing (more than 7
years) and charges high interest rates. On average, over the period 2002-2010, long-term loans
represented a stable share of 3 percent of all credits (Central Bank of Central Africa, BEAC). CEMAC's
banking services are characterized by excessive costs (AfDB, 2012). The average cost of credit in 2010
was 11 percent, although costs decreased significantly during the previous five years. For large firms, the
cost of credit was reduced from 12.5 percent in 2005 to 8.9 percent in 2010, and the decline was equally
significant for SMEs (from 17.2 percent to 11.3 percent). However, Aterido et al. (2011) highlights that
small firms have less access to formal finance.
2.7. Based on the available data, the comparison of financial markets in the CEMAC region shows
that Cameroon is better positioned than the other four countries. Based on the ES results, 30 percent
of firms have a line of credit or a loan in Cameroon, 25 percent in CAR, 19 percent in Chad, 12 percent in
the Republic of Congo and 10 percent in Gabon. Generally, large and medium firms in the CEMAC region
14
Specifically, in Chad, where only 2.3 percent of the adult population is covered, in Central African Republic 3.1
percent, in Cameroon 8 percent, in Equatorial Guinea 9 percent, in the Republic of Congo 12.2 percent, and in
Gabon 50.8 percent.
32
rely more on bank financing relative to small firms. In Cameroon specifically, financial markets are well
developed and 84 percent of large firms had a line of credit or a loan in 2009; with the crisis, this
number has however declined to 61 percent in 2016. Cameroon further recorded the highest share of
firms applying for a loan or line of credit (36 percent), followed by the CAR (32 percent), Chad (25
percent), the Republic of Congo (18 percent) and Gabon (14 percent).
2.8. Financial inclusion is low, but increasing. According to the Global Findex database, access to
financial services is low, but has increased in recent years (see Table 9). In 2014, on average only 19
percent of the adult population in CEMAC had access to a bank account. Although this number increased
to 31 percent by 2017, it is still lower than the WAEMU (37 percent) or SSA average (43 percent).
Borrowing from family or friends remained the most common source of credit and levels are
comparable to WAEMU and SSA. The use of credit cards is limited (less than 5 percent on average).
Debit card ownership has not changed much between 2014 and 2017 in the CEMAC region, unlike the
use of mobile accounts which region-wide increased significantly from 4 percent in 2014 to 20 percent in
2017; similar trends occurred WAEMU.
Table 9. Selected Indicators on Financial Inclusion of Individuals (as percentage of population over 15
years), 2014 and 2017
Cameroon CAR Chad Congo, Rep. Gabon WAEMU SSA
2014 2017 2017 2014 2017 2014 2017 2014 2017 2014 2017 2014 2017
Account 12 35 14 12 22 17 26 33 59 18 37 34 43
Borrowed any
money in the
past year
57 53 37 41 38 42 40 40 56 48 46 55 46
from a
financial
institution
2 7 3 2 3 4 4 4 5 4 6 6 7
from a
savings club
- 13 11 - 6 - 5 - 9 - 8 - -
from family
or friends
42 33 19 25 28 24 20 28 39 34 28 42 31
Mobile account 2 15 - 6 15 2 6 7 44 7 25 - -
Credit card 1 3 3 1 3 2 4 6 6 1 4 3 3
Debit card 6 11 4 3 3 10 12 18 16 4 9 18 18
Source: Global Findex database. Note: No data is available for Equatorial Guinea. The WAEMU average does not
include data on Guinea-Bissau, which is not available.
Taxation and tax administration
2.9. Despite low revenue collection, firms in the CEMAC region identify taxes as one of the main
constraints to their business activities (Table 10). The percent of firms identifying tax rates as a major
constraint is 41 percent. Chad has the highest share (59 percent), while Gabon has the lowest (31
percent) in the region. The high statutory tax rate reduces the attractiveness of doing business in a given
country, and firms have to rely on various tax exemptions to achieve a reasonable effective tax rate. The
extensive use of tax exemptions, often awarded in non-transparent processes and criteria, adds to the
lack of visibility and predictability of tax requirements that firms may be facing. This may be one of the
33
main reasons for the results in the Enterprise Survey. The percentage of firms identifying tax rates as
major constraint in the CEMAC region is slightly lower than those reported for the WAEMU region, but
much higher than the SSA average.
Table 10. Firms Identifying Tax Rates or Tax Administration as a Major Constraint (percent of all firms)
Percent of firms identifying tax
rates as a major constraint
Percent of firms identifying tax
administration as a major constraint
All Countries 30.1 19.4
East Asia & Pacific 16.4 7.1
Latin America & Caribbean 32.9 21.0
Middle East & North Africa 29.2 20.8
South Asia 26.4 18.8
Sub-Saharan Africa 33.2 26.3
WAEMU 46.4 37.6
CEMAC 41.0 40.3
Cameroon (2016) 41.8 35.8
Central African Republic (2011) 31.9 28.2
Chad (2009) 59.7 52.9
Republic of Congo (2009) 40.9 47.3
Gabon (2009) 30.9 37.3
Source: Enterprise Surveys, World Bank. Bayraktar and Moreno-Dodson (2018b).
2.10. The quality and capacity of tax administration is also a major constraint to the business
environment. 40 percent of firms in CEMAC identify the quality and capacity of tax administration as a
major constraint. Chad has the highest rate at 53 percent and the Central African Republic the lowest
(28 percent). A comparable share of firms in WAEMU (38 percent) identifies the efficiency of tax
administration as a major constraint, but figures are lower for SSA (26 percent).
2.11. A similar result can be obtained from the taxation indicators of the Global Competitiveness
Index Database (World Economic Forum). Firms in three of the CEMAC countries (Gabon, Chad and
Cameroon) consider that taxation has a negative impact on incentives to invest. The average index value
is around 2.75 in the region, much lower than 7, which corresponds to the best tax practices in the
world. The average value was for the WAEMU countries is 3, so only slightly higher than the value
observed for the CEMAC countries (Moreno-Dodson and Bayraktar, 2018).
The role of the informal sector and its effect on firm competitiveness
2.12. One of the biggest problems of firms in the CEMAC countries, according to the Enterprise
Survey, is competition from a large informal sector. 76.5 percent of formal firms in the region report
that they face unfair competition from informal firms and 52.6 percent of firms regard unfair
competition from informal firms as a major constraint (see Table 11). In terms of unfair competition
from informal firms, Chad reports the highest percentage with 89.8 percent and Central African Republic
has the lowest rate at 66.7 percent. For comparison, 56.2 percent of formal firms in WAEMU,38.4
percent in SSA and 27.4 percent globally identify practices of competitors in the informal sector as major
constraint.
34
Table 11. Percent of firms competing with informal firms and identifying this as a problem
Percent of firms competing
against unregistered or
informal firms
Percent of firms identifying practices of
competitors in the informal sector as a
major constraint
All Countries 53.4 27.4
East Asia & Pacific 53.2 17.1
Latin America & Caribbean 62 30.6
Middle East & North Africa 42.6 31.4
South Asia 41.1 20.4
Sub-Saharan Africa 67.4 38.5
WAEMU 72.7 56.2
CEMAC 76.5 52.6
Cameroon (2016) 80.3 53.3
Central African Republic (2011) 66.7 45
Chad (2009) 89.8 72.4
Congo, Rep. (2009) 69.7 54.2
Gabon (2009) 76 38
Source: Enterprise Surveys, World Bank. Bayraktar and Moreno-Dodson (2018b).
2.13. The size of the informal sector in the CEMAC region is relatively large. According to Abid
(2016), between 2009 and 2013 the informal sector accounted on average for between 34 percent of
GDP in Equatorial Guinea to 53 percent of GDP in Gabon. This is comparable to the WAEMU region
(between 44 percent of GDP, Burkina Faso and Mali, and 54 percent of GDP, Benin). This is roughly
comparable with the results from Hassan and Schneider (2006), who, however, evaluate the time period
between 1999 and 2013.
2.14. There are several reasons for the existence of a large informal sector, which would need to be
addressed to integrate the informal activities into the formal economy. Reasons for informal activities
include, among others, the size of the country, especially the urban population, which often has fewer
formal employment opportunities reflected in high unemployment rates, the low quality of public
services, including a lack of enforcement of laws and regulations, high levels of corruption, the number
of regulations and the complexity of the tax system and the added costs of taxes and social
contributions in addition to labor costs (see Abid 2016). Consequently, to address the large extent of
informal activities a country-specific strategy should be developed which depends on the identified
underlying factors. Possible policy actions include active labor market strategies to improve access to
the formal sector; the creation of job opportunities in the formal sector; formal structures to encourage
people to participate in the formal economy; simplified processes for business formalization; and
stricter enforcement mechanisms.
35
C. The performance and productivity of firms in CEMAC
2.15. There is significant dispersion in labor costs and labor productivity in CEMAC. Labor costs are
the highest in Gabon and Chad, but are substantially lower in CAR. Labor costs, evaluated in terms of
labor costs per full-time equivalent workers, are the highest in Gabon, followed by Chad, the Republic of
Congo, Cameroon and CAR (Figure 21). Labor productivity, calculated as total sales divided by the
number of permanent employees, is the highest in Gabon, followed by Chad, the Republic of Congo,
Cameroon and CAR. Value added by worker, which is used as a proxy for labor productivity shows a
similar picture (Figure 22).
Figure 21: Cost of labor per worker Figure 22: Productivity and Value Added per
worker
2.16. Large and medium sized firms contribute the most value added. The contribution to value
added varies by country, but for the majority of CEMAC countries large and medium-sized firms matter
the most: large firms account for close to 90 percent of value added in Cameroon, 57 percent in the
Republic of Congo and 47 percent in CAR. Medium-sized firms contribute the most to value added in
Chad (58 percent) and small firms dominate in Gabon (42 percent) (see Figure 23).15
2.17. Regression analyses show that labor productivity in CEMAC is positively associated with FDI,
relative market share and access to ICT, and negatively correlated with market distortions. Foreign
direct investment (equal to or more than 10 percent of foreign share in the capital) increases
productivity between 78 and 98 percent. Being an exporter also increases productivity between 54 and
84 percent; a finding that is also confirmed when comparing total factor productivity (TFP) for exporting
and non- exporting firms. Market share also benefits firm productivity while the use of information
technology increases productivity between 31 and 53 percent. Access to finance is also positively
correlated with firm productivity, but the impact seems to be small, possibly due to the fact that even
firms that have an overdraft facility or access to a credit line may experience insufficient credit quality.
Distortions to the investment climate, such as costs associated with bribes, power outages, security and
loss due to theft, robbery and vandalism, are negatively correlated with firm productivity: a 10 percent
15
Fiess and Kouevi (2018) also report sectoral estimates. In Gabon, CAR and the Republic of Congo, the services
sector contributes the highest share to value added, with 84 percent, 65 percent and 61 percent, respectively
while manufacturing appears to dominate in Cameroon (52 percent) and Chad (64 percent). The results are similar
for the sectors’ contribution to labor productivity, except for Chad where the services sector is more important for
labor productivity.
8.70
9.42
9.72 9.70
8.00
0246810
Costlaborperworker(Log)
Cameroon Congo Gabon Chad CAR
Source: Author's calculation based on data from Enterprise surveys
10.64
10.41
11.71 11.54
12.69
12.23
11.99
11.71
10.27
9.92
051015
Cameroon Congo Gabon Chad CAR
Source: Author's calculation based on data from Enterprise surveys
Productivity per worker (Log) Value Added per worker (Log)
36
increase in market distortions reduces productivity by 12 to 15 percent; these results are similar to the
findings of Herrera and Kouame (2017) for Nigeria.
Figure 23: Contribution to value added by size
2%9%
89%
11%
32%57%
42%
33%
24%
5%
58%
37%
15%
39%
47%
Cameroon Congo Gabon
Chad CAR
Small(0-19) Medium(20-99) Large(+100)
Source: Author's calculation based on data from Enterprise surveys
Contribution to value added by size
37
Box 3. Determinants of productivity – Regression Analysis
Different measures for productivity can be used to analyze its performance and determinants. The choice of the
productivity measure depends on the purpose of productivity measurement and, in many instances, on the
availability of data. For this analysis, three different measures of productivity were used: (i) labor productivity per
worker, (ii) value added per worker, and (iii) total factor productivity (TFP). Labor productivity is measured as real
annual sales divided by the number of full-time equivalent workers. Value added is obtained by excluding the cost
of raw materials and energy from annual sales. Value added per worker is then obtained by dividing the resulting
difference by the number of full-time equivalent workers. Productivity at firm level is measured, following Herrera
and Kouame 2017) by using TFP as it considers the production technology and the level of capital.
The following assumptions and definitions have been used for the analysis:
• The capital intensity is measured as the logarithm of the stock of capital.
• Labor quality is proxied by (i) the share of temporary workers and (ii) the average educational attainment of
the average worker.
• Access to finance is measured by a dummy that takes the value 1 if the firm has a line of credit or an overdraft
facility.
• The quality of the investment climate is proxied by (i) the percentage of the top manager’s time spent in
dealing with the government regulations and (ii) the combined cost of power outages, bribes, security and
crime as a share of sales.
• Exporter status is proxied by a 0-1 dummy which evaluates the share of exports in total firm sales.
• Firm size is proxied by the market share of the firm, measured by the ratio of the total sales across sector,
region and year.
• Firm age is proxied by the following dummy variables: ‘young’ for firms aged between 0 and 5 years; ‘mature’
for firms between 6 and 15 years; and ‘old’ for firms older than 15 years.
Data and Methodology
Data is based on the World Bank’s Enterprise Surveys (ES), where available: Cameroon (2006, 2009 and 2016);
Gabon (2009); the Republic of Congo (2009); Chad (2009) and CAR (2011). No data is available for Equatorial
Guinea.
ES collects data on a wide array of qualitative and quantitative information on firms in manufacturing, retail and
other services (non-oil sector). For the years covered by the ES, these three sectors represented on average 70
percent of GDP in Cameroon, 45 percent in Gabon and 30 percent in the Republic of Congo. For Chad and CAR, ES
data only covers manufacturing and services and those sectors represented 40 percent and 38 percent of GDP
(WDI, 2017). Observations in the ES are selected using stratified random sampling in three dimensions: sectors,
establishment size, and location. Firm size is defined based on reported or evaluated permanent full-time workers
comprising three distinct categories: small (up to 19 employees), medium (20 to 99 employees), and large (more
than 99 employees).
The analysis focuses on the non-oil sector and therefore an attempt is made to exclude any firm with oil activities.
As ES prior to 2011 do not distinguish between oil and non-oil activities of firms, this distinction can only be made
for Cameroon and CAR. After data screening, 918 observations have been obtained for Cameroon, 179 for Gabon,
151 for the Republic of Congo, 150 for Chad and 150 for CAR.
38
D. Conclusion and Policy Recommendations
2.18. This chapter highlights the main obstacles to the business environment and investment
climate. Improving the business environment is fundamental to facilitate the emergence of a strong
private sector capable of absorbing the working-age population. Due to the scarcity of public resources,
the private sector is a critical partner for governments to create employment and ensure that economic
growth is inclusive. The analysis shows that key obstacles in the CEMAC region are energy or electricity,
informal sector practices, political instability and access to finance. Working on the reforms to tackle
these obstacles will contribute to economic growth centered on strong contributions from the private
sector. Investing in the energy sector, the first most common obstacle, is vital for the competitiveness of
a country and its productivity. The lack of access to electricity has an impact on key strategic sectors of
the economy, such as the manufacturing sector which is a source of positive externalities for other
sectors (Rodrik, 2008).
2.19. A dynamic and vibrant private sector is important for economic diversification and job
creation, and can also be a driver of deepening regional integration. Those fundamentals are critical to
enable an efficient business environment. An improved business environment is a starting point for
CEMAC economies to move to more diversification and generate spillovers in terms of sustainable
growth and employment that will contribute to the agenda of ending poverty and sharing prosperity by
creating jobs for inclusive economic growth. A dynamic and vibrant private sector would also be able
capitalize on existing opportunities in the trading system and actively promote regional integration (see
UNCTAD 2015).
2.20. Investment and business climate reforms mainly fall under the realm of national
governments, but there is also scope for interventions at the CEMAC level. As part of the CEMAC-
PREF, individual CEMAC countries are implementing economic diversification strategies to enhance the
local business environment and competitiveness. At the regional level, CEMAC institutions can target
reforms that support intra-regional trade and the development of regional value chains. CEMAC-level
business climate reforms should target the simplification of border procedures, including for visa-free
travel within CEMAC, eliminating roaming cost for intra-CEMAC mobile telephony, and harmonizing axel
load controls to facilitate transit trade. The operationalization of the Business Climate Observatory,
which is still at the conceptual stage, could also help in this process. Mutually recognizing education
qualifications, such as diplomas, would enhance intra-regional labor mobility, while establishing a
CEMAC power pool could support access to reliable electricity, which is one of the main constraint to
private sector development in many CEMAC countries.
2.21. Promoting regional financial stability and inclusion, as well as the harmonization of tax,
investment and trade policies can further support private sector development. CEMAC level institution
can further contribute to an improved regional business environment by promoting regional financial
stability (see Chapter 3) and financial integration, leveling the playing field for investment and taxation
across CEMAC (see Chapter 4), promoting the free circulation of goods, services and people (see
Chapters 5 and 6).
39
CHAPTER 3: The Financial Sector in CEMAC
A. Introduction
3.1. The financial sector in CEMAC is small, but provides essential services and will be vital for the
success of CEMAC’s medium-term growth and diversification agenda. International experiences show
that financial deepening and broadening are key enablers of an acceleration of economic growth, while
banking crises have large and long-lasting costs. Financial deepening, especially since access to finance is
one of the main obstacles for the private sector (see Chapter 2), and financial sector stability are
therefore an important corner stone for sustainable growth in the sub-region.
3.2. This chapter explores CEMAC’s financial sector from the perspectives of regional financial
integration, and identifies risks to financial sector stability from regional macro-financial linkages.
Regional financial integration can play an important role in financial development and growth and also
has an important function in fostering economic resilience by increasing market liquidity and offering
opportunities for risk-sharing. Regional financial integration in CEMAC remains underdeveloped.
Important progress has been made regulating the financial sector at the regional level, but little has
been achieved in facilitating integration of banking markets, as regional infrastructure and markets are
not sufficiently developed. This chapter takes stock of the current state of financial sector integration in
CEMAC and assesses options to deepen financial integration and intermediation, via progress on the
single banking license (agrément unique) and the parallel legal framework for creditor rights at domestic
and regional (OHADA) level, as well as merging CEMAC’s two parallel stock exchanges.
B. Overview of the financial sector
3.3. According to the 2016 CEMAC Financial Sector Assessment (FSA), the financial sector remains
shallow and mostly bank based. The depth of the banking sector is limited and accounts for only 26.3
percent of CEMAC's GDP. Domestic credit to the private sector in the region is low and represents only
10 percent of the GDP. On average, close to 50 percent of banking sector assets are controlled by three
banks per country and close to 50 percent of banking sector assets are controlled by foreign banks
(mostly European banks).16
3.4. At end-January 2018, the banking system in the CEMAC region consisted of 52 banks:
Cameroon (14), Central African Republic (4), the Republic of Congo (11), Gabon (10), Equatorial Guinea
(5), and Chad (8). Moreover, 11 non-deposit taking institutions are active in Cameroon (8) and in Gabon
(3). Cameroon, Gabon, and the Republic of Congo represent 78 percent of the total assets in the system.
3.5. Banking assets in the region are increasing. Aggregate banking assets in the CEMAC have
reached XAF 12,592 billion (US$20.9 billion) at the end January 2018. Credits in arrears have
dramatically increased over past four years to 17.8 percent in January 2018, up from 14.6 percent in the
previous year. Credit arrears are mainly concentrated in the Republic of Congo, Chad, Equatorial Guinea
and Gabon and mostly in the construction sector. Only 25 banks out of 54 are complying with all
prudential regulations.
16
Ghura et al. (2010) find that the gap in financial development in the CEMAC relative to SSA is partly explained by
differences in institutional quality (e.g. the availability of credit information, and strength and enforcement of
property rights.
40
Figure 24. CEMAC - Total Assets by Country at end-January 2018
Source: COBAC.
3.6. The microfinance sector plays an important role in the region. The sector is composed of 825
registered microfinance institutions (MFI), which are distributed in the six CEMAC countries as given in
Table 12. Data are available only from about 60 percent of the MFIs, namely those that have provided
their financial statements to the COBAC as of end-June 2016. These statements cover about 90 percent
of the total volume of the sector’s activities. Below are some figures about the MFI sector as of end-
September 2017, with reference to June 201617
:
• A total volume of assets of XAF 894 billion (about US$1.5 billion in June 2016);
• A gross loan portfolio of XAF 451 billion (approximately US$764 million) and XAF 514 billion in
June 2016 (about US$878 million), which comprises mainly short-term loans;
• A total volume of deposits from members/customers in an amount of XAF 676 billion (US$1.15
billion), constituted mainly of sight deposits;
• A poorly performing loan portfolio that is characterized by a total volume of XAF 64 billion of
loans in default (US$108 million), which amounts to 14 percent of the gross loan portfolio;
• A liquidity surplus of XAF 317 billion (US$537 million).
Table 12. CEMAC - Number of Registered MFIs by Category and Country as of September 30, 2017
Categories
Countries
Total
CEMACCameroon
Central
African
Republic
Congo,
Rep.
Gabon
Equatorial
Guinea
Chad
1st category 492 21 55 5 1 193 767
- Independent 199 5 21 5 1 13 244
- Networks 293 16 34 — — 180 523
2nd category 51 3 11 10 3 5 83
3rd category 4 — 2 1 — — 7
Total 547 24 68 16 4 198 857
Source: COBAC.
17
Source: MFIs’ status in the CEMAC region as of September 30, 2017.
Equatorial
Guinea
14%
Gabon
20%
Congo
14%
CAR
2%
Cameroon
44%
Chad
7%
41
3.7. MFIs have a large client base. MFIs that operating in the COBAC region reportedly serve almost
2.4 million members/clients (equivalent to about 7 percent of the adult population), most of members/
clients are in Cameroon and the Republic of Congo (see Table 13).
Table 13. CEMAC - Evolution of the Number of Members and Clients of MFIs
Country December 31, 2016 September 30, 2017 Variation (%)
Cameroon 1,914,070 1,367,084 -28.6
Central African Republic 40,078 47,135 17.6
Congo, Rep. 400,497 420,007 4.9
Gabon 148,228 160,110 8.0
Equatorial Guinea n/a 547 n/a
Chad 177,271 151,820 -14.4
Total CEMAC 2,680,144 2,146,703 -19.9
Source: COBAC.
3.8. According to the information provided by the COBAC, the volume of the MFIs’ assets in the six
countries is distributed as shown in Figure 25.
Figure 25. Distribution of Total Assets by Country as of September 30, 2017
Source: COBAC.
3.9. The MFIs and the members of their governing bodies are registered by the local authorities,
which exercise an administrative oversight. Prudential oversight is carried out the by the COBAC’s
Department of Microfinance (Departement de la Microfinance, DM). To oversee the MFI sector with its
825 registered entities, the DM has 10 staff who are stationed at the COBAC’s headquarters in Libreville.
The DM staff is mainly dedicated to carry out the off-site supervisions and coordinate with the Banking
Supervision Department to carry out on-site supervision visits of a few MFIs. Off-site supervision is
carried out using the ‘SESAME’ software, which has limited analytical capabilities.
3.10. Capital markets are almost nonexistent due to the coexistence of two competing markets (one
domestic in Douala and a regional one in Libreville). The regional authorities decided in November 2017
to merge the two exchanges. The regional regulator, the COSUMAF, will remain in Libreville (Gabon) and
the regional stock exchange will be located in Douala (Cameroon). Insurance and pension sectors remain
underdeveloped.
Cameroon
58%
CAR
3%
Congo, Rep
32%.
Gabon
5%
Equatorial
Guinee Chad
1%
42
3.11. Financial sector integration in the region remains limited. An assessment of financial sector
integration in CEMAC shows little progress. Price-based indicators, such as interest margins, indicate
that banking systems in the region are poorly integrated and quantity-based indicators, especially the
level of cross-border flows, show only marginal flows (see African Development Bank 2010). Most banks
operate to a large extent nationally and focus on customers with limited cross-border economic
activities.
C. Challenges of the financial sector
Payment systems
3.12. Payment systems in the CEMAC region are underdeveloped. The payment systems
infrastructure18
is aging and needs to be upgraded. Furthermore, the legal and regulatory framework is
not in line with international good practices. A regional payment system approach has not been
developed by the COBAC and BEAC. The existing structure remains complex due to the cohabitation of
multiple regional regulatory frameworks (BEAC, COBAC, and country-specific regulations). This has
resulted in increased uncertainty about applicability of regional and domestic laws particularly in the
area of e-money. The oversight framework of payment systems of the BEAC has not yet been
developed. The assessment of systemically important payment systems is still performed based on the
10 core principles of Systemically Important Payment Systems (SIPS) and not under the Principles of
Financial Market Infrastructure.19
BEAC has started to develop a centralized security depository to
manage CEMAC countries government debt. However, without a government debt management
strategy, the primary and secondary markets structures will not develop effectively.
MFIs
3.13. The microfinance sector is also under pressure. The MFIs’ financial situation remains a concern.
A significant part of the sector does not comply with prudential norms and is currently facing liquidity
constraints. As of March 2017, 14 MFIs with a combined balance sheet of XAF 32 billion (equivalent to
about 3 percent of the total) are being liquidated while four others with a total balance sheet of XAF 9
billion (less than 1 percent of the total) have been intervened by the authorities and operate under
provisional administration. According to the COBAC report, at the end-June 2016, “the prudential
situation of the microfinance entities is fragile (…) their situation is characterized by the lack of
compliance to several norms (…) several MFIs show a net negative or insufficient equity position, and
they do not comply with applicable capital adequacy standards. In addition, several MFIs have a
situation of lack of liquidity that is worrying.”
Regulatory framework
3.14. The COBAC has reviewed its banking resolution framework (CEMAC Regulation 02/14) but this
framework has not been tested yet. The legal framework for the treatment of banks in distress should
be complemented by mechanisms for consultation and coordination among all the authorities
18
Payment infrastructure includes: Real-time gross settlement systems, central securities depositories, securities
settlement systems, central counterparties and trade repositories
19
The SIPS were the first set of principles regulating payment systems infrastructures issued by BASEL Committee
in 2001. These principles were later replaced by the Principles of Financial Market Infrastructure which were issued
jointly by BASEL and International Organization of Securities Commissions.
43
potentially concerned by the failure of complex financial groups with cross-border activities. The 2015
Financial Sector Assessment (FSA) recommends that COBAC ensures (a) a speedy decision-making
process and (b) consistency of the options implemented by the relevant monetary authorities in the
case of failure of a group operating in several CEMAC countries. Improvement of the existing laws and
regulations should be accompanied by the formulation of clear procedures assigned to each pertinent
authority, including the Deposit Guarantee Fund (Fonds de Garantie des dépôts en Afrique Centrale,
FOGADAC). Each authority should have a clear role in the design and selection of available options, in
the decision-making process, and in the implementation of actions towards bank resolution.
3.15. The CEMAC authorities are in the process of updating the regulatory framework for the
operation of the MFI sector. They have drafted a new microfinance framework—the ‘Reglement
CEMAC/Central Africa Monetary Union (Union Monétaire de l’Afrique Centrale, UMAC)/COBAC relatif
aux conditions d’exercice et de contrôle de l’activite de microfinance dans la CEMAC’—which has been
approved by the COBAC and by the BEAC board. In addition, the COBAC has drafted the secondary
regulations (the ‘COBAC reglements’) that will be issued once the Reglement CEMAC/UMAC is passed by
the Council of Ministers. This new framework is, among other things, expected to strengthen the
(internal and external) control functions of MFIs, while it will contribute to better consolidate and
integrate the sector by (a) mandating all category 1 MFIs to affiliate to a network and (b) substantially
increasing the minimum capital requirements for category 2 MFIs. In addition, the DM is planning to
transition its current software to the ‘SPECTRA’ software that is already being used in the supervision of
banks and that will allow for the implementation of an early warning system for the MFIs.
D. Vulnerabilities and risks
3.16. The banking sector remains vulnerable and has been hit hard by the fall in oil prices. The level
of nonperforming loans (NPLs) increased from around 10 percent in 2014 to 17 percent at end August
2017. However, the increase is uneven, with, for example, a smaller increase in Cameroon, which has a
more diversified economy, than in oil-dependent economies such as Chad, the Republic of Congo, and
Equatorial Guinea. This increase is mainly due to the preponderant role of states in financing the
economy in the region. As a result, governments’ arrears to the banking system and to the private sector
have increased dramatically. The banks’ liquidity has declined since the end of 2014, which resulted in
slower growth of credit to the economy. The banks’ liquidity levels20
at the end of December 2016
averaged 110 percent compared to 138 percent in 2014. Deposits fell by 8 percent over the last two
years, with an acceleration of this decline since mid-2016. Lower liquidity, coupled with credit growth
and the absence of an interbank market, forced some banks to have increased recourse to the
refinancing facility of the BEAC. In December 2016, BEAC refinancing accounted for about 6 percent of
the balance sheet of the CEMAC banks, whereas it was only 0.07 percent two years earlier. According to
COBAC’s bank ratings only 1 bank out of 52 was in a solid financial situation as of August 31, 2017.
Between December 31, 2016, and August 31, 2017, the number of banks in fragile financial situation
increased from 11 to 16.
20
Liquidity is a measure of the ability and ease with which assets can be converted to cash. Liquid assets are those
that can be converted to cash quickly if needed to meet financial obligations; examples of liquid assets generally
include cash, central bank reserves, and government debt. To remain viable, a financial institution must have
enough liquid assets to meet its near-term obligations, such as withdrawals by depositors.
44
3.17. The financial sector is also exposed to security risks including money laundering and terrorism
financing. According to the 2016 CEMAC FSA, important financial flows are generated from corruption;
embezzlement of public funds; trafficking of arms and natural resources (diamonds, oil, other mining,
fishing, and wildlife); illegal logging; and piracy in the Gulf of Guinea. The security conditions are also
deteriorating rapidly in the region. As a result of the Government of Nigeria’s efforts to combat Boko
Haram in its territory, the terrorist organization spread into the north of Cameroon and the Lake Chad
region. The financial sector (banks, money transfer providers, exchange bureaus, and MFIs) is
particularly exposed to money laundering and financing of terrorism risks due to lack of capacity and
inadequate supervision by the relevant regional institutions (BEAC, COBAC, and domestic authorities).
According to the joint report in October 2016 by the Financial Action Task Force (FATF),21
West Africa
Inter-Governmental Action Group Against Money Laundering (GIABA), and GABAC, Boko Haram uses
cash, money or value transfer services, mobile money, and bank transfers to transfer funds.
3.18. The oil price shock compounded by the security crisis exposed systemic deficiencies in the
financial system and institutional inadequacies of the CEMAC regional bodies. These gaps must be
addressed at the level of the CEMAC regional institutions to prevent the repetition of the current
precarious situation in the future. However, the regional institutions lack the capacity to respond
effectively to the ongoing crisis and to promote effective and sustainable growth. BEAC lacks timely and
accurate statistics that comply with internationally agreed standards to be able to conduct effective
monetary policy. Macroprudential oversight is hindered by a lack of systems and methodologies to
conduct stress tests. Foreign reserves management remains problematic and is hampered by the lack of
tools to track and monitor foreign transactions movement by the different countries. COBAC is severely
understaffed. The report on the assessment of compliance with the Basel Core Principles (BCP) on
effective banking supervision in the CEMAC region revealed a poor level of compliance with respect to
the powers and responsibilities of the COBAC and the existing prudential framework. The GABAC has
made important efforts to comply with international standards. As a result, it became a full-time
member of the FATF. However, that membership is at risk due to limited financial resources to conduct
mutual evaluations and national risk assessments.
E. Conclusions and recommendations
3.19. The current economic environment requires effective policy actions by the CEMAC regional
institutions, particularly BEAC, COBAC, and GABAC, to mitigate the impact of the crisis and develop a
more resilient and inclusive financial sector. The recently appointed BEAC Governor prepared, and the
BEAC Board adopted in December 2017, a new Strategic Plan for 2017–2020 (Box 4). BEAC also
implemented governance reforms in the context of the IMF’s safeguards missions (Box 5). Furthermore,
COBAC is actively working on multiple fronts to address key banking sector shortcomings, including
related lending, risk concentration, increasing credit in arrears, corporate governance, and AML/CFT.
COBAC is also working to strengthen its prudential supervision framework for banks and the MFIs. A
risk-based supervision approach and consolidated supervision regulations are in the process of being
implemented under the COBAC Action Plan 2016-2019. GABAC has also developed a Strategic Action
Plan, in 2016, to support member states with the implementation of sound and efficient AML/CFT
regimes.
21
The AML/CFT global standard setter.
45
3.20. Monitoring macro-financial risks should be part of regional macro-surveillance. Sub-regional
monetary arrangements, the implementation of a common monetary policy as well as bank regulatory
and supervisory arrangements and the presence of banking groups across the region could be significant
sources of contagion across the sub-region. A regional credit bureau could play an important role in
monitoring interconnected risks. Although none of the banks within CEMAC are currently considered
systemic, even if banking stress does not lead to a banking crisis, rising NPLs and weakening capital
adequacy will likely restrict financial deepening and prevent the banking sector from becoming an
engine for medium-term growth and economic diversification.
3.21. Regional financial integration in CEMAC remains underdeveloped. Important progress has
been made regulating the financial sector at the regional level, but little has been achieved in facilitating
integration of banking markets, as regional infrastructure and markets are not sufficiently developed.
Progress on the single banking license (agrément unique), harmonizing parallel legal framework for
creditor rights at domestic and regional (OHADA) level, as well as completion of unification of CEMAC’s
two parallel stock exchanges seem important interventions at the regional level.
Box 4. BEAC’s Strategic Plan 2017-2020
The preparation of BEAC’s Strategic Plan (aka. PSB), adopted by the BEAC’s Board of Directors on December 21,
2017, was based on the 2009-2016 operational audit of the institution. This audit identified a large number of
shortcomings that tainted the effectiveness of the Institution. The main identified shortcomings are as follows:
1- Inadequate monetary policy, in particular because of the lack of a monitoring mechanism with adequate
indicators and methodologies.
2- Ineffective research function that lacks structured and reliable statistics.
3- Inadequate foreign exchange regulation that is not in line with global good practices and with the current
practices of the CEMAC member states.
4- Challenging foreign reserves management due to the decline in net foreign currency inflows.
5- Weak financial stability monitoring framework due to lack of reliable indicators and tools to assess the impact
of macroeconomic shocks on the financial system.
6- Inadequate payment systems infrastructure.
7- Ineffective human resources management processes.
8- Inadequate accounting and auditing systems and standards.
9- Dilapidated IT and telecom infrastructures.
In response to these shortcomings the BEAC adopted in December 2017 a strategic plan identifying key reforms
to improve the effectiveness of the BEAC. Key reforms include:
1- Pursuing the implementation of the monetary policy operational framework adopted in 2015 by the
Monetary Policy Committee.
2- Strengthening of the research function by supporting the acquisition of information systems and developing
reliable and timely statistics.
3- Strengthening of payment systems legal and oversight frameworks and infrastructures with special emphasis
on electronic payments and e-money.
4- Strengthening of the capacity of the financial stability analysis function.
5- Stabilizing and increasing foreign reserve levels through rigorous control of outgoing transfers and the launch
of a gold monetization program.
6- Updating the foreign exchange regulations and implementation of IT systems to better track foreign
exchange transactions.
7- In the other areas, it is planned to: (i) complete the reform of human resources management, (ii) set up a
46
new accounting framework based on IFRS and optimize the accounting information system, (iii) strengthen the
internal control and audit functions by deploying risk-based management approaches; (iv) optimize the
management of real estate assets, (v) modernize the IT and telecom infrastructure, and (vi) complete the
budget reform.
Source: Plan Strategique BEAC 2017-2020
Box 5. BEAC’s Governance Reform
The BEAC has recently completed a comprehensive governance reform with the support of the IMF. As many
regional central banks, the BEAC is subject to a safeguards assessment by the IMF every four years. The 2013
assessment spanned a period of change at the BEAC and occurred against the backdrop of reforms initiated to
address governance shortcomings and control failures that emerged in 2009. The governance of the BEAC was
undermined by a legal framework that did not adequately protect institutional autonomy, and problematic
partial adherence of several member states to the reserves pooling obligation that is fundamental for the
effectiveness of the monetary union.
Consequently, annual IMF staff visits since 2013 monitored the implementation of priority recommendations
and progress on the BEAC’s reform plan as part of the safeguards “rolling measures” approach. IMF Staff report
(2017) welcomed significant progress achieved in BEAC safeguards reform and in the implementation of two
safeguards priority recommendations.
- BEAC’s Charter reform was completed in 2017. This reform will strengthen decision making, enhance
checks and balances structures, and enhance internal controls. Progress include enhancing the role of
the Board of Directors particularly in the areas of financial stability (i.e. articulation of the duties of the
Board and of the Financial Stability Committee), and internal decision making (i.e. review of the
collegiality principle).
- Migration to internationally recognized accounting standards (IFRS). The BEAC has decided to migrate
to IFRS as recommended by the safeguards mission. The BEAC agreed to publish its financial
statements under IFRS methodology by 2019. The World Bank will support the BEAC with the migration
process to IFRS.
The IMF considers that further significant technical assistance is required to support the implementation of
additional governance reforms including: improve the capacity of the BEAC's board and internal control
functions (audit, risk and compliance).
Source: IMF staff report 2017
47
CHAPTER 4: Taxation and Regional Integration
A. Introduction
4.1. Taxation is considered one of the essential determinants of firms’ production and investment
decisions. In many economies, firms are the main engine of job creation and can contribute to higher
welfare and better distribution of prosperity. Tax structures are expected to support this important role
of firms in contributing to higher economic growth (efficiency dimension) and shared prosperity (equity
dimension). At the same time, tax systems should ensure that firms comply with their tax commitments
to provide sufficient revenues to governments (buoyancy dimension).
4.2. This chapter evaluates tax features that are expected to affect firms in CEMAC countries.
These include the tax rate structure and tax exemptions, including incentives, in the tax base of
corporate income taxation. Furthermore, the possible impact of taxation on investment, growth, and
the competitiveness of the member states is analyzed. The tax structure of the region is also compared
to other parts of the world to the extent possible, especially the WAEMU region and Sub-Saharan Africa
(SSA). The scope of the analysis is not limited to corporate income taxes, but also includes consumption
taxes, labor taxes, and international taxes, all of which are expected to have important effects on firm-
level activities. The analysis behind this chapter is largely descriptive and based on secondary data.
B. The fiscal regime and tax structure in CEMAC22
4.3. The CEMAC countries share a common currency, but common markets can only truly function
as common markets when tax distortions are eliminated. Tax reforms in the member countries and tax
harmonization among the members needs to be handled together. Tax harmonization involves the
following two essential actions: establishment of transparent tax bases and convergence in the tax rates
(Petersen, 2009). Both steps are helpful for the simplification of administration and regional trade as
they are expected to remove border controls and reduce waiting times for trade. Tax coordination
contributes to uniformity of the region and minimizes practices involving tax competition which can be
caused by diverging tax structures.
4.4. The CEMAC countries have plans for custom unions and coordinate domestic taxes as part of
the economic union, but they have not fully accomplished these goals yet. In 1999, CEMAC decided to
strengthen its common external tariff by harmonizing its domestic consumption taxes, except for the oil
excises (Doe, 2006). While harmonizing the consumption taxes, the aim was to prevent countries from
using taxes for protection purposes and to improve government tax revenue. In addition to the common
VAT rates, the CEMAC region has also applied common international tax rates like other regional unions
in SSA (see Table 14; and see Keen and Mansour (2009) for details). Related to corporate income taxes,
the CEMAC countries have signed a tax treaty to improve tax coordination among the members and to
limit double taxation.
4.5. Despite all these attempts, custom tariffs policy and domestic tax policies are, in practice,
diverse in the member countries. The exemptions in the tax base and/or preferential tax rates may
undermine the harmonization efforts as being achieved using the statutory rates. For example, the
CEMAC directive on consumer taxes fixed the VAT rate between 15 and 19 percent; but the effective
22
This section draws on the conceptual framework of Moreno-Dodson and Bayraktar (2018) who provide
complementary analysis for WAEMU.
48
rate of VAT (VAT including surcharges) in Cameroon was 19.25 percent in 2015 and 18.9 percent in the
Republic of Congo (CEMAC 2017). Similar to WAEMU, CEMAC members need to coordinate tax rates,
tax bases, and the tax revenue structure to the extent that it is necessary for the functioning of the
common market. The CEMAC countries now heavily depend on taxes from corporations; to accomplish
the economic union they will need to shift their tax revenue sources towards consumption taxes.
Table 14: Tariff Structure of Existing and Prospective Custom Unions in SSA
Raw Materials Capital Goods Intermediate goods Final Consumption Social goods
CEMAC 10 10 20 30 5
WAEMU 5 10 10 20 0
COMESA 0 0 10 25 n.a.
EAC 0 0 10 25 n.a.
Source: Keen and Mansour (2009) Table 4.
4.6. Corporate income tax (CIT) rates are considered an important parameter on determining
investment and production decisions of firms. The CEMAC countries have diverse corporate income tax
rates. There is no specific agreement on the CIT rates among member countries. The definition of the
tax base is very different in each member country as well. Deductibles and exemptions differ across
countries and sectors. The statutory CIT rates are between 30 percent and 35 percent (Table 15). These
rates are much higher than the rates paid in the WAEMU region.23
High CIT rates are expected to
negatively affect the efficiency of producers in the CEMAC region.
4.7. The CEMAC countries use investment codes to provide some firms with tax exemptions on
investment. Special tax regimes are generally introduced through sectoral tax codes and laws, such as
mining and oil. Tax incentives and codes can be highly discretionary because they are mostly established
by the executive branch of the government without permission of the legislative branch. Most tax
incentives and codes are provided through contractual agreements that involve modified tax laws. Some
countries in the CEMAC region have general investment incentives, while the remaining ones have more
sector-targeted rules. The harmonization of investment codes can be seen as essential for attracting FDI
into regional supply chains. However, investment incentives and codes vary widely in CEMAC (see Box
6).
4.8. Common standards on value added tax (VAT) rates were introduced in 1999, but differences
between member countries remain (Doe, 2006). The aim of the common rules was the sharing of the
tax burden between producers and consumers. The CEMAC countries initially tried to lower possible
market distortions due to value-added taxes. But, in practice, it did not work as expected. Changing tax
rates, tax bases, thresholds, items facing exemptions and tax refunds from time to time at the national
level reduced the effectiveness of VAT significantly. Unfortunately, the member countries could not
replace the declining trade taxes with domestic sales and value added taxes. As presented in the data
analysis section, the share of domestic indirect taxes in the CEMAC region is higher than direct taxes but
still they are very low when compared to the level in other countries.
23
The statutory CIT rates in that region are: Benin (30 percent), Burkina Faso (27.5 percent), Côte d'Ivoire (25
percent), Guinea-Bissau (25 percent), Mali (30 percent), Niger (30 percent), Senegal (30 percent), and Togo (30
percent) as reported in Table 1 of Moreno-Dodson and Bayraktar (2018).
49
Table 15: Statutory Corporate Income Tax Rates in CEMAC in 2016 (% of profits)
Cameroon 33% *
Central African Republic 30%
Chad 35%
Republic of Congo 30%
Agricultural, agro-pastoral, and poultry or fishing sectors 0%
Microfinance companies and private schools organized as a company 25%
Equatorial Guinea 35%
Gabon 30%
Oil and mining companies 35%
Corporations owning intellectual property shares, the Gabonese
Development Bank, public companies, authorized tourism companies,
non-profit organizations, and authorized firms of property promotions 25%
* +10% of 30% = 3% is local council surcharge on the income tax
Source: Crowe Horwath (2016) Africa Tax Facts Guide 2016 and PricewaterhouseCoopers (2017) Worldwide Tax Summaries –
Corporate Taxes 2016/17
Box 6. Investment incentives and codes in the CEMAC region
Investment incentives and codes vary widely in the CEMAC region. Below are examples of the different codes and
incentives in the CEMAC region.
• Cameroon is one of the countries with specific rules on investment incentives and codes. Tax incentives
consist of exemptions from or reductions of tax payments. The main tax advantages related to the private
investment regime are for a maximum period of five years during the installation phase; for a maximum
period of ten years during the exploitation phase; for a maximum of five years for the development of existing
companies; and possible specific advantages for targeted sectors.
• Firms with shares listed on the Stock Exchange in Cameroon can pay reduced CIT rates.
• Corporations engaging in the specific activities, such as activities increasing youth employment or education,
training, and health organizations can benefit from specific tax incentives.
• Chad does not offer any tax incentives or codes.
• The Republic of Congo provides corporations with complex tax incentives and codes. Firms engaging in e.g.
domestic business activities, except for activities such as international trade, import, and processing of toxic
waste can benefit from investment incentives. To be eligible for tax incentives, firms must create permanent
jobs, increase their capital by at least 20 percent, and use local services, employees and materials.
• Firms undertaking at least XAF 100 million investment will be in the general regime, and during the investment
period and following three years, they will benefit from lower customs tariffs, some fees, lower CIT and
personal income taxes, accelerated depreciation, and lower VAT on exported products. If firms undertake
investment between XAF 30 million and 100 million, they will be in the special regime. Their benefits will be
similar to the ones in the general regime, but they can deviate based on the decision of the Economy Minister.
• All exporting firms in the investment charter will be eligible to be a part of preferred development zone
regime. Manufacturing firms exporting at least 20 percent of their production can benefit from the CEMAC
customs code and will pay no VAT for exported manufactured products.
• In Equatorial Guinea, some tax exemptions are given by the government for some specific sectors, such as oil
and natural gas and public production. The exemptions are negotiated between the firm and the government.
• Gabon provides firms with different types of incentives for job creation; domestic and capital investment;
tourism; and social housing. Firms receive tax credits if they employ Gabonese citizens.
50
• Private domestic investment exceeding XAF 100 million can benefit from tax breaks and custom tariff
privileges. New firms do not have to pay minimum CIT during the first two years of their activities.
Sources: PricewaterhouseCoopers (2017). Worldwide Tax Summaries - Corporate Taxes.
http://www.pwc.com/gx/en/services/tax/worldwide-tax-summaries/downloads.html
Crowe Horwath (2016) Africa Tax Facts Guide. https://www.crowehorwath.net/uploadedFiles/MU/additional-
content/home/Africa%20Tax%20Facts%20Guide%202016.pdf
Note: This is not a complete list of all tax incentives and codes in the listed countries.
4.9. Similar to value-added taxation, the excise tax rates, in practice, differ between member
countries. Excise taxes are used primarily to increase public revenues and are imposed on luxury goods
or products that can be dangerous for the health and environment. The CEMAC members can choose
applicable rates within prescribed bands to achieve their public revenue targets and have a single list of
products to determine the tax base (Doe, 2006). The CEMAC countries can freely choose excise tax rates
within the bracket of 0–25 percent.
4.10. The harmonization and reduction of international taxes is expected to benefit production and
the competitiveness of the region. As presented above, the CEMAC region started to apply common
external tariff rates in 1994 (Keen and Mansour, 2009). But, at the national level, some differences are
observed. With the agreement on common tariff rates, the share of international taxes has started to
decline. Currently, the contribution of custom tariffs to tax revenues is low at around 20 percent.
However, still the share of international taxes in the region can get even lower given the low share of
international taxes in total tax revenues in other regions in SSA.
4.11. Taxes on financial returns are also important determinants of firm-level financing and
investment decisions. The CEMAC members have a tax treaty for investment return. Capital gains (from
the transfer of assets), dividend income, and interest income are all subject to the 15 percent tax rate,
but the rates may differ slightly from one country to another.
C. The tax revenue performance in CEMAC
4.12. Low tax revenues are one of the factors hampering economic growth. The tax revenue share as
percent of GDP is relatively low in Sub-Saharan Africa compared to the other regions of the world
(Bayraktar, Le, Moreno-Dodson, 2016). This restricts the available funds to finance much-needed public
spending to promote growth.24
Since the CEMAC countries have a series of restrictions regarding
borrowing funds and do not have independent monetary policies to support their stimulus fiscal policies
(because they are part of a monetary union), low tax revenues imply low public spending. The member
states do not have a strictly binding fiscal rule, but taxes sometimes decline so sharply, especially due to
low prices of natural resource, that they are not able to close the revenue gap and need to cut public
spending, especially investment spending to balance their budget.
Overall tax developments
4.13. Tax revenues remain low in CEMAC. Figure 32 presents total taxes in percent of GDP. Despite
the fact that CEMAC member countries aim to reach the objective of government tax revenue of 17
24
In a related study, Moreno-Dodson and Bayraktar (2018) present that the capital component of public expenses
is especially essential for economic growth in the WAEMU region. It is expected to be similar for the CEMAC
region.
51
percent of GDP, the average ratio was only 11.5 percent in 2016, which, however, represented an
increase from 7.5 percent in 1997.25
As a comparison, the share of taxes in GDP was 16 percent in
WAEMU in 2015 (Moreno-Dodson and Bayraktar, 2018).
4.14. While indirect domestic taxation represents the highest tax revenue component in the CEMAC
region, the share of taxes on international trade has been declining but still higher than the rate
observed in the WAEMU (Figure 26).26
International taxes declined from 10 percent of GDP at the
beginning of the 1980s to 6 percent in 2016 throughout the trade liberalization process. The lowest
point was 5 percent in 2004. As a comparison, the share of international taxes in percent of GDP has
been lower than 5 percent in recent years in the WAEMU (Bayraktar and Moreno-Dodson, 2018).
Figure 26. Composition of Government Tax Revenues as a Percent of GDP, CEMAC, 1980–2016
Sources: Keen and Mansour 2010a, 2010b; Mansour 2014; WEO, and ICTD.
Development of selected tax sources
4.15. Taxes on income, profits and capital gains represent the highest proportion of tax revenues in
the region. Figure 27 presents the share of (i) taxes on income, profits and capital gains by corporations,
(ii) taxes on trade in total tax revenue, and (iii) taxes on goods and services for the average of the
CEMAC. Even though taxes on income, profit and capital gains declined since 2006, the tax share was
still close to 37 percent in 2016. As a comparison, this type of tax has the lowest share in the WAEMU
region with only 10 percent of total tax revenues on average in 2015 (Bayraktar and Moreno-Dodson,
2018). The share of taxes on goods and services (VATs and excise taxes) has declined slightly, but its
value is almost flat around 30 percent of total taxes. In contrast, this type of taxes has been declining in
the WAEMU region and its value was close to 40 percent on average in 2015, almost 10 percentage
point higher than in CEMAC (Moreno-Dodson and Bayraktar, 2018). The share of international taxes is
low at 20 percent of total taxes. Given its slightly declining trend, it may drop further in the future. In the
25
It should be noted that corruption in tax and customs administrations also contributes to relatively low tax
collection in the CEMAC region.
26
Direct and indirect taxes are taken from the database of the ICTD. They are constructed based on the IMF’s GFS
and country reports. Some data points have also been collected from Keen and Mansour (2010a and 2010b) and
Mansour (2014). Indirect taxes include all domestic consumption taxes, such as sales taxes of various sorts,
including value-added taxes (VATs), and excise taxes. Direct taxes are corporate, personal income, and financial
investment taxes.
0
10
20
30
General government taxes (in % of GDP)
General government taxes on international trade
and transactions (in % of GDP)
Direct taxes (in % of GDP)
52
WAEMU region, the share of taxes on trade in total taxes was 32 percent in 2015 (Moreno-Dodson and
Bayraktar, 2018).
Figure 27. Selected Taxes (% of general government taxes, country averages)
Source: Calculations based on WEO data.
4.16. The tax structures of the individual CEMAC countries reflect national choices in tax policy,
despite their dependency on natural resources. Figure A.1 in the Annex shows that the share of taxes
on goods and services (mainly VATs and excise taxes) is the highest in Cameroon and the Central African
Republic. Even though it does not have the highest share, taxes on goods and services are still dominant
in the Republic of Congo. On the other hand, in Chad, Equatorial Guinea, and Gabon, taxes on goods and
services only minimally contribute to total taxes.
4.17. Revenues from corporate income taxes cannot be considered high on average in the CEMAC
region when compared to the other regions in the world, but significant differences in the level of
taxation can be observed at the national level. The share of taxes on profits, income and capital gains
paid by corporations is relatively low in Cameroon, Central African Republic and Chad, but substantially
higher in Equatorial Guinea. Similarly, the share, including personal income taxes as well, is also high in
the Republic of Congo. The share of income taxes, including both corporate and personal income taxes,
has been declining in Gabon, but it is still the dominant tax in this country.
4.18. Similarly, the importance of trade taxes varies significantly across countries. According to
Figure A.1, trade taxes are dominant in Chad with a large increase in 2004. As a comparison, the share of
international taxes in Cameroon, the Republic of Congo, and Equatorial Guinea is relatively low with a
declining trend. In Gabon, even though trade taxes have declined they are still dominant.
Corporate income and labor taxes
4.19. Labor taxes are high in CEMAC, which can create disincentives for firms. Figure 28 shows data
on corporate income and labor taxes in the CEMAC region as well as in other related regions. Labor
taxes (as a share of profits) are higher than corporate income taxes (CIT) in the Republic of Congo,
Equatorial Guinea, and Gabon. High labor tax rates in these countries make the tax systems more
regressive. Oppositely, in Cameroon the labor tax rate amounts to the half of the CIT rate. On average
the shares of labor taxes and CIT are almost the same in the CEMAC region as a whole. On the other
hand, while the share of labor taxes is almost the same in WAEMU, the share of CIT in profits is much
0
20
40
60
General government taxes on goods and services
General government taxes on income, profits, and capital gains,
payable by corporations
General government taxes on international trade and transactions
53
lower due to lower effective CIT rates. It is not reported in the graph, but in almost each WAEMU
country, the share of labor taxes is twice as high as the share of CIT (Moreno-Dodson and Bayraktar,
2018). When compared to Sub-Saharan Africa and low-income countries in general, labor taxes and
contributions are significantly higher in the both CEMAC and WAEMU regions.
4.20. In addition to high labor taxes, the effective CIT rate is also high in CEMAC when compared to
the level in other regions. High CIT rates combined with high labor taxes present a significant
disadvantage for firms in the CEMAC region and constitute an obstacle for doing business. Such high tax
rates also prevent these countries attracting foreign investments which can be important for businesses
and job creation in low-income countries (Van Parys and James, 2010). Furthermore, a general view
holds that labor taxes negatively affect labor demand, particularly where the tax cannot be shifted
forward onto prices (competitive output markets) or backward onto wages (e.g. where wages are at or
just above a minimum wage). Working at minimum wages, the integration of informal sector jobs and
activities into formal sector is in particularly negatively impacted by labor wages.
Figure 28: Effective and corporate income taxes and labor taxes and contributions, 2013-2016
Source: Calculations based on Doing Business (database), International Finance Corporation and World Bank, Washington, DC,
http://www.doingbusiness.org/data; PWC.
Note: The Doing Business database covers only domestic small and medium enterprises (SMEs).
4.21. There is a significant gap between statutory and effective tax rates in CEMAC. The largest gap
between two rates is observed in the Republic of Congo (Figure 28), where the statutory rate is almost
the double of the effective rate. While the Republic of Congo collects the lowest effective rate in the
region, Cameroon charges the highest effective tax rate.
4.22. Total effective tax rates (labor, corporate income and other taxes) in the CEMAC region are
lower than the average rates in Sub-Saharan Africa and low-income countries. According to Figure 29,
0
5
10
15
20
25
30
35
40
Effective corporate tax rate Labor tax and contributions Statutory corporate tax rate
54
even though total taxes paid by corporations (corporate income, labor, and others27
) as a share of
profits are higher in CEMAC than the rates in the WAEMU region, they are much lower than the average
rates in Sub-Saharan and low-income countries. However, many firms in CEMAC still perceive taxes as a
major obstacle for investment (Table 10). This might be due to the presence of highly distortionary
investment tax incentives in the region. While some privileged firms enjoy lower taxes thanks to
government policies involving special investment incentives which lead to lower tax collection in total,
many other firms, especially small size ones, end up paying full taxes and struggle to compete in the
market.
Figure 29. Effective Total Taxes Paid by Enterprises (Labor, Corporate Income and Other), % of Profit,
average between 2005 and 2016
Source: Calculations based on Doing Business (database), International Finance Corporation and World Bank, Washington, DC,
http://www.doingbusiness.org/data.
Note: The total tax rate covers taxes on corporate income, taxes on labor, and other taxes, which include property taxes,
property transfer taxes, dividend taxes, capital gains taxes, financial transactions taxes, waste collection taxes, vehicle and road
taxes, and any other taxes or fees. For Central African Republic, the reported rate is for the years between 2011 and 2016.
4.23. Total effective tax rates differ significantly across the CEMAC countries and are not
converging. Figure 29 presents that the total tax rate is highest in Chad and in the Central African
Republic, and Gabon has the lowest overall rate. An analysis of the developments of CIT rates over time
shows that there is no clear convergence (Figure 30). One exception, though, is the extractive industries
sector, as defined by governments, where CIT rates are better aligned (Figure A.3 in the Annex). Such tax
disparities within the region put the country with high tax rates in a disadvantaged position in terms of
27
Other taxes include property taxes, property transfer taxes, dividend tax, capital gains tax, financial transactions
tax, waste collection taxes, vehicle and road taxes, and any other small taxes or fees.
0.00
10.00
20.00
30.00
40.00
50.00
60.00
70.00
80.00
55
investment and competition. The differences also indicate that the region needs tax harmonization to
move towards a common market.
Figure 30. Comparison of CIT rates across CEMAC countries (in % of profits), 2009-2015
Source: World Bank “Global Investment Competitiveness Report 2017/2018”. Data for CAR not available. The tax rates apply to
all sectors in Cameroon, Chad and Equatorial Guinea, to all sectors but extractive industries in Gabon and all sectors but
agriculture and fishing, construction and building materials and extractive industries in the Republic of Congo.
Natural resource taxation
4.24. One big weakness of the tax system in the CEMAC region is that the tax base is extensively
dependent on oil related sectors and activities. Figure 31 shows that the share of resource taxes is
close to 30 percent of GDP in Equatorial Guinea and the Republic of Congo.28
When oil prices were high
in the mid-2000s, the share of resource taxes was 50 percent of GDP in Equatorial Guinea and 40
percent of GDP in the Republic of Congo. Such a high share of resource taxes indicates that tax revenues
fluctuate significantly due to changes in international oil prices. This situation introduces instability in
general government spending and public investment and also makes countries vulnerable to factors that
are not under their control. In addition, this narrow, resource dependent tax base, makes governments
less accountable to their population. It should be noted that the share of resource taxes is not high in
each CEMAC country. For example, in Chad and Gabon the share in GDP was around 15 percent in 2012,
while Cameroon reports only 5 percent share.
28
Definition of resource taxes from Mansour 2014 (page 7):
“These include primarily revenues from the Corporate Tax that are collected from extractive activities in the oil and
gas, and mining sectors, and royalties. Revenues from production sharing agreements (PSAs) were included in this
series to the extent that they were paid into the government general fund—which typically occurs in the case of oil
and gas through a national oil company. There is no separation of revenues from oil and gas, and revenues from
mining activities, since most countries do not report revenues at this level of details. However, as shown later, it is
relatively easy to analyze the aggregate relative importance of revenues from each of these two sectors given that
few countries are rich in both hydrocarbons and non-hydrocarbons minerals.”
29
31
33
35
37
39
41
2009 2010 2011 2012 2013 2014 2015
Cameroon Chad Congo, Republic of
Equatorial Guinea Gabon
56
Figure 31. Total resource taxes (% of GDP)
Source: ICTD and Mansour, Mario. 2014
D. Conclusion and policy implications
4.25. Tax policies in the CEMAC region are still mostly diverse and uncoordinated and the current
tax framework – rate structure and exemptions - creates unfair tax competition among member
countries. The CEMAC members had several attempts to improve the structure and coordination of
taxes in the region to increase productivity and investment and achieve the goal of a common market,
but the process has been slow so far. Some rules to harmonize consumption taxes, investment taxes and
international taxes have been introduced, but exceptions at the national level continue to be in place.
Member countries are still in need of tax policies that can lead to higher efficiency and fewer distortions
in their market.
4.26. The tax system in the CEMAC region depends heavily on oil prices and oil-related activities,
but should be broadened out, capturing non-oil economic activities to a much larger extent.
Dependency of tax revenue on natural resources in most CEMAC countries makes them vulnerable to
changes in oil prices and production, thereby hampering government spending and especially public
investment. Tax revenue should be based more on non-oil activities.
4.27. In some CEMAC countries, the tax system depends to a large extent on income taxes and a
more balanced utilization of consumption- and income tax bases should be considered. In addition to
enhancing the productivity of the tax system, due to the enlarged tax bases, a fairer burden sharing may
be the result as well. Statutory corporate income tax rates seem high in the region, which lowers
competitiveness of firms significantly. Labor taxes are high as well. In addition, tax incentives granted on
selected firms can introduce distortions in the market. Shifting taxes from corporate income to
consumption can be helpful to ease the pressure on firms.
4.28. A coherent CEMAC action plan on tax reforms was developed in 2017, addressing policy gaps
and needs of shift in tax mix. In response to the economic and financial crisis, CEMAC has established a
comprehensive economic and financial reform program, to ensure quick and coordinated policy actions
0
10
20
30
40
50
60
19801982198419861988199019921994199619982000200220042006200820102012
Cameroon Central African Rep.
Chad Congo, Rep.
Equatorial Guinea Gabon
57
(CEMAC, 2017). A core pillar of the plan deals with “strengthening tax policy”, where the overall
objective focus on increasing consumption tax revenues in the overall tax mix, in order to promote
firms’ competitiveness. As an important measure, the plan suggests rationalizing tax expenditures by
suppressing inefficient and too generous schemes, and to improve fiscal management of the tax
expenditures as being retained. Tax expenditures on consumption taxes are generally acknowledged as
an inefficient instrument to seek equity, since the absolute subsidy to middle and higher income
household is higher than to low-income. Consequently, the revenue loss is very high which reduces any
fiscal space and hence, prevents initiatives on lowering the statutory rates on CIT, as an example. Some
CEMAC countries, including Cameroon and Gabon, have launched systematic efforts to rationalize tax
expenditures, based on cost-benefit evaluations of the specific areas.
4.29. Capitalizing on the CEMAC action plan, as an immediate reform step, the CEMAC Commission
is encouraged to improve and further enforce the fiscal monitoring framework. The action plan on tax
policy provides a series of specific actions to be undertaken by CEMAC countries, as well as performance
indicators are put in place to track and monitor reform progress. The action plan could be introduced
and monitored in the national budget laws, as well as reported in CEMAC’ wide status reports on
CEMAC’ countries revenue- and broader fiscal status and reform implementation. In a broader
perspective, the implementation of the various areas of the CEMAC action (monetary- and structural
reforms) would be an important contribution to strengthening CEMAC’s surveillance framework.
4.30. The CEMAC countries also need to work harder on harmonizing taxation. Despite several
attempts29
, tariffs and taxes in the CEMAC region differ, in practice, across the member countries.
Multiple VAT rates structure persists (Republic of Congo, Central African Republic), and the VAT
threshold varies, between 10 to 60 million FCFA in business turnover. Since the VAT mechanism,
provided tax administrative capacity of a certain level, is an efficient instrument in formalization of
economic activities (and thus, in revenue generation), the differences in thresholds implies that the
efforts to reduce the informal sector take a very different point of departure across the CEMAC
countries. As another policy topic, a common comment for the whole region is that the members should
adopt a harmonized tax structure for petroleum products. A concerted effort to harmonize taxes is
necessary to move forward with the common market. In the WAEMU region a detailed tax coordination
treaty had already been signed in 1998. Even though tax coordination, in practice, is not still fully
effective in many areas in the WAEMU region, their experience may be helpful for their peers in the
CEMAC region.
29
Reforms have been undertaken to address the list of areas as Doe (2006) suggested on consumption taxes: (1)
Cameroon needs to eliminate the VAT surcharge of 10 percent; (2) Chad should reduce the highest excise tax rate
from 30 percent to 25 percent (harmonized rate); (3) the republic of Congo needs to remove the domestic
consumption tax surcharge of 5 percent; (4) Equatorial Guinea needs to eliminate the multiple rate of the VAT by
the harmonized single rate and to cut the highest excise tax rate from 38 percent to 25 percent; (5) Gabon needs
to eliminate the multiple rate VAT and replace with a single rate VAT; to remove the 20 percent surcharge added
on selected imports; and cut the highest excise tax rate from 32 percent to 25 percent.
58
Annex
Figure A.9. Selected Taxes Expected to affect Production and Investment Decisions among Firms, CEMAC
Countries
Sources: Keen and Mansour 2010a, 2010b; Mansour 2014; WEO (World Economic Outlook Database), International Monetary
Fund, Washington, DC, ICTD https://www.imf.org/external/pubs/ft/weo/2016/01/weodata/index.aspx.
0
10
20
30
40
50
60
1990
1991
1992
1993
1994
1995
1996
1997
1998
1999
2000
2001
2002
2003
2004
2005
2006
2007
2008
2009
2010
2011
2012
2013
2014
2015
2016
Cameroon: Selected General Government Taxes (% of total
taxes)
Taxes on goods and services
Taxes on international trade and transactions
Taxes on income, profits, and capital gains
Taxes on income, profits, and capital gains, payable by corporations
Taxes on income, profits, and capital gains, payable by individuals
0
20
40
60
80
100
1990
1991
1992
1993
1994
1995
1996
1997
1998
1999
2000
2001
2002
2003
2004
2005
2006
2007
2008
2009
2010
2011
2012
2013
2014
2015
2016
Chad: Selected General Government Taxes (% of total taxes)
Taxes on goods and services
Taxes on international trade and transactions
Taxes on income, profits, and capital gains
Taxes on income, profits, and capital gains, payable by corporations
Taxes on income, profits, and capital gains, payable by individuals
0
10
20
30
40
50
1990
1991
1992
1993
1994
1995
1996
1997
1998
1999
2000
2001
2002
2003
2004
2005
2006
2007
2008
2009
2010
2011
2012
2013
2014
2015
2016
Congo, Rep.: Selected General Government Taxes (% of
total taxes)
Taxes on goods and services
Taxes on international trade and transactions
Taxes on income, profits, and capital gains
0
10
20
30
40
50
60
70
80
90
100
1990
1991
1992
1993
1994
1995
1996
1997
1998
1999
2000
2001
2002
2003
2004
2005
2006
2007
2008
2009
2010
2011
2012
2013
2014
2015
2016
Equtorial Guinea: Selected General Government Taxes (% of
total taxes)
Taxes on goods and services
Taxes on international trade and transactions
Taxes on income, profits, and capital gains
Taxes on income, profits, and capital gains, payable by corporations
Taxes on income, profits, and capital gains, payable by individuals
0
10
20
30
40
50
60
70
1990
1991
1992
1993
1994
1995
1996
1997
1998
1999
2000
2001
2002
2003
2004
2005
2006
2007
2008
2009
2010
2011
2012
2013
2014
2015
2016
Gabon: Selected General Government Taxes (% of total
taxes)
Taxes on goods and services
Taxes on international trade and transactions
Taxes on income, profits, and capital gains
0
10
20
30
40
50
60
70
1990
1991
1992
1993
1994
1995
1996
1997
1998
1999
2000
2001
2002
2003
2004
2005
2006
2007
2008
2009
2010
2011
2012
2013
2014
2015
2016
Central African Rep.: Selected General Government Taxes
(% of total taxes)
Taxes on goods and services
Taxes on international trade and transactions
Taxes on income, profits, and capital gains
Taxes on income, profits, and capital gains, payable by corporations
Taxes on income, profits, and capital gains, payable by individuals
59
Figure A.10: CIT rates for extractive industries (%), 2009-2015
Source: World Bank “Global Investment Competitiveness Report 2017/2018”.
0
5
10
15
20
25
30
35
40
45
2009 2010 2011 2012 2013 2014 2015
Cameroon Chad Congo, Republic of Equatorial Guinea Gabon
60
CHAPTER 5: Trade Analysis and Trade Policy in CEMAC Countries
A. Introduction
5.1. Despite a Custom Union, regional integration in the CEMAC zone remains shallow. The
common external tariff is not effectively utilized and member countries continue to apply different rates
on various products depending on their national interests. Numerous obstacles to the free movement of
people and goods remain. As a result, regional trade remains very modest compared to trade with
other parts of the world. Intra-CEMAC trade is estimated to represent only between 2 and 5 percent of
the total trade of the member countries, the lowest of any regional integration community.
5.2. This chapter analyzes recent trends in trade of CEMAC countries and assess the role of trade
policy in regional integration. The first part of the chapter provides a simplified trade analysis for
CEMAC describing the evolution of CEMAC exports in terms of composition and intensity with main
trading partners, with an emphasis on the EU, as well as regional integration intra-CEMAC trade. The
second part focuses on two components of trade policy in CEMAC countries: tariffs and non-tariff
measures (NTMs).
B. Trade analysis for CEMAC countries
Evolution and composition of CEMAC exports
5.3. Exports and imports have increased substantially in the last years. Exports went from an
average of US$4.8bn in the 1980s, 29.4 percent of GDP, to an average of US$37.7bn between 2010 and
2016, 44.9 percent of GDP. The exports surge started in the early 2000s and was mostly driven by oil
exports earnings due to high oil prices and production in the Republic of Congo, Gabon and Equatorial
Guinea. Imports started to increase a few years later and went from an average of US$2.7bn in the
1980s, 16.2 percent of GDP, to an average of US$17.1bn between 2010 and 2016, 19.9 percent of GDP.
The largest increases in imports were recorded by Cameroon, the Republic of Congo and Gabon.
5.4. CEMAC exports have been dominated by petroleum products, which account for about 60
percent of all exports (Figure 32). Petroleum is the most important export product in all CEMAC
countries but the Central African Republic, accounting for more than 60 percent of total exports in the
Republic of Congo, Chad, Equatorial Guinea and Gabon, as shown in Table A.1 in the Annex that
tabulates the top 10 export products (defined according to the Harmonized System at the 6-digit level,
HS-6) for each CEMAC country. The high dependence of CEMAC countries on crude petroleum exports
makes them vulnerable to oil price fluctuations. Since 2014, the price of oil has been on a downward
trajectory, leading to a strong decline in the value of CEMAC petroleum exports. The export value and
share of minerals and metals had risen in the mid-2000s following the surge in commodity prices such as
copper, manganese and natural gas. By 2015, exports of mineral and metals accounted for 18 percent of
all CEMAC exports, however still far below petroleum exports.
5.5. CEMAC countries exhibit very low diversification in terms of exported products, except for
Cameroon, which exports a higher number of products and has a lower degree of export
concentration. Figure 33 measures the export concentration of goods in 2015 in CEMAC according to
61
three indicators: (i) the normalized Hirschman-Herfindahl index30
, (ii) the share of the top 3 exported
products (at the HS-6 digit) in total exports, and (iii) the number of exported products. Chad, Equatorial
Guinea and Gabon have the least diversified export bundle according to all three indicators: Only three
products accounted for over 90 percent of exports in 2015. Cameroon is the most diversified, exporting
1,730 products at HS6 level compared to less than 900 products for the other CEMAC members.
5.6. The Republic of Congo and Equatorial Guinea together account for most of CEMAC’s exports
of petroleum and non-petroleum products. Combined exports from the Republic of Congo and
Equatorial Guinea accounted for 54 percent of CEMAC exports over 2014-2015. Gabon and Cameroon
ranked third and fourth accounting for 22 and 17 percent of CEMAC exports, respectively. Before the
recent global crisis, Cameroon was the main exporter of non-petroleum products; the Republic of Congo
and Equatorial Guinea’s non-petroleum exports have surged ever since. Cameroon’s non-petroleum
exports are dominated by agricultural and food products such as cocoa beans, bananas and cotton.
Equatorial Guinea’s rise in non-petroleum exports is attributed to natural gas, propane and butane,
which accounted for 76 percent of the country’s non-petroleum exports in 2015. The rise in Congolese
non-petroleum exports was mainly led by booming minerals exports – especially copper.
Figure 32: Export value by category and petroleum export share in CEMAC trade
Source: World Bank Staff estimates using the CEPII-BACI database.31
Figure 33: Concentration of goods exports in 2015
30
The Hirschman-Herfindahl index is the sum of squared shares of each product in total export. A country with a
perfectly diversified export portfolio will have an index close to zero, whereas a country which exports only one
export will have a value of one (least diversified).
31
Food and Agricultural products are defined using the WTO classification at HS6 level. Food and Agricultural
goods cover HS chapters 1 to 24, as well as a number of manufactured agricultural products in chapters 29, 33, 35,
38, 41, 43, 50, 51, 52 et 53. Petroleum include HS 270900 «Petroleum oils and oils obtained from bituminous » and
271000 « Petroleum oils, etc, (excl. crude); preparation ».
0
10
20
30
40
50
60
70
80
90
0
10
20
30
40
50
2000200120022003200420052006200720082009201020112012201320142015 %
BillionUSD
Petroleum Minerals and metals Wood
Food and Agriculture Other Petroleum (Exp. Share)
62
Source: World Bank staff estimates using the CEPII-BACI database.
Note: The Herfindahl concentration index is constructed using the sum of the squares of product shares in total export at HS6
level.
Figure 34: Non-petroleum export value by country
Source: World Bank staff estimates using the CEPII-BACI
database.
Figure 35: Petroleum export value by country
Source: World Bank staff estimates using the CEPII-BACI
database.
CEMAC – trade with main partners
5.7. CEMAC’s trade with EU countries has strongly declined over the past two decades. During the
first half of the 2000s, the EU was CEMAC’s main trading partner accounting for more than half of
CEMAC’s non-petroleum exports (Figure 36). In 2015, however, only 33 percent of CEMAC’s non-
petroleum exports and 22 percent of petroleum exports were directed to the EU. Imports from EU
countries accounted for about 56 percent of CEMAC imports in 2000, but their share has fallen below 40
percent since 2012 (Figure 38). Exports to the US are mostly composed by petroleum and have fallen
since 2010.
5.8. On the contrary, CEMAC’s exports to Asian countries have expanded significantly, with China
itself accounting for 16 percent of CEMAC’s non-petroleum exports and 24 percent of its petroleum
0
500
1000
1500
2000
0.00
0.20
0.40
0.60
0.80
1.00
Cameroon Central African
Republic
Chad Congo Eq. Guinea Gabon
Numberodproducts
Norm. Herfindhal (export) Share of top 3 products Number of exported products
0.0
1.0
2.0
3.0
4.0
5.0
2000 2002 2004 2006 2008 2010 2012 2014
BillionUSD
Cameroon CAR
Chad Congo
Gabon Equatorial Guinea
0
2
4
6
8
10
12
2000 2002 2004 2006 2008 2010 2012 2014
BillionUSD
Cameroon CAR
Chad Congo
Gabon Equatorial Guinea
63
exports in 2015 (Figure 37). The EU's share in CEMAC’s imports has fallen while imports from Asia have
surged. China alone is the source of one-fifth of CEMAC’s imports and non-CEMAC African countries are
the fourth source of CEMAC’s imports, behind the EU, China and the rest of Asia. Exports of minerals
and metals dominate exports to non-CEMAC African countries and Asian countries other than China. The
EU is the only destination where food and agricultural products represent a significant share of CEMAC’s
exports.
Figure 36: Extra-community exports of non-petroleum products to various partners
Source: World Bank staff estimates using the CEPII-BACI database.
Figure 37: Extra-community exports of petroleum products to various partners
Source: World Bank staff estimates using the CEPII-BACI database.
0
2
4
6
8
10
12
14
0
10
20
30
40
50
60
70
2000200120022003200420052006200720082009201020112012201320142015
BillionUSD
%
Export value EU China USA
Rest of Africa Rest of Asia Other countries
0
5
10
15
20
25
30
35
0
10
20
30
40
50
2000 2001 2002 2003 2004 2005 2006 2007 2008 2009 2010 2011 2012 2013 2014 2015
BillionUSD
%
Export value EU China USA
Rest of Africa Rest of Asia Other countries
64
Figure 38: Extra-community imports from various origins
Source: World Bank staff estimates using the CEPII-BACI database.
0
5
10
15
20
25
0
20
40
60
80
2000 2001 2002 2003 2004 2005 2006 2007 2008 2009 2010 2011 2012 2013 2014 2015
BillionUSD
%
Import value EU China USA
Rest of Africa Rest of Asia Other countries
Box 7. Trade and Economic Growth in CEMAC: Regression Analysis
Calderon and Cantu (2018) investigate the effects of trade openness, diversification, and the role of natural resources on
growth in CEMAC countries. The following findings emerge from the analysis:
• Growth per worker. Trade openness —proxied by the ratio of exports and imports to GDP— has a positive,
significant and causal relationship with growth. Product concentration has a negative and significant
relationship with growth per worker, and market concentration has a small positive and significant impact on
growth. The share of natural resource exports in total exports also exhibits a negative and significant
relationship. This implies that growth is fostered by higher trade integration, a more diverse basket of products
to export, and lower dependence of natural resources in the structure of exports.
• Channels of transmission. Trade openness has a positive impact on both growth of capital per worker and TFP
when we do not control for natural resources. A more diverse structure of exports would lead to greater
growth in capital stock and TFP —especially when we account for the presence of natural resources in the
regression analysis. The structure of trading partners, on the other hand, does not exhibit a robust relationship
with the sources of growth. Finally, a greater dependence on natural resources in the export basket hinders the
growth of capital stock and TFP.
Simulation of Growth Impact:
Calderon and Cantu (2018) compute the growth benefits of closing the gap in terms of trade openness, product
diversification and share of natural resources in total trade with respect to the top growth performers in the region:
growth per worker of the CEMAC region would gain 0.24 percent per year if CEMAC countries were to close the gap in
trade openness with the SSA average (that is, an increase in the growth rate by around 5 percentage points over the
next two decades). Growth benefits would be larger for Cameroon (1.1 percent per year) and Central African Republic
(1.4 percent). Similarly, if CEMAC were to close the product concentration gap with the SSA average, there would be
much larger gains (of about 2.2 percent of growth per worker per year). The largest growth gains from diversification
among CEMAC countries come from DRC (2.4 percent) and Central African Republic (2.0 percent). The largest gains in
terms of growth seem to originate from reduced product concentration. Most of the countries would benefit from at
least a minimum of 1 percent per year in additional output growth.
65
Trade agreements
5.9. With some variations, most CEMAC countries are beneficiaries of unilateral preferential
regimes extended by developed countries. All CEMAC countries except Equatorial Guinea are eligible
for preferential market access to the United States under it Generalized System of Preferences (GSP)
program. Equatorial Guinea was removed from the U.S. GSP program in January 2011. The least
developed countries in the CEMAC region are eligible for duty-free and quota-free market access into
the EU market under the Everything but Arms (EBA) initiative. This includes the Central African Republic,
Chad, and Equatorial Guinea. The latter graduated in 2017 from the list of LDCs, per the UN
classification, and will lose preferential market access under the EBA program. The Republic of Congo
benefits from unilateral preferences only under the EU Generalized Scheme of Preferences (GSP)
scheme32
, while Gabon, an upper-middle income country, is no longer eligible for the new GSP scheme
since January 2014.
5.10. The EU is currently in negotiations about an Economic Partnership Agreement with Cameroon,
the Central African Republic, Chad, the Republic of Congo, Equatorial Guinea and Gabon. The ongoing
negotiations for a comprehensive Economic Partnership Agreement between the EU and Central Africa
include areas such as rules and commitments on goods and rules of origin, services and investment,
sustainable development, competition and trade facilitation. A cooperation on technical barriers to
trade and sanitary and phytosanitary standards is also foreseen.
5.11. Cameroon signed an interim Economic Partnership Agreement (EPA) with the EU. Cameroon
and the EU agreed on an interim EPA on December 2007 and signed it on January 2009.33
The
agreement was approved by the European Parliament in June 2013 and ratified by Cameroon in July
2014. Provisional application became effective on 4 August 2014. This agreement provides duty-free,
quota-free EU access for all goods from Cameroon and a gradual removal of duties and quotas over 15
years on 80 percent of EU exports to Cameroon. By agreeing, signing and ratifying the agreement,
Cameroon prevented a disruption in preferential market access to the EU previously granted by the
Cotonou Agreement that expired on 31 December 2007.
5.12. The interim EPA also provided the liberalization of Cameroon’s tariff on EU products, which is
a deviation from the CEMAC’s Common External Tariff (CET). The interim agreement also provides a
schedule for tariff liberalization on EU products into Cameroon for certain products. A customs union,
like CEMAC, is expected to have a CET for goods entering the customs union through any of this
countries member. As members of a customs union apply zero-tariffs on imported products originating
in another member, a lower tariff on imports originating outside the customs union may provoke trade-
deflection34
. The agreement also excludes some other EU products from liberalization to ensure
Cameroon the protection of some sensitive agricultural markets and industries, but also to maintain
32
The Generalized Scheme of Preferences (GSP) scheme provide tariff reductions in about 66 percent of tariff lines
or products originating in beneficiary countries. The GSP is less generous than EBA.
33
The text of the interim EPA can be found at:
http://eur-lex.europa.eu/legal-content/EN/TXT/PDF/?uri=CELEX:22009A0228(01)&rid=2
34 Trade deflection happens when a product is imported into a trade agreement bloc through the country with the
lowest external tariff and is re-exported duty-free to a partner in the trade agreement, thereby generating rents.
66
fiscal revenues.35
Cameroonian authorities started cutting tariffs on some products starting in August
2016. According to the European External Action Service (2018), these products include inputs for
processing industry, transport and construction. Commentators also suggested that other countries in
the region may be considering bilateral agreements with other partners such as China.
5.13. Besides preferential market access for goods, the interim EPA with the EU also cover a myriad
of domains, such as aid for trade, trade facilitation, institutional issues, and dispute settlement. The
interim EPA also includes "rendezvous" clauses providing for further negotiations on other trade-related
issues such as trade in services, competition policy, intellectual property, investment measures, etc. It is
often argued that free trade agreements (FTAs) between large countries and smaller developing
countries may serve as “policy anchors” by acting as a mechanism for the smaller developing country to
make credible commitments to policy reform in different areas which they might not otherwise make.
For instance, Ferrantino (2006) shows that Mexico’s negotiation of NAFTA (signed in 1994) served as
“anchor” policy commitments that would be difficult to undone later.
5.14. The share of CEMAC’s exports to the EU that currently use preferential market access is small.
EUROSTAT reports detailed data on EU imports under each trade regime, which allows analyzing the
extent of preferential market access granted by the EU. Table 16 reports total exports to the EU for each
CEMAC country (column I) except Gabon36
, the value of exports eligible to EU preferences as the EU
MFN tariff in these products is positive37
(column II), and the value of exports effectively entering the EU
under preferences (column III). The share of exports to the EU eligible to preferences (column IV) is
below 5 percent in all countries, except for Cameroon. Indeed, only 14 percent of Cameroonian exports
to the EU are eligible for preferences, and the share of eligible export reaches 21 percent for
Cameroonian food and agricultural products. The MFN tariff applied by the EU is zero for most
petroleum products that dominate CEMAC exports, which excludes them from preferences eligibility.
The utilization rate of preferences (column V) is the ratio of EU imports from a given country entering
under preferential treatment to total EU imports of products eligible for preferences from the same
country (i.e. imports with a positive MFN tariff). When disaggregated by product category, utilization
rates seem higher for products with large export volumes like exports of food and agricultural products
from Cameroon or minerals and metals exports from the Republic of Congo and Equatorial Guinea.38
35 Article 21 and Annex III of the agreement define the products to be liberalized in the Cameroonian market
(designated as categories 1, 2, and 3) and their tariff liberalization schedule, as well as those products exempted
from liberalization (category 5).
36
As discussed before, Gabon is not eligible for preferential market access to the EU.
37
Products for which the EU has a zero MFN tariff do not qualify for preferential access since exports from any
country enter the EU duty-free regardless of whether it has signed a trade agreement with the EU. Thus, we do not
count them as produces eligible for EU preferences.
38
For other African countries with larger exports of food and agricultural products to the EU, such as Ivory Coast,
Ghana, Nigeria, South Africa and Senegal, the share of exports eligible for EU preferences and their utilization is
higher, as shown in Table A2 of the Annex.
67
Table 16: Preference utilization rates of exports to the EU by country in 2016
Category
Total
exports to
the EU (1000
euros)
Value of exports
to the EU eligible
for preferences
(1000 euros)
Value of exports
entering the EU
under preferences
(1000 euros)
Share of
eligible
exports
Utilization
rate of
preferences
(I) (II) (III) (IV=II/I) (V=III/II)
Central African Republic
Food and Agriculture 16,387 502 6 0.03 0.01
Petroleum 0 0 0 0 0
Minerals and metals 0.03 0 0 0 0
Total 16,387 502 6 0.03 0.01
Cameroon
Food and Agriculture 955,633 202,141 194,289 0.21 0.96
Petroleum 576,496 12,222 6,109 0.02 0.5
Minerals and metals 49 0 0 0 -
Total 1,532,179 214,363 200,399 0.14 0.93
Chad
Food and Agriculture 18,756 1,077 0 0.06 0
Petroleum 96,963 0.5 0 0 0
Minerals and metals 1 0 0 0 0
Total 115,721 1,077 0 0.01 0
Congo
Food and Agriculture 711,401 13,068 1,592 0.02 0.12
Petroleum 334,585 20,987 1,368 0.06 0.07
Minerals and metals 18,517 16,083 11,370 0.87 0.71
Total 1,064,504 50,139 14,331 0.05 0.29
Equatorial Guinea
Food and Agriculture 173,538 11,636 6,449 0.07 0.6
Petroleum 1,055,855 0.2 0 0 0
Minerals and metals 12,517 12,500 12,494 1.00 1
Total 1,241,911 24,137 18,943 0.02 0.78
Source: World Bank staff estimates using data from EUROSTAT
5.15. Concluding agreements with developed countries would be a way to maintain long-term
preferences as well as to spur domestic reforms. Unilateral preference has often expired or countries
have been taken out of the beneficiary list for different reasons. The literature highlights the importance
of reducing trade policy uncertainty for long-term investment and institutional reform.39
Reciprocal tariff
liberalization would also bring benefits to firms that import capital goods and intermediate goods,
helping the economy become more productive. FTA agreements with “North” countries tend to be
39
For example, Edwards and Lawrence (2012).
68
deeper than South-South agreements, and certainly deeper than unilateral preferential regimes. The
Economic Partnership Agreements (EPAs) while not the deepest agreements per global standards, go
beyond commitments to reduce tariffs and include disciplines in Sanitary and Phyto-Sanitary (SPS)
measures and Technical Barriers to Trade (TBT) measures, provisions on trade facilitation and trade
capacity building, and “rendez-vous clauses” in view to continue deepening the agreement in other
areas of reform, such as services trade, competition, intellectual property, and investment.
5.16. For Equatorial Guinea, the process of a WTO accession can be an important driver of reform
and higher integration into the global economy. Equatorial Guinea is the only CEMAC country that is
not yet part of WTO, while the country expressed interest in joining in 2008, there has been little
progress to date. The WTO provides a rules-based trading system with guaranties for market access in
terms of most-favored nation and national treatment. Moreover, the process of accession involves
bilateral, plurilateral, and multilateral negotiations that can accelerate domestic reforms towards
improving the environment for investment in trade-oriented economic opportunities. WTO accession
has been used as a platform to launch, deepen and consolidate a structural transformation of the
economies of acceding governments.40
An accession process typically involves a series of economy-wide
reforms undertaken by the acceding government, which are made in the framework of multilateral
trading rules.
5.17. The CEMAC countries are also involved in other integration efforts in Africa. The CEMAC
countries are founding members of the African Union (AU) initiated in 2002, which aims at
strengthening regional economic communities in African and the recently signed Continental Free Trade
Area (CFTA). The AU recognizes 8 regional economic communities of which CEMAC is included as part of
the Economic Community of Central African States (ECCAS).41
CAR and Chad are also members of
another regional economic community, the Community of Sahel-Saharan States (CEN-SAD). With its
customs union, trade integration in CEMAC is more advanced, relative to ECCAS or CEN-SAD.
Regional integration and intra-community trade
5.18. Regional integration remains weak among CEMAC countries, despite being a customs union42
.
CEMAC has not been successful at promoting trade among its members. As a way of comparison, Table
17 reports the evolution of the share of intra-regional exports of total exports for CEMAC as well as
selected African and non-African preferential trade blocs. The share of intra-regional exports is the
lowest across periods for CEMAC and has not exceeded an average of 4 percent. Intra-regional trade has
been higher in ECOWAS, COMESA, SADC, WAEMU. Among African trade blocs in Table 17, EAC has
experienced the highest share of intra-regional trade, even above MERCOSUR, a South American
customs union, but below ASEAN (Association of Southeast Asian Nations). Food and agriculture is the
only product category in which the reported intra-CEMAC export share is above 5 percent of total
exports for all years except 2013 (Figure 39). Yet, the value and the proportion of food and agriculture
exports in internal trade have declined over the past ten years and accounted for only 10 percent of
intra-community exports in 2014-2015. CEMAC countries do not trade much of petroleum, minerals and
metals, and wood products within the region.
40
See for instance, the evidence found by Haddad, Hollweg and Portugal-Perez (2015).
41
ECCAS includes all CEMAC member, plus Angola, Burundi, D.R. Congo, and São Tomé and Principe.
42
Typically, a customs union has a common external tariff (CET) and its members trade their products duty-free.
69
Table 17: Share of intra-regional exports for selected trade blocs.
Share of intra-regional exports
2000-2004 2005-2009 2010-2014 2015-2016
CEMAC 1.6 2.9 3.3 1
ECOWAS 9.4 9 7.4 8.1
COMESA 4.7 5 7.8 9
SADC 9 9.9 11.6 10.8
WAEMU 14.2 14.1 12.8 11.1
MERCOSUR 12.3 13.2 13.6 12.9
EAC 16 15.4 16.5 15.7
ASEAN 20.6 21.8 22.5 21.5
Source: World Bank staff estimates using CEPII-BACI data.
Figure 39: Share of intra-community exports in CEMAC exports by category
Source: World Bank staff estimates using CEPII-BACI data. Note: Each bar represents the share of intra community exports in
total CEMAC exports by category. For instance, in 2000, exports of food and agricultural products to CEMAC members
accounted for 6 percent of CEMAC exports of food and agricultural products.
5.19. However, informal cross-border trade, particularly by small-scale informal traders, is of
considerable importance in the CEMAC region. Informal cross-border trade seems to be significant in
many African countries. According to Ayadi et al. (2013) although informal trade represents only a small
share of Tunisia’s total trade (5 percent of total imports), informal trade is an important part of the
Tunisia’s bilateral trade with Libya and Algeria; it accounts for more than half the official trade with
Libya and more than total official trade with Algeria. Similarly, in Niger, where smuggling of
hydrocarbons and revenue losses due to domestic sales intended for export are the main sources of
revenue losses, informal trade accounts for US$40 per capita per year, which, however, is still low
compared to US$250 per capita per year in South Nigeria (World Bank 2017b). It can be expected that
the informal cross-border trade is of similar significance in the CEMAC region, thereby leading to under-
recorded trade statistics within the region. Research on informal trade and smuggling in Africa attributes
0
2
4
6
8
10
12
2000 2001 2002 2003 2004 2005 2006 2007 2008 2009 2010 2011 2012 2013 2014 2015
%
Total Food and Agriculture Petroleum Minerals and metals Wood
70
smuggling, informal cross-border trade, and customs fraud to two main causes: (1) differences in prices
and tax burdens in neighboring countries; and (2) the complexities of customs clearance procedures and
internal control issues in customs units (World Bank 2017b).
5.20. Regional trade within CEMAC countries is impeded by supply-side limitations, poor
infrastructure, remaining tariffs and non-tariff barriers, behind-the-border barriers, as well as the lack
of trade complementarity. Trade complementarity indices can be calculated to measure the overlap of
what two countries sell to and buy from each other to evaluate if they are natural trading partners.43
The index ranges between 0 and 100, with 100 indicating a perfect overlap. Figure 40 reports trade
complementarity indices for CEMAC exports to the same bloc as well as other countries. Subject to the
data caveat on unreported trade in the region, the degree of overlap between what CEMAC countries
sell to and buy from each other is significantly lower than the degree of complementarity between these
countries and some principal trading partners. The highest complementarity is recorded for top EU
partners (average of France, Belgium, Italy and Spain); almost twice as the complementarity between
CEMAC countries.44
Figure 40. Trade Complementarity Indices for CEMAC countries, 2014
Source: Staff calculations using data of WITS.
Notes: Top EU partners includes France, Belgium, Italy, and Spain. CEMAC includes CAR, Cameroon, and Congo.
C. Trade policy in CEMAC
Import tariffs
5.21. CEMAC’s common trade policy includes two main instruments: the common external tariff
(CET) and a zero-rate preferential tariff for intra-CEMAC trade, both of which have been subject to
flaws. During its summit in October 2017 in N’Djamena the Conference of CEMAC Heads of State
confirmed the need for improved implementation of the CEMAC trade regime and recommended that
states should exercise the greatest caution in applying the CEMAC common trade policy instruments.
43
The trade complementarity index is estimated for each country pair, for each direction of trade. For the
complementarity index among CEMAC, the index between CAR, Cameroon, and Congo is calculated for each
direction of trade and then the average among the 6 pairwise indices is taken. Indices are averaged similarly for
other countries.
44
As a comparison, the complementarity for the pair France and Belgium would average 71 percent.
0
5
10
15
20
25
30
35
40
45
Other CEMAC Top EU China USA
Percent
71
5.22. As a block, CEMAC countries apply relatively high tariffs (i.e. CET) to imports from third
countries. The CEMAC CET schedule contains 5,478 tariff lines with all tariffs applied in an ad-valorem
basis over the CIF import value. The common external tariff (CET), adopted in 2000, comprises five duty
rate categories (Figure 41) as follows: a 0 percent tariff for certain cultural and aviation products (31
tariff lines or 0.6 percent of lines); a 5 percent tariff for basic needs (281 tariff lines or 5.1 percent of
lines); a 10 percent tariff for raw materials and capital goods (2,510 tariff lines or 45.8 percent of lines);
a 20 percent tariff for miscellaneous goods (671 tariff lines or 12.3 percent of lines); and a 30 percent
tariff for consumer goods (1,968 tariff lines or 35.9 percent of lines). For 17 tariff lines, the CEMAC tariff
schedule does not determine a CET.
Figure 41: Frequency of CET bands
Source: World Bank staff estimates using the CEMAC tariff schedule.
5.23. The average tariff based on the CET is about 18.1 percent, across all tariff lines. By global
standards, tariffs are high, with double-digit average tariffs across sectors of the economy (Table 18).
Tariffs are particularly high for certain manufactured goods such as footwear, where more than 90
percent of tariff lines are in the highest tariff band of 30 percent; and for stone, ceramic, and glass
products, where more than 80 percent of tariff lines pay the highest duty rate of 30 percent. Food
products are also highly protected with an average tariff of close to 25 percent.
5.24. Neighboring countries in ECOWAS maintain a CET with similar 5 tariff band levels, but the
CEMAC CET is, on average, more restrictive. The ECOWAS tariff schedule establishes tariff rates at 0, 5,
10, 20, and 35 percent. However, the top band that assess tariff duties at 35 percent (versus 30 percent
in CEMAC) applies only to 196 tariff lines (versus 1,968 tariff lines in CEMAC’s top duty band of 30
percent). Thus, the simple average tariff in the ECOWAS tariff schedule is 12.4, versus 18.1 in the CEMAC
tariff schedule.
0
.1.2.3.4.5
Fraction
0 10 20 30
Ad-varolem duty, percent
72
Table 18. CEMAC Common External Tariff, by broad sectors
Percentage of tariff lines by duty rate
Aver. tariff Duty-free 5% 10% 20% 30%
Animal products 22.1 0.0 10.2 1.5 49.6 37.9
Vegetable prod. 23.7 0.0 10.6 17.3 1.8 70.4
Food prod. 24.6 0.0 10.2 13.6 1.3 74.6
Minerals 10.4 0.0 4.5 89.2 6.3 0.0
Fuels 10.2 0.0 0.0 98.3 1.7 0.0
Chemicals 11.1 0.0 13.5 76.5 1.5 7.9
Plastic and rubber 15.7 0.5 3.7 64.8 2.3 28.7
Hide and skins 19.3 0.0 0.0 52.9 1.4 45.7
Wood and paper prod. 21.7 4.2 5.1 27.3 1.8 60.7
textiles and textile prod. 21.9 0.0 0.5 30.0 19.3 50.2
Footwear and headgear 29.1 0.0 0.0 0.0 8.5 91.5
Stone, ceramic, glass prod. 26.1 0.0 0.5 18.8 0.0 80.7
Base metals 16.6 0.0 0.5 54.9 22.8 21.6
Machinery, elect. equip. 13.8 0.3 0.1 72.6 15.9 11.2
Vehicles and transport 15.0 8.2 1.8 49.4 22.4 18.2
Misc. 21.5 0.0 9.8 24.2 10.6 54.1
Source: Estimates based on the CEMAC tariff schedule.
5.25. Additional taxes and fees are assessed on imports into CEMAC that further increase customs
charges on imports on top of already high import duties. Some of these charges include a statistical tax
of up to 2 percent and taxes to support integration institutions (TCI, CCI, and OHADA taxes) that add up
to 1.45 percent. At least in some CEMAC countries, several agricultural goods are still charged a
Community Preference Levy (TPC) of 0.4 percent, which elimination should be considered. Excise taxes
(ranging from 20 to 50 percent) may apply to certain luxury and durable goods and to beverages and
tobacco. And a VAT of 18 percent is also generally applied.
5.26. Eliminating the top tariff band of 30 percent to converge to a tariff schedule with only 4 bands
would simplify the tariff regime and lower the average level of tariff protection. This would reduce
import prices for consumers. This would also reduce the degree of tariff dispersion that for any given
level of average protection create greater distortions and welfare losses. If all items in the 30 percent
duty band were to transition to a maximum tariff of 20 percent, the average tariffs in the CEMAC tariff
schedule would fall to 14.5 percent and tariff dispersion, measured by the coefficient of variation would,
would fall from 53 to 38 percent. Tariff reductions are likely to reduce the tariff revenue in the short
run. Yet, Cirera et al (2011) show that its impact on GDP could be positive in the medium run, especially
if complementary tax policies and enhanced efficiency in customs tax collection are implemented. Tariff
reductions should also be considered for capital goods and intermediates to foster Global Value Chain
trade (i.e. import to export).
5.27. Given a series of exceptions and safeguards, the CEMAC countries establish national tariffs
that deviate from the CEMAC CET for several hundred tariff lines. These deviations do not tend to
significantly impact the average level of tariff protection, with the average MFN rate by most CEMAC
73
countries roughly around 18 percent; yet, the deviation can be significant for certain goods. On a trade-
weighted basis, the average rate by the CEMAC countries ranges roughly from 12 to 16 percent,
depending on their import structure (Figure 42).45
The fact that the import weighted average rate is
lower than the simple average may reflect in part that high tariffs discourage trade. For Cameroon the
latest available tariff schedule is for 2014. For the rest of the CEMAC countries tariff schedules are
available for 2015. The estimated average tariff for 2015 for the Republic of Congo (11.9 percent) is
substantially lower than the CET, and tariffs rates by most HS chapters tended to deviate notably from
the CET. This would suggest that the Republic of Congo did not follow the CET during that year.
However, no further information to that effect was found and it is possible that the tariff schedule
reported to UN agencies for 2015 contains errors.46
Figure 42: MFN duty rates applied by CEMAC countries, 2015
Source: Estimates based on TRAINS and Comtrade.
Note: Tariff information for Cameroon is for 2014. For the Republic of Congo, 2015 and 2014 (*) is shown. Data point labels
refer to the HS chapter.
5.28. Albeit small on average, there are some significant deviations from the CET related to differing
national MFN tariffs. In a perfect customs union, there should not be deviations from the CET. A closer
look at the average tariff by HS chapter (Figure 43) shows that the CEMAC countries maintain MFN rates
by chapter that are generally consistent with the duty rate levels of the CET. However, Cameroon and
the Republic of Congo maintain significantly higher MFN rates than the rate established in the CET for
preparations of cereals (HS chapter 19), where the average tariff in Cameroon and the Republic of
Congo was 28 percent (versus an average CET for that chapter of close to 19 percent). For the Republic
of Congo, tariffs exceed the CET for cereals (HS chapter 10). Notable deviations toward lower tariffs than
in the CET include lower duties in Cameroon and Gabon for pharmaceuticals in chapter 30, as well as
lower tariffs for tin and tin products in chapter 80 in all countries except for Chad.
45
For CAR, Chad, and Gabon imports are measured using export mirror data.
46
WTO, ITC, and UNCTAD (2017) also calculates an average tariff for Congo for 2015 at 11.9 percent.
0
2
4
6
8
10
12
14
16
18
20
Cameroon* CAR Chad Congo Congo* Gabon
Percent
Simple average MFN rate Trade-weighted average rate
74
5.29. Another important perforation to a common tariff policy refers to preferential rates under
trade agreements. While the CET applies on a most-favorable nation (MFN) basis, bilateral preferences
with non-CEMAC parties can deviate from the CET. Since 2016, Cameroon has lowered duties on EU
imports as part of the interim EPA, as discussed in the previous section, but these bilateral preferences
have not been “multi-lateralized” within the community. Thus, Cameroon is extending preferential
tariffs to EU products that face higher CET duty rates in other CEMAC countries. Deviations in the
effectively applied tariff among CEMAC countries would become more pronounced over time as
liberalization staging under trade agreements continues to include goods with the highest tariffs.
Figure 43. Deviations from the CET by country and HS chapter, 2015
Source: Estimates based on TRAINS and CEMAC tariff schedule.
Note: Tariff information for Cameroon and the Republic of Congo is for 2014. Data point labels refer to HS chapter.
5.30. Implementation of a free trade area within CEMAC has been challenging. As part of the
reforms to create the CEMAC customs union, tariffs for intra-CEMAC trade were removed by the late-
1990s. Although only VAT should be assessed to products from other CEMAC countries, according to
some sources, duties are still collected in practice. As discussed in Chapter 7 on Regional Barriers to
Agriculture Trade, there is also evidence of multiple “petty” harassments or “tracasseries”, a small scale
generalized form of corruption that consists in many small informal payments without receipt or cause
to public officials including at the border, that increase trade costs. Determining origin for duty-free
treatment under the application of rules of origin also seems to be an area of concern.47
Simplifying
47
Certificates of origin for qualification (meeting raw-material or value-added content requirements) are issued by
customs authorities where the producer is situated. Reportedly, lack of expertise at these offices can result in
certificates that are rejected in other CEMAC countries.
1
2
3
4
5
6
78
910
1112
131415161718
19
202122232425262728293031323334353637
38394041
42
43
4445464748
49
50
51525354555657585960616263646566676869707172737475
76
787980
8182838485868788
89
90
9192
9394
959697
1
2
34
5
6
78
9
10
11
12
1314
15
161718
19
20212223242526272829
30
31
32
3334353637
38
394041424344454647
48
49
50
515253545556575859606162
63646566676869707172737475
7678
7980
8182838485868788
89
90
9192
9394
959697
1
2
3
4
5
6
78
9
10111213141516
17
18
19
2021222324252627282930313233343536
373839404142434445464748
49
50515253545556575859606162636465666768697071727374757678
79
808182838485868788
89
9091929394
959697
1
2
34
5
6
78
9
10
11
12
131415161718
19
202122232425262728293031323334353637
3839404142434445464748
49
50
5152535455565758596061626364656667686970717273
7475
7678
7980
8182838485868788
89
90
9192
9394
959697
1
2
3
4
5
6
78
9
1011
121314
15
16
17
18
19
20212223242526272829
30
31
32
33
343536
37
3839404142434445464748
49
50
5152535455565758596061626364656667686970717273747576
78
7980
8182838485868788
89
90
91929394959697
-5
05
10-5
05
10
0 50 100
0 50 100 0 50 100
CAR Cameroon* Chad
Congo* Gabon
hs2
Graphs by Country
75
rules of origin procedures and strengthening capacity to implement the regime would be particularly
important going forward to avoid tariff avoidance, given bilateral preferences beyond the CEMAC
region.48
Furthermore, community transit trade provisions apparently are not always followed.
Non-tariff measures
5.31. Beyond tariffs, a range of non-tariff measures (NTMs) and procedural obstacles to trade are
reported for the CEMAC region, with variations by country.49
Many imports are subject to standards
(sanitary and phytosanitary (SPS) measures and technical barriers to trade (TBT)) that include
certificates of conformity for imported goods. Application of standard measures, however, faces many
constraints, including numerous players with unclear roles and overly general regulations, as well as lack
of human and financial resources. The CEMAC agreement established a process for the harmonization
and mutual recognition of technical measures and procedures and for approval and certification
procedures. This process, however, has not advanced in practice and standards regimes tend to differ
across CEMAC countries. NTMs related to export measures are not harmonized among the members.
Export controls are applied by all countries for certain natural resources (e.g. timber) reportedly for
environmental reasons.
5.32. Para-tariffs, price controls, quantity controls, and mandatory inspection are also common and
vary by country. Beyond standards, non-tariff measures also include documentation charges that vary
across countries and the use of minimum prices in most CEMAC countries, as opposed to transaction
value for customs valuation. National regulations may also establish import licenses or approval based
on national regulations. Import licenses or prior authorization are required for certain food items in
Chad, the Republic of Congo, and Gabon; for pharmaceutical products in the Central African Republic
and Cameroon; and for certain manufacturing goods in Chad. Also, while not a CEMAC regulation,
inspection measures are mandatory in most CEMAC countries, except Gabon; these measures vary in
terms of exemption thresholds and minimum fees (which disproportionally affects small shipments).
5.33. Imports are subject to technical barriers. The main SPS and TBT measures include: labelling or
inspection requirements for SPS or TBT purposes; SPS certification requirements; and TBT authorization
requirements. Together, these policies affect about half of the tariff schedule. Products principally
affected include fish, electrical equipment, plastic products, cotton, man-made fabrics, and paper and
paperboard. SPS and TBT measures may, in principle, serve legitimate social purposes (i.e. health and
safety), but according to some accounts on their implementation in CEMAC they tend to pose significant
trade barriers.
5.34. Transparency of import and export regulations and procedures is lacking in the CEMAC
countries and detailed official information is not readily available. Related to this, corruption is often
cited as a procedural obstacle to trade in the region both for exports and imports. Provisions in the WTO
Trade Facilitation Agreement (TFA) call for increased transparency in this respect via trade information
portals. Among the CEMAC countries, Cameroon and Equatorial Guinea (not a party of the WTO) are not
48
This include preferences currently in place and expected over time under the EU-Cameroon EPA. CAR and Chad
are part of another regional grouping (CEN-SAD), although an FTA has not yet been implemented.
49
This includes WTO Trade Policy Review documents, as wells as separate concerns in trade documents by the
major partners, such as the United States and the EU, and a compilation of alleged barriers by Martinez et al.
(2009).
76
signatories of the TFA. Furthermore, trade portals are a “soft” provisions in the TFA in the sense that
they are prescribed as best practices. 50
To date, the most comprehensive collection of NTM information
at the product level is provided by a recent effort by international organizations. This has resulted in a
consistent database (in terms of data collection and classification) for over 80 countries. Among the
CEMAC countries, only Cameroon has been included in the database at this point.
5.35. Based on a recent inventory of official measures affecting imports to Cameroon, about half of
the tariff lines and over two-thirds of imports are subject to NTMs. Even though NTMs differ within
CEMAC, the data for Cameroon may provide an indication of the prevalence of NTMs in the region
(Figure 44). “Core” NTM measures, such as price and quantity controls, that are more disruptive to trade
are not particularly high in Cameroon. Quantity control measures are rare and only applied to 6 tariff
lines related to gases and diamonds. About 13 percent of imports are subject to price controls that
mostly represent customs fees for inspections of animal products.
Figure 44. Incidence of import NTMs in Cameroon, 2015
Source: Estimates based on UNCTAD-NTM and Comtrade.
D. Conclusions and Policy Recommendations
5.36. CEMAC’s common commercial policy includes two main instruments, the CET and a zero-rate
preferential tariff for intra-community trade, both of which have been subject to flaws. During its
summit in October 2017 in N’Djamena the Conference of CEMAC Heads of State confirmed the need for
improved implementation of the CEMAC trade regime and recommended that states should exercise
the greatest caution in applying the CEMAC common commercial policy instruments.
5.37. Some specific recommendations for trade policy in CEMAC are as follows:
• Eliminate the top tariff band of 30 percent to converge to a tariff schedule with only 4 bands would
simplify the tariff regime and lower the average level of tariff protection.
• Tariff reductions should be considered for capital goods and intermediates to foster GVC trade.
50
Trade portals or trade information portals are database systems that collect consolidated information on trade
requirements and procedures, including tariff and non-tariff measures (e.g., import licenses, sanitary standards,
technical regulations, quotas or prohibitions, etc.), forms and instructions. This facilitate trades by increasing
transparency and predictability, which in turn reduces trade costs.
0.0
10.0
20.0
30.0
40.0
50.0
60.0
70.0
80.0
SPS TBT Quantity
controls
Price
controls
Any NTM
Percent
Coverage ratio Frequency ratio
77
• Improve the transparency on import and export regulations and procedures and other non-tariff
measures in CEMAC countries, including by collecting data in a consistent fashion.
• Assess CEMAC countries NTM regimes with the objective to simply, harmonize, and streamline
NTMs, including simplifying rules of origin procedure for CEMAC products.
• Move to automated approaches to border screening and one-stop border posts.
• Consider the reduce and/or elimination of some additional taxes, fees, and informal payments
assessed on imports into CEMAC, including “tracasseries”, that further increase customs charges on
imports on top of already high import duties.51
5.38. CEMAC countries should consider negotiating the EPA with the EU as a block. An EPA can
guarantee market access for CEMAC exports in the future and can also serve as an anchor for policy
reform in different areas. In addition, Cameroon has ratified the interim EPA and started liberalizing
tariffs on EU products since August 2016, which has been creating tensions with other CEMAC members.
It would be important to assess Cameroon experience under the interim EPA, including the potential
adjustment costs if there are local firms competing with European imports; the implementation of aid
for trade programs; and policy reform in other areas outlined in the interim agreement. Such an
assessment could provide valuable lessons for prospective negotiations on the EPA at the CEMAC level.
51
The Chapter on agriculture, provide several recommendations on improving border operations.
78
Annex
Table A.2. Top 10 exported products during 2014-2015
Cameroon Central African Republic Chad
HS6
Share in
total
exports
Product Description HS6
Share in
total
exports
Product Description HS6
Share in
total
exports
Product Description
1 270900 39%
Petroleum oils and oils
obtained from bituminous
minerals, crude
440349 28% Other tropical wood 270900 89%
Petroleum oils and oils obtained from
bituminous minerals, crude
2 180100 10% Cocoa beans 870422 17%
Other motor vehicles for the
transport of good
710812 5% Other unwrought forms of gold
3 440729 6% Tropical wood 870899 15%
Other parts and accessories of
vehicles
520100 2% Cotton not carded or combed.
4 80300 6% Bananas 440729 13% Other tropical wood 271000 2%
Petroleum oils and oils obtained from
bituminous minerals other than crude
5 271000 5%
Petroleum oils and oils
obtained from bituminous
minerals other than crude
520100 11% Cotton not carded or combed. 130120 1% Gum Arabic
6 710812 5%
Other unwrought forms of
gold
440399 3% Other tropical wood 120740 1% Sesamum seeds
7 440399 3% Other tropical wood 930630 1% Other cartridges and parts thereof 970110 0% Paintings drawings and pastels
8 520100 3%
Cotton not carded or
combed.
261590 1%
Tantalum or niobium ores and
concentrates
890800 0%
Vessels and other floating structures
for breaking up
9 760110 3% Aluminium not alloyed 240310 1% Smoking tobacco 880330 0%
Other parts of aeroplanes or
helicopters
10 440349 3% Other tropical wood 871000 0%
Tanks and other armoured fighting
vehicles
852520 0% Transmission apparatus
Average yearly exports in 2014-2015: 11.3 Billion USD Average yearly exports in 2014-2015: 0.22 Billion USD Average yearly exports in 2014-2015: 5.1 Billion USD
79
Congo, Republic of Equatorial Guinea Gabon
HS6
Share in
total
exports
Product Description HS6
Share in
total
exports
Product Description HS6
Share in
total
exports
Product Description
1 270900 60%
Petroleum oils and oils
obtained from bituminous
minerals, crude
270900 69%
Petroleum oils and oils
obtained from bituminous
minerals, crude
270900 82%
Petroleum oils and oils
obtained from bituminous
minerals, crude
2 740311 17% Refined copper 271111 22% Liquefied Natural gas 260200 8%
Manganese ores and
concentrates
3 890520 4%
Floating or submersible
drilling or production
platforms
290511 4%
Saturated monohydric
alcohols
440799 2% Other tropical wood
4 890190 4%
Other vessels for the transport
of both persons and goods
271112 2% Liquefied Propane 440729 2% Other tropical wood
5 271000 3%
Petroleum oils and oils
obtained from bituminous
minerals other than crude
440349 1% Other tropical wood 271000 1%
Petroleum oils and oils
obtained from bituminous
minerals other than crude
6 440349 2% Other tropical wood 271113 1% Liquefied Butanes 440839 1% Other tropical wood
7 741999 1% Other articles of copper 440399 1% Other tropical wood 710812 1% Other unwrought forms of gold
8 440729 1% Other tropical wood 880240 0% Aeroplanes and other aircraft 441213 0%
Plywood consisting solely of
sheets of wood
9 890590 1%
Other light-vessels, fire-floats,
dredgers, floating cranes, and
other vessels
440839 0% Other tropical wood 400122 0% Natural rubber in other forms
10 710812 1%
Other unwrought forms of
gold
271000 0%
Petroleum oils and oils
obtained from bituminous
minerals other than crude
843143 0%
Parts for boring or sinking
machinery
Average yearly exports in 2014-2015: 19 Billion USD Average yearly exports in 2014-2015: 18 Billion USD Average yearly exports in 2014-2015: 15 Billion USD
80
Table A.3. Preference utilization rates of exports from selected African countries. to the EU by country in
2016
Category
Total exports to
the EU (1000
euros)
Value of exports to
the EU eligible for
preferences (1000
euros)
Value of exports
entering the EU
under
preferences
(1000 euros)
Share
of
eligible
exports
Utilization rate of
preferences
(I) (II) (III) (IV=II/I) (V=III/II)
Ivory Coast
Food and Agriculture 3,884,809 1,286,888 1,248,725 0.33 0.97
Petroleum 365,333 6,777 6,775 0.02 1.00
Minerals and metals 5618 1 0 0.00 0.00
Total 4,255,761 1,293,665 1,255,500 0.30 0.97
Ghana
Food and Agriculture 1,877,688 738,623 718,746 0.39 0.97
Petroleum 320,422 1,318 0 0.00 0.00
Minerals and metals 343 1 0.01 0.00 0.01
Total 2,198,452 739,943 718,746 0.34 0.97
Nigeria
Food and Agriculture 1,039,482 174,354 93,802 0.17 0.54
Petroleum 8,681,794 3,041 0 0.00 0.00
Minerals and metals 1,167,899 32,050 11,637 0.03 0.36
Total 10,889,175 209,445 105,439 0.02 0.50
South Africa
Food and Agriculture 19,958,164 8,686,478 6,736,341 0.44 0.78
Petroleum 18,412 12,184 12,095 0.66 0.99
Minerals and metals 1,815,007 14,956 10,201 0.01 0.68
81
CHAPTER 6: Barriers to Regional Trade in Agriculture
A. Introduction52
6.1. The CEMAC region has a vast potential for agriculture production and trade. The oil price
shock, prospects for continued low oil prices and depleting oil resources make a compelling case for
economic diversification by reviving agriculture. Increased investments in agriculture can be a means to
increase regional food security, reduce the food import bill and create jobs for the youth. As of today,
agricultural activity in CEMAC is underdeveloped and faces many constraints, including access to land
and finance; poor rural infrastructure; informality; limited access to improved inputs; insufficient
agricultural advisory services; a high tax and regulatory burden and a high cost of agricultural inputs.
Regional agricultural trade in CEMAC also suffers from a lack of standard practices and a lack of
harmonization between national policies and CEMAC policies.
6.2. This chapter analyzes agricultural production and trade in the CEMAC region. It first provides a
brief overview of the agricultural sector in CEMAC and assess regional trade in agricultural products.
Then, drawing in field work obstacles to regional agricultural trade along CEMAC’s main trade corridor
are being analyzed. The chapter concludes with policy recommendations that would help CEMAC
countries realize their potential for regional agricultural trade. The chapter focuses on regionally-traded
commodities that are relevant to poor producers and poor consumers, as such recommendations would
be most relevant for inclusive growth.
B. Agriculture in CEMAC
6.3. Despite the region’s vast potential for agriculture production and trade, the agriculture sector
in CEMAC remains largely underdeveloped. Across the region, agricultural imports represent close to
one fifth of the total import bill with Cameroon and Republic of Congo each importing over a billion
dollars-worth of agricultural products in 2015. Importantly for the people of CEMAC, the pattern of
petroleum dependent development has led to very unequal growth with high poverty rates in all
countries, particularly in rural areas. Undernourishment affects a substantial proportion of the CEMAC
population which is made worse by political fragility and violence in several countries of the region.
6.4. Agricultural value added as a share of GDP varies widely, from only 2.6 percent of GDP value
added in the Equatorial Guinea to 50 percent in Chad. Only two countries derive a significant share of
their value added from agriculture, Chad (50 percent) and the Central African Republic (43 percent). In
the other countries, the shares of agriculture in GDP are below 20 percent, with Cameroon at 17
percent.53
6.5. Agriculture employs a large share of the population in most CEMAC countries. More than half
of the population is employed in agriculture in Cameroon, the Central African Republic and Chad (62
52
This chapter is based on a World Bank (2018c): Breaking Down the Barriers to Regional Agricultural Trade in
Central Africa. This report and World Bank (2018c) cooperated closely and shared resources on the cross-border
evaluations. These efforts included two field missions in Cameroon and the border areas of the neighboring
countries, a data collection exercise in which university students joined trucks carrying agriculture produce from
Cameroon to Gabon and Equatorial Guinea, and a perception survey of the different actors engaged in agricultural
trade.
53
World Development Indicators (2016).
82
percent, 72 percent and 77 percent respectively) and 41 percent of people work in agriculture in the
Republic of Congo. Agriculture represents a smaller share of employment in Equatorial Guinea (19
percent of employment) and Gabon (16 percent of employment).54
6.6. The region exports a wide variety of agricultural products, with cash crops exported outside
CEMAC playing an important role. Cameroon is a strong exporter of cocoa, fruits (pineapples and
guavas) and chicken. The Central African Republic mostly exports vegetables to non-CEMAC countries in
Africa. The Republic of Congo exports tea and coffee (although with an important yearly fluctuation in
coffee exports).55
Regional trade in agriculture
6.7. Despite the political drive for regional integration, recorded intra-regional trade remains low.
For CEMAC member states, exports within CEMAC account for only 2.1 percent of total exports, and
imports for only 3.9 percent of total imports, according to official statistics. This compares to 15 percent
54
World Development Indicators (2017)
55
UN Comtrade.
Box 8. Agriculture in CEMAC suffers from numerous constraints:
• Insufficient rural infrastructure and poor access to markets. Agro-pastoral areas are often isolated and the
poor quality of rural roads makes access to markets difficult. Rural electrification is also low (e.g. at less than 5%
in Cameroon). Access to markets is further impeded by high marketing costs and business procedures that
discourage participation by small entrepreneurs. Access to water is also insufficient. In Cameroon, only about
2.8 percent of arable land is under irrigation.
• Access to advisory services is insufficient and lacks coordination. The definition of a public policy for advisory
services would lead to greater complementarity, synergy and rationalization in the use of resources.
• Access to agricultural inputs is limited. Most agricultural inputs (e.g. seeds, fertilizers, animal feed) are
imported, usually at high cost (also due to high import tariffs) and at varying quality. The level of access to
quality seeds low (less than 5 percent in Cameroon) and so is the use of fertilizers and pesticides. Most CEMAC
countries do not have an effective policy and regulatory frameworks for seed development and trade.
• Access to mechanization is very limited. Access to mechanization is hindered by: (i) small size of land holdings
and a limited land market; (ii) financing difficulties (weak financial standing of farmers, difficulty gaining access
to credit); (iii) an environment that makes farming with machines difficult (almost non-existent after-sales
service, unorganized market for farm products); and (iv) low level of technical knowledge among machine
users. Available data for tractors per 100km2
show low ratios for Cameroon (0.1), CAR (0.1), Chad (0.1) and ROC
(2.9), compared to low income countries (6.7) and the Sub-Saharan average, excluding high income countries
(14.4).
• Access to finance is low and not adapted to farmers’ needs. Loan volumes are small and are essentially short-
term loans to meet working capital needs. Access to medium term financing remains one of the major
constraints for the development of farms. Common constraints to the development of financial services for
farmers and agricultural SMEs are: (i) agricultural cooperatives and SMEs do not fulfil the requirements of
financial institutions notably in terms of collateral; (ii) financial institutions lack long-term resources to finance
long-term investments; (iii) financial institutions lack information and know-how about agriculture finance and
regard the agriculture sector as disorganized and undeveloped; and (iv) the rural presence of formal financial
institutions is low. Over the past five years, agricultural credit in Cameroon has never exceeded 8 percent of the
total volume of credit, while in ROC, bank credit to agriculture accounts for 6 percent of short-term and 17
percent of the medium-term credit.
Box 10. Unrecorded and informal trade in agricultural products is widespread.Box 11. Agriculture in
CEMAC suffers from numerous constraints:
• Insufficient rural infrastructure and poor access to markets. Agro-pastoral areas are often isolated and the
poor quality of rural roads makes access to markets difficult. Rural electrification is also low (e.g. at less than 5%
in Cameroon). Access to markets is further impeded by high marketing costs and business procedures that
discourage participation by small entrepreneurs. Access to water is also insufficient. In Cameroon, only about
2.8 percent of arable land is under irrigation. Access to markets is often impeded by high marketing costs and
business procedures that discourage participation by small entrepreneurs.
• Access to advisory services is insufficient and lacks coordination. The definition of a public policy for advisory
services would lead to greater complementarity, synergy and rationalization in the use of resources.
83
of exports and 11.5 percent of imports in 2010 for the UEMOA trade community. Explanations for this
low regional trade integration include the preponderance of oil in the region’s export basket, the
weakness of manufacturing sector in these countries and the more informal nature of intra-regional
trade, which means that inter-CEMAC trade is less likely to be recorded in official statistics.56
6.8. CEMAC demand for agricultural products is increasingly being met from outside the region
(Table 19). In all the member states of the Community, more than 95 percent of agricultural exports
went to the third countries (ROW - rest of the world) in 2015 and more than 75 percent of recorded
agricultural imports came from the ROW. According to official statistics, agricultural exports have
remained rather constant between 2004 and 2015, ranging between US$1,395mn in 2006 to
US$2,324mn in 2009, before decreasing to US$2,047mn in 2015, while imports have increased by 174
percent from 2004 (US$1,471mn) to 2015 (US$4,033mn). This suggests that the increase in demand for
agricultural products was met mostly by the ROW. Indeed, agricultural imports from the ROW increased
by 179 percent between 2004 and 2015, compared to an increase of imports from CEMAC countries of
only 41 percent.
Table 19: Recorded agricultural exports by destination (%)
Source: UN COMTRADE
6.9. According to formal trade data, Cameroon is the leading exporter of agricultural goods within
CEMAC (US$13mn in 2015). The main exports according to these data are: milled rice, soups and broths,
mineral water and other preparations. Congo exported US$2mn worth of agricultural products to
CEMAC in 2015, mostly sugar cane and its derivatives. The other countries of the CEMAC region, the
Central African Republic, Chad, Equatorial Guinea and Gabon exported less than US$1mn worth of
agricultural products to their CEMAC partners.
6.10. Cameroon’s importance for food production in CEMAC has also increased in terms of value
and share in the region. In correlation with the production gains, Cameroon has also constantly
increased the value of its net food production, which accounts for almost two thirds of CEMAC’s total, as
shown in Figure 45. Apart from livestock, Cameroon has the highest production value levels per capita
for all the different food sub-sectors, including for cereals on par with Chad.
56
Trade in agriculture in the region is governed by the instruments establishing the UEAC, which provide for a
common market for agricultural products through several measures: (i) the removal of domestic customs duty and
non-tariff barriers; (ii) the establishment of a common policy towards third-party countries; (iii) the establishment
of a competition policies, notably regarding state aid; (iv) the implementation of the principle of the free
movement of people, services and capital; (v) the harmonization and recognition of technical standards and
certification procedures.
Country Region 2004 2005 2006 2007 2008 2009 2010 2011 2012 2013 2014 2015
CAF CEMAC 0.2 4.6 3.0 6.2 2.4 3.8 0.1 1.7
CAF ROW 99.8 100.0 100.0 95.4 97.0 93.8 97.6 96.2 100.0 99.9 100.0 98.3
CMR CEMAC 1.9 2.8 1.9 3.2 3.3 1.8 1.0 0.7 0.7 0.5 0.8 0.7
CMR ROW 98.1 97.2 98.1 96.8 96.7 98.2 99.0 99.3 99.3 99.5 99.2 99.3
COG CEMAC 16.7 28.4 28.0 14.2 28.3 22.0 0.7 1.0 0.2 2.9 3.9
COG ROW 83.3 71.6 72.0 85.8 71.7 78.0 99.3 99.0 100.0 99.8 97.1 96.1
GAB CEMAC 8.6 8.8 12.4 39.5 64.7 79.4 90.5 69.2 68.8 58.1 9.6 4.4
GAB ROW 91.4 91.2 87.6 60.5 35.3 20.6 9.5 30.8 31.2 41.9 90.4 95.6
GNQ CEMAC 0.7 0.0 0.1 0.8 0.9 0.7 0.1 0.0 0.0 8.3 9.9 0.3
GNQ ROW 99.3 100.0 99.9 99.2 99.1 99.3 99.9 100.0 100.0 91.7 90.1 99.7
TCD CEMAC 1.3 0.0 0.1 0.2 0.1 0.1 1.9 1.1 0.7 0.5 0.0 1.4
TCD ROW 98.7 100.0 99.9 99.8 99.9 99.9 98.1 98.9 99.3 99.5 100.0 98.6
84
6.11. Cameroon’s agricultural production performance is made possible by a wide range of agro-
ecological zones, allowing the cultivation of 14 major crops, the most diverse in CEMAC. Cameroon has
five major agro-ecological zones: the inland equatorial forest; the maritime equatorial forest; the
highland tropical, Guinea-savannah, and Sudan-savannah. This subset of zones represents a majority of
the agro-ecological zones within which small-scale food production is done in sub-Saharan Africa. In
comparison, the climate conditions in the other CEMAC countries make it difficult to cultivate a wide
range of food crops: in the more humid countries in the south (Gabon, Equatorial Guinea and Congo) dry
cereals production is limited (Central African Republic is in a similar situation), while for Chad in the
north fruit and vegetable production is difficult.
Figure 45. Net Food Production Value (constant 2004-2006 $)
Source: FAOStat
Regional food security
6.12. About 45 percent of CEMAC’s population suffers from undernourishment and, of these, 10
percent suffer from an extreme food deficit57
. Insufficient trade integration reduces the overall
accessibility of food in the region, leading to even higher imports from the rest of the world.
Undernourishment is most prevalent in the Central African Republic and Chad, where a respective 58.6
percent and 32.5 percent of people are malnourished, but is rather low in Gabon and Cameroon. Child
stunting is more homogenously prevalent across the Community, ranging from 17.5 percent of stunting
in Gabon to 40.7 percent of stunting in the Central African Republic. Obesity affects only small
proportions of the population in CEMAC, with the exceptions of Equatorial Guinea and Gabon, where
the reliance on imported processed food leads to obesity rates higher than 13 percent (see Table 20).
57
Less than 300 calories per person per day.
56% 57% 58% 58% 61% 57% 62% 58% 60% 61%
13% 13% 13% 13% 13%
11% 12% 11% 11% 10%
22% 20% 20% 20% 18%
24% 18%
24% 21% 22%
5% 5%
5% 5% 6%
5%
5%
5% 5% 4%
4% 3%
3% 3% 3%
3%
3%
3% 3% 2%
0
1
2
3
4
5
6
7
8
9
10
2005 2006 2007 2008 2009 2010 2011 2012 2013 2014
Billions
Cameroon Central African Republic Chad Congo Equatorial Guinea Gabon
85
Table 20. Key Food Security and Nutrition Indicators in CEMAC
Source: FAO, The State of Food Security and Nutrition in the World 2017.
C. Bottlenecks to agricultural trade
Transport
6.13. Poor quality transport infrastructure and the associated costs are an important bottleneck for
producers and traders of agricultural products. Despite the gains in productivity and exports to the
CEMAC region, the transport infrastructure has not improved and transport costs have increased in
recent years, both for short and long-distance legs. Producers have the typical options of hiring a
transporter for their goods, as even large producers do not seem to own their own trucks. Depending on
the size of the production and the marketing mechanism, producers can choose from transport by
motorcycle, small car, larger car (pick-up), small and medium sized trucks. Road access to the field is
often too difficult for trucks larger than 10-12 tons, although this would represent the typical load for
export and for larger producers or those organized for grouped sales. Survey results confirm that a third
of respondents complaining about the difficulties to bring their agricultural products to the immediate
market.
6.14. The costs of evacuating agricultural commodities from the field to the nearest market often
accounts for most of the production cost. For example, data collected in the production areas around
Bafoussam in the Western region of Cameroon indicate that short distance transport costs (up to 25 km,
from field to immediate market or buyer) can amount from: 0.51 US$/ton/km (the example of a 10-ton
truck transporting production of 4 hectares of maize for 20 km at a cost of 15,000 XAF (28.3 US$) per
hectare) to 0.63 US$/ton/km (the example of a 3-tonne pick-up truck transporting tomatoes at a cost of
25,000 XAF (47.2 US$) per trip of 25 km) to 0.91 US$/ton/km (the example of a car transporting 1 ton of
mixed load at a cost of 12,000 XAF (22.6 US$) per trip of 25 km). This range of short distance costs
represent between 4 and 8 times higher costs per ton/km when compared with long distance transport
from the literature on transport costs in Sub-Saharan Africa.58
Compared with production costs, short
distance transport represents between 15 percent and 25 percent of the total, depending on load size
and perishable nature. In addition, producers are also increasingly complaining about the insufficient
number of available vehicles, which has increased costs in recent years.
6.15. Similarly, transporting agricultural products from production area markets to consumption
centers within Cameroon and in CEMAC is costly. Long distance transport of agricultural products is
generally done with larger trucks of 12 tons or more, depending on destination. As an illustration, for
58
See Teravaninthorn, S. and Raballand, G. (2009): Le prix et le coût du transport en Afrique.
2004-06 2014-16 2014-16 2016 2005 2016 2005 2016 2005 2014 2005 2016 2005 2015
Equatorial Guinea na na na 3.1 35 26.2 8.3 9.7 8.2 13.3 48 43.7 na 7.4
Gabon 9.7 7 3.4 na 17.5 na 7.7 10.5 13.6 57.8 59.1 na 6
Cameroon 20.2 7.9 27.6 5.2 35.4 31.7 8.7 6.7 5.6 8.6 45.3 41.4 23.5 28.2
CAR 39.9 58.6 7.1 45.1 40.7 8.5 1.8 2.6 4.1 49 46 23.1 34.3
Chad 39.2 32.5 na 13 44.8 39.9 4.4 2.5 3.2 5.5 51.1 47.7 2.0 0.3
Congo 33.4 28.2 8.2 31.2 21.2 8.5 5.9 5.4 8.2 57.9 51.9 19.1 32.9
Prevalence of
Anaemia among
Women of
Reproductive Age
(15-49 years, %)
Prevalence of
Exclusive
Breatfeeding
among Infants (0-
5 months, %)
Prevalance of
Undernourishment
in the Total
Population (%)
Prevalance of
Severe Food
Insecurity in the
Total
Population (%)
Prevalence
of Wasting
in Children
(<5 years,
%)
Prevalence of
Stunting in
Children (<5
years, %)
Prevalence of
Overweight in
Children (<5
years, %)
Prevalence of
Obesity in the
Adult
Population
(>18 years, %)
86
the Western region of Cameroon, the transport on the first leg of transboundary corridors from
Foumbot to Yaoundé (270 km) and to Douala (300 km) usually cost between 150,000 XAF (US$283) and
250,000 XAF (US$471.7), respectively, and trips take 7 to 8 hours. The 260-km trip from Yaoundé to the
southern border markets like Abang Minko costs on average 210,000 XAF (US$377.4), with a similar
duration of 7 hours. Within Cameroon, on this route, the resulting average cost per ton/km for long
distance transport is $0.12, in line with other estimates in the literature (for example, along the Douala -
N'Djamena corridor, the transport cost per ton/km is also estimated at US$0.12, while for Douala -
Bangui at US$0.17/ton/km).
6.16. Both short and long-distance transport result in significant losses due to the poor condition of
the infrastructure. Particularly for perishable goods, poor road condition coupled with the often over-
loading of trucks lead to important losses or product damage. In addition, the over-fragmentation of
transport from production to consumption increases these risks, as products are shifted from various
means of transportation and in different configuration. For example, a basket of tomatoes or bag of
avocadoes would first be transported from field to the immediate market by motorcycle or small pick-
up, unloaded and then loaded into a 12 to 20-ton truck that may stop for unloading in Yaoundé or
Douala before continuing to one of the border markets in the south, where the load would be broken
down to be carried by car by small and medium Gabonese traders, who would wholesale in Libreville to
retailers who might then repack and transport the cargo for final sale. Data on the losses along the
entire chain are not available, given the multitude of actors involved, but information from one of the
urban markets in Douala indicate that for the Foumbot-Douala leg only, losses for a truck of tomatoes
would be roughly 8 percent (20 baskets from a total load of 250 baskets). In addition, another 20
percent of the load (50 out of 250 baskets) would be damaged and would sell for a lower price. Similarly,
for livestock, transporters indicated that between one and four animals die on a regular trip from
production area to urban market.
6.17. For long distance traffic, the agricultural cargo losses are exacerbated by theft. Transporters
report constant theft issues, particularly in the case of smaller trucks on the Foumbot to Douala and
Yaoundé routes. Data collected during the field visits indicates that 3 out of 10 trucks are subject to
theft on a typical domestic trip from production to an urban center (a 250-km leg), with losses estimated
at 8-10 baskets for perishable goods like tomatoes or 1-2 bags for dry goods. Based on the typical
volume, theft losses are approximately 1 percent, a conservative estimate given that transporters also
report that products are removed from their cargo at the various checkpoints along the trip and during
technical stops for urgent truck maintenance.
6.18. In addition to road toll payments, transporters also pay several types of access fees along the
corridors. In the production areas in the Western Region, most local authorities charge access fees (droit
de circulation) for trucks coming to load agricultural products, regardless of whether they pick up the
goods from the field or from a market. For example, at the Foumbot market, the fees range are 550 XAF
(US$1) for 7-ton truck, 1000 XAF (US$1.9) for a 10-ton truck, 1,500 XAF (US$2.8) for a 15-ton truck,
3,000 XAF (US$5.7) for a 20-ton truck and 5,000 XAF (US$9.4) for a 26-ton truck.
Intermediaries
6.19. The high number of intermediaries increases the transaction costs for agricultural trade.
Insufficient commercial linkages and marketing bottlenecks lead to many intermediaries along the
87
main channels. There are six major blocks in a typical agricultural trade corridor (farm/field, immediate
market, collection market, urban markets, border market and finally the foreign market) and various
degrees of intermediation, depending on available commercial linkages and information, market
infrastructure, size of actors, power of negotiation and availability of buyers. At the producing end,
farmers sometimes have the option of directly selling their output to large urban and foreign buyers,
local intermediaries (buyam sellam) or transport themselves the goods to a larger market (urban or
border). Otherwise, the immediate outlets for agricultural products are the rural market, mostly
organized weekly, at the intersection of multiple villages and production basins, usually no further than
25 km from the farm. In these immediate markets, the producers have the possibility to sell their goods
directly (retail for localized consumption) or sell to an intermediary, who groups production for large,
mostly Cameroonian buyers that pass with their trucks through the small rural markets. The next level,
the collection market, is used for greater transactions: larger producers sell their goods – through
intermediaries – to the foreign and Cameroonian buyers, who continue from this market directly to the
border or Yaoundé/Douala. Border markets are often used as an intermediary point to fragment large
consignments of agricultural goods for medium-sized buyers, who cross the border as intermediaries
between the wholesale and retail phases. For goods that do not pass through border markets, the end-
point is the wholesale-to-retail urban markets in the capitals and large cities of neighboring CEMAC
countries.
Price uncertainty
6.20. Higher than expected price volatility leads to unpredictable returns. Producers and a
significant number of other market actors identified price volatility as a major impediment to
agricultural production and trade. 85 percent of producers interviewed believe that prices they receive
for their agricultural products are neither fair nor predicable. On the supply side, one major determinant
for price volatility is over-production at certain times, due to producers’ reactions to past price peaks in
a certain month and to relatively high demand in recent years, including from other CEMAC countries.
On the demand side, prices fluctuate significantly depending on the presence of foreign buyers from
Nigeria, Equatorial Guinea and Gabon on the Cameroonian market, which can sometimes be affected by
political concerns (i.e. the recent coup attempt and related border closing between Equatorial Guinea
and Gabon).59
Price uncertainty is exacerbated by lack of a market information system for disseminating
prices, coupled with insufficient awareness.60
Poor market management
6.21. Poor market management and market infrastructure hamper commercial linkages. Particularly
in the important production basin around Bafoussam in the Western region of Cameroon, the market
facilities are insufficient for the size and type of agricultural trade currently practiced. Larger, urban
markets are in no better position when it comes to infrastructure and management. Scarce market
infrastructure, especially storage facilities, seem to be captured by local elites and intermediaries. In
addition, market fee collection does not seem to be systematic and the collected funds are not
59
Producers interviewed during field visits universally praised the presence of foreign traders, but their presence is
neither constant nor predictable which adds to price volatility. In some locations, daily price fluctuations depend
on the arrival time of foreign buyers.
60
Limited available price information can be counter-productive as producers may respond to past price peaks
with over-production, pushing price lower.
88
earmarked for market maintenance or development. Except for the Foumbot market, no receipts
seemed to be issued for the paid fees, which were collected on behalf of the local public authority (town
hall, municipality or local chieftain). In the absence of an official market management, traders organize
themselves in collective interest groups to ensure that basic functions like cleaning and security are set-
up, at a separate cost to the market participants.
Petty harassments (“tracasseries”)
6.22. Throughout the CEMAC region valid trade functions are currently not exercised as such and
have, de facto, become “tracasseries”. These petty harassments are a major problem and significant
driver of cost within Cameroon, at the border, and in the neighboring CEMAC countries. These
harassments are a generalized form of corruption consisting of many small payments without receipt or
cause to public officials, particularly to the police, army/gendarmerie, weighbridge officials, road traffic
and prevention officers, and other local authorities. Field discussions demonstrate a universal
recognition among agriculture traders and transporters that regardless of whether all paperwork and
cargo are in order, payments are still required. Without these payments, public agents will simply delay
the truck until a payment is made. The most often cited example, which was also highlighted in the
March 2018 transporter’s strike, is that weigh stations are uncalibrated so produce different results at
each stop requiring a “corrective” payment without a receipt.
6.23. While each payment may seem small, tracasseries are major cost to the regional economy.
Based on data collected, petty harassment increases the cost of transporting agriculture commodities
between Foumbot and Douala by 25% or US$ 0.03 per ton per kilometer. In other countries,
transporters say the cost is even greater. In Equatorial Guinea first hand reports suggest that
tracasseries add US$ 0.06 per ton per kilometer (US$ 15 per ton from the Cameroon border to Bata),
while in Gabon the cost is even higher at US$ 0.30 per ton per kilometer (US$ 135 per ton from the
Cameroon border to Libreville).
6.24. More than directly undermining regional agriculture competitiveness, tracasseries impose
many other costs on the broader economy. By failing to adequately control vehicle weight limits, for
instance, roads deteriorate more quickly leading to higher maintenance costs for roads and vehicles
alike. Indeed, the present system arguably encourages overloading since transporters know they must
pay a bribe regardless of actual vehicle weight. Inadequate application of sanitary and phytosanitary
(SPS) measures is also a major economic concern. Genuine threats to animal and plant health and food
safety do arise during agriculture trade that can have devastating effects on entire populations and
agriculture ecosystems. Managing these risks effectively requires well-functioning, professional systems
and cannot be achieved simply through the collection of fees or selling of SPS permits.
Trading agricultural commodities in CEMAC
6.25. Limited clarity, consistency and transparency in border clearance requirements are further a
vector for corruption and lead to a multitude of formal and informal border costs. Tariffs and
procedural requirements are typically established on paper, yet not necessarily available at border level
for traders and travelers who wish to consult them - formalities (and related costs) can also vary from
one site to another and frequently involve a margin of discretion related to the individual judgment of
the official on duty. The enforcement of CEMAC provisions also appears irregular at best, despite users
89
(including both border officials and traders) often being aware of them. Trading/security conditions and
governance levels affect the likelihood that CEMAC provisions will be enforced.
6.26. Actual trading costs at the surveyed locations are consistently higher than official listed tariffs.
Real costs are often not aligned with official tariff lists, and frequently include many unofficial cost items
such as mandatory informal payments extorted by certain authorities, both at border level and along
the roads leading to main consumption areas. As an illustration, Table 1 in the Annex compares actual
trade costs as reported by traders at the Abang-Minko/ Eboro border between Cameroon and Gabon
with official fees based on information provided by authorities.
6.27. Traders’ responses to informality and tracasseries lead to a vicious circle of further informal
practices. Often the payments (formal and informal) are determined by size of consignment, which in
turn is estimated by number of bags, traders are now often overloading bags with the help of existing
market. Also, the loads of trucks are often disguised, with higher taxed commodities hidden at the
center and surrounded by lower value commodities. In addition, as smaller consignments in cars or on
motorcycles are rarely checked and taxed – formally and informally – proportionally less, at various
border posts it is common to “decompose” a large truck’s load into small batches of 2-3 bags per
motorcycle, which then crosses the border with less hassle, only to “re-compose” the cargo into a
different truck on the other side. Ethnic ties can play a key role in informal trade, often avoiding official
scrutiny. Overall, informal practices are causing higher risk-taking for border users.
6.28. Unrecorded and informal trade in agricultural products is widespread. Understanding,
regulating and improving agricultural trade in the CEMAC area is complicated by the inaccurate trade
statistics that miss the large portion of unrecorded and informal flows.61
Between Cameroon and Gabon
and Equatorial Guinea most actual border crossings take place through the formal check points rather
than unchartered routes. Nevertheless, official records of the trade flows are not matching the reality.
Between Cameroon and Central African Republic, at Garoua-Boulai, growing insecurity and instability in
CAR have recently led to the introduction of a mandatory military convoy for all trucks in transit, thus
eliminating any possibility of diversion from the formal crossing channel. Between Cameroon and Chad,
the length of the border and the geography of the region (clear landscapes with small minimal shrub
vegetation and the easily passable Logone River) make it easy to cross the border through non-
designated areas, particularly in the dry season when even medium sized trucks can cross through the
bush. Overall, official statistics miss both the typology of traded agricultural products, as well as the
volumes, often larger than those officially recorded (see Box 9).
61
Nkendah (2010, 2013), Amin and Hoppe (2013), and World Bank (2013) indicate that most regional agriculture
trade in CEMAC takes place through informal channels and is not recorded in official trade statistics.
90
6.29. Adding to the high trade costs and cumbersome procedures, the security situation in the
region and the frequent political crises are further impacting agricultural trade by increasing losses,
risks taken by traders and informality. In the northern parts of Cameroon (and to some degree in the
Adamaoua region in the middle section of Cameroon), the Boko Haram-induced security risks has
reduced exchange flows between Cameroon and Nigeria, as well as less livestock transit from Chad into
Nigeria. In addition, the Douala-N’Djamena corridor has also been disrupted because of the risk of
attacks on the last segment of about 240km between Mora and the border with Chad at Kousseri. As a
result, traffic has been re-directed to cross through Touboro into southern Chad and continue through
Moundou up to N’Djamena adding hours to the total journey. The number of cross-border livestock
theft incidents in Cameroon has also increased on both Nigerian and Chadian sides, limiting the usual
cross-border transactions and momentarily fluctuating livestock prices. The recent closure of the
Cameroon–Equatorial Guinea border resulted in the re-channeling of trade through unofficial, rural
routes. Chapter 7 on Political Economy Considerations for Regional Integration puts the often-volatile
security situation and the impact on regional integration in CEMAC in a broader context.
Final consumer prices in CEMAC reflect the costly and burdensome trade processes
6.30. Domestic, border and foreign factors contribute to increased costs of trading agricultural
products, which in turn result in higher final consumer prices, while squeezing the margins of
producers. An overall price build-up analysis indicates that intermediation costs (along the corridor, at
the terminal market and including market access costs) are the most important cost driver, accounting
Box 9. Unrecorded and informal trade in agricultural products is widespread.
Formal trade data do not match trade flows recorded at border-crossing. Field visits indicate a significant
discrepancy between formal and informal trade data. As such, official trade data more often reflect the ease of
recording data rather than actual trade flows.
According to UN Comtrade data, Gabon’s main imports from CEMAC are palm oil (US$3.3 million), soups,
broths and preparations ($3.1 million), chocolate (US$2.8 million), milk and cream in solid forms (US$2.4
million) and chewing gum (US$1 million). The reality as recorded at the main borders posts between the two
countries is indicating significant unreported trade. For example, the estimated value of plantain imported in
2017 at Abang-Minko/Eboro border post alone is US$6.5 million.
Official trade data for the Central African Republic indicate that the main imports from the other CEMAC
countries are frozen sardines (US$1.9 million), soups, broths and preparations (US$1.6 million), mineral waters
(US$1.5 million), milk and cream in solid forms (US$0.6 million) and chewing gum (US$0.3 million). In reality,
trade flows at Garoua-Boulai appear to mostly feature long-distance, heavy trucks (25-40 ton) transporting a
variety of commodities from Cameroon and other third countries to CAR. These include CEMAC-originated
items from Cameroon such as onion (from Garoua/Maroua), garlic, and groundnuts, as well as goods arriving
from third countries including rice (from Asia), flour (from Europe), and sugar (from Brazil), along with
beverages, biscuits and other processed items. Information on volumes was not available during the field visit.
According to official data, Chad’s main imports from CEMAC are sauces and sauce preparations (US$8.1
million), semi-milled or wholly milled rice (US$ 4.6 million), sweet biscuits (US$2.7 million), sugar
confectionery (US$2.4 million) and soups, broths and preparations (US$2.1 million). Data obtained during field
work on agricultural goods traded at Kousseri/N’Djamena border crossing indicate food maize, plantain,
potato, onion, avocado and tomatoes (as exports from Cameroon) and cattle (as imports to Cameroon) are
much more likely to be the main trade items.
Box 12. Simulations of removal or tracasseries on intra- regional trade and growth in CEMACBox
13. Unrecorded and informal trade in agricultural products is widespread.
Formal trade data do not match trade flows recorded at border-crossing. Field visits indicate a significant
discrepancy between formal and informal trade data. As such, official trade data more often reflect the ease of
recording data rather than actual trade flows.
According to UN Comtrade data, Gabon’s main imports from CEMAC are palm oil (US$3.3 million), soups,
broths and preparations ($3.1 million), chocolate (US$2.8 million), milk and cream in solid forms (US$2.4
million) and chewing gum (US$1 million). The reality as recorded at the main borders posts between the two
countries is indicating significant unreported trade. For example, the estimated value of plantain imported in
2017 at Abang-Minko/Eboro border post alone is US$6.5 million.
Official trade data for the Central African Republic indicate that the main imports from the other CEMAC
countries are frozen sardines (US$1.9 million), soups, broths and preparations (US$1.6 million), mineral waters
(US$1.5 million), milk and cream in solid forms (US$0.6 million) and chewing gum (US$0.3 million). In reality,
trade flows at Garoua-Boulai appear to mostly feature long-distance, heavy trucks (25-40 ton) transporting a
variety of commodities from Cameroon and other third countries to CAR. These include CEMAC-originated
items from Cameroon such as onion (from Garoua/Maroua), garlic, and groundnuts, as well as goods arriving
from third countries including rice (from Asia), flour (from Europe), and sugar (from Brazil), along with
beverages, biscuits and other processed items. Information on volumes was not available during the field visit.
According to official data, Chad’s main imports from CEMAC are sauces and sauce preparations (US$8.1
91
for 42 percent of the total (as the figure below summarizes). Transport costs and petty harassment
account for about a third of the total, while production costs are almost 20 percent. Border crossing
costs on their own are roughly 7 percent, while the producer’s margin is only 3 percent.
Table 21. Price build-up for selected commodities on the Cameroon to Gabon corridor (% of final
consumer prices)
92
Box 10. Simulations of removal of tracasseries on intra- regional trade and growth in CEMAC
Djiofack (2018) uses ENVISAGE, a dynamic global CGE model developed by the World Bank, to assess the
removal of petty harassments (tracasseries) related trade costs on trade and growth in CEMAC. Two policy
scenarios are being considered:
• Scenario 1 assumes that only Cameroon removes tracasseries and this results in a 14 percent price
reduction for agriculture and manufacturing products imported from Cameroon in 2018.
• Scenario 2 assumes that all CEMAC countries implement reforms to reduce petty harassment affecting
intra-regional trade. Scenario 2 simulates a 14% reduction on all agriculture and manufacturing products
trade among all CEMAC countries.
Scenario 1: The removal of tracasseries increases demand for Cameroonian exports in other CEMAC countries.
Relative to the baseline and by 2030, Cameroon’s exports to CEMAC increase by about 23 percent. The impact is
also positive for growth, albeit small (0.32 percentage points above the baseline). This is largely due to the small
scale of formal intra-regional trade in CEMAC; given the importance of unrecorded trade, the actual growth
impact may be larger.
Scenario 2: A CEMAC-wide removal of tracasseries costs brings significant gains in intra-regional trade for all
countries. Relative to the baseline, intra-regional exports increase by about 25 percent by 2030 and gains in
terms of GDP range from around 0.34 percent increase in Cameroon to almost 1 percent in the Republic of
Congo (see Figures 1 and 2).
Figure 1: Impact on Exports (% increase over base
line)
Figure 2: Impact on Growth (percentage point increase
over base line)
Source: Djifack (2018)
Methodology: ENVISAGE is a recursive dynamic CGE model that has been successfully applied in numerous
countries. This approach links a sequence of static equilibriums with a set of equations, which update, at every
period, certain macroeconomic variables such as population, productivity and the capital stock. The model is
based on the GTAP 9 database, which contains a consistent set of Social Accounting Matrices (SAM) for 141
regions; it is the standard database for global CGE models. However, the version of the ENVISAGE considered for
this study has been aggregated to incorporate 11 regions of interest for the study including: Cameroon, Central
African Republic, Chad, Congo, Gabon, Rest of Central Africa, United States of America, EU and EFTA, China, Rest
of Africa, and the rest of the world (ROW). Sectors were also aggregated to reflect the most important products
traded between central African Economies. Tracasserie-related costs are modelled as a traditional “iceberg
effect”: transportation is treated as a source of exogenous friction that is fixed and proportional to the value
shipped. The evaluation period is 2015-2030.
Box 14. Exchange rate regime and economic outcomes for the CFA zone – a brief review of the
literature.Box 15. Simulations of removal or tracasseries on intra- regional trade and growth in
CEMAC
20.5
26
23.9 24.6
23.7
Cameroon CAR Chad Gabon ROC
0.34
0.48
0.54
0.72
0.98
Cameroon CAR Chad Gabon ROC
93
D. Conclusions and policy recommendations
6.31. Factors restricting agricultural trade in the CEMAC area are multiple, inter-related and costly.
While many bottlenecks are national in nature and covered in detail in World Bank (2018c), this section
highlights scope for regional intervention at the CEMAC level, particularly with regards to the
harmonization of procedures and regulations along regional trade corridors.
6.32. At a general policy level, regional agricultural trade in CEMAC suffers from a lack of standard
practices and a lack of harmonization between national policies and CEMAC policies. Within
Cameroon, for example, there is no single set of regulations governing agricultural trade with the
CEMAC neighbors. Official regulations were also often found to clash with border practices.
Recommendations to address this include the following:
• Advisory and policy support for national governments, particularly the Customs Authority and the
Ministry of Trade, to establish a single and coherent set of regulations and to develop capacity and
oversight necessary to consistently apply these.
• Reducing border taxes that act as non-tariff barriers, even if export tariffs are or will be soon
removed.
• Establishing a regional dialogue on sanitary and phytosanitary (SPS) declaration requirements. There
is little/no purpose in charging for certification when the importer has no declaration requirements.
Furthermore, understanding the current scope of animal and plant diseases in CEMAC is necessary
to identify appropriate, targeted risk-based mitigation measures; risks of contamination will grow
more important with deepening regional integration.
• At the CEMAC level, establishing a trade regime for agricultural products that all governments can
adhere to. The primary political economy obstacle seems to be revenue generation or re-
distribution from border activities. Experience from other trade blocs, including the EU, may be
relevant as to how best to decrease dependency on border taxes.
6.33. Along transport corridors, efforts to eliminate petty harassment could reduce trade costs by
an estimated 14 percent and bring multiple benefits. Simulations show that a reduction of unofficial
fees related to bribes and corruption for goods transported along CEMAC’s trade corridors would
increase intra-regional trade by about 25 percent and add between 1 to 2 percent to the growth rate of
CEMAC countries. While reducing the number of checkpoints along the corridors as well as enforcing
anti-corruption measures would fall under the national policy domain, development and promotion of
CEMAC-wide ‘traders’ charter’ that details the rights and obligations of trade corridor users could
incentivize traders to adhere to existing regulations (e.g. not over-charging vehicles, ensuring necessary
paperwork is in order, refusing to turn a fine into a bribe), while setting standards and expectations for
border agencies.
6.34. At the border, there are opportunities to facilitate agricultural trade by improving
management, collecting better information, and investing in infrastructure. The current proliferation
of border agencies significantly increases the delays, costs and corruption, without adding much value to
the trading process. There is scope to consolidate agencies (some agencies could in theory form joint
units or be present only on the more concerned side of the border) and enhance inter-agency
coordination. At the regional level, establishing joint, international border committees to coordinate
94
functions and regularize procedures across countries would be necessary; national Customs could act as
lead agencies.
95
Annex
Table A.1. Official and actual cost of clearing a truck at Abang-Minko/Eboro border between Cameroon
and Gabon
Official
Cost
Actual
Cost
Variance
Official
Cost
Actual
Cost
Variance
Official
Cost
Actual
Cost
Variance
Police - 5,000 5,000 - 5,000 5,000 - 5,000 5,000
Army - 2,000 2,000 2,000 2,000 2,000 2,000
Immigration - 2,000 2,000 - 2,000 2,000 - 2,000 2,000
Town Hall ? 2,000 2,000 ? 2,000 2,000 ? 2,000 2,000
Assemblée ? 1,000 1,000 ? 1,000 1,000 ? 1,000 1,000
Loading Fee Town Hall ? 1,000 1,000 ? 2,000 2,000 ? 5,000 5,000
Customs Exit Fee Customs 2% 10,000 n/a 2% 15,000 n/a 2% 15,000 n/a
Phytosanitary Phyto Police 5,100 5,000 (100) 8,500 10,000 1,500 8,500 10,000 1,500
LVO fee BGFT 5,000 5,000 - 10,000 10,000 - 15,000 10,000 (5,000)
Police ? ? ? ? ? ? - 2,000 2,000
Army ? ? ? ? ? ? - 2,000 2,000
Overtime Fee Customs ? 5,000 5,000 ? 5,000 5,000 ? 15,000 15,000
Phyto Inspection AGASA 10,000 5,000 (5,000) 20,000 25,000 5,000 30,000 50,000 20,000
Identification note fee CGC 10,000 5,000 (5,000) 10,000 10,000 - 10,000 25,000 15,000
Certificate of
authorization for
consumption (issue fee)
DGCC ? 5,000 5,000 16,800 25,000 8,200 48,000 48,000 -
Town hall ? 2,500 2,500 ? 5,000 5,000 ? 10,000 10,000
Assembleé ? 5,000 5,000 ? 5,000 5,000 ? 15,000 15,000
Army - 5,000 5,000 - 5,000 5,000 - 5,000 5,000
Police - 5,000 5,000 - 5,000 5,000 - 10,000 10,000
Total per vehicle (XAF) 30,100 70,500 30,400 65,300 134,000 53,700 111,500 234,000 107,500
Cost per ton (XAF) 30,100 70,500 30,400 16,325 33,500 13,425 11,150 23,400 10,750
Total per vehicle (US$) 56.90 133.27 57.47 123.44 253.31 101.51 210.78 442.34 203.21
Cost per ton (US$) 56.90 133.27 57.47 30.86 63.33 25.38 21.08 44.23 20.32
? = Information on official costs not available from responsible agency.
Entry Fee
Paid to enter the market
for loading purposes
Exit Fee
Paid at the Poste
Avancé. Information
only available for mid-
size trucks.
Costs to Enter Gabon
Unspecified Fees
Total Costs at Border
Fee Name
Responsible
Agency
Minibus (1 ton) Small Truck (4 tons) Mid-Size Truck (10 tons)
Costs to Exit Cameroon
96
CHAPTER 7: Political Economy Considerations of Regional
Integration in CEMAC
A. Introduction
7.1. “Regional cooperation and integration have long been high on the agenda of African
countries, regions and regional organizations. Burgeoning regional policies, strategies and protocols
have been matched by widening ambitions and mandates in most regional organizations, often
supported by donor-financed expansions in budgets, staff and programs. Yet policy-makers, member
state representatives and non-state actors frequently express frustration with the gap between
commitment and what takes place on the ground.” (Vanheukelom et al. 2016)
7.2. This chapter complements the analysis of previous chapters by bringing a political economy
perspective to regional integration and regional development in CEMAC. Following a brief history of
regional integration in CEMAC, this chapter highlights several political factors, related to national
interest, multi-adhesion to overlapping regional initiatives and external influences that are closely
associated with the current state of regional integration in CEMAC.
B. CEMAC and regional integration in Central Africa
7.3. The Charter of the Organization of African Unity and the Constitutive Act establishing the
African Union define regional integration as one of the foundations of African unity. The creation of
the Organization of African Unity (OAU) in 1964 reflected the awareness of the leaders that Africa’s
strength was rooted in Pan-African cooperation. The Lagos Plan of Action62
and the Abuja Treaty63
elaborated the specific economic, political and institutional mechanisms for attaining this objective. The
adoption of the New Partnership for Africa’s Development (NEPAD) in 2001 provided an overall
development framework for the continent which adopted regional integration as one of its core
objectives. The establishment of the Commission of the African Union (AU) in 2001, the incorporation of
NEPAD into its structures, and the launch of AU’s African Continental Free Trade Area (CFTA) in March
2018, which was signed by 44 African states, further underlines this commitment to regional integration.
7.4. Central Africa has a long history of regional integration. After independence from France, the
nations of Central Africa embarked on a journey of economic integration that culminated with the
signing of the Central African Economic and Monetary Community (CEMAC) treaty in 1994. This process
began in 1959 when four members of the former Federation de l'Afrique Equatoriale Française, the
Central African Republic, Chad, Congo and Gabon, signed a Convention establishing the Equatorial
African Customs Union, the Union Douanière Equatorial (UDE). In 1964, the customs union was
expanded when Cameroon and the UDE signed the Customs and Economic Union of Central Africa
(UDEAC), eventually joined by Equatorial Guinea in 1983. While UDEAC was soon stalling, the formation
62
The 1980 Lagos Plan of Action for the economic Development of Africa 1980-2000
63
Signed in 1991 and entered into force in 1994: The created African Economic Community’s stated goals include
the creation of free trade areas, customs unions, a single market, a central bank, and a common currency over a
period extending up to 2028
97
of Economic Community of Central African States (ECCAS)64
was expected to bring new life to regional
integration in Central Africa, but ECCAS also was quickly paralyzed by war and conflicts between its
members (Bach 2016). Economic crises in the 1980s created momentum for renewed economic
integration, leading to the establishment of CEMAC in 1994, which called for the creation of a common
market and full monetary integration. However, it is only in 1999 that CEMAC became effective and
replaced UDEAC. A Community Integration Tax (TCI), equivalent to one percent of imports of third party
countries was also introduced to cover the recurrent expenditures of CEMAC organs and institutions.65
7.5. The new Treaty established two unions, the Union Économique de l'Afrique Centrale (UEAC)
and the Union Monétaire de l'Afrique Central (UMAC) to fulfil the objectives of CEMAC. Together,
these two unions aim to (i) set up a multilateral device for monitoring economic and financial policies in
their Members States, (ii) manage the common currency, (iii) create a safe environment for economic
activity, (iv) harmonize the regulations of sectoral policies, (v) create a common market for goods,
services, capital and people.
7.6. In 2008, CEMAC was reformed to move from inter-state cooperation to supra-nationalism.
While the revised treaty maintained the institutions in place, it strengthened the power of the
institutions and converted the Secretariat into a Commission, echoing a similar move by the West
African Economic and Monetary Union (UEMOA) in 2006 and replicating EU’s Maastricht treaty (Bach
2016).66
It further established a Community Parliament and Community Court of Justice for CEMAC.
7.7. CEMAC was created to promote regional integration and to ensure the effective
implementation of policies throughout the sub-region. Upon its creation, CEMAC set out to promote
trade, establish a Central African common market and unite the inhabitants of the sub-region. CEMAC
member states, in their drive for regional integration, were influenced by economic theories of
integration and the assumption that integration has a positive impact on the gross national product of
all its member states through an increase in the size of the markets, the efficiency of institutions within
member states, and an increase in economies of scale (Jaber 1979).
7.8. CEMAC and ECCAS co-exist with overlapping mandates. ECCAS was revived in 1999, after
signing the initial protocol on relations between the African Union (AU) and the Regional Economic
Communities (REC). This provided ECCAS with security mandate through the Council for Peace and
Security in Central Africa (COPAX) and a mandate to form a Free Trade Area (FTA) as part of the African
Economic Community (AEC); ECCAS also became one of the eight AU-recognized REC. CEMAC represents
a smaller group of countries, where the monetary and economic union and several regional institutions
provide a level of internal coherence and legitimacy. ECCAS has less internal coherence, but greater
political legitimacy at the African Union level through a broad regional mandate that spans trade,
64
ECCAS was established in 1983 by the UDEAC/CEMAC members and the members of the Economic Community
of the Great Lakes States (CEPGL) (Burundi, Rwanda and DRC (then Zaire)) and Sao Tomé and Principe. Angola
remained an observer until 1999, when it became a full member.
65
While the introduction of TCI significantly improved the financing of CEMAC institutions compared to the
situation under UDECA, where contributions were paid through national treasuries, TCI contributions are often
plagued by partial or late payments (Awouwou 2008).
66
The Commission is intended to initiate draft legislation and apply and implement Community policies and
programs.
98
infrastructure, energy67
, agriculture and peace and security (Byiers 2017); the UN General Assembly
further granted ECCAS observer status at the United Nations in 2001 (Awoumou 2008).
67
ECCAS members established the Central African Power Pool (CAPP) in 2003 as an ECCAS specialized agency.
Box 11. CEMAC structure and decision-making processes
CEMAC consists of four institutions: the Economic Union of Central Africa (UEAC); the Monetary Union of Central Africa
(UMAC); the Community Parliament; and the Court of Justice. The organs of the CEMAC are the Conference of Heads of
State; the Council of Ministers; the Ministerial Committee; the CEMAC Commission; the Bank of Central African States
(BEAC); the Development Bank of Central African States (BDEAC); the Banking Commission of Central Africa (COBAC).
CEMAC has also several specialized institutions that support the implementation of the community policies and
programs in areas such as agriculture, health, infrastructure. Examples are the Economic Commission on Cattle, Meat
and Fishery Resources (CEBEVIRHA), the Inter-State Committee on Pesticides (CPAC), the Institute for Statistics and
Applied Economics (ISSEA) or the Sub-Regional Multi-Sectoral Institute for Applied Technology (ISTA), International
Commission of the Congo-Ubangi-Sangha Basin (CICOS). There are also several schools and training facilities, such as an
inter-state school for customs officers (EIED), a Tourism School (EHT-CEMAC), Institute of Economy and Finance (IEF) or
an inter-state center for higher education on public health (CIESPAC).
The Monetary and the Economic Union: The Monetary Union (UMAC) and the Economic Union (UEAC) are the
Community’s two main pillars. They are supposed to guide and root the regionalisation process. UMAC’s main
institution is BEAC, which issues the common currency and guarantees its stability by defining and managing monetary
policies, exchange operations and reserves in member states. UEAC, the economic union, is less advanced. Despite a
comprehensive body of legislations, progress in establishing an economic union has so far been slower than expected,
particularly with regards to the free movement of citizens and the continued existence of intra-regional tariff and non-
tariff barriers.
The CEMAC Parliament and the Court of Justice: The Court of Justice, which has been in place since 2000, integrates
judicial and audit functions. The Court is composed of a Judicial and an Audit Chamber, and each chamber has six
judges. The Judicial Chamber guards CEMAC treaties and agreements, while the Audit Chamber is charged with
monitoring CEMAC’s budget and accounts. The Parliament, which is not yet fully operational, is intended to have a
representative role, as its members are considered deputies of the entire CEMAC population.
The Conference of Heads of State: CEMAC’s main decision-making power rests with members' political leaders,
gathered annually in the Conference of Heads of State. The presidency of the Conference is rotating and is entrusted
each year to the Head of State of a different Member State, following alphabetic order. The Conference's main function
is to determine the main orientations of the Community and its institutions. It nominates the heads of most Community
bodies, such as the Executive Secretary and its deputy, the Governor, Vice-Governor and Secretary General of the BEAC
and the directors of all affiliated institutions. Only the Director of the BDEAC is not elected by the Conference of Heads
of States but chosen by the Bank’s General Assembly, composed of representatives from the CEMAC Member States,
the BEAC and the African Development Banks, and external donors, such as France. All decisions of the Conference of
Heads of State are taken by consensus.
The CEMAC Commission: The main management and administrative body of CEMAC is the Executive Secretariat. Similar
to the European Union, the Commission is composed of an equal number of Commissioners from each Member State,
led by a President and a Vice-President. The CEMAC commission is charged with regional macro surveillance and
monitoring the regional development strategy (CEMAC-PREF).
The Ministerial Councils: There are two Ministerial councils that guide and monitor the implementation of the two
unions: the Ministerial Committee in charge of UMAC, and the Council of Ministers for UEAC. Each council comprises
three Ministers from each Member State and meets twice per year. The main role of these councils is to ensure the
direction of the two unions and to promote the progressive harmonisation of policies. The UMAC Ministerial Committee
in addition supervises the activities of the BEAC, ratifies the Bank’s budget and accounts and examines its annual report.
The annual presidency of both Ministerial councils is assured by the same Member State that is heading the Heads of
State’s Conference.
Source: CEMAC, International Democracy Watch.
99
C. Political economy aspects affecting regional integration and regional
development
7.9. In addition to economic and structural factors, political factors can also be an important driver
or stumbling block for regional integration. This section explores some political economy aspects of
regional integration in CEMAC:
CEMAC legitimacy and identity
7.10. The coexistence of overlapping regional bodies leads to challenges regarding commitment to
and functionality of the separate initiatives. All CEMAC members are members of ECCAS as well, but
ECCAS countries also have overlapping memberships. For example, Angola and DRC are also members of
COMESA and SADC, while Burundi and Rwanda are part of EAC. Figure 46 depicts the multitude of
regional initiative in Africa. This multi-adhesion to overlapping regional initiatives often leads to a
commitment, financial and functionality dilemma,68
as different countries do not attach their ambitions
and loyalty to each organization in the same way (Byiers 2017). CEMAC and ECCAS member countries
are aware that duplication in memberships and mandates can reduce traction and by request of Heads
of State both organizations established a steering committee in 2010 to harmonize integration policies,
programs and instruments by 2023, progress has reportedly been slow. The EU's financial agreement
with ECCAS and CEMAC also supports coordination and rationalization between the two, with the long-
term objective of establishing a single organization.69
Collaboration versus competition
7.11. Unproductive rivalry among the CEMAC member states have at times compromised concerted
efforts. According to Kewir (2015), and Nguh and Ndedi (2017), rivalries between, for example, Gabon
and Cameroon over where to locate the headquarters of the Bank of Central African States, (BEAC) and
which country should furnish the governor, or more recently over the location of the CEMAC sub-
regional stock exchange,70
have often posed a political threat to the stability and integration of the
region. Since the start of oil production, Equatorial Guinea has reportedly also resisted and contested
regional policies and displayed increased leadership ambition (Awoumou, 2008).
68
As an example, dual membership in CEMAC and ECCAS carries third-party import levies of 1% and 0.4%,
respectively.
69
http://europa.eu/rapid/press-release_PRES-08-323_en.htm
100
Figure 46: Overlapping regional initiatives in Africa
Source: Sy (2015)
7.12. Joint leadership is needed. As Kewir (2015) points out, Cameroon and Gabon would be in a
good position to bring the needed impetus to the region to implement reforms and bring dynamism to
integration in Central Africa. The two countries are politically the most stable in the region and, jointly,
they represent the largest share economically and demographically, have large reserves of natural
resources and are strategically located with natural ports facilities. To provide the needed leadership for
the region, they would have to overcome rivalries, agree to joint positions regarding CEMAC projects
and policies, increase the frequency of meetings between government officials and ideally engage in
joint projects (Nguh and Ndedi 2017).
National interest versus community agenda
7.13. Sovereignty constitutes a challenge for CEMAC members. Lack of political commitment from
member states, regional rivalry and an inability to move beyond national and short-term interest has
failed to enable CEMAC member countries to attain the expected level of economic and monetary
integration or implement structural policies aimed at economic diversification (e.g. Laurens, 2008).
Regional integration inherently entails the loss of some sovereignty to the transnational organization,
101
but rather than seeing this as necessary to boot the trade that will increase living standards, CEMAC
member countries often see it as a threat to sovereignty71
; CEMAC national governments have therefore
often elected to hold fast to their pre-association independence. This is dissimilar to the prevailing
situation with an analogous organization like the EU, which has attained political integration; running a
functional Council, Parliament, Court of Justice and other institutions whose powers are binding for all
members and override decisions made at national levels.
7.14. Cameroon’s decision to sign an Economic Partnership Agreement (EPA) with the European
Union is seen by some observers as case of national interests undermining the CEMAC Customs Union
and its Common External Tariff. Cameroon is the only CEMAC member to have signed the EPAs which
went into effect in 2016. Other CEMAC members have criticized Cameroon for undermining CEMAC’s
Common External Tariffs which is levied against imports from non-member countries as now goods
imported under the EPA into Cameroon can circulate freely in CEMAC. Rather than boosting integration,
this could hinder efforts to establish a functional sub-regional common market.
7.15. Fiscal policy and public debt management are subject to regional surveillance by the CEMAC
Commissions, but compliance is weak. CEMAC members adopted a multilateral surveillance framework
in 1994 to advance macroeconomic convergence and to supervise national fiscal policies. CEMAC’s
regional macro surveillance framework set limits on key macroeconomic indicators to promote national
policies consistent with the common currency. The regional convergence framework was initially
adopted in 1994 with the objective to prevent excessive fiscal deficits (and deficit financing) to ensure
the sustainability of the peg (IMF, 2009).72
Members with policies that are inconsistent with the union's
objectives are required to adopt adjustment programs to achieve convergence. However, to date there
are no sanctions for non-compliance and enforcement of the framework has not been implemented
consistently; this possibly reflects a lack of political will at the national level (IMF 2017). Enshrining the
regional fiscal framework in national legislation and strengthening regional enforcement by the CEMAC
Commission, including through a mandate for the Commission to validate the data submitted by
national authorities, would be important in this regard. This would require strong political support and
adequate resources, but could significantly increase compliance, and eventually foster deeper regional
integration through increase fiscal convergence.73
External influences
7.16. Historic, economic and political ties with France have been an important factor in the
development of the region. For CEMAC, particularly the French influence has extended from the
colonization era to the current monetary arrangement of the CFA zone, which continues to be a
significant determinant of economic policies in the region (see Box 1). Byiers (2017) further argues that
close ties to France have given rise to an orientation and mobility of elites towards France, which has
further strengthened the economic and political ties between each country and France rather than with
the region. However, Kavanagh (2006) also points out that the CEMAC region has also benefited from
the stability gained by having France as guarantor and from the low inflation due to the monetary union.
71
https://www.voanews.com/a/central-africa-economic-integration-difficult-after-20-years/1861181.html.
72
See Box 1 in Chapter 1 for a description of CEMAC’s regional surveillance framework.
73
Darvas et al. (2005) find that the Maastricht “convergence criteria,” used to determine eligibility for EMU, have
indirectly moved Europe closer to an optimum currency area by reducing countries’ abilities to create idiosyncratic
fiscal shocks.
102
Governance challenges and limited private sector involvement
7.17. Weak governance can give importance to personalized relations in regional integration (e.g.
Vanheukelom et al. 2016). Weak governance remains a challenge in the region and within regional
institutions (see Chapter 1 for the different governance indicators). While the longevity of presidential
mandates has been associated with stability74
, it also has been accredited with political resistance to
change and innovation, which may adversely impact regional dynamics and interactions (Byiers 2017).
The importance of Summits of Heads of States in driving regional agendas in Central Africa may further
limit the participation of the private sector and non-state actors which have been credited elsewhere as
an important driver of advancing regional integration (Bertelsmann-Scott 2013).
Internal conflicts
7.18. Internal conflicts within CEMAC countries have often been a threat to regional integration, as
they often spillover to neighboring countries (Nguh 2015, Ndedi 2015). The security situation in the
region and the frequent political crises are impacting regional agricultural trade by increasing losses,
risks taken by traders and informality (World Bank 2018c). In Northern Cameroon, the Boko Haram-
induced security situation has reduced exchange flows between Cameroon and Nigeria, as well as less
livestock transit from Chad into Nigeria. In addition, the Douala-N’Djamena corridor has also been
disrupted because of the risk of attacks on the last segment between Mora and the border with Chad
and Kousseri. The 4-month closure of the border with Cameroon, following the foiled coup d’etat in
Equatorial Guinea in December 2017, also resulted in the re-channeling of trade through unofficial, rural
routes.
D. Conclusions and recommendations
7.19. For the regional integration in CEMAC to succeed the political will for integration needs to go
beyond aspirations that ebb and rise counter-cyclically with oil prices. Regional integration requires a
sub-ordination of national interests and a dedicated political prioritization. In the case of Europe,
integration started with the desire to maintain peace in Europe following the devastation of two World
Wars in the first part of the last century. Within CEMAC, push-factors towards deeper regional
integration could come from areas where national and elite interests align and where CEMAC and ECCAS
can play a supporting role. Such areas could be the threat of overspills for violent conflicts, regional food
security and sub-regional infrastructure.
7.20. Peace, security and stability are crucial for growth and integration in the CEMAC region. A
joined and sustained investment in security through COPAX could play a vital role for regional security
and integration. ECCAS’s Council for Peace and Security in Central Africa (COPAX) is the main political
and military coordination forum for the promotion, maintenance and the consolidation of peace in the
region. While CEMAC initially responded to the crisis in CAR, ultimately it has led to considerable
traction for ECCAS peace and security initiatives. Byiers (2017) suggests that the connections between
violence and illicit financing from natural resource extraction could also provide a potential role for
74
Before the passing of the former president of Gabon, Omar Bongo, the combined number of years spent in office
by the presidents of the six member states of CEMAC amounted to 147 years which is indicative of political
resistance to change and innovation.
103
regional bodies looking at money-laundering (through the CEMAC related GABAC75
) and for better
coordination of natural resource management.
7.21. Regional food security should be a common goal. About 45 percent of CEMAC’s population
suffers from undernourishment. Given food shortages and malnutrition across the entire CEMAC region,
achieving food security could be another common push factor to deepen regional integration, both
through facilitating intra-regional trade in agricultural products and increasing regional production.
7.22. The development of sub-regional infrastructure is important. Access to the sea is of particularly
importance for Chad and CAR, CEMAC’s two land-locked countries. The development of sub-regional
infrastructure linking Cameroon, Chad and Central African Republic through road and rail constructions
has started (Nono, 2015). CEMAC is also being supported by the EC in strengthening digital connections
among member states. While physical connections may be a good entry point to promote deeper
regional integration and cooperation, it has to be recognized that large-scale infrastructure projects are
often subject to different interests and power struggles; as evident from recent attempts to establish a
regional power pool.
75
Task Force on Money Laundering in Central Africa (Groupe d’Action contre le blanchiment d’Argent en Afrique
Centrale – GABAC).
104
REFERENCES
Abid, M. (2016). Size and Implication of Informal Economy in African Countries: Evidence from a
Structural Model. International Economic Journal, 30:4, 571-698.
African Development Bank (2010). Financial Sector Integration in Three Regions in Africa – How
Regional Financial Integration Can Support Growth. Development and Poverty
Reduction. Tunis.
Agbor, J. A. (2012). The future of the CEAM CFA Franc. Global Views, Policy Paper 2012-06. The
Brookings Institute.
Ahmed, H. and N. Hamid (2011). Financing constraints: determinants and implications for firm
growth in Pakistan. Lahore J. Econ. 16, 317–346.
Akitoby, B. and M. Cinyabuguma. 2004. “Sources of growth in the Democratic Republic of the
Congo: A cointegration approach.” IMF Working Paper 04/114. Washington, DC.
Almeida, R., & Carneiro, P. (2009). Enforcement of Labor Regulation and Firm Size. Journal of
Comparative Economics, 37, 28-46.
Araujo, J. and M. Brueckner, M. Clavijo, E. Vostroknutova and K. Wacker (2014). “Benchmarking
the determinants of economic growth in LAC”, World Bank, Report No. 91015-LAC.
Avom, D. (2007). Integration regionale dans la CEMAC: des problemes institutionnels
recurrents. Afrique Contemporaine, 2007/ 2/222.
Awasthi, Rajul, Michael Engelschalk (2018), “Taxation and the Shadow Economy”, WPS8391,
World Bank.
Atérido, R., Hallward-Driemeier, M., & Pages, V. (2011). Big constraints to small firms’ growth?
Business environment and employment growth across firms. Economic Development
and Cultural Change, 59 (3), 609--647.
Awoumou, C. D. G. (2008): ECCAS or CEMAC: Which Regional Economic Community for Africa?
in: C. Ayangafac (ed.): Political Economy of regionalization in Central Africa. Institute of
Securities Studies.
Ayadi, L., N. Benjamin, S. Benassi and G. Raballand. (2013). Estimating Informal Trade across
Tunisia’s Land Borders. World Bank Policy Research Paper 6731, December 2013,
Washington, DC.
Bach, D. (2016): Regionalism in Africa. Genealogies, institutions and trans-state networks,
Routledge Paperbacks.
Bagnai, A. (2010). Macroeconomic Convergence in Central Africa: A Survey of the Theory and
Empirical Evidence. Economic Commission for Africa.
Bah, E.-h., & Fang, L. (2015). Impact of the business environment on output and. Journal of
Development Economics, 159-171.
Barro, R. and X. Sala-i-Martin (2013). “Convergence.” Journal of Political Economy 100(2), pp.
105
223-251.
Bartelsman, Eric and Mark Doms (2000), “Understanding Productivity: Lessons from
Longitudinal Microdata”, Journal of Economic Literature, 38, 3, September, pp. 569-594.
Bastos, F., & Nasir, J. (2004). Productivity and the Investment Climate: What Matters Most?
World Bank Policy Research Working Paper 3335.
Baumol, W. (1986). “Productivity Growth, Convergence, and Welfare: What the Long-Run Data
Show.” American Economic Review 76(5), pp. 1072-1085.
Bayraktar, Nihal and Blanca Moreno-Dodson (2018a) Public spending and growth in an
economic and monetary union: the case of WAEMU, Eurasian Journal of Economics and
Finance, vol. 6(1), pages 107-132.
Bayraktar, Nihal and Blanca Moreno-Dodson (2018b). “Tax Structure and the Private Sector in
CEMAC.” Background paper for the CEM.
Bayraktar, Nihal, Tuan Le, Blanca Moreno-Dodson (2016) "Tax Revenues and Tax Efforts Across
the World". Handbook of Research on Public Finance in Europe and the MENA Region,
edited by Mustafa Erdogdu and Bryan Christiansen. IGI Global: Hershey, Pennsylvania.
Beck, T., Demirgüç-Kunt, A., & Maksimovic, V. (2005). Financial and legal constraints to growth:
Does firm size matter? The Journal of Finance, 60(1), 137-177.
Bernan, N., & Héricourt, J. (2010). Financial factors and the margins of trade: Evidence from
cross-country firm-level data. Journal of Development Economics, 93 (2), 206-2017.
Bernard, A. and S. Durlauf (1996). “Interpreting tests of the convergence hypothesis.” Journal of
Econometrics, 71, pp. 161-173.
Bertelsmann-Scott, T. (2003): “The private sector as a driver of regional integration”. Political
Economy of Regional Integration in Southern Africa Series, ECDPM.
Bikai, J. L, F.F. Owoundi (2016). “Le Choix d’un Régime de Change Permet-il de Limiter les
Mésalignements du Taux de Change? L’Exemple des Pays d’Afrique Subsaharienne.”
BEAC Working Paper 2/16. Banque des Etats de lAfrique Central (BEAC).
Bosworth, B., S. Collins and Y. Chen (1995). “Accounting for Differences in Economic Growth.”
Brookings Discussion Paper in International Economics, No. 115, 1-63.
Butler, A.W., Cornaggia, J., (2007). Does Access to Finance Improve Productivity? Evidence from
a Natural Experiment. Mimeo.
Byiers, B. (2017): Understanding regional economic policies in Central Africa. Struggling to
integrate in an intertwined region. ECDPM.
Calderon, C. and C. Cantu (2018): Foreign trade and growth in CEMAC: Intensity and
Concentration”. Background paper for the CEM. World Bank.
Carlin, W. and P. Seabright. (2007). Bring Me Sunshine: Which parts of the business climate
should public policy try to fix? Annual Bank Conference on Development Economics, Bled
Slovenia, 2007.
106
CEMAC (1994). “Traite Instituant la Communaute Économique et Monetaire de l'Afrique
Centrale.”
CEMAC (2017). “CEMAC Economic and Financial Reforms Program (PREF – CEMAC).” CEMAC.
Cirera, X., Willenbockel, D. and Lakshman, R. (2011) What is the evidence of the impact of tariff
reductions on employment and fiscal revenue in developing countries? A systematic
review. EPPI-Centre Technical Report No 1907. London: EPPI-Centre, University of
London
Clark, P. B. and MacDonald, R. (1999) “Exchange rates and economic fundamentals: a
methodological comparison of BEERs and FEERs”, in MacDonald, R and Stein, J (eds.),
Equilibrium exchange rates, Kluwer Academic Publishers.
Cooper, R.N., R. Dornbusch and R.E. Hall (1982), The Gold Standard: Historical Facts and Future
Prospects’, Brookings Papers on Economic Activity, Vol. 1982, No 1, pp 1-56.
Coulibaly, I. and J. Davis (2013). “Exchange rate regimes and economic performance” Does CFA
zone membership benefit their economies?” MPRA Paper No. 54075.
Crowe Horwath (2016) Africa Tax Facts Guide.
https://www.crowehorwath.net/uploadedFiles/MU/additional-
content/home/Africa%20Tax%20Facts%20Guide%202016.pdf
Dawson, J. and M. Strazicich (2010). “Time-series tests of income convergence with two
structural breaks: evidence from 29 countries.” Applied Economics Letters 17(9), pp.
909-912.
Demirguc-Kunt, A., Maksimovic, V. (1998). Law, finance, and firm growth. J. Finance 53 (6),
2107–2137.
Demirguc-Kunt, Love, I., Maksimovic, V. (2006). Business environment and the incorporation
decision. J. Bank. Finance 30 (11), 2967–2993.
Denison, Edward F. (1989), Estimates of Productivity Change by Industry: An Evaluation and an
Alternative, The Brookings Institution, Washington, DC.
Diewert, Erwin W. (2000), The Challenge of Total Factor Productivity Measurement,
International Productivity Monitor.
Djiofack, C. (2018): Using a dynamic global CGE model (ENVISAGE) to model the impact of
removing petty harassment costs (tracasseries) on intra-regional trade and growth in
CEMAC. Background paper to the CEM. World Bank.
Dinh, H.T., Mavridis, D.A., Nguyen, H.B. (2012). The binding constraint on the growth of firms in
developing countries. In: Dinh, H.T., Clarke, G.R.G. (Eds.), Performance of Manufacturing
Firms in Africa: An Empirical Analysis. World Bank, Washington D.C, pp. 87–137.
Doe, Lubin (2006) "Harmonization of Domestic Consumption Taxes in Central and Western
African Countries," IMF Working Paper No: WP/06/8 (January).
Dramani, L. (2010). “Convergence and Economic Integration in Africa: the Case of the Franc
Zone Countries.” AERC Research Paper 200, African Economic Research Consortium,
107
Nairobi.
Eifert, B., Gelb, A., & Ramachandran, V. (2005). Business environment and comparative in
africa: Evidence from the investment climate data. Proceedings of ABCDE Conference,
Senegal.
Escribano, A., J.L. Guasch and M. de Orte. (2006). CHILE Investment Climate Assessment (ICA)
on Productivity and on Allocative Efficiency: Effects on Exports, Foreign Direct
Investment, Wages and Employment.
Edwards, L., and RZ. Lawrence 2012. A strategic view of South African trade policy in relation to
the future global trading environment”, South African Journal of International Affairs,
19(3): 277-298.
Essien, A. (2006). Regional Trade Agreements in Africa: A Historical and Bibliographic Account of
ECOWAS and CEMAC.
European External Action Service (2018) “Trade: How to take advantage of the EU-Cameroon
EPA”.
Fafchamps, M., Schundeln, M., (2013). Local financial development and firm performance:
evidence from Morocco. J. Dev. Econ. 103, 15–28.
Ferrantino, M. (2006). "Policy Anchors: Do free trade agreements serve as vehicles for
developing country policy reform?" Office of Economics Working Paper No. 2006-04-A,
US International Trade Commission, Washington, D.C.
Fiess, N. and A. Kouevi (2018)” Productivity of non-oil sectors in CEMAC countries”. Background
paper to the CEM. World Bank.
Fiess, N. and R. MacDonald (2018). “The CEMAC and Currency Regime Issues.” Background
paper to the CEM. World Bank.
Fowowe, B. (2017). Access to finance and firm performance: Evidence from African countries,
Review of Development Finance 7 (2017) 6–17.
Frankel, J.A. and A. Rose. (1998). “The Endogeneity of the Optimum Currency Area Criteria.”
Economic Journal 108(449): 1009-25.
Frankel, J.A. (2003), “Experience and lessons from exchange rate regimes in emerging markets”,
NBER working paper No 0032, NBER.
Frankel. J. A. (2017). The currency-plus-commodity basket: a proposal for exchange rates in oil-
exporting countries to accommodate trade shocks automatically. CID Working Paper No.
333.Harvard University.
Ghosh, S. and A. Kraay. (2000). “Measuring growth in total factor productivity.” PREM Note, No.
42, World Bank. Washington, DC.
Ghura, D., K. Kpodar, and R.J. Singh (2010), “Financial Deepening in the CFA Franc Zone: The
Role of Institutions”, in M. Quintyn and G. Verdier (eds.) African Finance in the 21st
Century, International Monetary Fund and Palgrave Macmillan.
Giannetti, M., & Ongena, S. (2009). Financial integration and firm performance: Evidence from
108
foreign bank entry in emerging markets. Review of Finance, 13(2), 181-223.
Giannone, D., M. Lenza and L. Reichlin. (2009). “Business Cycles in the Euro Area.” ECB Working
Paper Series No. 1010.
Girma, S., Gong, Y., Gorg, H. (2008). Foreign direct investment, access to finance, and
innovation activity in Chinese enterprises. World Bank Econ. Rev. 22 (2), 367–382.
Grekou, C. (2015). Revisiting the nexus between currency misalignment and growth in the CFA
zone. Economic Modelling. 45,142-154.
Gui-Diby, S. and M.-F. Renard (2015). “Foreign Direct Investment Inflows and the
Industrialization of African Countries.” World Development 74, pp. 43-57.
Haddad, Mona, C.H. Hollweg and A. Portugal-Perez (2015) "The structural reform implications
of WTO accession", in Dadush and Osakwe, "WTO Accessions and Trade Multilateralism:
Case Studies and Lessons from the WTO at Twenty", Cambridge University Press, 2015,
Hadi, A. (1992). Identifying multiple outliers in multivariate data. Journal of the Royal Statistical
Society. Serie B (Methodological), 761-771.
Hadi, A. (1994). A modification of a method for the detection of outliers in multivariate samples.
Journal of the Royal Statistical Society. Series B (Methodological), 393-396.
Haile, F. (2016). “Growth and Structural Change in Tanzania: Retrospect and Prospect.” World
Bank, Background study for the World Bank Tanzania Systematic Country Diagnostic.
Haile. F. and L. Moller (2018). “Explaining Growth in CEMAC (2000-2016).” Background paper
for this CEM.
Harger, K., A. Young and J. Hall (2017). “Globalizations, Institutions, and Income Convergence.”
Journal of Regional Analysis and Policy (forthcoming).
Hassan, M. and F. Schneider (2016) "Size and Development of the Shadow Economies of 157
Countries Worldwide: Updated and New Measures from 1999 to 2013," IZA Discussion
Paper No. 10281 (October). http://ftp.iza.org/dp10281.pdf
Herrera, S. and W. Kouame. (2017). Productivity in the Non-Oil Sector in Nigeria: Firm-Level
Evidence. Policy Research Working Paper; No. 8145. World Bank, Washington, DC
IMF (International Monetary Fund) (2009). Chad: 2008 Article IV Consultation – Staff Report.
IMF Country Report 09/68. Washington, DC.
IMF (2015). Central African Monetary and Economic Community (CEMAC): Selected Issues. IMF
Country Report No. 15/308. Washington, DC.
IMF (2016). Regional Economic Outlook: Sub-Saharan Africa – Multispeed Growth. World
Economic and Financial Surveys, October 2016.
IMF (2016a). Central African Monetary and Economic Community (CEMAC): Staff Report on the
Common Policies of Member Countries. IMF Country Report 16/277. Washington, DC.
IMF (2016b). Central African Monetary and Economic Community (CEMAC): Selected Issues.
IMF Country Report 16/290. Washington, DC.
109
IMF (2016c). Regional Economic Outlook: Sub-Saharan Africa – Multispeed Growth. World
Economic and Financial Surveys, October 2016.
IMF (2017). Central African Monetary and Economic Community (CEMAC): Staff Report on the
Common Policies of Member Countries. IMF Country Report 17/176. Washington, DC.
Jaber, T. (1979). “The relevance of traditional integration theories to LDC’s,” Journal of Common
Market Studies, 9/3: 254.
Johansen, S. (1995) “Likelihood-based inference in cointegrated vector autoregressive models”,
Oxford University Press, Oxford, UK.
Kaufmann, D., A. Kraay and M. Mastruzzi (2010). “The Worldwide Governance Indicators:
Methodology and Analytical Issues.” Policy Research Working Paper 5430, World Bank.
Washington, DC.
Kavanagh, M. (2006). The 1994 Devaluation of the CFA Franc & The Changing Role of France in
African Development. International Development Studies, Working Paper 06-04, Yale.
Keen, Michael and Mario Mansour (2009) "Revenue Mobilization in Sub-Saharan Africa:
Challenges from Globalization," IMF Working Paper No: WP/09/157 (July).
Keen, Michael and Mario Mansour (2010a), "Revenue Mobilization in Sub-Saharan Africa:
Challenges from Globalization I - Trade Reform," Development Policy Review, 28(5): 553-
571.
Keen, Michael and Mario Mansour (2010b) "Revenue Mobilization in Sub-Saharan Africa:
Challenges from Globalization II - Corporate Taxation," Development Policy Review,
28(5): 573-596.
Kewir, K. (2015). Leadership and Economic Integration: the case of the Cameroon-Gabon
couple. Center for Strategic Research and Analysis. http://cesran.org/leadership-and-
economic-integration-the-case-of-the-cameroon-gabon-couple.html
Krueger, A. (1983), Trade and Employment in Developing Countries, 3: Synthesis and
Conclusions, University of Chicago Press, Chicago, IL
Krugman, P. (1988). Financing vs. Forgiving a Debt Overhang. Journal of Development
Economics, 29(3), 253 -268.
Lall, Sanjaya. (2005). Is African industry competing? Queen Elizabeth House Working Paper
Series no. 122. Oxford University.
Laporte G. (2012). What future for the ACP and the Cotonou Agreement? Preparing for the next
steps in the debate (ECDPM Briefing Note 34). Maastricht.
Laurens, Bernard L. (2008). “The Case of CEMAC,” Workshop on Regional Financial Integration
in Africa, December 1, 2008, Tunis.
Le Goff, M. and R. Singh (2012), “Does Trade Reduce Poverty? A View from Africa”, paper
presented at the Annual Conference of the Center for the Study of African Economies,
Oxford, March 18-20, 2012.
Levine, R., (2005), Finance and growth: theory and evidence. In: Aghion, P., Durlauf, S. (Eds.),
110
Handbook of Economic Growth, vol. 1, part A. Elsevier Science, The Netherlands, pp.
865–934.
Levinsohn, J., & Petrin, A. (2003). Estimating production functions using inputs to control for
unobservables. The Review of Economic Studies, 70 (2), 317-341.
Limão, N. and A. J. Venables (2001). Infrastructure, geographical disadvantage, transport costs,
and trade, World Bank Economic Review 15 (3): 451-479.
MacDonald, R. (2008), ‘An Exchange Rate Regime Proposal for Qatar’, Planning Authority of
Qatar.
MacDonald, R. (2010), “International Experiences in operating exchange rate regimes: drawing
lessons from the United Arab Emirates” in R. MacDonald and A. Al Faris (Eds), Currency
Union and Exchange Rate Issues: Lessons from the Gulf States. Edward Elgar.
Mansour, Mario (2014) "A Tax Revenue Dataset for Sub-Saharan Africa: 1980-2010," No I19,
Working Papers from FERDI.
Martijn, J. K. and Ch. Tsangarides (2008). “Trade in CEMAC: Developments and Reform
Opportunities.” In: Gulde, A.-M. and Ch. Tsangarides (eds.). The CFA Franc Zone:
Common Currency, Uncommon Challenges. IMF, Washington, DC. pp. 335-363.
Melitz, M. (2003). The impact of trade on intra‐industry reallocations and aggregate industry
productivity. Econometrica, 71 (6), 1695-1725.
Melitz, M., & Ottaviano, G. (2008). Market size, trade, and productivity. The review of economic
studies, 75 (1), 295-316.
Miller, T. and A. Kim (2017) “Index of Economic Freedom.“ The Heritage Foundation,
Washington, DC.
Mo Ibrahim Foundation (2016). “A Decade of African Governance 2006-2015. 2016 Ibrahim
Index of African Governance.” Index Report. Mo Ibrahim Foundation.
Moller, L. and K. Wacker (2017). “Explaining Ethiopia’s Growth Acceleration—The Role of
Infrastructure and Macroeconomic Policy”, World Development, 96, 198-215.
Moreno-Dodson, B. and N. Bayraktar (2018) "Taxes and Private Sector Activity in the WAEMU
Region," in: A. Zafar (ed.): Competitiveness Challenges in the CFA Zone in Sub-Saharan
Africa, unpublished document.
Mundell, R. (1997), “The international Monetary System in the 21 Century: Could Gold Make
and Comeback?”
Ndedi, A. (2015). “Roadmap for Regional Integration within the Central African Economic and
Monetary Community (CEMAC) under the NEPAD Framework.”
https://papers.ssrn.com/sol3/Data_Integrity_Notice.cfm?abid=2551739
Nguh, A. (2015). Challenges for an Effective Integration within the CEMAC Sub-Region:
Challenges Facing the Central Africa Regional Economic Community.
Nguh, A. and A. Ndedi (2017): “Factors hindering regional integration in CEMAC and the way
111
forward”. Background paper to the CEM.
Ntuda Ebode, J. V. (2004). Géopolitique des sous-régions africaines: quel destin pour l’Afrique
médiane latine?
Nubukpo, K., M. Ze Belinga, B. Tinel, and D. Moussa Dembele (eds.) (2016). Sortir l’Afrique de la
servitude monétaire. À qui profite le franc CFA ?, Afrique contemporaine, vol. 259, no. 3,
pp. 181-185.
Nyanteng, V.K. (1998). Rice in West Africa: consumption imports and production with
projections to the year 2000. Monrovia, WARDA.
OECD (1996a), Industry Productivity: International Comparison and Measurement Issues, OECD,
Paris.
OECD (2001), Measuring Productivity: Measurement of Aggregate and Industry-level
Productivity Growth, OECD, Paris.
Okigbo, B.N. (1982). In The developmental effectiveness of food in Africa, p. 11-67. New York,
Agricultural Development Council.
Pattillo, C., Ch. Tsangarides and P. van den Boogaerde (2008). “Growth and Convergence in the
CFA Franc Zone.” In: Gulde, A.-M. and Ch. Tsangarides (eds.). The CFA Franc Zone:
Common Currency, Uncommon Challenges. IMF, Washington, DC. pp. 299-334.
Pesaran, M. H.; Y. Shin and R. P. Smith (1999). ”Pooled mean group estimator for dynamic
heterogenous panels”, Journal of the American Statistical Association, 94, 446, 621-634.
Petersen. H. (2009) "Tax Systems and Tax Harmonisation in the East African Community",
available at http://www.eacgermany.org/index.php/eac-giz.../tax-harmonisation
PricewaterhouseCoopers (2017). Worldwide Tax Summaries - Corporate Taxes.
http://www.pwc.com/gx/en/services/tax/worldwide-tax-summaries/downloads.html
Rajan, R. G., & Zingales, L. (1998). Financial Dependence and Growth. The American Economic
Review, 88(3), 559--586.
Rajan, R. G., & Zingales, L. (2001). Financial systems, industrial structure, and growth. Oxford
review of economic Policy, 17(4), 467-482.
Sacerdoti, E., S. Brunschwig and J. Tang (1998). “The Impact of Human Capital on Growth:
Evidence from West Africa.” IMF Working Paper 98/162. Washington, DC
Sachs, J. and A. Warner (1995). Economic Convergence and Economic Policies. NBER Working
Paper No. 5039.
Sala-i-Martin, X. (1996). “The Classical Approach to Convergence Analysis.” Economic Journal
106, pp. 1019-1036.
Solarin, S. A. and P. K. Sahu (2013). “Convergence and Divergence in CFA FRANC Countries: A
Time Series Analysis.” Journal of Applied Business and Economics 14(2), pp. 112-127.
Strazicich, M., J. Lee and E. Day (2004). “Are incomes converging among OECD countries? Time
series evidence with two structural breaks.” Journal of Macroeconomics 26, pp. 131-145.
112
Subramanian, U., Anderson, W., & Lee, K. (2005). Measuring the Impact of the Investment
Climate on Total Factor Productivity: The Case of China and Brazil. World Bank Policy
Research Working Paper 3792.
Sy, A. (2015). The role of the CFA franc in the Economic Integration of the West Africa region.
Presentation held at the Second International Conference on Sustainable Development
in Africa, Dakar, November 2015.
Tahari, A., D. Ghura, B. Akitoby and E. Aka (2004). “Sources of Growth in Sub-Saharan Africa.”
IMF Working Paper 04/176. Washington, DC.
Tomljanovich, M. and T. Vogelsang (2002). “Are U.S. regions converging? Using new
econometric methods to examine old issues.” Empirical Economics 27, pp. 49-62.
Transparency International (2017). Corruption Perceptions Index 2016.
https://www.transparency.org/news/feature/corruption_perceptions_index_2016#table
Trevino, J. P. (2011). “Oil-Price Boom and Real Exchange Rate Appreciation: Is There Dutch
Disease in the CEMAC?” IMF Working Paper 11/268. Washington, DC.
UNCTAD (2012). Economic Development in Africa Report: Structural transformation and
sustainable development in Africa. United Nations publication.
UNCTAD (2015). Strengthening the private sector to boost continental trade and integration in
Africa. UNCTA Policy Brief No. 33, March.
Van den Boogaerde, P. and Ch. Tsangarides (2005). “Ten Years After the CFA Franc Devaluation:
Progress Toward Regional Integration in the WAEMU.” IMF Working Paper 05/145.
Washington, DC.
Van Parys, Stefan and Sebastian James (2010) "The effectiveness of tax incentives in attracting
investment: panel data evidence from the CFA Franc zone," International Tax and Public
Finance, 17: 400-429.
Vanheukelom, J., B. Byiers, S. Bilal and S. Woolfrey (2016). The political economy of regional
integration in Africa – What drives and constrains regional organisations? Synthesis
Report. European Center for Development Policy Management, Maastricht.
Weber, S. (2010). “bacon: An effective way to detect outliers in multivariate data using Stata
(and Mata)”. The Stata Journal, 10 (3), 331-338.
World Bank (2005). World Development Report 2005: A better Investment Climate.
World Bank (2009), "Simplification of Tax Declaration and Payment Formalities," Paper written
by CEMA SARL (October).
World Bank (2012). Cameroon Economic Update, July 2012: Stepping Out into the World.
Cameroon economic update.
World Bank (2016). Doing Business 2017–Equal Opportunity for All. Washington, DC.
World Bank (2017). Doing Business 2018–Reforming to Create Jobs. Washington, DC.
113
World Bank (2017a), “Etude sur les ecarts fiscaux en Republique Democratique du Congo”. Study
prepared by Leif Jensen and Gregoire Rota-Graziosi.
World Bank (2017b). Customs revenues and informal trade in Niger. Report No. ACS22612, June 2017,
Washington, DC.
World Bank (2018a). Elasticity of CEMAC reserves to oil prices. World Bank. Mimeo. Background note to
this report.
World Bank (2018b). Regent regional development in CEMAC. World Bank. Mimeo.
World Bank (2018c). Breaking Down the Barriers to Regional Agricultural Trade in Central Africa. World
Bank.
World Trade Organization (2017)
Zafar, A. (ed.) (2018): Competitiveness Challenges in the CFA Zone in Sub-Saharan Africa, unpublished
document.

Deepening Regional Integration-to-Advance-Growth-and-Prosperity

  • 1.
  • 2.
    ii ACKNOWLEDGEMENTS The Report hasbeen prepared by a team led by Norbert Fiess and consisting of Phillipe Aguera, Eric Kouevi, Nihal Bayraktar, Cesar Calderon, Leif Jensen, Joanne Gaskell, John Keyser, Hannah Nielsen, Alberto Portugal and Jose Signoret. A list of background paper commissioned for the report is provided below. The team also acknowledges the excellent guidance and support received from Elisabeth Huybens (Country Director), Francisco Carneiro (Practice Manager) and Mazen Bouri (Program Leader) throughout the process. Valuable guidance from Seynabou Sakho and Sona Varma at the inception of the report and helpful comments on technical aspects related to regional financial stability and trade facilitation from Ashani Chanuka, Myriam Chaudron, Ankur Huria and Cedric Mousset are gratefully acknowledged. The team would also like to thank the peer reviewers Ivailo Izvorski, Sandeep Mahajan and Christine Richaud for their very valuable insights. Research assistance from Soule Sow and Pierre Mandon (consultants), and administrative support from Silvia Gulino, Claudia Rocio Manrique, Angele Mountou and Irene Sitienei are also gratefully acknowledged. List of Background Papers for this Report: Bayraktar, N. and B. Moreno-Dodson (2018b). “Tax Structure and the Private Sector in CEMAC.” Calderon, C. and C. Cantu (2018): Foreign trade and growth in CEMAC: Intensity and Concentration”. Djiofack, C. (2018). “Using a dynamic global CGE model (ENVISAGE) to model the impact of removing petty harassment costs (“tracasseries”) on intra-regional trade and growth in CEMAC.“ Fiess, N. and A. Kouevi (2018). ”Productivity of non-oil sectors in CEMAC countries”. Fiess, N. and R. MacDonald (2018). “The CEMAC and Currency Regime Issues.” Haile. F. and L. Moller (2018). “Explaining Growth in CEMAC (2000-2016).” Nguh, A. and A. Ndedi (2017): “Factors hindering regional integration in CEMAC and the way forward”. Nielsen, H. and N. Fiess (2018). “Regional Integration and Convergence in CEMAC.”
  • 3.
    iii ACRONYMS AND ABBREVIATIONS AUAfrican Union BEAC Bank of Central African States (Banque des Etats de l'Afrique Centrale) BEER Behavioral Equilibrium Exchange Rate CAR Central African Republic CEMAC Central African Economic and Monetary Community CEN-SAD Community of Sahel-Saharan States CET Common External Tariff CFTA Continental Free Trade Area CIT Corporate Income Tax COBAC Central African Banking Commission (Commission Bancaire de l'Afrique Centrale) EBA Everything but Arms Program ECCAS Economic Community of Central African States ECOWAS Economic Community of West African States EPA Economic Partnership Agreement EU European Union FATF Financial Action Task Force FDI Foreign Direct Investment FEER Fundamental Equilibrium Exchange Rate FSA Financial Sector Assessment GDP Gross Domestic Product GIABA West Africa Inter-Governmental Action Group Against Money Laundering HDI Human Development Index IMF International Monetary Fund MFN Most favoured Nation MPC Monetary Policy Committee NATREX Natural Real Exchange Rate NEPAD New Partnership for Africa’s Development NPLs Non-Performing Loans NTMs Non-tariff Measures OAU Organization of African Unity REC Regional Economic Communities SIPS Systemically Important Payment Systems SPS Sanitary and Phyto-Sanitary SSA Sub-Saharan Africa TBT Technical Barriers to Trade TFA Trade Facilitation Agreement TFP Total Factor Productivity UEAC Central African Economic Union (Union Économique de l'Afrique Centrale) UMAC Central African Monetary Union (Union Monétaire de l'Afrique Centrale) VAT Value Added Tax WAEMU West African Economic and Monetary Union WTO World Trade Organization
  • 4.
    iv CONTENTS ACKNOWLEDGEMENTS ......................................................................................................................ii ACRONYMS ANDABBREVIATIONS.....................................................................................................iii Executive Summary...........................................................................................................................ix CHAPTER 1: Economic Developments and Convergence in the CEMAC Region..................................1 A. Introduction ......................................................................................................................................1 B. Economic and social indicators.........................................................................................................1 C. Trade linkages have changed significantly over time .....................................................................13 D. Exchange rate developments..........................................................................................................14 E. Economic convergence remains limited.........................................................................................18 F. Conclusion and policy recommendations.......................................................................................21 Annex ......................................................................................................................................................23 CHAPTER 2: Constraints to Private Sector Development ................................................................28 A. Introduction ....................................................................................................................................28 B. Obstacles to doing business............................................................................................................28 C. The performance and productivity of firms in CEMAC...................................................................35 D. Conclusion and policy recommendations.......................................................................................38 CHAPTER 3: The Financial Sector in CEMAC ...................................................................................39 A. Introduction ....................................................................................................................................39 B. Overview of the financial sector.....................................................................................................39 C. Challenges of the financial sector...................................................................................................42 D. Vulnerabilities and risks..................................................................................................................43 E. Conclusion and policy recommendations.......................................................................................44 CHAPTER 4: Taxation and Regional Integration..............................................................................47 A. Introduction ....................................................................................................................................47 B. The fiscal regime and tax structure in CEMAC................................................................................47 C. The tax revenue performance in CEMAC........................................................................................50 D. Conclusion and policy implications.................................................................................................56
  • 5.
    v CHAPTER 5: TradeAnalysis and Trade Policy in CEMAC Countries ..................................................60 A. Introduction ....................................................................................................................................60 B. Trade analysis for CEMAC countries...............................................................................................60 C. Trade policy in CEMAC....................................................................................................................70 D. Conclusion and policy recommendations.......................................................................................76 Annex ......................................................................................................................................................78 CHAPTER 6: Barriers to Regional Trade in Agriculture ....................................................................81 A. Introduction ....................................................................................................................................81 B. Agriculture in CEMAC......................................................................................................................81 C. Bottlenecks to agricultural trade ....................................................................................................85 D. Conclusions and policy recommendations .....................................................................................93 Annex ......................................................................................................................................................95 CHAPTER 7: Political Economy Considerations of Regional Integration in CEMAC............................96 A. Introduction ....................................................................................................................................96 B. CEMAC and regional integration in Central Africa..........................................................................96 C. Political economy aspects affecting regional integration and regional development ...................99 D. Conclusions and policy recommendations ...................................................................................102 REFERENCES ................................................................................................................................104
  • 6.
    vi List of Figures Figure1: CEMAC - Real GDP growth rate, GDP and GNI per capita (1984-2016).........................................3 Figure 2: CEMAC – oil and non-oil GDP shares (1990-2016), current prices................................................3 Figure 3: CEMAC – oil volume, value and price (1990-2016)........................................................................3 Figure 4: CEMAC – CPI inflation, annual average (1984-2000), percent ......................................................4 Figure 5: CEMAC – CPI inflation, annual average (2001-2016), percent ......................................................4 Figure 6: CEMAC – Overall fiscal balance as share of GDP (2000-2016), percent........................................5 Figure 7: CEMAC – Current account balance as share of GDP (2000-2016), percent...................................5 Figure 8: Total reserve assets, US$ billion (2001-2016)................................................................................6 Figure 9: Gross total debt as share of total CEMAC GDP (2000-2016).........................................................6 Figure 10: Human Development Index.........................................................................................................7 Figure 11: Education and health statistics....................................................................................................7 Figure 12: Doing Business 2018 report - categories .....................................................................................8 Figure 13: Ibrahim Index – overall governance index...................................................................................9 Figure 14: Ibrahim Index – sub-categories (2015) ........................................................................................9 Figure 15. Key growth drivers in CEMAC (2000-2016)................................................................................12 Figure 16. Structural drivers of growth in CEMAC, WAEMU and SSA ........................................................13 Figure 17: CEMAC - GDP convergence – compared to starting level (1960 and 1984) ..............................19 Figure 18: WAEMU - GDP convergence – compared to starting level (1960 and 1984) ............................19 Figure 19: Top ten constraints to business.................................................................................................29 Figure 20: Cost of bribes, security, crime, and power outages by country ................................................30 Figure 21: Cost of labor per worker............................................................................................................35 Figure 22: Productivity and Value Added per worker.................................................................................35 Figure 23: Contribution to value added by size..........................................................................................36 Figure 24. CEMAC - Total Assets by Country at end-January 2018.............................................................40 Figure 25. Distribution of Total Assets by Country as of September 30, 2017...........................................41 Figure 26. Composition of Government Tax Revenues as a Percent of GDP, CEMAC, 1980–2016............51 Figure 27. Selected Taxes (% of general government taxes, country averages) ........................................52 Figure 28: Effective and corporate income taxes and labor taxes and contributions, 2013-2016.............53 Figure 29. Effective Total Taxes Paid by Enterprises (Labor, Corporate Income and Other), % of Profit, average between 2005 and 2016 ...............................................................................................................54 Figure 30. Comparison of CIT rates across CEMAC countries (in % of profits), 2009-2015........................55 Figure 31. Total resource taxes (% of GDP) ................................................................................................56 Figure 32: Export value by category and petroleum export share in CEMAC trade...................................61 Figure 33: Concentration of goods exports in 2015 ...................................................................................61 Figure 34: Non-petroleum export value by country...................................................................................62 Figure 35: Petroleum export value by country...........................................................................................62 Figure 36: Extra-community exports of non-petroleum products to various partners..............................63 Figure 37: Extra-community exports of petroleum products to various partners .....................................63 Figure 38: Extra-community imports from various origins.........................................................................64 Figure 39: Share of intra-community exports in CEMAC exports by category ...........................................69 Figure 40. Trade Complementarity Indices for CEMAC countries, 2014 ....................................................70 Figure 41: Frequency of CET bands.............................................................................................................71 Figure 42: MFN duty rates applied by CEMAC countries, 2015..................................................................73
  • 7.
    vii Figure 43. Deviationsfrom the CET by country and HS chapter, 2015.......................................................74 Figure 44. Incidence of import NTMs in Cameroon, 2015..........................................................................76 Figure 45. Net Food Production Value (constant 2004-2006 $).................................................................84 Figure 46: Overlapping regional initiatives in Africa.................................................................................100 List of Tables Table 1: Overview of economic indicators for CEMAC region......................................................................6 Table 2: Ease of Doing Business indicator - CEMAC......................................................................................8 Table 3: Summary of governance indicators - CEMAC .................................................................................9 Table 4: Summary of governance indicators - WAEMU..............................................................................10 Table 5: Contribution of TFP and physical capital per worker to GDP per worker (in percent).................10 Table 6: Summary of results from convergence analysis ...........................................................................20 Table 7: Top three major or severe obstacles ............................................................................................29 Table 8. Selected Indicators on Access to Finance .....................................................................................31 Table 9. Selected Indicators on Financial Inclusion of Individuals (as percentage of population over 15 years), 2014 and 2017.................................................................................................................................32 Table 10. Firms Identifying Tax Rates or Tax Administration as a Major Constraint (percent of all firms) 33 Table 11. Percent of firms competing with informal firms and identifying this as a problem...................34 Table 12. CEMAC - Number of Registered MFIs by Category and Country as of September 30, 2017......40 Table 13. CEMAC - Evolution of the Number of Members and Clients of MFIs .........................................41 Table 14: Tariff Structure of Existing and Prospective Custom Unions in SSA ...........................................48 Table 15: Statuary Corporate Income Tax Rates in CEMAC in 2016 (% of profits).....................................49 Table 16: Preference utilization rates of exports to the EU by country in 2016 ........................................67 Table 17: Share of intra-regional exports for selected trade blocs. ...........................................................69 Table 18. CEMAC Common External Tariff, by broad sectors.....................................................................72 Table 19: Recorded agricultural exports by destination (%)......................................................................83 Table 20. Key Food Security and Nutrition Indicators in CEMAC................................................................85 Table 21. Price build-up for selected commodities on the Cameroon to Gabon corridor (% of final consumer prices).........................................................................................................................................91
  • 8.
    viii List of Boxes Box1. Monetary and fiscal policy in CEMAC ................................................................................................2 Box 2. Exchange rate regime and economic outcomes for the CFA zone ..................................................16 Box 3. Determinants of productivity – Regression Analysis .......................................................................37 Box 4. BEAC’s Strategic Plan 2017-2020 .....................................................................................................45 Box 5. BEAC’s Governance Reform .............................................................................................................46 Box 6. Investment incentives and codes in the CEMAC region ..................................................................49 Box 7. Trade and economic growth in CEMAC: regression nalysis.............................................................64 Box 8. Agriculture in CEMAC suffers from numerous constraints..............................................................82 Box 9. Unrecorded and informal trade in agricultural products is widespread. ........................................90 Box 10. Simulations of removal or tracasseries on intra- regional trade and growth in CEMAC...............92 Box 11. CEMAC structure and decision making processes……………………………………………………………………..95
  • 9.
    ix Executive Summary Introduction 1. TheCentral African Economic and Monetary Community (CEMAC), which consists of Cameroon, the Central African Republic, Chad, the Republic of Congo, Equatorial Guinea and Gabon, is one of the oldest regional groupings in Africa. CEMAC’s Vision 2025 calls for making the sub-region “an emerging and integrated economic space characterized by security, solidarity and good governance in the service of human development”. The main objectives for achieving this are: (i) the creation of a fully functional and effective customs union, (ii) the establishment of a robust system of macroeconomic surveillance, and (iii) the harmonization of sectoral policies and legal frameworks that will create a common market for goods, capital, and services. 2. Despite this ambitious vision, regional integration in the CEMAC zone remains shallow. The common external tariff is not effectively utilized; member countries continue to apply different rates to products depending on their national interests. Numerous obstacles to the free movement of people and goods remain; and sectoral and economic policies are far from being harmonized. Regional trade remains very modest compared to regional trade agreements in Africa and elsewhere. Recorded intra- CEMAC trade is estimated to represent only between 2 and 5 percent of the total trade of the member countries, the lowest of any regional integration community. CEMAC has also not delivered in terms of growth, as average growth during the last two decades has been slower than the sub-Saharan African (SSA) average. 3. The oil price shock of 2014-15 severely affected the six CEMAC economies and promoted re- commitment to deepening regional integration. In a crisis meeting in Yaoundé on December 23, 2016, CEMAC’s heads of state committed to fiscal austerity and structural reforms. This meeting set in motion a regionally-coordinated effort to maintain CEMAC’s external stability and preserve the integrity of its monetary arrangement, and Heads of State renewed their commitment to the CEMAC 2025 vision of deeper regional integration and cooperation under the umbrella of the regional economic and financial reform program (PREF-CEMAC), launched in July 2016. At the regional level, the PREF also aims to: (i) improve the coordination of public financial management (PFM) and fiscal policy; (ii) accelerate regional integration through improvements to the regional economic plan; (iii) improve the business climate; (iv) increase economic diversification; (v) enhance monetary policy transmission mechanisms; and (vi) improve prudential banking supervision. BEAC and COBAC, CEMAC’s regional central bank and financial authority, are making good progress in enhancing the transmission mechanism of monetary policy, supporting the build-up of regional reserves, and promoting financial sector stability. Member countries need to retain a commitment to fiscal consolidation; adopt community regulations, particularly on PFM, trade and investment into national legislations; and help CEMAC institutions strengthen regional macro surveillance. 4. CEMAC is right to focus on reforms to deepening regional integration as a driver of growth. Analyses conducted as part of this report indicate that there are significant gains to be had from such reforms. Increasing trade openness and reducing export concentration to the level of the Sub-Saharan average could increase CEMAC growth rate by 1 to 2 percentage points, while removing informal trade costs along CEMAC’s main trading corridors is estimated to increase intra-regional trade by 25 percent and add an additional 1 percentage points to growth over the medium-term. Deepening regional
  • 10.
    x integration will alsoallow CEMAC countries to overcome the lack of scale economies that is contributing to low levels of economic diversification and insufficient integration in regional and global value chains. 5. The objective of this Regional Study on CEMAC is to support policy makers in CEMAC in efforts to strengthen regional integration to support economic growth and to reduce the need for economic adjustment. The Regional Study focuses mainly on what can be done at the regional level to support regional integration, macro-stability and long-term growth in the CEMAC area; as such, the Regional Study aims to complement country-specific policies and initiatives to support macro-stabilization, economic development and integration. 6. The Regional Study is organized as follows. Chapter 1 takes stock of recent economic developments in CEMAC and documents low levels of intra-regional trade and convergence; this is a concern as economic convergence is both a prerequisite for a successful economic and monetary union and the expected outcome of the regional integration process itself. Increasing trade as an engine for growth and convergence requires a vibrant and competitive private sector. While structural factors, such as a poor business environment, can weigh on competitiveness, a misaligned exchange rate could also undermine competitiveness. As a real effective exchange rate assessment for CEMAC does not indicate significant misalignment, the lack of competitiveness in CEMAC seems largely due to structural constraints in the regional business environment. These structural constraints are further explored in Chapter 2 which identifies unreliable electricity, weak governance and corruption, unfair competitions from the informal sector, taxation and access to finance as the top five binding constraints for the CEMAC business environment. While most improvements to the business climate require national policy reforms, there is also scope for regional interventions to promote regional financial stability and integration to deepen access to finance (Chapter 3) and to ensure a level playing field for investment and taxation across CEMAC through a simplified and transparent corporate income tax framework, countering harmful tax competition, and by strengthening investment into regional supply chains (Chapter 4). Chapter 5 analyses current trade patterns in CEMAC and explores the role of trade policy in deepening integration. While CEMAC has a common external tariff, there are significant divergence at national level. Furthermore, there are significant non-tariff barriers and behind the border restrictions that prevent intra-regional trade. Non-tariff barriers and non-compliance with CEMAC transit agreements is particularly visible in regional agricultural trade. This is explored in Chapter 6 which looks at constraints to agricultural productions and barriers to regional agricultural trade in CEMAC. Chapter 7 complements the analyses in previous chapters by bringing a political economy perspective to regional integration in CEMAC. It underlines the importance of a political commitment to integrate and coordinate, but also to comply with regional directives and surveillance. Recent Developments and Convergence 7. The economy of the CEMAC region has grown substantially in recent decades, but remains vulnerable to oil price developments. Despite significantly different economic situations, ranging from low income to upper middle-income countries, five out of six CEMAC countries are oil exporters and heavily influenced by oil price changes. This was very apparent during the oil price shock of 2014-15, which severely affected the CEMAC region. As a result, previously high fiscal and external account balances turned to twin deficits; reserves declined and debt levels, which had been on a continued downward trend, started to increase. 8. Progress has been made regarding social and governance indicators, but there is significant room for improvement. Health and education statistics have improved for almost all countries.
  • 11.
    xi However, health andeducation outcomes are not in line with countries’ income status, especially for the middle-income countries of the group: these remain well below the average level of lower middle- income countries. Different governance indicators all raise serious issues for the CEMAC countries all of which are ranked in the bottom half or even the bottom third of the ranked countries. CAR and Chad fare particularly poorly with Gabon the highest ranked country from the region. Doing Business indicators report a similar picture with the CEMAC countries ranked among the bottom thirty of 190 countries. 9. Regional integration has not yet led to consistent convergence in macro-fiscal and socio- economic indicators between CEMAC member countries. Convergence — defined as the reduction of disparities in economic indicators, i.e., inflation, growth levels, and per capita income —is one of the key goals of currency unions. The idea is that, if achieved, convergence makes countries react in a similar way to common shocks, which means that a common macroeconomic policy to manage such shocks is more effective for all countries. Being part of an effective Convergence Club further raise the attractiveness for member countries to deepen regional integration. However, there is limited evidence for income convergence in the CEMAC region. Depending on the time frame and methodology, some evidence for convergence can be found, but this is not consistent across the region. Convergence seems to be higher for inflation, fiscal balances and the current account. 10. To achieve greater convergence, the CEMAC region should strive to promote openness and efficient economic policies and institutions. The CEMAC Economic and Financial Reforms Program (PREF-CEMAC, see CEMAC 2017) contains several initiatives and recommendations in support of sound economic policies and institutions in the region to support convergence. These include, amongst others, accelerating the creation of a common market, harmonizing public financial management (PFM), and strengthening regional macro-surveillance. 11. Improving the business environment is fundamental for the emergence of a strong private sector and to boost economic diversification and regional trade. Evidence from several waves of the Enterprise Survey for CEMAC countries indicates that most surveyed firms identify unreliable electricity, unfair competitions from the informal sector, corruption, taxation and access to finance as the top five binding constraints for the business environment. The costs of power outages, crime, security and bribes as a percentage of sales range from 7 percent in Gabon to 38 percent in CAR. Costs are also higher for smaller firms, non-exporters and service providers. An analysis of productivity in the non-oil sector further shows a negative correlation between firms’ productivity and business environment distortions in the CEMAC region, which trails peers in Doing Business and Governance Indicators. 12. Investment and business climate reforms mainly fall under the realm of national governments, but there is also scope for interventions at the CEMAC level. As part of the CEMAC- PREF, individual CEMAC countries are implementing economic diversification strategies to enhance the local business environment and competitiveness. At the regional level, CEMAC institutions can support reforms that promote intra-regional trade and the development of regional value chains. CEMAC-level business climate reforms should target the simplification of border procedures, including for visa-free travel within CEMAC, eliminating roaming cost for intra-CEMAC mobile telephony, and harmonizing axle load controls to facilitate transit trade. The operationalization of the Business Climate Observatory, which is still at the conceptual stage, could also help in this process. Mutually recognizing education qualifications, such as diplomas, would enhance intra-regional labor mobility, while establishing a
  • 12.
    xii CEMAC power poolcould support access to reliable electricity, which is one of the main constraint to private sector development in many CEMAC countries. 13. CEMAC level institution can further support the regional business environment by promoting regional financial stability and financial integration; leveling the playing field for investment and taxation across CEMAC; and promoting the free circulation of goods, services and people within the region. Financial Sector Stability and Access to Finance 14. CEMAC’s financial sector is underdeveloped and access to finance remains a major obstacle to private sector development. The financial sector remains shallow and mostly bank-based. The depth of the banking sector is limited and domestic credit to the private sector in the region is low, representing only 10 percent of GDP. However, the services provided by the financial sector are vital for the success of the medium-term growth and diversification agenda. Financial deepening and financial sector stability are an important corner stone for sustainable growth in the sub-region. 15. Regional financial integration in CEMAC also remains underdeveloped. Important progress has been made with regulating the financial sector at the regional level, but little has been achieved in facilitating integration of banking markets as regional infrastructure and markets are not sufficiently developed. Progress on the single banking license, harmonizing parallel legal frameworks for creditor rights at domestic and regional (OHADA) level, as well as completion of unifying CEMAC’s two parallel stock exchanges seem important interventions at the regional level. 16. The current economic environment requires effective policy actions by the CEMAC regional financial institutions to mitigate the impact of the crisis and develop a more resilient and inclusive financial sector. The BEAC’s Strategic Plan for 2017–2020; the implementation of governance reforms in the context of the IMF’s safeguards missions; and reforms at COBAC and GABAC to address key banking sector shortcomings, including related lending, risk concentration and AML/CFT are important measures in this regard. 17. Monitoring macro-financial risks should be part of regional macro-surveillance. Sub-regional monetary arrangements, the implementation of a common monetary policy as well as bank regulatory and supervisory arrangements and the presence of banking groups across the region could be significant sources of contagion across the sub-region. A regional credit bureau could play an important role in monitoring interconnected risks. Although none of the banks within CEMAC are currently considered systemic, and even if banking stress does not lead to a banking crisis, rising NPLs and weakening capital adequacy will likely restrict financial deepening and prevent the banking sector from becoming an engine for medium-term growth and economic diversification. Harmonization of Tax and Investment Codes 18. Tax policies in the CEMAC region are still mostly diverse and uncoordinated and the current tax structure creates unfair tax competition among member countries. The CEMAC members made several attempts to improve the structure and coordination of taxes in the region in order to increase productivity and investment and to achieve the goal of a common market, but the process has been slow. Some rules to harmonize consumption taxes, investment taxes and international taxes have been introduced, but exceptions at the national level. Member countries still need tax policies that can lead to higher efficiency and fewer distortions in their market.
  • 13.
    xiii 19. Within aregional integration initiative, harmonizing tax policies and investment codes is important for avoiding harmful tax competition between jurisdictions. CEMAC has some way to go in harmonizing taxation and tax exemptions. Even though a regional investment code exists, most member countries have yet to incorporate it into national legislation; in the context of strengthening regional supply-chains, the harmonization of taxation, tax exemptions and investment codes is essential. As many CEMAC countries are engaged in fiscal consolidation, it will be important to ensure that while efforts to increase taxation are important for fiscal consolidation, reformers should be mindful not to increase tax competition between jurisdiction. Intra-regional Trade and Trade Policy 20. Trade within CEMAC remains limited despite a significant regional integration effort. One objective of regional integration, especially through the creation of a customs union, is the increase in intra-regional trade flows by eliminating trade barriers. However, this increase in trade has not yet materialized in the CEMAC region. Exports and imports increased significantly in recent decades, but recorded trade within the region remains limited. In fact, CEMAC has the lowest percentage of intra- regional trade recorded for any regionally economic community (REC). 21. Trade policy has an important role to play in deepening integration. Despite a common external tariff (CET), there is significant divergence at national level. CEMAC countries have established national tariffs that deviate from the CEMAC CET for several hundred tariff lines. Notable deviations toward lower tariffs than in the CET include lower duties in Cameroon and Gabon for pharmaceuticals, and lower tariffs for tin and tin products in all countries except for Chad. Furthermore, while the CET applies on a most-favorable nation (MFN) basis, bilateral preferences with non-CEMAC parties can deviate from the CET. Since August 2016, Cameroon has lowered duties on EU imports, but these bilateral preferences have not been “multi-lateralized” within the community. Thus, Cameroon is extending preferential tariffs to EU products that face higher CET duty rates in other CEMAC countries. 22. CEMAC’s external tariffs are high when compared internationally. CEMAC’s average CET is 18.1 percent compared to 12.4 percent in ECOWAS. Tariffs are particularly high for certain manufactured goods (e.g. footwear) and food products. Eliminating the top tariff band of 30 percent and converging to a tariff schedule with only 4 instead of 5 bands would simplify the tariff regime and lower the average level of tariff protection to about 14.5 percent. This would reduce import prices for consumers. It would also reduce the degree of tariff dispersion that would lessen distortions and welfare losses for any given level of average protection. 23. Beyond tariffs, there are significant non-tariff measures that prevent intra-regional trade. The CEMAC agreement established a process for the harmonization and mutual recognition of technical measures certification procedures. This process has not advanced in practice, and standards regimes tend to differ across CEMAC countries. Data on non-tariff measures (NTMs), which are only available for Cameroon, indicate that about half of Cameroon’s tariff lines and more than two-thirds of imports are subject to non-tariff barriers. While some measures serve legitimate purposes (measures for health and safety), they are often inadequately designed or implemented. A first step towards harmonizing and streamlining non-tariff barriers within CEMAC require a comprehensive review of existing NTMs which should assess whether specific NTMs serve legitimate concerns and if they could be replaced with less distortive measures.
  • 14.
    xiv 24. Non-tariff barriersand non-compliance with CEMAC transit agreements is particularly visible in regional agricultural trade. Field work on transport costs for agricultural goods also show that corruption is an impediment to regional trade: estimates show that unofficial fees related to bribes and corruption add around 14 percent to trade costs. Simulations show that a reduction of those fees for goods transported along CEMAC’s trade corridors would increase intra-regional trade by about 25 percent and add between 1 to 2 percent to the growth rate of CEMAC countries. 25. CEMAC countries should consider negotiating an EPA with the EU as a block. An EPA can guarantee market access for CEMAC exports in the future and can also serve as an anchor for policy reform in different areas. Cameroon has ratified the interim EPA and has been liberalizing tariffs on EU products since August 2016; this has generated tensions with other CEMAC members. It would be important to assess Cameroon’s experience under the interim EPA, including potential adjustment costs for sectors affected by import competition. Such an assessment could provide valuable lessons for a prospective agreement with the CEMAC block to mitigate these costs. Agriculture and Regional Trade 26. Despite the region’s vast potential for agriculture production and trade, the agriculture sector in CEMAC remains largely underdeveloped. The oil price shock, prospects for continued low oil prices and depleting oil resources make a compelling case for economic diversification by reviving agriculture. Increased investments in agriculture can be a means to increase regional food security, reduce the food import bill and create jobs for the youth. 27. Agricultural activity in CEMAC faces many constraints, including access to land and finance; poor rural infrastructure; informality; limited access to improved inputs; insufficient agricultural advisory services; a high tax and regulatory burden and a high cost of agricultural inputs (seeds, fertilizers, animal feed). CEMAC’s Common Agriculture Strategy (SAC), adopted in 2003, but not yet implemented, provides a potential regional framework for economic diversification into agriculture; SAC strives to improve the regulatory framework for importing agricultural inputs, to adopt regional rules for the trade of seed and fertilizers, and to reform the regional framework for food safety, quality standards and product certification. 28. Common standards and harmonization of national and CEMAC policies would benefit regional trade in agriculture. Within Cameroon, for example, there is no single set of regulations governing agricultural trade with CEMAC neighbors. Field work also found that official regulations often clash with border practices. At the CEMAC level, it would be important to reduce border taxes that act as non-tariff barriers; establish a regional dialogue on SPS declaration requirements; and establish a trade regime for agricultural products that all governments can follow. The primary political economy obstacle towards implementing a trade regime for agricultural goods seems to be revenue generation or re-distribution from border activities. Experience from other trade blocs, including the EU, may be relevant as to how best to decrease dependency on border taxes. Political Economy Aspects 29. For regional integration in CEMAC to succeed, the political will for integration needs to go beyond aspirations that ebb and rise counter-cyclically with oil prices. Regional integration inherently entails the loss of some sovereignty to the transnational organization. CEMAC member countries often
  • 15.
    xv have seen thisas a threat to sovereignty1 , rather than as a necessity to boost trade in an effort to increase living standards. CEMAC’s national governments have, therefore, often elected to hold fast to their pre-association independence or to favor national interest over a community agenda. Rivalry over the location of CEMAC’s stock market, weak enforcement of CEMAC’s regional surveillance framework and the continued levying of tariff and non-tariff barriers on intra-regional trade reflect insufficient political will to fully embrace regional integration. 30. Deepening regional integration needs broad political commitment. In the case of Europe, integration started with the desire to maintain peace in Europe following the devastation of two World Wars in the first part of the last century. Within CEMAC, push-factors towards deeper regional integration could come from areas where national and elite interests align and where CEMAC and the Economic Community of Central African States (ECCAS) can play a supporting role. Such areas could be a regional response to the threat of overspills for frequent violent conflicts; improving regional food security; and strengthening sub-regional infrastructure. Cross-Cutting Policy Issues that Warrant a Regional Response Policy area Recommendation Regional Macro- Surveillance & Convergence CEMAC’s regional macro surveillance framework set limits on key macroeconomic indicators to promote the consistency of national policies with the sustainability of the common currency. To date there are no sanctions for non-compliance and enforcement of the framework has not been implemented consistently. Strengthening regional enforcement by the CEMAC Commission, including through a mandate for the Commission to validate the data submitted by national authorities, could significantly increase compliance. Community regulations on the compilation and provision of regular statistics on economic and financial data also need to be fully enacted in national legislations. CEMAC has a harmonized framework for the management of public finances, but the directives have not been fully transposed into national legislation, nor implemented. The harmonization of public finance frameworks should be a regional priority to (i) strengthen regional multilateral surveillance, (ii) promote financial integration, and (iii) ensure consistency of the monetary union. Promoting Economic Diversification & Private Sector Development Regional initiatives to enhance the business climate should target the harmonization of tax, investment and trade policies to level the playing field; avoid harmful competition between member states; and stimulate regional and global value chains. The operationalization of the Business Climate Observatory, if adequate private sector participation is assured, could help in this process. Establishing a CEMAC power pool could ease access to electricity, a key constraint to private sector development in many countries, while promoting regional ICT solutions could become an important driver for economic diversification and cross-border trade; eliminating regional roaming charges could be a first step. Mutually recognizing professional and educational qualifications would benefit labor mobility. CEMAC level institution can further support the regional business environment by promoting regional financial stability and financial integration. Deepening Despite an ambitious vision, regional integration in CEMAC remains shallow. 1 https://www.voanews.com/a/central-africa-economic-integration-difficult-after-20-years/1861181.html.
  • 16.
    xvi Regional Integration The common externaltariff is not effectively utilized and member countries continue to apply different rates on various products depending on national interests. Numerous obstacles to the free movement of people and goods also remain. Sectoral and economic policies are far from being harmonized. Regional policies should focus on deepening the common market, by: harmonizing customs exemptions; removing remaining non-tariff barriers; facilitate trade along trade corridors; implementing the CEMAC transit and customs regime; and setting and implementing regional standards for border agencies. CEMAC countries may also want to consider negotiating an EPA with the EU as a block as an EPA can guarantee market access for CEMAC exports in the future and can also serve as an anchor for broader policy reforms. Harmonizing integration policies with ECCAS and other RECs could further set the stage for broadening integration beyond CEMAC.
  • 17.
    1 CHAPTER 1: EconomicDevelopments and Convergence in the CEMAC Region A. Introduction 1.1 Economic convergence is both a prerequisite for a successful economic and monetary union and the outcome of the regional integration process itself. The objectives of regional integration are increased international trade and improved economic performance and stability through the facilitation of capital and labor mobility, reduced cost of trade and increased cooperation. The convergence of countries with low per capita income to richer countries should be enhanced in the context of a regional integration framework given the liberalization of capital movement among member countries. 1.2 The objective of this chapter is to provide an overview of the economic development, growth drivers and convergence among the CEMAC member countries. As background, key economic, social and governance indicators are presented first, followed by an analysis of drivers of growth through the growth accounting framework. The development of trade linkages between CEMAC countries and the rest of the world are analyzed, where after the results of different methods to evaluate convergence are presented. B. Economic and social indicators Economic developments show the continued oil dependence of CEMAC countries 1.3 The six CEMAC member countries face different economic and social conditions. According to their gross national income (GNI) per capita, the country classification ranges from low income countries (CAR and Chad) to lower middle-income countries (Cameroon and the Republic of Congo) and upper middle-income countries (Gabon and Equatorial Guinea) for 2017.2 Between 2007 and 2014, Equatorial Guinea was temporarily classified as high-income country. Out of the total population of 49.5 million in the CEMAC region in 2016, almost 50 percent live in Cameroon, which has also the largest economy, another close to 30 percent in Chad with the remaining 4 countries accounting for less than 10 percent each. Social indicators vary greatly as well, with the landlocked low-income countries CAR and Chad faring the worst. 2 See Figure A.1 in the appendix for the development of the country specific GNI.
  • 18.
    2 Box 1. Monetaryand Fiscal Policy in CEMAC Monetary policy in CEMAC is subordinated to the objective of exchange rate stability of the CFA peg, which is supported by a monetary cooperation agreement with France that guarantees the convertibility of the CFA franc and since 1999 the Euro at a given parity; the parity can only be changed after mutual consultations. CFA convertibility is ensured through an operations account at the French Treasury. CEMAC countries pool their foreign exchange reserves in the BEAC and a certain share of the reserves (up to 50 percent) must be deposited in the operations account through which all purchases or sales of foreign currencies or euros against CFA francs are settled. The French Treasury provides an unlimited overdraft facility through this account, albeit with some institutional safeguards and restrictions; for instance, BEAC is required to maintain a stock of reserves of at least 20 percent of base money and a breach over three consecutive months triggers emergency measures. The monetary policy committee (MPC) formulates policy and manages the pooled foreign exchange reserves. The MPC relies on a framework of monetary programming to set semi-annual targets on the net international reserve coverage of the monetary base and of the growth rates of bank credit to the economy and broad money (M2) in each member state. BEAC also aims to keep the annual inflation rate in the region below 3 percent. Unlike the European Central Bank, BEAC can extended credit to CEMAC governments when needed. BEAC statutes allow each member country to draw central bank credit up to a limit of 20 percent of the country’s fiscal revenue in the previous year, although these statutory advances to governments are being phased out. BEAC does not have an explicit mandate to provide liquidity assistance (ELA) to illiquid banks under their jurisdiction in a financial crisis. Bank supervision is conducted at the regional level, but bank resolution involves coordination with the national authorities concerned. In CEMAC, responsibility for bank supervision lies with the Central African Banking Commission (COBAC) which was set up in 1993. While the COBAC has the power to withdraw bank licenses, it relies on the cooperation of national authorities to be effective in dealing with troubled banks. Capital mobility is free in principal both within CEMAC and between CEMAC and France, but administrative hurdles limit capital mobility in practice. Fiscal policy and public debt management remain the responsibility of national governments, but they are subject to regional surveillance by the CEMAC Commissions. CEMAC’s regional macro surveillance framework set limits on key macroeconomic indicators to promote national policies consistent with the common currency. The regional convergence framework was initially adopted in 1994 with the objective to prevent excessive fiscal deficits (and deficit financing) to ensure the sustainability of the peg (IMF, 2009). CEMAC’s regional surveillance framework was refined in 2001, further augmented in 2008, and further revised in 2015. Members with policies that are inconsistent with the union's objectives are required to adopt adjustment programs to achieve convergence. However, to date there are no sanctions for noncompliance. The current regional surveillance framework from 2015, which became effective in January 2017, includes (i) a new fiscal rule based on a three-year average overall budget deficit; (ii) a public deficit ceiling, reinforced with a debt brake; (iii) a revised inflation criterion; and (iv) additional secondary criteria. The Commission is also exploring options to include a budgetary savings mechanism to help build buffers for future commodity shocks. Under the 2002 CEMAC supra-national framework, pro-cyclical fiscal policy and non-compliance with the convergence criteria has been a major concern. While the 2017 revised supranational fiscal surveillance framework substantially improves the scope (buffers), short-term focus, and guidance on corrective fiscal policy actions, the new framework still leaves room for creative accounting (insufficient data coverage, lack of harmonized definitions and audits of public arrears). Furthermore, there are no credible monitoring mechanisms or effective sanctions for non-compliance; it is therefore not clear how effective the new framework will safeguard fiscal and debt sustainability. See Ferdi (2016), Lopez-Calix and Balima (2017) and IMF (2017) for further details on the new convergence framework. 1 Before 2008, monetary policy in CEMAC was determined by the BEAC’s Board of Directors, assisted at the national level by the National Monetary Committees chaired by the finance ministers of the member countries. Under the new institutional framework, responsibility for setting monetary policy in each union now rests with a Monetary Policy Committee chaired by the respective central bank governor and including members from all member countries plus France (see IMF 2016).
  • 19.
    3 Figure 1: CEMAC- Real GDP growth rate, GDP and GNI per capita (1984-2016) Source: WEO, WDI, author’s calculation 1.4 Five out of six CEMAC countries are oil exporters and are heavily influenced by oil price changes. Except CAR, all CEMAC countries export petroleum, although Chad (in 2003) and Equatorial Guinea (in 1991) only more recently joined the ranks of the other three long-standing oil exporters. Even though the share of oil GDP in total GDP varies and decreased in recent years (see Figure 2 and 3), the oil price has been an important factor in the economic development of the oil exporting countries (see Figure 3). This can be seen in the overall GDP development shown in Figure 1. A rapid increase can be observed after 2000 coinciding with the increased oil production and higher oil prices, bringing average GDP and GNI per capita to a high level. Similarly, the recent decline in oil prices is reflected in lower growth rates and declining GDP and GNI per capita. Figure 2: CEMAC – oil and non-oil GDP shares (1990-2016), current prices Figure 3: CEMAC – oil volume, value and price (1990-2016) Source: WDI, WEO, author’s calculation; CAR excluded 1.5 Investment levels have been relatively high, mostly driven by private investment. Public investment levels have increased since 1999 and have averaged about 10.9 percent of GDP over the past ten years, peaking at 15.0 percent of GDP in 2012 and declining to 9.4 percent of GDP in 2015. Public investment as share of GDP has been high in Equatorial Guinea and the Republic of Congo and 0 2,000 4,000 6,000 8,000 -10 -5 0 5 10 15 real GDP growth rate (%), WEO GDP per capita (constant 2010 US$), PPP weighted average GNI per capita (Atlas, current US$), PPP weighted average 0% 20% 40% 60% 80% 100% 1990 1992 1994 1996 1998 2000 2002 2004 2006 2008 2010 2012 2014 2016 Oil GDP Non-oil GDP 0 50 100 150 0 10 20 30 40 50 1990 1992 1994 1996 1998 2000 2002 2004 2006 2008 2010 2012 2014 2016 Value (US$bn), LHS Volume, LHS Price (US$/barrel), RHS
  • 20.
    4 consistently low inCAR. Private investment levels have increased since 1990, peaking at 25.9 percent of GDP in 2002 and again at 21.8 percent of GDP in 2014 while declining to 16.8 percent in 2016. Equatorial Guinea has recorded the highest levels of private investment, while private investment in Chad reached a peak during 2001 and 2004 (64.5 percent of GDP in 2002), around the time petroleum was discovered in the country. 1.6 Foreign direct investment (FDI) as share of GDP peaked in the CEMAC region between 2001 and 2004, coinciding with large investments in Chad’s oil sector. FDI peaked at 7.9 percent of GDP in 2002 and has averaged 4.5 percent of GDP thereafter, registering 4.4 percent of GDP in 2016. FDI is often considered important for industrialization, but Gui-Diby and Renard (2015) show that between 1980 and 2009 FDI did not have a significant impact on the industrialization of 46 African countries. In the CEMAC region, it can be assumed that FDI was mostly channeled into the petroleum sector or the exploration and exploitation of other natural resources and has, therefore, not necessarily contributed to the diversification of the economy. 1.7 Inflation has remained relatively stable over the years. Average inflation (PPP weighted) in the CEMAC region has been relatively low over the past two decades, following a spike in 1994/1995 after the devaluation of the CFA franc (Figure 4 and 5). Between 2000 and 2016, inflation averaged only 2.7 percent, but country specific developments, such as the civil war in CAR that started in 2012, cause temporary divergence. Price stability in CEMAC is largely explained by CEMAC’s monetary policy framework that consist of a monetary union and CFA fixed currency peg arrangement (see e.g. Patillio et al. 2008 and Bagnai 2010). Box 1 provides an overview of the monetary and fiscal policy arrangements in CEMAC. Figure 4: CEMAC – CPI inflation, annual average (1984-2000), percent Source: WEO, author’s calculation Figure 5: CEMAC – CPI inflation, annual average (2001-2016), percent Source: WEO, author’s calculation 1.8 After years of high fiscal and external surpluses, the twin deficits have been widening in recent years. Driven by high oil prices and production, fiscal and external accounts recorded surpluses for several years with the exception of CAR. The declining oil prices coupled with high public expenditure -40 -20 0 20 40 60 80 100 -20 -10 0 10 20 30 40 50 1984 1986 1988 1990 1992 1994 1996 1998 2000 -15 -5 5 15 -15 -5 5 15 2001 2002 2003 2004 2005 2006 2007 2008 2009 2010 2011 2012 2013 2014 2015 2016 Cameroon Central African Republic Chad Congo, Rep. Gabon CEMAC (total), weighted by PPP Equatorial Guines (RHS)
  • 21.
    5 led to asignificant fall in both the budget balance and the external accounts. The overall budget balance for the CEMAC region declined from a peak of 18.6 percent of GDP in 2006 to -7.6 percent of GDP in 2016 while the current account balance fell from 9.7 percent of GDP in 2006 to -13.8 percent of GDP in 2016 (see Figure 6 and Figure 7). Figure 6: CEMAC – Overall fiscal balance as share of GDP (2000-2016), percent Figure 7: CEMAC – Current account balance as share of GDP (2000-2016), percent Source: WEO, author’s calculation 1.9 A similar development can be observed regarding debt levels and reserves. Given high oil prices and external and budget surpluses, CEMAC countries accumulated a significant amount of reserves, reaching US$17.4bn in 2013 before declining drastically to US$4.3bn in 2016. A panel analysis shows that the level of reserves reacts disproportionally to a variation of oil price (elasticity greater than 1), which makes the region even more susceptible to the negative effect of an oil price decline (World Bank 2018a). Debt declined substantially during the same time frame, also owing to 4 of the member countries reaching the HIPC completion point between 2006 and 2015.3 Overall debt in the CEMAC region as share of total CEMAC GDP was only 17.8 percent in 2010. Due to budget and current account deficits and the resulting financing needs, debt has been rising again since 2011. 1.10 Reflecting higher oil prices, the economic outlook has slightly improved for the CEMAC region. Growth has remained close to zero in 2017, but is projected to pick up to about 1.6 percent in 2018, largely due to increased oil production and moderately higher non-oil growth. The current account balance has also started to improve in 2017, but debt levels are expected to increase further. Monetary conditions remain tight, with broad money and credit to the private sector both contracting, but reserves have improved slightly in 2017 (World Bank 2018b). 3 Cameroon in 2006, CAR in 2009, the Republic of Congo in 2010 and Chad in 2015. -30 -20 -10 0 10 20 30 2000 2001 2002 2003 2004 2005 2006 2007 2008 2009 2010 2011 2012 2013 2014 2015 2016 -100 -50 0 50 -20 -10 0 10 20 30 2000 2002 2004 2006 2008 2010 2012 2014 2016 Cameroon Central African Republic Gabon CEMAC (total) Chad (RHS) Congo, Rep. (RHS) Equatorial Guines (RHS)
  • 22.
    6 Figure 8: Totalreserve assets, US$ billion (2001- 2016) Figure 9: Gross total debt as share of total CEMAC GDP (2000-2016) Source: WEO, author’s calculation Table 1: Overview of economic indicators for CEMAC region Averages (percent of GDP, unless otherwise indicated) 1984-2016 1984-93 1994-99 2000-09 2010-16 Real sector Real GDP growth (%) 3.5 1.1 3.6 6.4 2.8 Oil (%) 5.8 10.5 5.5 6.8 -2.0 Non-oil (%) 4.5 4.0 3.0 6.4 4.0 Real GDP per capita growth (%) 1.4 -1.2 3.5 5.5 -2.7 Real GDP per capita (USD 2010), PPP weighted average 4,608 3,858 4,033 5,121 5,440 Consumer price inflation (%), PPP weighted average 3.4 1.6 8.3 2.9 2.4 External sector Exports of goods and services 32.2 n/a 22.1 45.1 44.3 Imports of goods and services 28.5 n/a 22.8 34.5 39.6 Current account balance -2.4 n/a -3.7 0.6 -3.5 Fiscal sector Total revenue 15.5 n/a 11.8 24.2 22.9 Total expenditure (general government) 15.4 n/a 13.5 18.9 25.8 Primary fiscal balance 1.6 -1.0 0.9 7.4 -2.2 Overall fiscal balance 0.1 -2.0 -1.7 5.3 -2.9 Investment Public investment 5.0 0.6 3.1 5.9 11.8 Private investment 15.3 4.2 18.5 22.1 20.3 Source: WDI, WEO, author’s calculation 0 4 8 12 16 2001 2002 2003 2004 2005 2006 2007 2008 2009 2010 2011 2012 2013 2014 2015 2016 US$billion Cameroon CAR Chad Congo, Rep. Equatorial Guinea Gabon 0 20 40 60 80 100 2000 2001 2002 2003 2004 2005 2006 2007 2008 2009 2010 2011 2012 2013 2014 2015 2016 percent Cameroon CAR Chad Congo, Rep. Equatorial Guinea Gabon
  • 23.
    7 Social indicators lagbehind middle-income countries 1.11 The CEMAC region has made progress in social areas, but much remains to be done. The UNDP Human Development Index (HDI) shows improvements for all countries relative to previous years (Figure 10). However, worldwide, CAR and Chad are ranked as number 188 and 186, respectively, out of 188 countries. The other countries fare slightly better, but all remain in the bottom half of the ranking (Cameroon 153rd , the Republic of Congo and Equatorial Guinea 135th , Gabon 109th ). Figure 10: Human Development Index Source: UNDP 1.12 Similarly, health and education statistics have improved, but remain below the level of lower middle-income countries. Figure 11 shows that school enrolment rates improved and infant mortality rates declines in the last decades. However, enrolment levels remain worse than those of middle- income countries and for the case of infant mortality even higher than the Sub-Saharan African average. This is not in line with the income classification of some of the CEMAC members, such as Equatorial Guinea or Gabon, which are classified as upper middle-income countries. Developments for the individual countries are given in Table A.1 in the annex. Figure 11: Education and health statistics Source: WDI, author’s calculation 0.0 0.1 0.2 0.3 0.4 0.5 0.6 0.7 1990 2000 2010 2015 0 40 80 120 1980-1989 1990-1999 2000-2009 2010-2015 percent Gross primary school enrolment rate (%) CEMAC average (weighted by population) Sub-Saharan Africa Lower middle income Upper middle income 0 40 80 120 1980-1989 1990-1999 2000-2009 2010-2015 percent Infant mortality (per 1,000 live births) CEMAC average (weighted by population) Sub-Saharan Africa Lower middle income Upper middle income
  • 24.
    8 Governance and DoingBusiness indicators show a difficult operating environment 1.13 The CEMAC countries have some of the most difficult business operating environments in the world. According to the Doing Business 2018 report, the CEMAC countries were ranked among the bottom thirty of 190 countries in 2017 regarding the ease of doing business, showing only slight improvements for some countries compared to 2016 (see Table 2). The rankings are particularly poor when compared to the respective income group, Gabon and Equatorial Guinea, for example, are ranked 47th and 49th in a sample of 51 upper middle-income countries. Figure 12 shows country’s Doing Business profiles by DB categories. Table 2: Ease of Doing Business indicator - CEMAC Country Ease of doing business ranking (out of 190) DB 2018 DB 2017 Cameroon 163 166 CAR 184 185 Chad 180 180 Republic of Congo 179 177 Equatorial Guinea 173 178 Gabon 167 154 Source: World Bank (2017 and 2016) Figure 12: Doing Business 2018 report - categories Source: World Bank (2017) 1.14 Governance indicators also show substantial room for improvement. According to the Ibrahim Index of African Governance for 2016, all six CEMAC member countries are ranked in the bottom half of the 54 African countries that were evaluated, see Table 3. CAR fared worst with rank 52 out of 54 countries and Gabon best with rank 32. The Ibrahim Index furthermore constructs an overall governance index out of several sub-categories, which is then normalized between 0 and 100. Figure 13 shows the development of the overall index, which has generally been improving for most of the CEMAC countries; CAR is the exception due to the civil war that started in 2012. The sub-categories, given in Figure 14, 0 50 100 150 200 Starting a Business Dealing with Construction Permits Getting Electricity Registering Property Getting Credit Protecting Minority Investors Paying Taxes Trading across Borders Enforcing Contracts Resolving Insolvency Gabon Cameroon Congo, Rep Equatorial Guinea Chad Central African Republic
  • 25.
    9 show substantial differencesbetween the different countries, with generally low values for CAR, but also Chad and Equatorial Guinea. These developments are confirmed by the World Bank governance indicators, given in Figure A.2 in the annex, which show particularly low values for CAR, Chad and Equatorial Guinea. According to the Corruption Perception Index (Transparency International 2017), corruption can be considered a significant obstacle in most of the CEMAC countries and the Economic Freedom Index (Miller and Kim 2017) categorizes Cameroon, CAR and Gabon as mostly unfree and Chad, the Republic of Congo and Equatorial Guinea as repressed. Table 3: Summary of governance indicators - CEMAC Country Ibrahim Index Rank 2016 (out of 54) Corruption Perception Index Rank 2016 (out of 176) Economic Freedom Index Rank 2017 (out of 180) Cameroon 38 145 150 CAR 52 159 151 Chad 48 159 162 Republic of Congo 42 159 177 Equatorial Guinea 47 no data 174 Gabon 32 101 103 Source: Mo Ibrahim Foundation (2016), Transparency International (2017) and Miller and Kim (2017). Figure 13: Ibrahim Index – overall governance index Figure 14: Ibrahim Index – sub-categories (2015) Source: Mo Ibrahim Foundation (2016); scores range from 0 to 100 with 100 being the best possible score. 1.15 Compared to the CEMAC region, the WAEMU region fares better in terms of governance indicators. While all countries in the CEMAC region are in the bottom half of the countries ranked by the Ibrahim Index of African Governance for 2016, WAEMU countries except for Guinea-Bissau and Togo are ranked in the top half. In contrast to the CEMAC countries, no WAEMU country is classified as “repressed” according to the Economic Freedom Index (Miller and Kim 2017), but as “mostly unfree”, or, in the case of Cote d’Ivoire as “moderately free”. Similarly, WAEMU countries tend to fare better according to the Corruption Perception Index (Transparency International 2017), although Guinea-Bissau is ranked worse than the CEMAC countries. 20 70 2000 2001 2002 2003 2004 2005 2006 2007 2008 2009 2010 2011 2012 2013 2014 2015 Cameroon Central African Republic Chad Congo Equatorial Guinea Gabon 0 10 20 30 40 50 60 Safety & Rule of Law Participation & Human Rights Sustainable Economic Opportunity Human Development Cameroon Central African Republic Chad Congo Equatorial Guinea Gabon
  • 26.
    10 Table 4: Summaryof governance indicators - WAEMU Country Ibrahim Index Rank 2016 (out of 54) Corruption Perception Index Rank 2016 (out of 176) Economic Freedom Index Rank 2017 (out of 180) Benin 16 95 96 Burkina Faso 23 72 93 Cote d’Ivoire 21 108 75 Guinea-Bissau 44 168 119 Mali 25 116 102 Niger 27 101 154 Senegal 10 64 120 Togo 33 116 138 Source: Mo Ibrahim Foundation (2016), Transparency International (2017) and Miller and Kim (2017). Physical capital has been the main driver of growth 1.16 The growth accounting framework is used to analyze the contribution of physical capital and total factor productivity (TFP) to GDP growth. This analysis is done in two steps. First, a Cobb-Douglas production function is estimated to determine the long-term relationship between GDP growth and the development of physical capital.4 In a second step, the estimated elasticity between capital and output is used to decompose GDP growth into contributions of physical capital and a residual component, capturing changes in TFP as well as other factors such as external shocks, effects of war or institutional change.5 This decomposition of output growth is carried out for different time periods, the results are given in Table 5. Table 5: Contribution of TFP and physical capital per worker to GDP per worker (in percent) Components Time period Growth rate of real GDP per worker Growth rate of real physical capital per worker Growth rate of TFP 1982-1990 2.7 2.2 0.5 1991-1994 -3.6 -1.4 -2.2 1995-2000 1.1 0.3 1.4 2001-2005 4.8 1.0 3.8 2006-2010 0.6 1.0 -0.5 2011-2015 0.5 1.2 -0.7 1982-2015 1.4 0.9 0.5 Source: WDI, author’s calculation 1.17 The results show that over the entire period (1982-2015), physical capital has contributed more to output growth than changes in TFP. The difference is most pronounced in the early period of 4 The estimated elasticity of output per worker with respect to capital per worker for the time period 1981-2015 is 0.37, implying that a one percent increase in physical capital per worker leads to a 0.37 percent increase in GDP per worker. The coefficient is significant and falls within the range of values found in the literature for comparable countries (see e.g. Bosworth et al. (1995), Sacerdoti et al. (1998) or Tahari et al. (2004)). 5 The growth rate of real GDP per worker is decomposed into the contribution of real physical capital per worker growth and changes in TFP (The decomposition is done according to the following equation: Δ𝑦𝑡 = 0.37Δ𝑘 𝑡 + Δ𝑇𝐹𝑃𝑡. See Ghosh and Kraay (2000) or Akitoby and Cinyabuguma (2004) for a similar application of the growth accounting methodology). Due to the specification of the long-run relationship, including only physical capital per worker as explanatory variable, TFP is treated as residual component and captures not only changes in factor productivity, but, as mentioned above, for example institutional changes and the effects of civil unrest.
  • 27.
    11 1982 to 1990,most likely due to the large contribution of oil production, which is highly capital intensive, to growth. The following period pre-devaluation period (1990-1994) saw a declining of real physical capital and TFP. A small recovery was recorded between 1995 and 2000, the post-devaluation period, which also included e.g. political instability in the Republic of Congo. Between 2001 and 2005, TFP increased again, linked to high TFP growth in Chad due to the discovery of petroleum, whereas the following period was characterized by declining TFP. External factors and structural improvements have been important growth determinants 1.18 This section investigates the fundamental determinants of economic growth in CEMAC countries during 2000-2016. It examines whether, and to what extent, per capita growth can be traced to structural factors (infrastructure, financial intermediation, trade, education, government size, institutions), stabilization policies (inflation, exchange rate misalignment), and external conditions (terms of trade, export commodity prices). Infrastructure development is proxied by a composite index constructed as a weighted average of three individual indices measuring progress in power generation capacity, roads, and phone lines. Human capital is controlled for by secondary school enrolment. The trade-to-GDP ratio is included to capture the growth impact of openness to international trade. Government consumption (percent of GDP) serves as a measure of government size. Institutional quality is proxied by the Polity index. The analysis is performed by applying a regression model developed to explain long-term growth elsewhere (see Haile and Moller (2018)).6 1.19 Growth predictions are made by combining cross-country estimates of the growth impact of the above-mentioned determinants and country-specific values of the variables for 2000-2016. CEMAC countries7 have registered respectable growth rates since 2000, notwithstanding substantial variations across countries and over time. Chad stands out comparatively, with average per capita growth rates of about 3.8 percent and 3.4 percent, respectively. Cameroon and the Republic of Congo grew at a relatively slower pace, averaging 1-1.5 percent over 2000-2016. By contrast, CAR and Gabon have experienced negative average per capita growth rates over the same period (Figure 15). 1.20 Economic growth in CEMAC countries between 2000 and 2016 was primarily driven by external factors and structural improvements. Structural factors accounted for roughly 0.6 to 1.1 percentage points (ppts) of growth per capita in Chad, Cameroon, and the Republic of Congo – approximately 20-30 percent of the overall (predicted) growth over 2000-2016. This generally reflects the progress these countries have made, albeit still limited, in deep domestic growth factors, such as infrastructure. By contrast, the contribution of structural factors was much smaller in CAR and negative in Gabon. 1.21 Within structural factors, infrastructure played a relatively significant role in Cameroon and Chad, while the rest of the CEMAC countries experienced only modest improvements (Figure 16). Infrastructure contributed roughly 0.35 ppts and 0.26 ppts in Cameroon and Chad, accounting for about 23 percent and 7 percent of growth per capita, respectively. Cameroon has experienced the largest 6 The empirical analysis mainly uses the cross-country growth regression model in Brueckner (2014). See also Moller and Wacker (2017) and Araujo et al. (2014), and Haile (2016) for applications in the context of Ethiopia, Latin America, and Tanzania, respectively. 7 The analysis could not be done for Equatorial Guinea given data on the key infrastructure indicators were missing.
  • 28.
    12 growth contribution dueto infrastructure, reflecting the country’s large public investment projects in recent years, albeit at the expense of increase fiscal deficits and debt burden. In contrast, the growth contribution of infrastructure in other CEMAC countries remained insignificant, which is consistent with the fact that CEMAC countries, like most SSA economies, saw only limited progress in improving the quantity and quality of infrastructure, notably power and transport, over the past two decades. Among CEMAC countries, only Gabon has witnessed a slight deterioration in the infrastructure indicators under consideration. Figure 15. Key growth drivers in CEMAC (2000-2016) Source: Haile and Moller (2018) 1.22 External tailwinds were among the key contributors to growth in CEMAC over 2000-2016. External factors accounted for roughly 1.3 ppts, 0.48 ppts, and 0.4 ppts of the growth per capita in Chad, the Republic of Congo and Cameroon. External developments also contributed significantly to the modest growth in the rest of the CEMAC countries except CAR. Compared to the 1990s, CEMAC’s growth in the 2000s and early 2010s was propped up by external tailwinds and particularly by the demand-driven upsurge in global commodity prices, notably oil prices, that started in the early 2000s and lasted more than a decade – often dubbed commodity price “super-cycle”. In general, the large contribution of external factors comes as no big surprise given most of these countries have had high dependence on a single commodity, namely oil. The share of oil exports in total export revenue ranges from about 75 percent in Chad to 85 percent in the Republic of Congo. Cameroon has a relatively more diversified economy, with oil accounting for 30-40 percent of export revenue. Similarly, fiscal oil revenue represents 40-80 percent of total fiscal revenues in CEMAC countries, although somewhat lower for Cameroon. 1.23 Relatively prudent stabilization policies provided some growth impetus in CEMAC economies. Growth in the CEMAC zone coincided with relatively sound macroeconomic management, -1.0 -0.5 0.0 0.5 1.0 1.5 2.0 2.5 3.0 3.5 4.0 AnnualizedGDPp.c.growth(in%) Persistence Structural Stabilization External Residual (unexplained growth)
  • 29.
    13 notwithstanding the largefiscal imbalances over the past few years driven by the sharp decline in oil revenue. CEMAC countries have generally achieved stronger outcomes than other SSA regions, apart from WAEMU, with inflation remaining low at less than 3 percent and the real effective exchange rate broadly in line with fundamentals. Recently adopted CEMAC convergence criteria have helped anchor fiscal policy to reduce fiscal excesses and foster financial stability. However, the oil price shock in recent years has resulted in large external imbalances in most CEMAC countries. Figure 16. Structural drivers of growth in CEMAC, WAEMU and SSA Source: Haile and Moller (2018) 1.24 Unlike WAEMU countries, growth in CEMAC economies was more driven by external factors (high oil prices) while financial deepening played a much smaller role. CEMAC’s experience contrasts with those of non-resource-intensive countries where growth was high in recent years (averaging more than 6 percent in 2011-2017) driven by infrastructure investment and financial deepening. In contrast to the sharp credit growth WAEMU countries experienced since the early 2010s, the CEMAC region saw only modest expansion in private sector credit, despite variations across countries. Unlike the average SSA economy, CEMAC countries generally experienced limited improvements in key infrastructure. The growth contribution of trade in some CEMAC economies is larger than those for the average WAEMU and SSA countries. However, the contribution of education in CEMAC was smaller than in WAEMU and SSA. C. Trade linkages have changed significantly over time 1.25 Exports and imports increased significantly in the last decades. Exports went from an average of US$4.8bn in the 1980s, 29.4 percent of GDP, to an average of US$37.7bn between 2010 and 2016, 44.9 percent of GDP (see the chapter on trade analysis and policy for more graphs and details). This was mostly driven by increased export earnings from the Republic of Congo, Gabon and Equatorial Guinea due to high oil volumes and prices. Imports increased substantially as well from an average of US$2.7bn -0.4 -0.2 0.0 0.2 0.4 0.6 0.8 1.0 1.2 AnnualizedGDPp.c.growth(in%) Schooling Credit/GDP Trade/GDP Gov Cons./GDP Infrastructure
  • 30.
    14 in the 1980s,16.2 percent of GDP, to an average of US$17.1bn between 2010 and 2016, 19.9 percent of GDP. The largest increases were seen by Cameroon, the Republic of Congo and Gabon. 1.26 However, despite integration efforts, trade within the CEMAC region remains limited. The share of exports from the CEMAC region to Sub-Saharan Africa overall has not changed substantially since 1984, averaging about 2.1 percent of total exports. Only 1.6 percent of total exports from CEMAC countries went to another CEMAC member country between 1984 and 2015, which is 53.5 percent of all exports from CEMAC countries to Sub-Saharan Africa. The bulk is exported to Europe and Central Asia with an increasing share to East Asia and the Pacific, particularly China. The importance of France as export destination has decreased significantly from an average of 26.3 percent of total exports in the 1980s to an average of 5.2 percent between 2010 and 2016. A small increase in international trade can be seen after the devaluation in 1994. 1.27 Exports are dominated by natural resources with limited added value, while the CEMAC countries could potentially be able to produce some of the main imports within their respective country. The main export commodity of the CEMAC members is crude petroleum followed by other primary commodities, such as industrial diamonds, raw cotton, raw cocoa beans and aluminum and products that require limited manufacturing, such as saw-logs or other wood products. On the import side, processed food (e.g. rice, frozen fish and poultry), medicaments and machinery and specialized vehicles rank high. D. Exchange rate developments 1.28 The CFA fixed exchange rate arrangement has provided a stable environment for the CEMAC region. There is a long tradition in the economics literature which recognizes that macroeconomic performance can be enhanced by having a fixed exchange rate and particularly a fixed regime that allows a small open economy to buy into the credibility of another currency. There is little doubt that the existence of the CFA has given participating countries macroeconomic stability by facilitating the control of inflation through buying into the monetary credibility of the French franc/euro. 1.29 However, CEMAC has recently come under pressure to reform, also in terms of the CFA fixed exchange rate arrangement against the euro. Due to exchange rate misalignment in CEMAC after 2007, the CEMAC countries real non-oil GDP growth has been relatively stagnant and their performance has lagged that of oil exporting countries without conventional exchange rate pegs (see, for example, IMF 2016). Changing trade patterns; the decline in oil prices; and stagnant non-oil growth have raised a debate on the best way to improve economic growth in these countries. It could be a question of moving to a different exchange rate arrangement, as some have argued (see Nubukpo et al. 2016), or there may be underlying structural issues in the economies that need to be addressed. In addition, there may be structural and exchange rate misalignment issues at play. 1.30 In this section, the potential degree of exchange rate misalignment is assessed on the bases of a behavioral real effective exchange rate model (BEER). The BEER approach is not based on any specific exchange rate model and therefore may be regarded as a very general approach to modelling equilibrium exchange rates. The BEER produces measures of exchange rate misalignment which are free of any normative elements and one in which the exchange rate relationship is subject to rigorous
  • 31.
    15 statistical testing. TheBEER approach here is implemented using the multivariate cointegration methods of Johansen (1995).8 The results indicate limited misalignment 1.31 The plots of the estimated BEERs alongside the actual real effective exchange rates (REER) are presented thereby demonstrating any implied misalignment for a country. To aid in the interpretation of the latter, a simple HP adjusted version of the BEER is also presented to provide a smoother plot of the estimated equilibrium exchange rate. All the plots discussed here rely on estimates generated using the period 1995 to 2015; the REER is assessed as overvalued if it exceeds that of the BEER. 8 The full set of results are provided in Fiess and MacDonald (2018).
  • 32.
    16 Box 2. Exchangerate regime and economic outcomes for the CFA zone – a brief review of the literature. There seems to be broad consensus that the monetary union had a positive impact in terms of price stability and fiscal outcomes. Studies show that the monetary union has contributed positively to price stability in the region (Agbor 2012, Pattillo et al. 2008, Bagnai 2010). Coulibaly and Davis (2013) find that inflation rates have been 1.5-2.5 percentage points lower in the CFA zone than in other Sub-Saharan African countries. IMF (2016) confirms lower inflation and better fiscal outcomes for hard pegs in Sub-Saharan Africa for the 1980-2014 period. Evidence of exchange rate regime / exchange rate misalignment on growth and income convergence is more mixed. Coulibaly and Davis (2013) find no significant growth differential between the CFA zone and other Sub- Saharan African countries between 1994 and 2009. The IMF (2016) find that countries with more flexible exchange rates regimes have since 2000 experienced per capita growth rates that were 1-2 percentage points higher than those of their counterparts. It is worth pointing out that prior to 2000 there were no significant differences between growth performance and exchange rate regimes and even during the more recent period several countries with hard pegs in SSA have registered sizable real per capita growth rates (for example, during 2000–14 Burkina Faso grew at an annual rate of 2.7 percent, Chad at 5 percent, and the Republic of Congo at 1.9 percent) and even higher growth rates for shorter durations (such as the ongoing growth surge in Cote d’Ivoire). Grekou (2015) argues that the relationship between exchange rate undervaluation and growth needs to account for debt dynamics. Analyzing data from 1985 to 2011 for the CFA zone, he finds that during periods of undervaluation competitiveness gains have been offset by a negative impact on growth from a higher foreign currency value of debt. The striking difference in non-oil growth and per capita GDP performance since 2013 between WAEMU and CEMAC, despite sharing the same fixed exchange rate regime, also seems to suggest that structural factors beyond the exchange regime seem to be at play. 1.1 Figure 1: Comparative assessment of CEMAC's real non-oil GDP growth (%) Figure 2: Comparative assessment of CEMAC's real per capita GDP growth (%) Source: Authors’ calculation based on WEO. Exchange rate regime classification follows IMF de jure classification. All series are GDP weighted. -2 0 2 4 6 8 10 12 14 16 2007 2008 2009 2010 2011 2012 2013 2014 2015 2016 2017 Oil-exporting Countries (SSA) CEMAC WAEMU SSA without conventional exchange rate peg -6 -4 -2 0 2 4 6 8 2007 2008 2009 2010 2011 2012 2013 2014 2015 2016 2017
  • 33.
    17 1.32 The resultsfor Cameroon in Figure A.3 in the annex show a variety of misalignment regimes over the sample period and a very clear pattern of overvaluation post 2013. At its peak in 2014 the extent of overvaluation is approximately 7 percent. This would not be regarded as a dramatic overvaluation and indeed is an amount which would in all likelihood be wiped out due to standard sampling error. In this regard, it is noteworthy that the actual real exchange rate post 2014 has already started to depreciate towards the BEER estimate. 1.33 The results for the Central African Republic (CAR), the only non-oil producer in CEMAC, are given in Figure A.4 in the annex and show that, with exception of a short period post 2013, the currency is undervalued by approximately 5 percent and it is noteworthy that this has been the pattern since 1999. Again, though, this size of misalignment is probably not statistically significant and would not signal a serious issue with the exchange rate regime. 1.34 Figure A.5 in the annex reports the results for Chad and this indicates a clear pattern of overvaluation post 2011. Given that the graphics for Chad show a variable picture over the full sample period, the smoothed BEER picture shows a large degree of overvaluation in the post 2011 period, running at approximately 6 percent, on average. Whereas the actual BEER estimates imply a smaller average overvaluation of around 3 percent. 1.35 Consistent with the other oil producers, the results for Equatorial Guinea in Figure A.6 in the annex show a persistent overvaluation of the REER, post 2011. Although there is clear evidence of a reversion of the REER towards the BEER post 2014, it would seem to be chasing a moving target in that the BEER is on a straight downward trend post 2011; this is perhaps clearest for the HP adjusted BEER which shows a quite dramatic overvaluation end of sample of approximately 40 percent.9 This is clearly of a different order to the other overvaluations and is perhaps suggestive of the requirement of a regime change, in contrast to the other countries. 1.36 The REER based misalignment for Gabon, shown in Figure A.7 in the annex, is quite variable over the full sample switching from undervaluation at the start to overvaluation with an overvaluation being the pattern from 2013 (based on the HP BEER) until the sample end. As in the case of EQ the actual REER seems to be correcting post 2014 in that it is on a downward trajectory, although the estimated BEER is also on a sharp downward trajectory too, and it is unclear at the time of writing what the final outcome will be. The approximate overvaluation in 2015 is 14 percent for the Gabon REER which is again significantly more than some of the other countries. 1.37 The REER misalignment for the Republic of Congo, Figure A.8 in the annex, is again quite variable over the full sample period with a degree of overvaluation opening up at the end of the sample, post 2012, and as in the last two countries there is a downward trend for both the REER and the BEER, creating uncertainty regarding the timing of any correction. The end-point overvaluation for the Republic of Congo REER is approximately 10 percent in 2015. 1.38 The current valuation of the currency does not justify a short-term move to a different regime. For all countries there is clear evidence of currency overvaluation, especially for the recent past, but for most countries the misalignments are not so large that moving to a different currency regime would be recommended, at least not in the short term. For example, Cameroon, Chad, the Central African 9 The Pooled Mean Group Estimator shows an evaluation of about 20 percent for Equatorial Guinea.
  • 34.
    18 Republic and theRepublic of Congo are running with overvaluations in the 5-10 percent level, which cannot be seen as a sufficient gap to trigger a regime change. For these countries the focus should remain on medium-term fiscal consolidation and structural changes as discussed above. The outlier is Equatorial Guinea which is running with a current overvaluation of 40 percent which perhaps does indicate the need for a regime change in addition to structural changes. E. Economic Convergence remains limited 1.39 Economic convergence, which should be facilitated by regional integration, can be assessed by different methods. According to neoclassical theory, convergence of the countries with low per capita income can be observed to catch up with richer countries due to the diminishing marginal productivity of capital (see e.g. Barro and Sala-i-Martin 1992). In the context of a regional integration framework, convergence should be enhanced given the liberalization of capital movement among member countries. Economic integration should also lead to increased labor mobility, improved economic performance and stability, especially price stability and higher trade volumes between member countries. 1.40 Different methodologies can be used to assess if and to what extent convergence could be observed. These methodologies include the evaluation of the convergence of individual countries towards the CEMAC average, the convergence over time from a fixed starting point, the synchronization of business cycles for oil and non-oil growth as well as convergence measured by a disparity index to assess if disparity has decreased over time. In addition, time series models can be used to assess the extent of stochastic convergence between the CEMAC countries. 1.41 Looking at convergence of the growth performance compared to a starting point, there is little convergence among the CEMAC member countries. According to neoclassical theory, poorer countries should experience faster growth to catch up with previously richer countries, also called β–convergence (Sala-i-Martin 1996). Given 1960 as starting point, the graph is positively sloped, which indicates divergence rather than convergence (Figure 17 – left panel). With 1984 as initial year, the slope is negative, but the coefficient is not significant (Figure 17 – right panel), implying that initially poorer countries did not catch up significantly to their richer peers. This is in line with the findings of Solarin and Sahu (2013) of a positive coefficient for the CFA Franc region.10 10 The regression has also been run with 1994 as starting point, which yields a positive and insignificant coefficient.
  • 35.
    19 Figure 17: CEMAC- GDP convergence – compared to starting level (1960 and 1984) Source: WDI, author’s calculation 1.42 WAEMU countries, on the other hand, did display significant convergence among member countries. As seen in Figure 18, both left and right panel, the slope is negative and significant, even higher in the longer time period starting 1960. This indicates that the poorer WAEMU countries did grow faster than the richer member countries, pointing to a stronger framework for regional integration. Figure 18: WAEMU - GDP convergence – compared to starting level (1960 and 1984) Source: WDI, author’s calculation; No data available for Mali and Guinea-Bissau for 1960 1.43 Overall, there is no significant income convergence between CEMAC members. Although CEMAC became operational in 1999 and was preceded by UDEAC, different methodologies to assess income convergence between member countries indicate that there has been some but overall insufficient convergence. However, convergence seems to be higher for inflation, fiscal balances and the current account. The inflation rate has shown a much higher degree of convergence and stability over log(GDP2015/GDP1960) = -3.79 + 0.58 log(GDP1960) R2 = 0.55 -0.8 -0.6 -0.4 -0.2 0.0 0.2 0.4 0.6 0.8 1.0 1.2 6.0 6.5 7.0 7.5 8.0 8.5 RealGDPpercapitagrowthrate log(real GDP per capita in 1960) 1960-2015 log(GDP2015/GDP1984) = 3.60 - 0.42 log(GDP1984) R2 = 0.13 -1.0 -0.5 0.0 0.5 1.0 1.5 2.0 2.5 3.0 3.5 6.0 7.0 8.0 9.0 10.0 RealGDPpercapitagrowthrate log(real GDP per capita in 1984) 1984-2015 log(GDP2015/GDP1960) = 3.56 - 0.52 log(GDP1960) R2 = 0.44 -0.6 -0.4 -0.2 0.0 0.2 0.4 0.6 0.8 1.0 1.2 5.0 5.5 6.0 6.5 7.0 7.5 RealGDPpercapitagrowthrate log(real GDP per capita in 1960) 1960-2015 log(GDP2015/GDP1984) = 2.38 - 0.34log(GDP1984) R2 = 0.37 -0.2 -0.1 0.0 0.1 0.2 0.3 0.4 0.5 0.6 0.7 0.8 5.5 6.0 6.5 7.0 7.5 RealGDPpercapitagrowthrate log(real GDP per capita in 1984) 1984-2015
  • 36.
    20 the past decadesthan GDP.11 Table 6 presents a summary of the convergence analysis (see Nielsen and Fiess (2018) for more details). Table 6: Summary of results from convergence analysis Methodology Time frame Variable Result Convergence toward the CEMAC average over time 1984-2015 Growth Convergence for Cameroon, CAR, Chad and the Republic of Congo; no convergence for Equatorial Guinea, some convergence for Gabon, but large differential Inflation No systematic divergence for any country Convergence over time from fixed starting point (e.g. Solarin and Sahu, 2013) 1960-2015 Growth Significant divergence 1984-2015 Growth Insignificant convergence Business cycle convergence (Frankel and Rose, 1998) 1984-2015 Overall growth (filtered/ unfiltered) Convergence between Cameroon, Chad, Equatorial Guinea, Gabon and the CEMAC average; no convergence between individual countries Oil growth (filtered/ unfiltered) Convergence between Chad and the Republic of Congo (unfiltered); Gabon and the Republic of Congo (filtered) Non-oil growth (filtered/ unfiltered) Convergence between Cameroon and the Republic of Congo and the CEMAC average; convergence between Chad and Gabon Disparity index (Sala-i-Martin, 1996) 1984-2015 Growth Constant disparity (i.e. constant standard deviation) Inflation Decrease in disparity (i.e. convergence) 2000-2015 Fiscal balance Decrease in disparity Current account balance Decrease in disparity Stochastic convergence (e.g. Bernard and Durlauf, 1996) 1960-2015 Growth Convergence between Cameroon and CEMAC average (considering structural break) 1984-2015 Growth Convergence between CAR, Equatorial Guinea, Gabon and CEMAC average (considering structural break) Note: Two sample periods were considered for the convergence analysis: 1985- 2015 includes all six CEMAC countries (Equatorial Guinea joined UDEAC in 1984. The longer sample (1960 to 2015) excludes Equatorial Guinea for ease of comparison. See Nielsen and Fiess (2018) for further details. 11 These findings seem aligned with e.g. Boogaerde and Tsangarides (2005), Pattillo et al. (2008), Bagnai (2010), Dramani (2010) and Solarin and Sahu (2013).
  • 37.
    21 F. Conclusion andPolicy Recommendations 1.44 The economy of the CEMAC region has grown substantially over the past decades, but remains vulnerable to oil price developments. Despite significantly different economic situations, ranging from low income to upper middle-income countries, five out of six CEMAC countries are oil exporters and heavily influenced by oil price changes. This could particularly be seen in the last few years with the negative impact of the sharp decline of the oil price. As a result, previously high fiscal and external account balances turned to twin deficits, reserves declined and debt levels, which had been on a continued downward trend, started to increase. Inflation, however, has remained relatively stable over the years. 1.45 Progress has been made regarding social and governance indicators, but there is significant room for improvement. Health and education statistics have improved for almost all countries. However, health and education outcomes are not in line with their income status, especially for the middle-income countries of the group, remaining well below the average level of lower middle-income countries. Different governance indicators all raise serious issues in the CEMAC countries and rank them in the bottom half or even third of the ranked countries. CAR and Chad fare particularly poor with Gabon typically being the highest ranked country from the region. Doing Business indicators report a similar picture with the CEMAC countries ranked among the bottom thirty of 190 countries. 1.46 Trade within CEMAC remains limited despite regional integration efforts. One objective of regional integration initiatives, especially through the creation of a customs union, is the increase in intra-regional trade flows by eliminating trade barriers. However, this has not yet been the case in the CEMAC region. While exports and imports increased significantly over the past decades, trade within the region remains limited. Exports from member countries to the CEMAC region only accounted for an average of 1.6 percent of total exports between 1984 and 2015. The import share increased only slightly to 3.7 percent of total imports. This confirms the slow progress of regional integration in trade. In addition, CEMAC members are affected by high costs and time requirements when trading across borders. 1.47 There is limited evidence for income convergence in the CEMAC region. The evaluation of income convergence using different methodologies shows that depending on the time frame considered, some evidence for convergence can be found, however, not consistently across the region. However, convergence seems to be higher for inflation, fiscal balances and the current account. 1.48 Economic growth convergence also depends on economic policies and institutions. Despite the adoption of convergence criteria, CEMAC member countries have not reached similar growth and fiscal levels. Convergence is crucial for the success of the currency union, but recent IMF estimates show that CEMAC countries have a poor track record in meeting convergence criteria. Low levels of business cycle correlation in the CEMAC and evidence that business cycles may have become even less synchronized in recent years (Nielsen and Fiess, 2018) may suggest that fiscal divergence has also played a role in this. Darvas et al. (2005) find that the Maastricht “convergence criteria,” used to determine eligibility for EMU, have indirectly moved Europe closer to an optimum currency area by reducing countries’ abilities to create idiosyncratic fiscal shocks; greater compliance with the CEMAC convergence criteria may have a similar stabilizing effect for CEMAC. Sachs and Warner (1995) underline the fact that economic convergence requires efficient economic policies and institutions. The CEMAC Economic and
  • 38.
    22 Financial Reforms Program(PREF-CEMAC, see CEMAC 2017) contains several initiatives and recommendations that would support sound economic policies and institutions in the region to support convergence. These include, among others, accelerating the creation of a common market, harmonizing budget rules and improving budget policy coordination. 1.49 The current valuation of the currency does not seem to justify a short-term move to a different exchange rate regime. A real effective exchange rate assessment provides some evidence of exchange rate overvaluation in CEMAC, but misalignments are not so large that moving to a different currency regime would be recommended, at least not in the short term. As such, the lack of competitiveness in CEMAC seems largely due to structural constraints in the regional business environment. To support regional competitiveness and the sustainability of the currency peg, CEMAC countries should remain focused on medium-term fiscal consolidation and promote structural reforms that enhance productivity.
  • 39.
    23 Annex Figure A.1: RealGDP growth rate, GDP and GNI per capita (1984-2016) Source: WEO, WDI, author’s calculation 0 500 1,000 1,500 2,000 -10 -5 0 5 10 1984 1986 1988 1990 1992 1994 1996 1998 2000 2002 2004 2006 2008 2010 2012 2014 2016 CAMEROON real GDP growth rate (%), WEO GDP per capita (constant 2010 US$), PPP weighted avg. GNI per capita (Atlas, current US$), PPP weighted avg. 0 200 400 600 -40 -20 0 20 1984 1986 1988 1990 1992 1994 1996 1998 2000 2002 2004 2006 2008 2010 2012 2014 2016 CAR real GDP growth rate (%), WEO GDP per capita (constant 2010 US$), PPP weighted avg. GNI per capita (Atlas, current US$), PPP weighted avg. 0 500 1,000 1,500 -20 0 20 40 1984 1986 1988 1990 1992 1994 1996 1998 2000 2002 2004 2006 2008 2010 2012 2014 2016 CHAD real GDP growth rate (%), WEO GDP per capita (constant 2010 US$), PPP weighted avg. GNI per capita (Atlas, current US$), PPP weighted avg. 0 1,000 2,000 3,000 4,000 -15 -5 5 15 25 1984 1986 1988 1990 1992 1994 1996 1998 2000 2002 2004 2006 2008 2010 2012 2014 2016 CONGO real GDP growth rate (%), WEO GDP per capita (constant 2010 US$), PPP weighted avg. GNI per capita (Atlas, current US$), PPP weighted avg. 0 10,000 20,000 30,000 -50 0 50 100 150 200 EQUATORIAL GUINEA real GDP growth rate (%), WEO GDP per capita (constant 2010 US$), PPP weighted avg. GNI per capita (Atlas, current US$), PPP weighted avg. 0 5,000 10,000 15,000 -20 -10 0 10 20 GABON real GDP growth rate (%), WEO GDP per capita (constant 2010 US$), PPP weighted avg. GNI per capita (Atlas, current US$), PPP weighted avg.
  • 40.
    24 Table A.1: Educationand health statistics Gross primary school enrolment rate (%) Country 1980-1989 1990-1999 2000-2009 2010-2015 Cameroon 97.2 83.7 98.6 111.9 Central African Republic 70.7 64.0 72.6 93.0 Chad 40.5 52.1 72.2 95.0 Congo, Rep. 131.9 111.2 106.4 112.1 Equatorial Guinea 165.3 134.6 96.8 81.7 Gabon 146.3 141.8 104.6 142.0 CEMAC average (weighted by population) 92.7 79.2 89.2 102.6 Sub-Saharan Africa 77.2 75.2 90.7 97.8 Lower middle income 90.4 93.0 100.6 104.8 Upper middle income 113.9 112.9 109.2 108.2 Infant mortality (per 1,000 live births) Country 1980-1989 1990-1999 2000-2009 2010-2015 Cameroon 95.4 91.2 79.7 60.6 Central African Republic 116.2 115.1 109.4 95.7 Chad 122.0 111.3 100.7 88.4 Congo, Rep. 64.6 68.2 62.8 36.1 Equatorial Guinea 137.8 117.6 93.0 72.3 Gabon 66.4 58.4 50.5 38.4 CEMAC average (weighted by population) 97.8 95.9 86.0 69.0 Sub-Saharan Africa 113.8 103.7 81.2 59.8 Lower middle income 94.5 75.4 56.9 42.6 Upper middle income 47.5 37.3 24.4 16.1 Life expectancy at birth Country 1980-1989 1990-1999 2000-2009 2010-2015 Cameroon 52.6 53.1 52.1 55.0 Central African Republic 49.5 47.0 45.1 49.9 Chad 45.8 47.3 48.1 51.1 Congo, Rep. 56.2 52.6 53.6 61.6 Equatorial Guinea 46.0 50.1 53.6 57.2 Gabon 58.4 60.7 59.8 63.8 CEMAC average (weighted by population) 51.1 51.2 50.8 54.4 Sub-Saharan Africa 49.3 50.0 52.6 58.0 Lower middle income 57.7 61.1 64.3 67.0 Upper middle income 66.8 69.1 72.0 74.2 Source: WDI, author’s calculation
  • 41.
    25 Figure A.2: Governanceindicators – 2015 Source: World Bank 0 10 20 30 40 50 60 CAMEROON CENTRAL AFRICAN… CHAD CONGO EQUATORIAL GUINEA GABON Voice and accountability 0 10 20 30 40 50 60 CAMEROON CENTRAL AFRICAN… CHAD CONGO EQUATORIAL GUINEA GABON Political stability 0 10 20 30 40 50 60 CAMEROON CENTRAL AFRICAN… CHAD CONGO EQUATORIAL GUINEA GABON Government effectiveness 0 10 20 30 40 50 60 CAMEROON CENTRAL AFRICAN… CHAD CONGO EQUATORIAL GUINEA GABON Regulatory quality 0 10 20 30 40 50 60 CAMEROON CENTRAL AFRICAN… CHAD CONGO EQUATORIAL GUINEA GABON Rule of law 0 10 20 30 40 50 60 CAMEROON CENTRAL AFRICAN… CHAD CONGO EQUATORIAL GUINEA GABON Control of corruption
  • 42.
    26 Figure A.3. Cameroon:BEER, HPBEER and Current Misalignment Figure A.4. Central African Republic: BEER, HPBEER and Current Misalignment Figure A.5. Chad: BEER, HPBEER and Current Misalignment
  • 43.
    27 Figure A.6. EquatorialGuinea: BEER, HPBEER and Current Misalignment Figure A.7. Gabon: BEER, HPBEER and Current Misalignment Figure A.8. Republic of Congo: BEER, HPBEER and Current Misalignment
  • 44.
    28 CHAPTER 2: Constraintsto Private Sector Development A. Introduction 2.1. Deepening regional integration in CEMAC requires active private sector participation. One of the major reasons for the weakness in the Africa regional trade performance has been the lack of a private sector that is dynamic and vibrant enough to seize existing opportunities in the trading system. According to UNCTAC (2015), Africa’s private sector faces several challenges linked to high and rising informality, small size of enterprises, weak inter-firm linkages, low level of export competitiveness and low innovation capabilities. These challenges are compounded by the fact that regional integration initiatives often focus on processes, such as the removal of trade barriers, without the commensurate attention to the building of productive capacities and private sector development that would effectively address the consequent weaknesses. 2.2. Focusing on CEMAC’s non-oil firms in manufacturing, retail and other services, this chapter analyzes how distortions of the business climate affect the private sector performance. The main obstacles to private sector development are identified and evaluated. In addition, the performance of firms is assessed. Using data from the Enterprise Surveys, the analysis helps to evaluate CEMAC firms’ performance and track business constraints at the firm level. B. Obstacles to doing business Main obstacles to doing business 2.3. Improving the business environment implies reducing distortions and obstacles to doing business, and expanding economic opportunities. Empirical evidence from a wide range of enterprise-level studies suggests that a poor business environment has a significant and adverse impact on productivity, growth and economic activity (Escribano et al., 2006; Eiffert et al. 2005). In Sub-Saharan Africa, specifically, financial and market distortions have a severe impact on business (Bah and Fang, 2015; Giannetti and Ongena, 2009). Analyzing Enterprise Survey data for CEMAC, Fiess and Kouevi (2018) find that more than half of surveyed firms in CEMAC identify lack of electricity, unfair competition from the informal sector and corruption are identified as the top constraints for doing business in the CEMAC region (see Figure 19). At country-level, access to finance (Cameroon, CAR), political instability (Republic of Congo, Chad), transport (Gabon) and an insufficiently skilled workforce (Gabon) also figure among the top three constraints to doing business (Table 7).
  • 45.
    29 Figure 19: Topten constraints to business Note: The Enterprise Survey asks managers to rank different aspects of the business environment (e.g. access to electricity, access to finance, corruption) on a 5-point scale ranging from 0 (not an obstacle) to 4 (severe obstacle to doing business). Top constraints are identified as the share of managers that rank a given aspect of the business environment as major or severe. Source: Fiess and Kouevi (2018). Table 7: Top three major or severe obstacles Countries Obstacle 1 Obstacle 2 Obstacle 3 Cameroon Informal sector Electricity Access to finance Gabon Electricity Transport Access to educated workers Rep. of Congo Electricity Political instability Corruption Chad Electricity Informal sector Political instability CAR Electricity Access to finance Informal sector Source: Enterprise Survey data. 2.4. Costs associated with these distortions are considerable, but vary across CEMAC. Using the combined cost of power outages, crime, security and bribes as a percentage of firm sales as a proxy for the cost of distortions to the doing business, the percentage of sales that firms report as lost to distortions is the highest in CAR (38 percent), followed by the Republic of Congo (25 percent), Cameroon (13 percent), Chad (9 percent) and Gabon (7 percent) (see Figure 20). Power outages are most costly to firms in CAR and Cameroon, while crime (Chad and Republic of Congo) and bribes (Gabon) are a significant cost factor in the other CEMAC countries. Fiess and Kouevi (2018) further show that for the CEMAC region as a whole, power outages, crime, security and bribes are more costly to smaller firms, to firms that only operate in the domestic market (non-exporting firms), and to firms in the service sector. 62.4 57.9 53.2 50.7 49.3 46.7 38.3 36.6 36.2 35.6 0204060 %sayingareaismajororsevereobstacle source: Author's calculations based on panel data from Enterprise Surveys Top constraints to doing business in CEMAC Electricity Informal sector Corruption Tax administration Access to finance Tax rates Transport Political instability Crime Customs & trade reg.
  • 46.
    30 Figure 20: Costof bribes, security, crime, and power outages by country Electricity 1.50 The lack of reliable access to electricity is a major constraint for many of the CEMAC countries. Despite abundant natural resources, access to electricity remains a challenge for several of the CEMAC countries. Electrification rates vary from 9 percent of the population in Chad and 14 percent in CAR to 68 percent in Equatorial Guinea and 91 percent in Gabon.12 Access to electricity is similarly low in the WAEMU region with an average of 38 percent of the population compared to 43 percent for the SSA and 91 percent for middle income countries. 1.51 In addition, electricity and fuel prices are relatively high. The price for electricity in Sub- Saharan Africa is high in general with an average of 20.0 US cents per kWh compared to an average of 16.1 US cents per kWh in upper middle-income countries. The CEMAC average is only slightly lower (19.1 US cents per kWh) while the WAEMU average is even higher (22.6 US cents per kWh)13 . However, prices in the CEMAC region vary widely from 11.1 US cents per kWh in CAR and the Republic of Congo to 22.7 US cents per kWh in Equatorial Guinea. Due to low electrification rates, many companies rely on generators for electricity. Pump prices for diesel fuel of on average 1.1US$/liter are just below the African average of 1.2 US$/l despite substantial oil production and exports. Access to finance 2.5. Access to finance in the CEMAC region is hampered by weak credit infrastructure which, in turn, stifles private sector development. Access to finance is identified as a major constraint by firms operating in the region (Table 8). Domestic credit to the private sector is low at 15 percent of GDP in Central African Republic and Cameroon, 14 percent in Gabon, 11 percent in the Republic of Congo, and 6 percent in Chad. The value of collateral needed for a loan is very high. For example, collateral requirements are 260 percent of the loan amount in Cameroon and 233 percent in the Central African 12 Republic of Congo 57 percent, Cameroon 60 percent; World Development Indicators, data for 2016. 13 Data for electricity and fuel pump prices are from FERDI – Sustainable Competitiveness Observatory: https://competitivite.ferdi.fr/en/data. 2.91 4.00 7.31 5.58 19.21 11.54 15.71 21.89 9.64 5.425.15 5.75 2.57 3.93 4.58 8.47 3.56 11.87 25.22 13.11 0510152025 Costs(%ofsales) Cameroon Congo Gabon Chad CAR source: Author's calculations based on panel data from Enterprise Surveys Bribe Cost of security Cost of power outages Cost of crime
  • 47.
    31 Republic. Low financialintermediation results from multiple factors including asymmetric information, insufficient collateral and weak insolvency frameworks. According to Doing Business data, none of the countries in the region has an operating private credit bureau. The coverage of the regional public credit registry (PCR) also remains limited.14 Furthermore, collateral frameworks are underdeveloped and not a single CEMAC member country has a movable collateral registry. Insolvency frameworks are ineffective due to limited capacity of the judicial system. According to the Doing Business report, it takes on average 4 years for a firm to go through insolvency proceedings. Table 8. Selected Indicators on Access to Finance Cameroon (2016) Central African Republic (2011) Chad (2009) Congo, Rep. (2009) Gabon (2009) Percentage of firms with a checking or savings account 79 99 96 87 84 Percentage of firms with a bank loan/line of credit 14 26 21 13 9 Proportion of loans requiring collateral (%) 88 84 75 68 53 Value of collateral needed for a loan (% of the loan amount) 260 233 136 47 n.a. Percentage of firms not needing a loan 41 25 43 32 49 Percentage of firms whose recent loan application was rejected 36 24 n.a. n.a. n.a. Percentage of firms using banks to finance investments 16 25 4 8 6 Proportion of investments financed internally (%) 62 74 84 85 93 Proportion of investments financed by banks (%) 4 5 2 4 3 Percentage of firms using banks to finance working capital 20 25 16 10 9 Percentage of firms using supplier/customer credit to finance working capital 19 46 17 18 7 Proportion of working capital financed by banks (%) 7 6 5 3 3 Percentage of firms identifying access to finance as a major constraint 41 46 47 45 30 Source: Enterprise Surveys. 2.6. In the CEMAC countries, the banking system offers limited long-term financing (more than 7 years) and charges high interest rates. On average, over the period 2002-2010, long-term loans represented a stable share of 3 percent of all credits (Central Bank of Central Africa, BEAC). CEMAC's banking services are characterized by excessive costs (AfDB, 2012). The average cost of credit in 2010 was 11 percent, although costs decreased significantly during the previous five years. For large firms, the cost of credit was reduced from 12.5 percent in 2005 to 8.9 percent in 2010, and the decline was equally significant for SMEs (from 17.2 percent to 11.3 percent). However, Aterido et al. (2011) highlights that small firms have less access to formal finance. 2.7. Based on the available data, the comparison of financial markets in the CEMAC region shows that Cameroon is better positioned than the other four countries. Based on the ES results, 30 percent of firms have a line of credit or a loan in Cameroon, 25 percent in CAR, 19 percent in Chad, 12 percent in the Republic of Congo and 10 percent in Gabon. Generally, large and medium firms in the CEMAC region 14 Specifically, in Chad, where only 2.3 percent of the adult population is covered, in Central African Republic 3.1 percent, in Cameroon 8 percent, in Equatorial Guinea 9 percent, in the Republic of Congo 12.2 percent, and in Gabon 50.8 percent.
  • 48.
    32 rely more onbank financing relative to small firms. In Cameroon specifically, financial markets are well developed and 84 percent of large firms had a line of credit or a loan in 2009; with the crisis, this number has however declined to 61 percent in 2016. Cameroon further recorded the highest share of firms applying for a loan or line of credit (36 percent), followed by the CAR (32 percent), Chad (25 percent), the Republic of Congo (18 percent) and Gabon (14 percent). 2.8. Financial inclusion is low, but increasing. According to the Global Findex database, access to financial services is low, but has increased in recent years (see Table 9). In 2014, on average only 19 percent of the adult population in CEMAC had access to a bank account. Although this number increased to 31 percent by 2017, it is still lower than the WAEMU (37 percent) or SSA average (43 percent). Borrowing from family or friends remained the most common source of credit and levels are comparable to WAEMU and SSA. The use of credit cards is limited (less than 5 percent on average). Debit card ownership has not changed much between 2014 and 2017 in the CEMAC region, unlike the use of mobile accounts which region-wide increased significantly from 4 percent in 2014 to 20 percent in 2017; similar trends occurred WAEMU. Table 9. Selected Indicators on Financial Inclusion of Individuals (as percentage of population over 15 years), 2014 and 2017 Cameroon CAR Chad Congo, Rep. Gabon WAEMU SSA 2014 2017 2017 2014 2017 2014 2017 2014 2017 2014 2017 2014 2017 Account 12 35 14 12 22 17 26 33 59 18 37 34 43 Borrowed any money in the past year 57 53 37 41 38 42 40 40 56 48 46 55 46 from a financial institution 2 7 3 2 3 4 4 4 5 4 6 6 7 from a savings club - 13 11 - 6 - 5 - 9 - 8 - - from family or friends 42 33 19 25 28 24 20 28 39 34 28 42 31 Mobile account 2 15 - 6 15 2 6 7 44 7 25 - - Credit card 1 3 3 1 3 2 4 6 6 1 4 3 3 Debit card 6 11 4 3 3 10 12 18 16 4 9 18 18 Source: Global Findex database. Note: No data is available for Equatorial Guinea. The WAEMU average does not include data on Guinea-Bissau, which is not available. Taxation and tax administration 2.9. Despite low revenue collection, firms in the CEMAC region identify taxes as one of the main constraints to their business activities (Table 10). The percent of firms identifying tax rates as a major constraint is 41 percent. Chad has the highest share (59 percent), while Gabon has the lowest (31 percent) in the region. The high statutory tax rate reduces the attractiveness of doing business in a given country, and firms have to rely on various tax exemptions to achieve a reasonable effective tax rate. The extensive use of tax exemptions, often awarded in non-transparent processes and criteria, adds to the lack of visibility and predictability of tax requirements that firms may be facing. This may be one of the
  • 49.
    33 main reasons forthe results in the Enterprise Survey. The percentage of firms identifying tax rates as major constraint in the CEMAC region is slightly lower than those reported for the WAEMU region, but much higher than the SSA average. Table 10. Firms Identifying Tax Rates or Tax Administration as a Major Constraint (percent of all firms) Percent of firms identifying tax rates as a major constraint Percent of firms identifying tax administration as a major constraint All Countries 30.1 19.4 East Asia & Pacific 16.4 7.1 Latin America & Caribbean 32.9 21.0 Middle East & North Africa 29.2 20.8 South Asia 26.4 18.8 Sub-Saharan Africa 33.2 26.3 WAEMU 46.4 37.6 CEMAC 41.0 40.3 Cameroon (2016) 41.8 35.8 Central African Republic (2011) 31.9 28.2 Chad (2009) 59.7 52.9 Republic of Congo (2009) 40.9 47.3 Gabon (2009) 30.9 37.3 Source: Enterprise Surveys, World Bank. Bayraktar and Moreno-Dodson (2018b). 2.10. The quality and capacity of tax administration is also a major constraint to the business environment. 40 percent of firms in CEMAC identify the quality and capacity of tax administration as a major constraint. Chad has the highest rate at 53 percent and the Central African Republic the lowest (28 percent). A comparable share of firms in WAEMU (38 percent) identifies the efficiency of tax administration as a major constraint, but figures are lower for SSA (26 percent). 2.11. A similar result can be obtained from the taxation indicators of the Global Competitiveness Index Database (World Economic Forum). Firms in three of the CEMAC countries (Gabon, Chad and Cameroon) consider that taxation has a negative impact on incentives to invest. The average index value is around 2.75 in the region, much lower than 7, which corresponds to the best tax practices in the world. The average value was for the WAEMU countries is 3, so only slightly higher than the value observed for the CEMAC countries (Moreno-Dodson and Bayraktar, 2018). The role of the informal sector and its effect on firm competitiveness 2.12. One of the biggest problems of firms in the CEMAC countries, according to the Enterprise Survey, is competition from a large informal sector. 76.5 percent of formal firms in the region report that they face unfair competition from informal firms and 52.6 percent of firms regard unfair competition from informal firms as a major constraint (see Table 11). In terms of unfair competition from informal firms, Chad reports the highest percentage with 89.8 percent and Central African Republic has the lowest rate at 66.7 percent. For comparison, 56.2 percent of formal firms in WAEMU,38.4 percent in SSA and 27.4 percent globally identify practices of competitors in the informal sector as major constraint.
  • 50.
    34 Table 11. Percentof firms competing with informal firms and identifying this as a problem Percent of firms competing against unregistered or informal firms Percent of firms identifying practices of competitors in the informal sector as a major constraint All Countries 53.4 27.4 East Asia & Pacific 53.2 17.1 Latin America & Caribbean 62 30.6 Middle East & North Africa 42.6 31.4 South Asia 41.1 20.4 Sub-Saharan Africa 67.4 38.5 WAEMU 72.7 56.2 CEMAC 76.5 52.6 Cameroon (2016) 80.3 53.3 Central African Republic (2011) 66.7 45 Chad (2009) 89.8 72.4 Congo, Rep. (2009) 69.7 54.2 Gabon (2009) 76 38 Source: Enterprise Surveys, World Bank. Bayraktar and Moreno-Dodson (2018b). 2.13. The size of the informal sector in the CEMAC region is relatively large. According to Abid (2016), between 2009 and 2013 the informal sector accounted on average for between 34 percent of GDP in Equatorial Guinea to 53 percent of GDP in Gabon. This is comparable to the WAEMU region (between 44 percent of GDP, Burkina Faso and Mali, and 54 percent of GDP, Benin). This is roughly comparable with the results from Hassan and Schneider (2006), who, however, evaluate the time period between 1999 and 2013. 2.14. There are several reasons for the existence of a large informal sector, which would need to be addressed to integrate the informal activities into the formal economy. Reasons for informal activities include, among others, the size of the country, especially the urban population, which often has fewer formal employment opportunities reflected in high unemployment rates, the low quality of public services, including a lack of enforcement of laws and regulations, high levels of corruption, the number of regulations and the complexity of the tax system and the added costs of taxes and social contributions in addition to labor costs (see Abid 2016). Consequently, to address the large extent of informal activities a country-specific strategy should be developed which depends on the identified underlying factors. Possible policy actions include active labor market strategies to improve access to the formal sector; the creation of job opportunities in the formal sector; formal structures to encourage people to participate in the formal economy; simplified processes for business formalization; and stricter enforcement mechanisms.
  • 51.
    35 C. The performanceand productivity of firms in CEMAC 2.15. There is significant dispersion in labor costs and labor productivity in CEMAC. Labor costs are the highest in Gabon and Chad, but are substantially lower in CAR. Labor costs, evaluated in terms of labor costs per full-time equivalent workers, are the highest in Gabon, followed by Chad, the Republic of Congo, Cameroon and CAR (Figure 21). Labor productivity, calculated as total sales divided by the number of permanent employees, is the highest in Gabon, followed by Chad, the Republic of Congo, Cameroon and CAR. Value added by worker, which is used as a proxy for labor productivity shows a similar picture (Figure 22). Figure 21: Cost of labor per worker Figure 22: Productivity and Value Added per worker 2.16. Large and medium sized firms contribute the most value added. The contribution to value added varies by country, but for the majority of CEMAC countries large and medium-sized firms matter the most: large firms account for close to 90 percent of value added in Cameroon, 57 percent in the Republic of Congo and 47 percent in CAR. Medium-sized firms contribute the most to value added in Chad (58 percent) and small firms dominate in Gabon (42 percent) (see Figure 23).15 2.17. Regression analyses show that labor productivity in CEMAC is positively associated with FDI, relative market share and access to ICT, and negatively correlated with market distortions. Foreign direct investment (equal to or more than 10 percent of foreign share in the capital) increases productivity between 78 and 98 percent. Being an exporter also increases productivity between 54 and 84 percent; a finding that is also confirmed when comparing total factor productivity (TFP) for exporting and non- exporting firms. Market share also benefits firm productivity while the use of information technology increases productivity between 31 and 53 percent. Access to finance is also positively correlated with firm productivity, but the impact seems to be small, possibly due to the fact that even firms that have an overdraft facility or access to a credit line may experience insufficient credit quality. Distortions to the investment climate, such as costs associated with bribes, power outages, security and loss due to theft, robbery and vandalism, are negatively correlated with firm productivity: a 10 percent 15 Fiess and Kouevi (2018) also report sectoral estimates. In Gabon, CAR and the Republic of Congo, the services sector contributes the highest share to value added, with 84 percent, 65 percent and 61 percent, respectively while manufacturing appears to dominate in Cameroon (52 percent) and Chad (64 percent). The results are similar for the sectors’ contribution to labor productivity, except for Chad where the services sector is more important for labor productivity. 8.70 9.42 9.72 9.70 8.00 0246810 Costlaborperworker(Log) Cameroon Congo Gabon Chad CAR Source: Author's calculation based on data from Enterprise surveys 10.64 10.41 11.71 11.54 12.69 12.23 11.99 11.71 10.27 9.92 051015 Cameroon Congo Gabon Chad CAR Source: Author's calculation based on data from Enterprise surveys Productivity per worker (Log) Value Added per worker (Log)
  • 52.
    36 increase in marketdistortions reduces productivity by 12 to 15 percent; these results are similar to the findings of Herrera and Kouame (2017) for Nigeria. Figure 23: Contribution to value added by size 2%9% 89% 11% 32%57% 42% 33% 24% 5% 58% 37% 15% 39% 47% Cameroon Congo Gabon Chad CAR Small(0-19) Medium(20-99) Large(+100) Source: Author's calculation based on data from Enterprise surveys Contribution to value added by size
  • 53.
    37 Box 3. Determinantsof productivity – Regression Analysis Different measures for productivity can be used to analyze its performance and determinants. The choice of the productivity measure depends on the purpose of productivity measurement and, in many instances, on the availability of data. For this analysis, three different measures of productivity were used: (i) labor productivity per worker, (ii) value added per worker, and (iii) total factor productivity (TFP). Labor productivity is measured as real annual sales divided by the number of full-time equivalent workers. Value added is obtained by excluding the cost of raw materials and energy from annual sales. Value added per worker is then obtained by dividing the resulting difference by the number of full-time equivalent workers. Productivity at firm level is measured, following Herrera and Kouame 2017) by using TFP as it considers the production technology and the level of capital. The following assumptions and definitions have been used for the analysis: • The capital intensity is measured as the logarithm of the stock of capital. • Labor quality is proxied by (i) the share of temporary workers and (ii) the average educational attainment of the average worker. • Access to finance is measured by a dummy that takes the value 1 if the firm has a line of credit or an overdraft facility. • The quality of the investment climate is proxied by (i) the percentage of the top manager’s time spent in dealing with the government regulations and (ii) the combined cost of power outages, bribes, security and crime as a share of sales. • Exporter status is proxied by a 0-1 dummy which evaluates the share of exports in total firm sales. • Firm size is proxied by the market share of the firm, measured by the ratio of the total sales across sector, region and year. • Firm age is proxied by the following dummy variables: ‘young’ for firms aged between 0 and 5 years; ‘mature’ for firms between 6 and 15 years; and ‘old’ for firms older than 15 years. Data and Methodology Data is based on the World Bank’s Enterprise Surveys (ES), where available: Cameroon (2006, 2009 and 2016); Gabon (2009); the Republic of Congo (2009); Chad (2009) and CAR (2011). No data is available for Equatorial Guinea. ES collects data on a wide array of qualitative and quantitative information on firms in manufacturing, retail and other services (non-oil sector). For the years covered by the ES, these three sectors represented on average 70 percent of GDP in Cameroon, 45 percent in Gabon and 30 percent in the Republic of Congo. For Chad and CAR, ES data only covers manufacturing and services and those sectors represented 40 percent and 38 percent of GDP (WDI, 2017). Observations in the ES are selected using stratified random sampling in three dimensions: sectors, establishment size, and location. Firm size is defined based on reported or evaluated permanent full-time workers comprising three distinct categories: small (up to 19 employees), medium (20 to 99 employees), and large (more than 99 employees). The analysis focuses on the non-oil sector and therefore an attempt is made to exclude any firm with oil activities. As ES prior to 2011 do not distinguish between oil and non-oil activities of firms, this distinction can only be made for Cameroon and CAR. After data screening, 918 observations have been obtained for Cameroon, 179 for Gabon, 151 for the Republic of Congo, 150 for Chad and 150 for CAR.
  • 54.
    38 D. Conclusion andPolicy Recommendations 2.18. This chapter highlights the main obstacles to the business environment and investment climate. Improving the business environment is fundamental to facilitate the emergence of a strong private sector capable of absorbing the working-age population. Due to the scarcity of public resources, the private sector is a critical partner for governments to create employment and ensure that economic growth is inclusive. The analysis shows that key obstacles in the CEMAC region are energy or electricity, informal sector practices, political instability and access to finance. Working on the reforms to tackle these obstacles will contribute to economic growth centered on strong contributions from the private sector. Investing in the energy sector, the first most common obstacle, is vital for the competitiveness of a country and its productivity. The lack of access to electricity has an impact on key strategic sectors of the economy, such as the manufacturing sector which is a source of positive externalities for other sectors (Rodrik, 2008). 2.19. A dynamic and vibrant private sector is important for economic diversification and job creation, and can also be a driver of deepening regional integration. Those fundamentals are critical to enable an efficient business environment. An improved business environment is a starting point for CEMAC economies to move to more diversification and generate spillovers in terms of sustainable growth and employment that will contribute to the agenda of ending poverty and sharing prosperity by creating jobs for inclusive economic growth. A dynamic and vibrant private sector would also be able capitalize on existing opportunities in the trading system and actively promote regional integration (see UNCTAD 2015). 2.20. Investment and business climate reforms mainly fall under the realm of national governments, but there is also scope for interventions at the CEMAC level. As part of the CEMAC- PREF, individual CEMAC countries are implementing economic diversification strategies to enhance the local business environment and competitiveness. At the regional level, CEMAC institutions can target reforms that support intra-regional trade and the development of regional value chains. CEMAC-level business climate reforms should target the simplification of border procedures, including for visa-free travel within CEMAC, eliminating roaming cost for intra-CEMAC mobile telephony, and harmonizing axel load controls to facilitate transit trade. The operationalization of the Business Climate Observatory, which is still at the conceptual stage, could also help in this process. Mutually recognizing education qualifications, such as diplomas, would enhance intra-regional labor mobility, while establishing a CEMAC power pool could support access to reliable electricity, which is one of the main constraint to private sector development in many CEMAC countries. 2.21. Promoting regional financial stability and inclusion, as well as the harmonization of tax, investment and trade policies can further support private sector development. CEMAC level institution can further contribute to an improved regional business environment by promoting regional financial stability (see Chapter 3) and financial integration, leveling the playing field for investment and taxation across CEMAC (see Chapter 4), promoting the free circulation of goods, services and people (see Chapters 5 and 6).
  • 55.
    39 CHAPTER 3: TheFinancial Sector in CEMAC A. Introduction 3.1. The financial sector in CEMAC is small, but provides essential services and will be vital for the success of CEMAC’s medium-term growth and diversification agenda. International experiences show that financial deepening and broadening are key enablers of an acceleration of economic growth, while banking crises have large and long-lasting costs. Financial deepening, especially since access to finance is one of the main obstacles for the private sector (see Chapter 2), and financial sector stability are therefore an important corner stone for sustainable growth in the sub-region. 3.2. This chapter explores CEMAC’s financial sector from the perspectives of regional financial integration, and identifies risks to financial sector stability from regional macro-financial linkages. Regional financial integration can play an important role in financial development and growth and also has an important function in fostering economic resilience by increasing market liquidity and offering opportunities for risk-sharing. Regional financial integration in CEMAC remains underdeveloped. Important progress has been made regulating the financial sector at the regional level, but little has been achieved in facilitating integration of banking markets, as regional infrastructure and markets are not sufficiently developed. This chapter takes stock of the current state of financial sector integration in CEMAC and assesses options to deepen financial integration and intermediation, via progress on the single banking license (agrément unique) and the parallel legal framework for creditor rights at domestic and regional (OHADA) level, as well as merging CEMAC’s two parallel stock exchanges. B. Overview of the financial sector 3.3. According to the 2016 CEMAC Financial Sector Assessment (FSA), the financial sector remains shallow and mostly bank based. The depth of the banking sector is limited and accounts for only 26.3 percent of CEMAC's GDP. Domestic credit to the private sector in the region is low and represents only 10 percent of the GDP. On average, close to 50 percent of banking sector assets are controlled by three banks per country and close to 50 percent of banking sector assets are controlled by foreign banks (mostly European banks).16 3.4. At end-January 2018, the banking system in the CEMAC region consisted of 52 banks: Cameroon (14), Central African Republic (4), the Republic of Congo (11), Gabon (10), Equatorial Guinea (5), and Chad (8). Moreover, 11 non-deposit taking institutions are active in Cameroon (8) and in Gabon (3). Cameroon, Gabon, and the Republic of Congo represent 78 percent of the total assets in the system. 3.5. Banking assets in the region are increasing. Aggregate banking assets in the CEMAC have reached XAF 12,592 billion (US$20.9 billion) at the end January 2018. Credits in arrears have dramatically increased over past four years to 17.8 percent in January 2018, up from 14.6 percent in the previous year. Credit arrears are mainly concentrated in the Republic of Congo, Chad, Equatorial Guinea and Gabon and mostly in the construction sector. Only 25 banks out of 54 are complying with all prudential regulations. 16 Ghura et al. (2010) find that the gap in financial development in the CEMAC relative to SSA is partly explained by differences in institutional quality (e.g. the availability of credit information, and strength and enforcement of property rights.
  • 56.
    40 Figure 24. CEMAC- Total Assets by Country at end-January 2018 Source: COBAC. 3.6. The microfinance sector plays an important role in the region. The sector is composed of 825 registered microfinance institutions (MFI), which are distributed in the six CEMAC countries as given in Table 12. Data are available only from about 60 percent of the MFIs, namely those that have provided their financial statements to the COBAC as of end-June 2016. These statements cover about 90 percent of the total volume of the sector’s activities. Below are some figures about the MFI sector as of end- September 2017, with reference to June 201617 : • A total volume of assets of XAF 894 billion (about US$1.5 billion in June 2016); • A gross loan portfolio of XAF 451 billion (approximately US$764 million) and XAF 514 billion in June 2016 (about US$878 million), which comprises mainly short-term loans; • A total volume of deposits from members/customers in an amount of XAF 676 billion (US$1.15 billion), constituted mainly of sight deposits; • A poorly performing loan portfolio that is characterized by a total volume of XAF 64 billion of loans in default (US$108 million), which amounts to 14 percent of the gross loan portfolio; • A liquidity surplus of XAF 317 billion (US$537 million). Table 12. CEMAC - Number of Registered MFIs by Category and Country as of September 30, 2017 Categories Countries Total CEMACCameroon Central African Republic Congo, Rep. Gabon Equatorial Guinea Chad 1st category 492 21 55 5 1 193 767 - Independent 199 5 21 5 1 13 244 - Networks 293 16 34 — — 180 523 2nd category 51 3 11 10 3 5 83 3rd category 4 — 2 1 — — 7 Total 547 24 68 16 4 198 857 Source: COBAC. 17 Source: MFIs’ status in the CEMAC region as of September 30, 2017. Equatorial Guinea 14% Gabon 20% Congo 14% CAR 2% Cameroon 44% Chad 7%
  • 57.
    41 3.7. MFIs havea large client base. MFIs that operating in the COBAC region reportedly serve almost 2.4 million members/clients (equivalent to about 7 percent of the adult population), most of members/ clients are in Cameroon and the Republic of Congo (see Table 13). Table 13. CEMAC - Evolution of the Number of Members and Clients of MFIs Country December 31, 2016 September 30, 2017 Variation (%) Cameroon 1,914,070 1,367,084 -28.6 Central African Republic 40,078 47,135 17.6 Congo, Rep. 400,497 420,007 4.9 Gabon 148,228 160,110 8.0 Equatorial Guinea n/a 547 n/a Chad 177,271 151,820 -14.4 Total CEMAC 2,680,144 2,146,703 -19.9 Source: COBAC. 3.8. According to the information provided by the COBAC, the volume of the MFIs’ assets in the six countries is distributed as shown in Figure 25. Figure 25. Distribution of Total Assets by Country as of September 30, 2017 Source: COBAC. 3.9. The MFIs and the members of their governing bodies are registered by the local authorities, which exercise an administrative oversight. Prudential oversight is carried out the by the COBAC’s Department of Microfinance (Departement de la Microfinance, DM). To oversee the MFI sector with its 825 registered entities, the DM has 10 staff who are stationed at the COBAC’s headquarters in Libreville. The DM staff is mainly dedicated to carry out the off-site supervisions and coordinate with the Banking Supervision Department to carry out on-site supervision visits of a few MFIs. Off-site supervision is carried out using the ‘SESAME’ software, which has limited analytical capabilities. 3.10. Capital markets are almost nonexistent due to the coexistence of two competing markets (one domestic in Douala and a regional one in Libreville). The regional authorities decided in November 2017 to merge the two exchanges. The regional regulator, the COSUMAF, will remain in Libreville (Gabon) and the regional stock exchange will be located in Douala (Cameroon). Insurance and pension sectors remain underdeveloped. Cameroon 58% CAR 3% Congo, Rep 32%. Gabon 5% Equatorial Guinee Chad 1%
  • 58.
    42 3.11. Financial sectorintegration in the region remains limited. An assessment of financial sector integration in CEMAC shows little progress. Price-based indicators, such as interest margins, indicate that banking systems in the region are poorly integrated and quantity-based indicators, especially the level of cross-border flows, show only marginal flows (see African Development Bank 2010). Most banks operate to a large extent nationally and focus on customers with limited cross-border economic activities. C. Challenges of the financial sector Payment systems 3.12. Payment systems in the CEMAC region are underdeveloped. The payment systems infrastructure18 is aging and needs to be upgraded. Furthermore, the legal and regulatory framework is not in line with international good practices. A regional payment system approach has not been developed by the COBAC and BEAC. The existing structure remains complex due to the cohabitation of multiple regional regulatory frameworks (BEAC, COBAC, and country-specific regulations). This has resulted in increased uncertainty about applicability of regional and domestic laws particularly in the area of e-money. The oversight framework of payment systems of the BEAC has not yet been developed. The assessment of systemically important payment systems is still performed based on the 10 core principles of Systemically Important Payment Systems (SIPS) and not under the Principles of Financial Market Infrastructure.19 BEAC has started to develop a centralized security depository to manage CEMAC countries government debt. However, without a government debt management strategy, the primary and secondary markets structures will not develop effectively. MFIs 3.13. The microfinance sector is also under pressure. The MFIs’ financial situation remains a concern. A significant part of the sector does not comply with prudential norms and is currently facing liquidity constraints. As of March 2017, 14 MFIs with a combined balance sheet of XAF 32 billion (equivalent to about 3 percent of the total) are being liquidated while four others with a total balance sheet of XAF 9 billion (less than 1 percent of the total) have been intervened by the authorities and operate under provisional administration. According to the COBAC report, at the end-June 2016, “the prudential situation of the microfinance entities is fragile (…) their situation is characterized by the lack of compliance to several norms (…) several MFIs show a net negative or insufficient equity position, and they do not comply with applicable capital adequacy standards. In addition, several MFIs have a situation of lack of liquidity that is worrying.” Regulatory framework 3.14. The COBAC has reviewed its banking resolution framework (CEMAC Regulation 02/14) but this framework has not been tested yet. The legal framework for the treatment of banks in distress should be complemented by mechanisms for consultation and coordination among all the authorities 18 Payment infrastructure includes: Real-time gross settlement systems, central securities depositories, securities settlement systems, central counterparties and trade repositories 19 The SIPS were the first set of principles regulating payment systems infrastructures issued by BASEL Committee in 2001. These principles were later replaced by the Principles of Financial Market Infrastructure which were issued jointly by BASEL and International Organization of Securities Commissions.
  • 59.
    43 potentially concerned bythe failure of complex financial groups with cross-border activities. The 2015 Financial Sector Assessment (FSA) recommends that COBAC ensures (a) a speedy decision-making process and (b) consistency of the options implemented by the relevant monetary authorities in the case of failure of a group operating in several CEMAC countries. Improvement of the existing laws and regulations should be accompanied by the formulation of clear procedures assigned to each pertinent authority, including the Deposit Guarantee Fund (Fonds de Garantie des dépôts en Afrique Centrale, FOGADAC). Each authority should have a clear role in the design and selection of available options, in the decision-making process, and in the implementation of actions towards bank resolution. 3.15. The CEMAC authorities are in the process of updating the regulatory framework for the operation of the MFI sector. They have drafted a new microfinance framework—the ‘Reglement CEMAC/Central Africa Monetary Union (Union Monétaire de l’Afrique Centrale, UMAC)/COBAC relatif aux conditions d’exercice et de contrôle de l’activite de microfinance dans la CEMAC’—which has been approved by the COBAC and by the BEAC board. In addition, the COBAC has drafted the secondary regulations (the ‘COBAC reglements’) that will be issued once the Reglement CEMAC/UMAC is passed by the Council of Ministers. This new framework is, among other things, expected to strengthen the (internal and external) control functions of MFIs, while it will contribute to better consolidate and integrate the sector by (a) mandating all category 1 MFIs to affiliate to a network and (b) substantially increasing the minimum capital requirements for category 2 MFIs. In addition, the DM is planning to transition its current software to the ‘SPECTRA’ software that is already being used in the supervision of banks and that will allow for the implementation of an early warning system for the MFIs. D. Vulnerabilities and risks 3.16. The banking sector remains vulnerable and has been hit hard by the fall in oil prices. The level of nonperforming loans (NPLs) increased from around 10 percent in 2014 to 17 percent at end August 2017. However, the increase is uneven, with, for example, a smaller increase in Cameroon, which has a more diversified economy, than in oil-dependent economies such as Chad, the Republic of Congo, and Equatorial Guinea. This increase is mainly due to the preponderant role of states in financing the economy in the region. As a result, governments’ arrears to the banking system and to the private sector have increased dramatically. The banks’ liquidity has declined since the end of 2014, which resulted in slower growth of credit to the economy. The banks’ liquidity levels20 at the end of December 2016 averaged 110 percent compared to 138 percent in 2014. Deposits fell by 8 percent over the last two years, with an acceleration of this decline since mid-2016. Lower liquidity, coupled with credit growth and the absence of an interbank market, forced some banks to have increased recourse to the refinancing facility of the BEAC. In December 2016, BEAC refinancing accounted for about 6 percent of the balance sheet of the CEMAC banks, whereas it was only 0.07 percent two years earlier. According to COBAC’s bank ratings only 1 bank out of 52 was in a solid financial situation as of August 31, 2017. Between December 31, 2016, and August 31, 2017, the number of banks in fragile financial situation increased from 11 to 16. 20 Liquidity is a measure of the ability and ease with which assets can be converted to cash. Liquid assets are those that can be converted to cash quickly if needed to meet financial obligations; examples of liquid assets generally include cash, central bank reserves, and government debt. To remain viable, a financial institution must have enough liquid assets to meet its near-term obligations, such as withdrawals by depositors.
  • 60.
    44 3.17. The financialsector is also exposed to security risks including money laundering and terrorism financing. According to the 2016 CEMAC FSA, important financial flows are generated from corruption; embezzlement of public funds; trafficking of arms and natural resources (diamonds, oil, other mining, fishing, and wildlife); illegal logging; and piracy in the Gulf of Guinea. The security conditions are also deteriorating rapidly in the region. As a result of the Government of Nigeria’s efforts to combat Boko Haram in its territory, the terrorist organization spread into the north of Cameroon and the Lake Chad region. The financial sector (banks, money transfer providers, exchange bureaus, and MFIs) is particularly exposed to money laundering and financing of terrorism risks due to lack of capacity and inadequate supervision by the relevant regional institutions (BEAC, COBAC, and domestic authorities). According to the joint report in October 2016 by the Financial Action Task Force (FATF),21 West Africa Inter-Governmental Action Group Against Money Laundering (GIABA), and GABAC, Boko Haram uses cash, money or value transfer services, mobile money, and bank transfers to transfer funds. 3.18. The oil price shock compounded by the security crisis exposed systemic deficiencies in the financial system and institutional inadequacies of the CEMAC regional bodies. These gaps must be addressed at the level of the CEMAC regional institutions to prevent the repetition of the current precarious situation in the future. However, the regional institutions lack the capacity to respond effectively to the ongoing crisis and to promote effective and sustainable growth. BEAC lacks timely and accurate statistics that comply with internationally agreed standards to be able to conduct effective monetary policy. Macroprudential oversight is hindered by a lack of systems and methodologies to conduct stress tests. Foreign reserves management remains problematic and is hampered by the lack of tools to track and monitor foreign transactions movement by the different countries. COBAC is severely understaffed. The report on the assessment of compliance with the Basel Core Principles (BCP) on effective banking supervision in the CEMAC region revealed a poor level of compliance with respect to the powers and responsibilities of the COBAC and the existing prudential framework. The GABAC has made important efforts to comply with international standards. As a result, it became a full-time member of the FATF. However, that membership is at risk due to limited financial resources to conduct mutual evaluations and national risk assessments. E. Conclusions and recommendations 3.19. The current economic environment requires effective policy actions by the CEMAC regional institutions, particularly BEAC, COBAC, and GABAC, to mitigate the impact of the crisis and develop a more resilient and inclusive financial sector. The recently appointed BEAC Governor prepared, and the BEAC Board adopted in December 2017, a new Strategic Plan for 2017–2020 (Box 4). BEAC also implemented governance reforms in the context of the IMF’s safeguards missions (Box 5). Furthermore, COBAC is actively working on multiple fronts to address key banking sector shortcomings, including related lending, risk concentration, increasing credit in arrears, corporate governance, and AML/CFT. COBAC is also working to strengthen its prudential supervision framework for banks and the MFIs. A risk-based supervision approach and consolidated supervision regulations are in the process of being implemented under the COBAC Action Plan 2016-2019. GABAC has also developed a Strategic Action Plan, in 2016, to support member states with the implementation of sound and efficient AML/CFT regimes. 21 The AML/CFT global standard setter.
  • 61.
    45 3.20. Monitoring macro-financialrisks should be part of regional macro-surveillance. Sub-regional monetary arrangements, the implementation of a common monetary policy as well as bank regulatory and supervisory arrangements and the presence of banking groups across the region could be significant sources of contagion across the sub-region. A regional credit bureau could play an important role in monitoring interconnected risks. Although none of the banks within CEMAC are currently considered systemic, even if banking stress does not lead to a banking crisis, rising NPLs and weakening capital adequacy will likely restrict financial deepening and prevent the banking sector from becoming an engine for medium-term growth and economic diversification. 3.21. Regional financial integration in CEMAC remains underdeveloped. Important progress has been made regulating the financial sector at the regional level, but little has been achieved in facilitating integration of banking markets, as regional infrastructure and markets are not sufficiently developed. Progress on the single banking license (agrément unique), harmonizing parallel legal framework for creditor rights at domestic and regional (OHADA) level, as well as completion of unification of CEMAC’s two parallel stock exchanges seem important interventions at the regional level. Box 4. BEAC’s Strategic Plan 2017-2020 The preparation of BEAC’s Strategic Plan (aka. PSB), adopted by the BEAC’s Board of Directors on December 21, 2017, was based on the 2009-2016 operational audit of the institution. This audit identified a large number of shortcomings that tainted the effectiveness of the Institution. The main identified shortcomings are as follows: 1- Inadequate monetary policy, in particular because of the lack of a monitoring mechanism with adequate indicators and methodologies. 2- Ineffective research function that lacks structured and reliable statistics. 3- Inadequate foreign exchange regulation that is not in line with global good practices and with the current practices of the CEMAC member states. 4- Challenging foreign reserves management due to the decline in net foreign currency inflows. 5- Weak financial stability monitoring framework due to lack of reliable indicators and tools to assess the impact of macroeconomic shocks on the financial system. 6- Inadequate payment systems infrastructure. 7- Ineffective human resources management processes. 8- Inadequate accounting and auditing systems and standards. 9- Dilapidated IT and telecom infrastructures. In response to these shortcomings the BEAC adopted in December 2017 a strategic plan identifying key reforms to improve the effectiveness of the BEAC. Key reforms include: 1- Pursuing the implementation of the monetary policy operational framework adopted in 2015 by the Monetary Policy Committee. 2- Strengthening of the research function by supporting the acquisition of information systems and developing reliable and timely statistics. 3- Strengthening of payment systems legal and oversight frameworks and infrastructures with special emphasis on electronic payments and e-money. 4- Strengthening of the capacity of the financial stability analysis function. 5- Stabilizing and increasing foreign reserve levels through rigorous control of outgoing transfers and the launch of a gold monetization program. 6- Updating the foreign exchange regulations and implementation of IT systems to better track foreign exchange transactions. 7- In the other areas, it is planned to: (i) complete the reform of human resources management, (ii) set up a
  • 62.
    46 new accounting frameworkbased on IFRS and optimize the accounting information system, (iii) strengthen the internal control and audit functions by deploying risk-based management approaches; (iv) optimize the management of real estate assets, (v) modernize the IT and telecom infrastructure, and (vi) complete the budget reform. Source: Plan Strategique BEAC 2017-2020 Box 5. BEAC’s Governance Reform The BEAC has recently completed a comprehensive governance reform with the support of the IMF. As many regional central banks, the BEAC is subject to a safeguards assessment by the IMF every four years. The 2013 assessment spanned a period of change at the BEAC and occurred against the backdrop of reforms initiated to address governance shortcomings and control failures that emerged in 2009. The governance of the BEAC was undermined by a legal framework that did not adequately protect institutional autonomy, and problematic partial adherence of several member states to the reserves pooling obligation that is fundamental for the effectiveness of the monetary union. Consequently, annual IMF staff visits since 2013 monitored the implementation of priority recommendations and progress on the BEAC’s reform plan as part of the safeguards “rolling measures” approach. IMF Staff report (2017) welcomed significant progress achieved in BEAC safeguards reform and in the implementation of two safeguards priority recommendations. - BEAC’s Charter reform was completed in 2017. This reform will strengthen decision making, enhance checks and balances structures, and enhance internal controls. Progress include enhancing the role of the Board of Directors particularly in the areas of financial stability (i.e. articulation of the duties of the Board and of the Financial Stability Committee), and internal decision making (i.e. review of the collegiality principle). - Migration to internationally recognized accounting standards (IFRS). The BEAC has decided to migrate to IFRS as recommended by the safeguards mission. The BEAC agreed to publish its financial statements under IFRS methodology by 2019. The World Bank will support the BEAC with the migration process to IFRS. The IMF considers that further significant technical assistance is required to support the implementation of additional governance reforms including: improve the capacity of the BEAC's board and internal control functions (audit, risk and compliance). Source: IMF staff report 2017
  • 63.
    47 CHAPTER 4: Taxationand Regional Integration A. Introduction 4.1. Taxation is considered one of the essential determinants of firms’ production and investment decisions. In many economies, firms are the main engine of job creation and can contribute to higher welfare and better distribution of prosperity. Tax structures are expected to support this important role of firms in contributing to higher economic growth (efficiency dimension) and shared prosperity (equity dimension). At the same time, tax systems should ensure that firms comply with their tax commitments to provide sufficient revenues to governments (buoyancy dimension). 4.2. This chapter evaluates tax features that are expected to affect firms in CEMAC countries. These include the tax rate structure and tax exemptions, including incentives, in the tax base of corporate income taxation. Furthermore, the possible impact of taxation on investment, growth, and the competitiveness of the member states is analyzed. The tax structure of the region is also compared to other parts of the world to the extent possible, especially the WAEMU region and Sub-Saharan Africa (SSA). The scope of the analysis is not limited to corporate income taxes, but also includes consumption taxes, labor taxes, and international taxes, all of which are expected to have important effects on firm- level activities. The analysis behind this chapter is largely descriptive and based on secondary data. B. The fiscal regime and tax structure in CEMAC22 4.3. The CEMAC countries share a common currency, but common markets can only truly function as common markets when tax distortions are eliminated. Tax reforms in the member countries and tax harmonization among the members needs to be handled together. Tax harmonization involves the following two essential actions: establishment of transparent tax bases and convergence in the tax rates (Petersen, 2009). Both steps are helpful for the simplification of administration and regional trade as they are expected to remove border controls and reduce waiting times for trade. Tax coordination contributes to uniformity of the region and minimizes practices involving tax competition which can be caused by diverging tax structures. 4.4. The CEMAC countries have plans for custom unions and coordinate domestic taxes as part of the economic union, but they have not fully accomplished these goals yet. In 1999, CEMAC decided to strengthen its common external tariff by harmonizing its domestic consumption taxes, except for the oil excises (Doe, 2006). While harmonizing the consumption taxes, the aim was to prevent countries from using taxes for protection purposes and to improve government tax revenue. In addition to the common VAT rates, the CEMAC region has also applied common international tax rates like other regional unions in SSA (see Table 14; and see Keen and Mansour (2009) for details). Related to corporate income taxes, the CEMAC countries have signed a tax treaty to improve tax coordination among the members and to limit double taxation. 4.5. Despite all these attempts, custom tariffs policy and domestic tax policies are, in practice, diverse in the member countries. The exemptions in the tax base and/or preferential tax rates may undermine the harmonization efforts as being achieved using the statutory rates. For example, the CEMAC directive on consumer taxes fixed the VAT rate between 15 and 19 percent; but the effective 22 This section draws on the conceptual framework of Moreno-Dodson and Bayraktar (2018) who provide complementary analysis for WAEMU.
  • 64.
    48 rate of VAT(VAT including surcharges) in Cameroon was 19.25 percent in 2015 and 18.9 percent in the Republic of Congo (CEMAC 2017). Similar to WAEMU, CEMAC members need to coordinate tax rates, tax bases, and the tax revenue structure to the extent that it is necessary for the functioning of the common market. The CEMAC countries now heavily depend on taxes from corporations; to accomplish the economic union they will need to shift their tax revenue sources towards consumption taxes. Table 14: Tariff Structure of Existing and Prospective Custom Unions in SSA Raw Materials Capital Goods Intermediate goods Final Consumption Social goods CEMAC 10 10 20 30 5 WAEMU 5 10 10 20 0 COMESA 0 0 10 25 n.a. EAC 0 0 10 25 n.a. Source: Keen and Mansour (2009) Table 4. 4.6. Corporate income tax (CIT) rates are considered an important parameter on determining investment and production decisions of firms. The CEMAC countries have diverse corporate income tax rates. There is no specific agreement on the CIT rates among member countries. The definition of the tax base is very different in each member country as well. Deductibles and exemptions differ across countries and sectors. The statutory CIT rates are between 30 percent and 35 percent (Table 15). These rates are much higher than the rates paid in the WAEMU region.23 High CIT rates are expected to negatively affect the efficiency of producers in the CEMAC region. 4.7. The CEMAC countries use investment codes to provide some firms with tax exemptions on investment. Special tax regimes are generally introduced through sectoral tax codes and laws, such as mining and oil. Tax incentives and codes can be highly discretionary because they are mostly established by the executive branch of the government without permission of the legislative branch. Most tax incentives and codes are provided through contractual agreements that involve modified tax laws. Some countries in the CEMAC region have general investment incentives, while the remaining ones have more sector-targeted rules. The harmonization of investment codes can be seen as essential for attracting FDI into regional supply chains. However, investment incentives and codes vary widely in CEMAC (see Box 6). 4.8. Common standards on value added tax (VAT) rates were introduced in 1999, but differences between member countries remain (Doe, 2006). The aim of the common rules was the sharing of the tax burden between producers and consumers. The CEMAC countries initially tried to lower possible market distortions due to value-added taxes. But, in practice, it did not work as expected. Changing tax rates, tax bases, thresholds, items facing exemptions and tax refunds from time to time at the national level reduced the effectiveness of VAT significantly. Unfortunately, the member countries could not replace the declining trade taxes with domestic sales and value added taxes. As presented in the data analysis section, the share of domestic indirect taxes in the CEMAC region is higher than direct taxes but still they are very low when compared to the level in other countries. 23 The statutory CIT rates in that region are: Benin (30 percent), Burkina Faso (27.5 percent), Côte d'Ivoire (25 percent), Guinea-Bissau (25 percent), Mali (30 percent), Niger (30 percent), Senegal (30 percent), and Togo (30 percent) as reported in Table 1 of Moreno-Dodson and Bayraktar (2018).
  • 65.
    49 Table 15: StatutoryCorporate Income Tax Rates in CEMAC in 2016 (% of profits) Cameroon 33% * Central African Republic 30% Chad 35% Republic of Congo 30% Agricultural, agro-pastoral, and poultry or fishing sectors 0% Microfinance companies and private schools organized as a company 25% Equatorial Guinea 35% Gabon 30% Oil and mining companies 35% Corporations owning intellectual property shares, the Gabonese Development Bank, public companies, authorized tourism companies, non-profit organizations, and authorized firms of property promotions 25% * +10% of 30% = 3% is local council surcharge on the income tax Source: Crowe Horwath (2016) Africa Tax Facts Guide 2016 and PricewaterhouseCoopers (2017) Worldwide Tax Summaries – Corporate Taxes 2016/17 Box 6. Investment incentives and codes in the CEMAC region Investment incentives and codes vary widely in the CEMAC region. Below are examples of the different codes and incentives in the CEMAC region. • Cameroon is one of the countries with specific rules on investment incentives and codes. Tax incentives consist of exemptions from or reductions of tax payments. The main tax advantages related to the private investment regime are for a maximum period of five years during the installation phase; for a maximum period of ten years during the exploitation phase; for a maximum of five years for the development of existing companies; and possible specific advantages for targeted sectors. • Firms with shares listed on the Stock Exchange in Cameroon can pay reduced CIT rates. • Corporations engaging in the specific activities, such as activities increasing youth employment or education, training, and health organizations can benefit from specific tax incentives. • Chad does not offer any tax incentives or codes. • The Republic of Congo provides corporations with complex tax incentives and codes. Firms engaging in e.g. domestic business activities, except for activities such as international trade, import, and processing of toxic waste can benefit from investment incentives. To be eligible for tax incentives, firms must create permanent jobs, increase their capital by at least 20 percent, and use local services, employees and materials. • Firms undertaking at least XAF 100 million investment will be in the general regime, and during the investment period and following three years, they will benefit from lower customs tariffs, some fees, lower CIT and personal income taxes, accelerated depreciation, and lower VAT on exported products. If firms undertake investment between XAF 30 million and 100 million, they will be in the special regime. Their benefits will be similar to the ones in the general regime, but they can deviate based on the decision of the Economy Minister. • All exporting firms in the investment charter will be eligible to be a part of preferred development zone regime. Manufacturing firms exporting at least 20 percent of their production can benefit from the CEMAC customs code and will pay no VAT for exported manufactured products. • In Equatorial Guinea, some tax exemptions are given by the government for some specific sectors, such as oil and natural gas and public production. The exemptions are negotiated between the firm and the government. • Gabon provides firms with different types of incentives for job creation; domestic and capital investment; tourism; and social housing. Firms receive tax credits if they employ Gabonese citizens.
  • 66.
    50 • Private domesticinvestment exceeding XAF 100 million can benefit from tax breaks and custom tariff privileges. New firms do not have to pay minimum CIT during the first two years of their activities. Sources: PricewaterhouseCoopers (2017). Worldwide Tax Summaries - Corporate Taxes. http://www.pwc.com/gx/en/services/tax/worldwide-tax-summaries/downloads.html Crowe Horwath (2016) Africa Tax Facts Guide. https://www.crowehorwath.net/uploadedFiles/MU/additional- content/home/Africa%20Tax%20Facts%20Guide%202016.pdf Note: This is not a complete list of all tax incentives and codes in the listed countries. 4.9. Similar to value-added taxation, the excise tax rates, in practice, differ between member countries. Excise taxes are used primarily to increase public revenues and are imposed on luxury goods or products that can be dangerous for the health and environment. The CEMAC members can choose applicable rates within prescribed bands to achieve their public revenue targets and have a single list of products to determine the tax base (Doe, 2006). The CEMAC countries can freely choose excise tax rates within the bracket of 0–25 percent. 4.10. The harmonization and reduction of international taxes is expected to benefit production and the competitiveness of the region. As presented above, the CEMAC region started to apply common external tariff rates in 1994 (Keen and Mansour, 2009). But, at the national level, some differences are observed. With the agreement on common tariff rates, the share of international taxes has started to decline. Currently, the contribution of custom tariffs to tax revenues is low at around 20 percent. However, still the share of international taxes in the region can get even lower given the low share of international taxes in total tax revenues in other regions in SSA. 4.11. Taxes on financial returns are also important determinants of firm-level financing and investment decisions. The CEMAC members have a tax treaty for investment return. Capital gains (from the transfer of assets), dividend income, and interest income are all subject to the 15 percent tax rate, but the rates may differ slightly from one country to another. C. The tax revenue performance in CEMAC 4.12. Low tax revenues are one of the factors hampering economic growth. The tax revenue share as percent of GDP is relatively low in Sub-Saharan Africa compared to the other regions of the world (Bayraktar, Le, Moreno-Dodson, 2016). This restricts the available funds to finance much-needed public spending to promote growth.24 Since the CEMAC countries have a series of restrictions regarding borrowing funds and do not have independent monetary policies to support their stimulus fiscal policies (because they are part of a monetary union), low tax revenues imply low public spending. The member states do not have a strictly binding fiscal rule, but taxes sometimes decline so sharply, especially due to low prices of natural resource, that they are not able to close the revenue gap and need to cut public spending, especially investment spending to balance their budget. Overall tax developments 4.13. Tax revenues remain low in CEMAC. Figure 32 presents total taxes in percent of GDP. Despite the fact that CEMAC member countries aim to reach the objective of government tax revenue of 17 24 In a related study, Moreno-Dodson and Bayraktar (2018) present that the capital component of public expenses is especially essential for economic growth in the WAEMU region. It is expected to be similar for the CEMAC region.
  • 67.
    51 percent of GDP,the average ratio was only 11.5 percent in 2016, which, however, represented an increase from 7.5 percent in 1997.25 As a comparison, the share of taxes in GDP was 16 percent in WAEMU in 2015 (Moreno-Dodson and Bayraktar, 2018). 4.14. While indirect domestic taxation represents the highest tax revenue component in the CEMAC region, the share of taxes on international trade has been declining but still higher than the rate observed in the WAEMU (Figure 26).26 International taxes declined from 10 percent of GDP at the beginning of the 1980s to 6 percent in 2016 throughout the trade liberalization process. The lowest point was 5 percent in 2004. As a comparison, the share of international taxes in percent of GDP has been lower than 5 percent in recent years in the WAEMU (Bayraktar and Moreno-Dodson, 2018). Figure 26. Composition of Government Tax Revenues as a Percent of GDP, CEMAC, 1980–2016 Sources: Keen and Mansour 2010a, 2010b; Mansour 2014; WEO, and ICTD. Development of selected tax sources 4.15. Taxes on income, profits and capital gains represent the highest proportion of tax revenues in the region. Figure 27 presents the share of (i) taxes on income, profits and capital gains by corporations, (ii) taxes on trade in total tax revenue, and (iii) taxes on goods and services for the average of the CEMAC. Even though taxes on income, profit and capital gains declined since 2006, the tax share was still close to 37 percent in 2016. As a comparison, this type of tax has the lowest share in the WAEMU region with only 10 percent of total tax revenues on average in 2015 (Bayraktar and Moreno-Dodson, 2018). The share of taxes on goods and services (VATs and excise taxes) has declined slightly, but its value is almost flat around 30 percent of total taxes. In contrast, this type of taxes has been declining in the WAEMU region and its value was close to 40 percent on average in 2015, almost 10 percentage point higher than in CEMAC (Moreno-Dodson and Bayraktar, 2018). The share of international taxes is low at 20 percent of total taxes. Given its slightly declining trend, it may drop further in the future. In the 25 It should be noted that corruption in tax and customs administrations also contributes to relatively low tax collection in the CEMAC region. 26 Direct and indirect taxes are taken from the database of the ICTD. They are constructed based on the IMF’s GFS and country reports. Some data points have also been collected from Keen and Mansour (2010a and 2010b) and Mansour (2014). Indirect taxes include all domestic consumption taxes, such as sales taxes of various sorts, including value-added taxes (VATs), and excise taxes. Direct taxes are corporate, personal income, and financial investment taxes. 0 10 20 30 General government taxes (in % of GDP) General government taxes on international trade and transactions (in % of GDP) Direct taxes (in % of GDP)
  • 68.
    52 WAEMU region, theshare of taxes on trade in total taxes was 32 percent in 2015 (Moreno-Dodson and Bayraktar, 2018). Figure 27. Selected Taxes (% of general government taxes, country averages) Source: Calculations based on WEO data. 4.16. The tax structures of the individual CEMAC countries reflect national choices in tax policy, despite their dependency on natural resources. Figure A.1 in the Annex shows that the share of taxes on goods and services (mainly VATs and excise taxes) is the highest in Cameroon and the Central African Republic. Even though it does not have the highest share, taxes on goods and services are still dominant in the Republic of Congo. On the other hand, in Chad, Equatorial Guinea, and Gabon, taxes on goods and services only minimally contribute to total taxes. 4.17. Revenues from corporate income taxes cannot be considered high on average in the CEMAC region when compared to the other regions in the world, but significant differences in the level of taxation can be observed at the national level. The share of taxes on profits, income and capital gains paid by corporations is relatively low in Cameroon, Central African Republic and Chad, but substantially higher in Equatorial Guinea. Similarly, the share, including personal income taxes as well, is also high in the Republic of Congo. The share of income taxes, including both corporate and personal income taxes, has been declining in Gabon, but it is still the dominant tax in this country. 4.18. Similarly, the importance of trade taxes varies significantly across countries. According to Figure A.1, trade taxes are dominant in Chad with a large increase in 2004. As a comparison, the share of international taxes in Cameroon, the Republic of Congo, and Equatorial Guinea is relatively low with a declining trend. In Gabon, even though trade taxes have declined they are still dominant. Corporate income and labor taxes 4.19. Labor taxes are high in CEMAC, which can create disincentives for firms. Figure 28 shows data on corporate income and labor taxes in the CEMAC region as well as in other related regions. Labor taxes (as a share of profits) are higher than corporate income taxes (CIT) in the Republic of Congo, Equatorial Guinea, and Gabon. High labor tax rates in these countries make the tax systems more regressive. Oppositely, in Cameroon the labor tax rate amounts to the half of the CIT rate. On average the shares of labor taxes and CIT are almost the same in the CEMAC region as a whole. On the other hand, while the share of labor taxes is almost the same in WAEMU, the share of CIT in profits is much 0 20 40 60 General government taxes on goods and services General government taxes on income, profits, and capital gains, payable by corporations General government taxes on international trade and transactions
  • 69.
    53 lower due tolower effective CIT rates. It is not reported in the graph, but in almost each WAEMU country, the share of labor taxes is twice as high as the share of CIT (Moreno-Dodson and Bayraktar, 2018). When compared to Sub-Saharan Africa and low-income countries in general, labor taxes and contributions are significantly higher in the both CEMAC and WAEMU regions. 4.20. In addition to high labor taxes, the effective CIT rate is also high in CEMAC when compared to the level in other regions. High CIT rates combined with high labor taxes present a significant disadvantage for firms in the CEMAC region and constitute an obstacle for doing business. Such high tax rates also prevent these countries attracting foreign investments which can be important for businesses and job creation in low-income countries (Van Parys and James, 2010). Furthermore, a general view holds that labor taxes negatively affect labor demand, particularly where the tax cannot be shifted forward onto prices (competitive output markets) or backward onto wages (e.g. where wages are at or just above a minimum wage). Working at minimum wages, the integration of informal sector jobs and activities into formal sector is in particularly negatively impacted by labor wages. Figure 28: Effective and corporate income taxes and labor taxes and contributions, 2013-2016 Source: Calculations based on Doing Business (database), International Finance Corporation and World Bank, Washington, DC, http://www.doingbusiness.org/data; PWC. Note: The Doing Business database covers only domestic small and medium enterprises (SMEs). 4.21. There is a significant gap between statutory and effective tax rates in CEMAC. The largest gap between two rates is observed in the Republic of Congo (Figure 28), where the statutory rate is almost the double of the effective rate. While the Republic of Congo collects the lowest effective rate in the region, Cameroon charges the highest effective tax rate. 4.22. Total effective tax rates (labor, corporate income and other taxes) in the CEMAC region are lower than the average rates in Sub-Saharan Africa and low-income countries. According to Figure 29, 0 5 10 15 20 25 30 35 40 Effective corporate tax rate Labor tax and contributions Statutory corporate tax rate
  • 70.
    54 even though totaltaxes paid by corporations (corporate income, labor, and others27 ) as a share of profits are higher in CEMAC than the rates in the WAEMU region, they are much lower than the average rates in Sub-Saharan and low-income countries. However, many firms in CEMAC still perceive taxes as a major obstacle for investment (Table 10). This might be due to the presence of highly distortionary investment tax incentives in the region. While some privileged firms enjoy lower taxes thanks to government policies involving special investment incentives which lead to lower tax collection in total, many other firms, especially small size ones, end up paying full taxes and struggle to compete in the market. Figure 29. Effective Total Taxes Paid by Enterprises (Labor, Corporate Income and Other), % of Profit, average between 2005 and 2016 Source: Calculations based on Doing Business (database), International Finance Corporation and World Bank, Washington, DC, http://www.doingbusiness.org/data. Note: The total tax rate covers taxes on corporate income, taxes on labor, and other taxes, which include property taxes, property transfer taxes, dividend taxes, capital gains taxes, financial transactions taxes, waste collection taxes, vehicle and road taxes, and any other taxes or fees. For Central African Republic, the reported rate is for the years between 2011 and 2016. 4.23. Total effective tax rates differ significantly across the CEMAC countries and are not converging. Figure 29 presents that the total tax rate is highest in Chad and in the Central African Republic, and Gabon has the lowest overall rate. An analysis of the developments of CIT rates over time shows that there is no clear convergence (Figure 30). One exception, though, is the extractive industries sector, as defined by governments, where CIT rates are better aligned (Figure A.3 in the Annex). Such tax disparities within the region put the country with high tax rates in a disadvantaged position in terms of 27 Other taxes include property taxes, property transfer taxes, dividend tax, capital gains tax, financial transactions tax, waste collection taxes, vehicle and road taxes, and any other small taxes or fees. 0.00 10.00 20.00 30.00 40.00 50.00 60.00 70.00 80.00
  • 71.
    55 investment and competition.The differences also indicate that the region needs tax harmonization to move towards a common market. Figure 30. Comparison of CIT rates across CEMAC countries (in % of profits), 2009-2015 Source: World Bank “Global Investment Competitiveness Report 2017/2018”. Data for CAR not available. The tax rates apply to all sectors in Cameroon, Chad and Equatorial Guinea, to all sectors but extractive industries in Gabon and all sectors but agriculture and fishing, construction and building materials and extractive industries in the Republic of Congo. Natural resource taxation 4.24. One big weakness of the tax system in the CEMAC region is that the tax base is extensively dependent on oil related sectors and activities. Figure 31 shows that the share of resource taxes is close to 30 percent of GDP in Equatorial Guinea and the Republic of Congo.28 When oil prices were high in the mid-2000s, the share of resource taxes was 50 percent of GDP in Equatorial Guinea and 40 percent of GDP in the Republic of Congo. Such a high share of resource taxes indicates that tax revenues fluctuate significantly due to changes in international oil prices. This situation introduces instability in general government spending and public investment and also makes countries vulnerable to factors that are not under their control. In addition, this narrow, resource dependent tax base, makes governments less accountable to their population. It should be noted that the share of resource taxes is not high in each CEMAC country. For example, in Chad and Gabon the share in GDP was around 15 percent in 2012, while Cameroon reports only 5 percent share. 28 Definition of resource taxes from Mansour 2014 (page 7): “These include primarily revenues from the Corporate Tax that are collected from extractive activities in the oil and gas, and mining sectors, and royalties. Revenues from production sharing agreements (PSAs) were included in this series to the extent that they were paid into the government general fund—which typically occurs in the case of oil and gas through a national oil company. There is no separation of revenues from oil and gas, and revenues from mining activities, since most countries do not report revenues at this level of details. However, as shown later, it is relatively easy to analyze the aggregate relative importance of revenues from each of these two sectors given that few countries are rich in both hydrocarbons and non-hydrocarbons minerals.” 29 31 33 35 37 39 41 2009 2010 2011 2012 2013 2014 2015 Cameroon Chad Congo, Republic of Equatorial Guinea Gabon
  • 72.
    56 Figure 31. Totalresource taxes (% of GDP) Source: ICTD and Mansour, Mario. 2014 D. Conclusion and policy implications 4.25. Tax policies in the CEMAC region are still mostly diverse and uncoordinated and the current tax framework – rate structure and exemptions - creates unfair tax competition among member countries. The CEMAC members had several attempts to improve the structure and coordination of taxes in the region to increase productivity and investment and achieve the goal of a common market, but the process has been slow so far. Some rules to harmonize consumption taxes, investment taxes and international taxes have been introduced, but exceptions at the national level continue to be in place. Member countries are still in need of tax policies that can lead to higher efficiency and fewer distortions in their market. 4.26. The tax system in the CEMAC region depends heavily on oil prices and oil-related activities, but should be broadened out, capturing non-oil economic activities to a much larger extent. Dependency of tax revenue on natural resources in most CEMAC countries makes them vulnerable to changes in oil prices and production, thereby hampering government spending and especially public investment. Tax revenue should be based more on non-oil activities. 4.27. In some CEMAC countries, the tax system depends to a large extent on income taxes and a more balanced utilization of consumption- and income tax bases should be considered. In addition to enhancing the productivity of the tax system, due to the enlarged tax bases, a fairer burden sharing may be the result as well. Statutory corporate income tax rates seem high in the region, which lowers competitiveness of firms significantly. Labor taxes are high as well. In addition, tax incentives granted on selected firms can introduce distortions in the market. Shifting taxes from corporate income to consumption can be helpful to ease the pressure on firms. 4.28. A coherent CEMAC action plan on tax reforms was developed in 2017, addressing policy gaps and needs of shift in tax mix. In response to the economic and financial crisis, CEMAC has established a comprehensive economic and financial reform program, to ensure quick and coordinated policy actions 0 10 20 30 40 50 60 19801982198419861988199019921994199619982000200220042006200820102012 Cameroon Central African Rep. Chad Congo, Rep. Equatorial Guinea Gabon
  • 73.
    57 (CEMAC, 2017). Acore pillar of the plan deals with “strengthening tax policy”, where the overall objective focus on increasing consumption tax revenues in the overall tax mix, in order to promote firms’ competitiveness. As an important measure, the plan suggests rationalizing tax expenditures by suppressing inefficient and too generous schemes, and to improve fiscal management of the tax expenditures as being retained. Tax expenditures on consumption taxes are generally acknowledged as an inefficient instrument to seek equity, since the absolute subsidy to middle and higher income household is higher than to low-income. Consequently, the revenue loss is very high which reduces any fiscal space and hence, prevents initiatives on lowering the statutory rates on CIT, as an example. Some CEMAC countries, including Cameroon and Gabon, have launched systematic efforts to rationalize tax expenditures, based on cost-benefit evaluations of the specific areas. 4.29. Capitalizing on the CEMAC action plan, as an immediate reform step, the CEMAC Commission is encouraged to improve and further enforce the fiscal monitoring framework. The action plan on tax policy provides a series of specific actions to be undertaken by CEMAC countries, as well as performance indicators are put in place to track and monitor reform progress. The action plan could be introduced and monitored in the national budget laws, as well as reported in CEMAC’ wide status reports on CEMAC’ countries revenue- and broader fiscal status and reform implementation. In a broader perspective, the implementation of the various areas of the CEMAC action (monetary- and structural reforms) would be an important contribution to strengthening CEMAC’s surveillance framework. 4.30. The CEMAC countries also need to work harder on harmonizing taxation. Despite several attempts29 , tariffs and taxes in the CEMAC region differ, in practice, across the member countries. Multiple VAT rates structure persists (Republic of Congo, Central African Republic), and the VAT threshold varies, between 10 to 60 million FCFA in business turnover. Since the VAT mechanism, provided tax administrative capacity of a certain level, is an efficient instrument in formalization of economic activities (and thus, in revenue generation), the differences in thresholds implies that the efforts to reduce the informal sector take a very different point of departure across the CEMAC countries. As another policy topic, a common comment for the whole region is that the members should adopt a harmonized tax structure for petroleum products. A concerted effort to harmonize taxes is necessary to move forward with the common market. In the WAEMU region a detailed tax coordination treaty had already been signed in 1998. Even though tax coordination, in practice, is not still fully effective in many areas in the WAEMU region, their experience may be helpful for their peers in the CEMAC region. 29 Reforms have been undertaken to address the list of areas as Doe (2006) suggested on consumption taxes: (1) Cameroon needs to eliminate the VAT surcharge of 10 percent; (2) Chad should reduce the highest excise tax rate from 30 percent to 25 percent (harmonized rate); (3) the republic of Congo needs to remove the domestic consumption tax surcharge of 5 percent; (4) Equatorial Guinea needs to eliminate the multiple rate of the VAT by the harmonized single rate and to cut the highest excise tax rate from 38 percent to 25 percent; (5) Gabon needs to eliminate the multiple rate VAT and replace with a single rate VAT; to remove the 20 percent surcharge added on selected imports; and cut the highest excise tax rate from 32 percent to 25 percent.
  • 74.
    58 Annex Figure A.9. SelectedTaxes Expected to affect Production and Investment Decisions among Firms, CEMAC Countries Sources: Keen and Mansour 2010a, 2010b; Mansour 2014; WEO (World Economic Outlook Database), International Monetary Fund, Washington, DC, ICTD https://www.imf.org/external/pubs/ft/weo/2016/01/weodata/index.aspx. 0 10 20 30 40 50 60 1990 1991 1992 1993 1994 1995 1996 1997 1998 1999 2000 2001 2002 2003 2004 2005 2006 2007 2008 2009 2010 2011 2012 2013 2014 2015 2016 Cameroon: Selected General Government Taxes (% of total taxes) Taxes on goods and services Taxes on international trade and transactions Taxes on income, profits, and capital gains Taxes on income, profits, and capital gains, payable by corporations Taxes on income, profits, and capital gains, payable by individuals 0 20 40 60 80 100 1990 1991 1992 1993 1994 1995 1996 1997 1998 1999 2000 2001 2002 2003 2004 2005 2006 2007 2008 2009 2010 2011 2012 2013 2014 2015 2016 Chad: Selected General Government Taxes (% of total taxes) Taxes on goods and services Taxes on international trade and transactions Taxes on income, profits, and capital gains Taxes on income, profits, and capital gains, payable by corporations Taxes on income, profits, and capital gains, payable by individuals 0 10 20 30 40 50 1990 1991 1992 1993 1994 1995 1996 1997 1998 1999 2000 2001 2002 2003 2004 2005 2006 2007 2008 2009 2010 2011 2012 2013 2014 2015 2016 Congo, Rep.: Selected General Government Taxes (% of total taxes) Taxes on goods and services Taxes on international trade and transactions Taxes on income, profits, and capital gains 0 10 20 30 40 50 60 70 80 90 100 1990 1991 1992 1993 1994 1995 1996 1997 1998 1999 2000 2001 2002 2003 2004 2005 2006 2007 2008 2009 2010 2011 2012 2013 2014 2015 2016 Equtorial Guinea: Selected General Government Taxes (% of total taxes) Taxes on goods and services Taxes on international trade and transactions Taxes on income, profits, and capital gains Taxes on income, profits, and capital gains, payable by corporations Taxes on income, profits, and capital gains, payable by individuals 0 10 20 30 40 50 60 70 1990 1991 1992 1993 1994 1995 1996 1997 1998 1999 2000 2001 2002 2003 2004 2005 2006 2007 2008 2009 2010 2011 2012 2013 2014 2015 2016 Gabon: Selected General Government Taxes (% of total taxes) Taxes on goods and services Taxes on international trade and transactions Taxes on income, profits, and capital gains 0 10 20 30 40 50 60 70 1990 1991 1992 1993 1994 1995 1996 1997 1998 1999 2000 2001 2002 2003 2004 2005 2006 2007 2008 2009 2010 2011 2012 2013 2014 2015 2016 Central African Rep.: Selected General Government Taxes (% of total taxes) Taxes on goods and services Taxes on international trade and transactions Taxes on income, profits, and capital gains Taxes on income, profits, and capital gains, payable by corporations Taxes on income, profits, and capital gains, payable by individuals
  • 75.
    59 Figure A.10: CITrates for extractive industries (%), 2009-2015 Source: World Bank “Global Investment Competitiveness Report 2017/2018”. 0 5 10 15 20 25 30 35 40 45 2009 2010 2011 2012 2013 2014 2015 Cameroon Chad Congo, Republic of Equatorial Guinea Gabon
  • 76.
    60 CHAPTER 5: TradeAnalysis and Trade Policy in CEMAC Countries A. Introduction 5.1. Despite a Custom Union, regional integration in the CEMAC zone remains shallow. The common external tariff is not effectively utilized and member countries continue to apply different rates on various products depending on their national interests. Numerous obstacles to the free movement of people and goods remain. As a result, regional trade remains very modest compared to trade with other parts of the world. Intra-CEMAC trade is estimated to represent only between 2 and 5 percent of the total trade of the member countries, the lowest of any regional integration community. 5.2. This chapter analyzes recent trends in trade of CEMAC countries and assess the role of trade policy in regional integration. The first part of the chapter provides a simplified trade analysis for CEMAC describing the evolution of CEMAC exports in terms of composition and intensity with main trading partners, with an emphasis on the EU, as well as regional integration intra-CEMAC trade. The second part focuses on two components of trade policy in CEMAC countries: tariffs and non-tariff measures (NTMs). B. Trade analysis for CEMAC countries Evolution and composition of CEMAC exports 5.3. Exports and imports have increased substantially in the last years. Exports went from an average of US$4.8bn in the 1980s, 29.4 percent of GDP, to an average of US$37.7bn between 2010 and 2016, 44.9 percent of GDP. The exports surge started in the early 2000s and was mostly driven by oil exports earnings due to high oil prices and production in the Republic of Congo, Gabon and Equatorial Guinea. Imports started to increase a few years later and went from an average of US$2.7bn in the 1980s, 16.2 percent of GDP, to an average of US$17.1bn between 2010 and 2016, 19.9 percent of GDP. The largest increases in imports were recorded by Cameroon, the Republic of Congo and Gabon. 5.4. CEMAC exports have been dominated by petroleum products, which account for about 60 percent of all exports (Figure 32). Petroleum is the most important export product in all CEMAC countries but the Central African Republic, accounting for more than 60 percent of total exports in the Republic of Congo, Chad, Equatorial Guinea and Gabon, as shown in Table A.1 in the Annex that tabulates the top 10 export products (defined according to the Harmonized System at the 6-digit level, HS-6) for each CEMAC country. The high dependence of CEMAC countries on crude petroleum exports makes them vulnerable to oil price fluctuations. Since 2014, the price of oil has been on a downward trajectory, leading to a strong decline in the value of CEMAC petroleum exports. The export value and share of minerals and metals had risen in the mid-2000s following the surge in commodity prices such as copper, manganese and natural gas. By 2015, exports of mineral and metals accounted for 18 percent of all CEMAC exports, however still far below petroleum exports. 5.5. CEMAC countries exhibit very low diversification in terms of exported products, except for Cameroon, which exports a higher number of products and has a lower degree of export concentration. Figure 33 measures the export concentration of goods in 2015 in CEMAC according to
  • 77.
    61 three indicators: (i)the normalized Hirschman-Herfindahl index30 , (ii) the share of the top 3 exported products (at the HS-6 digit) in total exports, and (iii) the number of exported products. Chad, Equatorial Guinea and Gabon have the least diversified export bundle according to all three indicators: Only three products accounted for over 90 percent of exports in 2015. Cameroon is the most diversified, exporting 1,730 products at HS6 level compared to less than 900 products for the other CEMAC members. 5.6. The Republic of Congo and Equatorial Guinea together account for most of CEMAC’s exports of petroleum and non-petroleum products. Combined exports from the Republic of Congo and Equatorial Guinea accounted for 54 percent of CEMAC exports over 2014-2015. Gabon and Cameroon ranked third and fourth accounting for 22 and 17 percent of CEMAC exports, respectively. Before the recent global crisis, Cameroon was the main exporter of non-petroleum products; the Republic of Congo and Equatorial Guinea’s non-petroleum exports have surged ever since. Cameroon’s non-petroleum exports are dominated by agricultural and food products such as cocoa beans, bananas and cotton. Equatorial Guinea’s rise in non-petroleum exports is attributed to natural gas, propane and butane, which accounted for 76 percent of the country’s non-petroleum exports in 2015. The rise in Congolese non-petroleum exports was mainly led by booming minerals exports – especially copper. Figure 32: Export value by category and petroleum export share in CEMAC trade Source: World Bank Staff estimates using the CEPII-BACI database.31 Figure 33: Concentration of goods exports in 2015 30 The Hirschman-Herfindahl index is the sum of squared shares of each product in total export. A country with a perfectly diversified export portfolio will have an index close to zero, whereas a country which exports only one export will have a value of one (least diversified). 31 Food and Agricultural products are defined using the WTO classification at HS6 level. Food and Agricultural goods cover HS chapters 1 to 24, as well as a number of manufactured agricultural products in chapters 29, 33, 35, 38, 41, 43, 50, 51, 52 et 53. Petroleum include HS 270900 «Petroleum oils and oils obtained from bituminous » and 271000 « Petroleum oils, etc, (excl. crude); preparation ». 0 10 20 30 40 50 60 70 80 90 0 10 20 30 40 50 2000200120022003200420052006200720082009201020112012201320142015 % BillionUSD Petroleum Minerals and metals Wood Food and Agriculture Other Petroleum (Exp. Share)
  • 78.
    62 Source: World Bankstaff estimates using the CEPII-BACI database. Note: The Herfindahl concentration index is constructed using the sum of the squares of product shares in total export at HS6 level. Figure 34: Non-petroleum export value by country Source: World Bank staff estimates using the CEPII-BACI database. Figure 35: Petroleum export value by country Source: World Bank staff estimates using the CEPII-BACI database. CEMAC – trade with main partners 5.7. CEMAC’s trade with EU countries has strongly declined over the past two decades. During the first half of the 2000s, the EU was CEMAC’s main trading partner accounting for more than half of CEMAC’s non-petroleum exports (Figure 36). In 2015, however, only 33 percent of CEMAC’s non- petroleum exports and 22 percent of petroleum exports were directed to the EU. Imports from EU countries accounted for about 56 percent of CEMAC imports in 2000, but their share has fallen below 40 percent since 2012 (Figure 38). Exports to the US are mostly composed by petroleum and have fallen since 2010. 5.8. On the contrary, CEMAC’s exports to Asian countries have expanded significantly, with China itself accounting for 16 percent of CEMAC’s non-petroleum exports and 24 percent of its petroleum 0 500 1000 1500 2000 0.00 0.20 0.40 0.60 0.80 1.00 Cameroon Central African Republic Chad Congo Eq. Guinea Gabon Numberodproducts Norm. Herfindhal (export) Share of top 3 products Number of exported products 0.0 1.0 2.0 3.0 4.0 5.0 2000 2002 2004 2006 2008 2010 2012 2014 BillionUSD Cameroon CAR Chad Congo Gabon Equatorial Guinea 0 2 4 6 8 10 12 2000 2002 2004 2006 2008 2010 2012 2014 BillionUSD Cameroon CAR Chad Congo Gabon Equatorial Guinea
  • 79.
    63 exports in 2015(Figure 37). The EU's share in CEMAC’s imports has fallen while imports from Asia have surged. China alone is the source of one-fifth of CEMAC’s imports and non-CEMAC African countries are the fourth source of CEMAC’s imports, behind the EU, China and the rest of Asia. Exports of minerals and metals dominate exports to non-CEMAC African countries and Asian countries other than China. The EU is the only destination where food and agricultural products represent a significant share of CEMAC’s exports. Figure 36: Extra-community exports of non-petroleum products to various partners Source: World Bank staff estimates using the CEPII-BACI database. Figure 37: Extra-community exports of petroleum products to various partners Source: World Bank staff estimates using the CEPII-BACI database. 0 2 4 6 8 10 12 14 0 10 20 30 40 50 60 70 2000200120022003200420052006200720082009201020112012201320142015 BillionUSD % Export value EU China USA Rest of Africa Rest of Asia Other countries 0 5 10 15 20 25 30 35 0 10 20 30 40 50 2000 2001 2002 2003 2004 2005 2006 2007 2008 2009 2010 2011 2012 2013 2014 2015 BillionUSD % Export value EU China USA Rest of Africa Rest of Asia Other countries
  • 80.
    64 Figure 38: Extra-communityimports from various origins Source: World Bank staff estimates using the CEPII-BACI database. 0 5 10 15 20 25 0 20 40 60 80 2000 2001 2002 2003 2004 2005 2006 2007 2008 2009 2010 2011 2012 2013 2014 2015 BillionUSD % Import value EU China USA Rest of Africa Rest of Asia Other countries Box 7. Trade and Economic Growth in CEMAC: Regression Analysis Calderon and Cantu (2018) investigate the effects of trade openness, diversification, and the role of natural resources on growth in CEMAC countries. The following findings emerge from the analysis: • Growth per worker. Trade openness —proxied by the ratio of exports and imports to GDP— has a positive, significant and causal relationship with growth. Product concentration has a negative and significant relationship with growth per worker, and market concentration has a small positive and significant impact on growth. The share of natural resource exports in total exports also exhibits a negative and significant relationship. This implies that growth is fostered by higher trade integration, a more diverse basket of products to export, and lower dependence of natural resources in the structure of exports. • Channels of transmission. Trade openness has a positive impact on both growth of capital per worker and TFP when we do not control for natural resources. A more diverse structure of exports would lead to greater growth in capital stock and TFP —especially when we account for the presence of natural resources in the regression analysis. The structure of trading partners, on the other hand, does not exhibit a robust relationship with the sources of growth. Finally, a greater dependence on natural resources in the export basket hinders the growth of capital stock and TFP. Simulation of Growth Impact: Calderon and Cantu (2018) compute the growth benefits of closing the gap in terms of trade openness, product diversification and share of natural resources in total trade with respect to the top growth performers in the region: growth per worker of the CEMAC region would gain 0.24 percent per year if CEMAC countries were to close the gap in trade openness with the SSA average (that is, an increase in the growth rate by around 5 percentage points over the next two decades). Growth benefits would be larger for Cameroon (1.1 percent per year) and Central African Republic (1.4 percent). Similarly, if CEMAC were to close the product concentration gap with the SSA average, there would be much larger gains (of about 2.2 percent of growth per worker per year). The largest growth gains from diversification among CEMAC countries come from DRC (2.4 percent) and Central African Republic (2.0 percent). The largest gains in terms of growth seem to originate from reduced product concentration. Most of the countries would benefit from at least a minimum of 1 percent per year in additional output growth.
  • 81.
    65 Trade agreements 5.9. Withsome variations, most CEMAC countries are beneficiaries of unilateral preferential regimes extended by developed countries. All CEMAC countries except Equatorial Guinea are eligible for preferential market access to the United States under it Generalized System of Preferences (GSP) program. Equatorial Guinea was removed from the U.S. GSP program in January 2011. The least developed countries in the CEMAC region are eligible for duty-free and quota-free market access into the EU market under the Everything but Arms (EBA) initiative. This includes the Central African Republic, Chad, and Equatorial Guinea. The latter graduated in 2017 from the list of LDCs, per the UN classification, and will lose preferential market access under the EBA program. The Republic of Congo benefits from unilateral preferences only under the EU Generalized Scheme of Preferences (GSP) scheme32 , while Gabon, an upper-middle income country, is no longer eligible for the new GSP scheme since January 2014. 5.10. The EU is currently in negotiations about an Economic Partnership Agreement with Cameroon, the Central African Republic, Chad, the Republic of Congo, Equatorial Guinea and Gabon. The ongoing negotiations for a comprehensive Economic Partnership Agreement between the EU and Central Africa include areas such as rules and commitments on goods and rules of origin, services and investment, sustainable development, competition and trade facilitation. A cooperation on technical barriers to trade and sanitary and phytosanitary standards is also foreseen. 5.11. Cameroon signed an interim Economic Partnership Agreement (EPA) with the EU. Cameroon and the EU agreed on an interim EPA on December 2007 and signed it on January 2009.33 The agreement was approved by the European Parliament in June 2013 and ratified by Cameroon in July 2014. Provisional application became effective on 4 August 2014. This agreement provides duty-free, quota-free EU access for all goods from Cameroon and a gradual removal of duties and quotas over 15 years on 80 percent of EU exports to Cameroon. By agreeing, signing and ratifying the agreement, Cameroon prevented a disruption in preferential market access to the EU previously granted by the Cotonou Agreement that expired on 31 December 2007. 5.12. The interim EPA also provided the liberalization of Cameroon’s tariff on EU products, which is a deviation from the CEMAC’s Common External Tariff (CET). The interim agreement also provides a schedule for tariff liberalization on EU products into Cameroon for certain products. A customs union, like CEMAC, is expected to have a CET for goods entering the customs union through any of this countries member. As members of a customs union apply zero-tariffs on imported products originating in another member, a lower tariff on imports originating outside the customs union may provoke trade- deflection34 . The agreement also excludes some other EU products from liberalization to ensure Cameroon the protection of some sensitive agricultural markets and industries, but also to maintain 32 The Generalized Scheme of Preferences (GSP) scheme provide tariff reductions in about 66 percent of tariff lines or products originating in beneficiary countries. The GSP is less generous than EBA. 33 The text of the interim EPA can be found at: http://eur-lex.europa.eu/legal-content/EN/TXT/PDF/?uri=CELEX:22009A0228(01)&rid=2 34 Trade deflection happens when a product is imported into a trade agreement bloc through the country with the lowest external tariff and is re-exported duty-free to a partner in the trade agreement, thereby generating rents.
  • 82.
    66 fiscal revenues.35 Cameroonian authoritiesstarted cutting tariffs on some products starting in August 2016. According to the European External Action Service (2018), these products include inputs for processing industry, transport and construction. Commentators also suggested that other countries in the region may be considering bilateral agreements with other partners such as China. 5.13. Besides preferential market access for goods, the interim EPA with the EU also cover a myriad of domains, such as aid for trade, trade facilitation, institutional issues, and dispute settlement. The interim EPA also includes "rendezvous" clauses providing for further negotiations on other trade-related issues such as trade in services, competition policy, intellectual property, investment measures, etc. It is often argued that free trade agreements (FTAs) between large countries and smaller developing countries may serve as “policy anchors” by acting as a mechanism for the smaller developing country to make credible commitments to policy reform in different areas which they might not otherwise make. For instance, Ferrantino (2006) shows that Mexico’s negotiation of NAFTA (signed in 1994) served as “anchor” policy commitments that would be difficult to undone later. 5.14. The share of CEMAC’s exports to the EU that currently use preferential market access is small. EUROSTAT reports detailed data on EU imports under each trade regime, which allows analyzing the extent of preferential market access granted by the EU. Table 16 reports total exports to the EU for each CEMAC country (column I) except Gabon36 , the value of exports eligible to EU preferences as the EU MFN tariff in these products is positive37 (column II), and the value of exports effectively entering the EU under preferences (column III). The share of exports to the EU eligible to preferences (column IV) is below 5 percent in all countries, except for Cameroon. Indeed, only 14 percent of Cameroonian exports to the EU are eligible for preferences, and the share of eligible export reaches 21 percent for Cameroonian food and agricultural products. The MFN tariff applied by the EU is zero for most petroleum products that dominate CEMAC exports, which excludes them from preferences eligibility. The utilization rate of preferences (column V) is the ratio of EU imports from a given country entering under preferential treatment to total EU imports of products eligible for preferences from the same country (i.e. imports with a positive MFN tariff). When disaggregated by product category, utilization rates seem higher for products with large export volumes like exports of food and agricultural products from Cameroon or minerals and metals exports from the Republic of Congo and Equatorial Guinea.38 35 Article 21 and Annex III of the agreement define the products to be liberalized in the Cameroonian market (designated as categories 1, 2, and 3) and their tariff liberalization schedule, as well as those products exempted from liberalization (category 5). 36 As discussed before, Gabon is not eligible for preferential market access to the EU. 37 Products for which the EU has a zero MFN tariff do not qualify for preferential access since exports from any country enter the EU duty-free regardless of whether it has signed a trade agreement with the EU. Thus, we do not count them as produces eligible for EU preferences. 38 For other African countries with larger exports of food and agricultural products to the EU, such as Ivory Coast, Ghana, Nigeria, South Africa and Senegal, the share of exports eligible for EU preferences and their utilization is higher, as shown in Table A2 of the Annex.
  • 83.
    67 Table 16: Preferenceutilization rates of exports to the EU by country in 2016 Category Total exports to the EU (1000 euros) Value of exports to the EU eligible for preferences (1000 euros) Value of exports entering the EU under preferences (1000 euros) Share of eligible exports Utilization rate of preferences (I) (II) (III) (IV=II/I) (V=III/II) Central African Republic Food and Agriculture 16,387 502 6 0.03 0.01 Petroleum 0 0 0 0 0 Minerals and metals 0.03 0 0 0 0 Total 16,387 502 6 0.03 0.01 Cameroon Food and Agriculture 955,633 202,141 194,289 0.21 0.96 Petroleum 576,496 12,222 6,109 0.02 0.5 Minerals and metals 49 0 0 0 - Total 1,532,179 214,363 200,399 0.14 0.93 Chad Food and Agriculture 18,756 1,077 0 0.06 0 Petroleum 96,963 0.5 0 0 0 Minerals and metals 1 0 0 0 0 Total 115,721 1,077 0 0.01 0 Congo Food and Agriculture 711,401 13,068 1,592 0.02 0.12 Petroleum 334,585 20,987 1,368 0.06 0.07 Minerals and metals 18,517 16,083 11,370 0.87 0.71 Total 1,064,504 50,139 14,331 0.05 0.29 Equatorial Guinea Food and Agriculture 173,538 11,636 6,449 0.07 0.6 Petroleum 1,055,855 0.2 0 0 0 Minerals and metals 12,517 12,500 12,494 1.00 1 Total 1,241,911 24,137 18,943 0.02 0.78 Source: World Bank staff estimates using data from EUROSTAT 5.15. Concluding agreements with developed countries would be a way to maintain long-term preferences as well as to spur domestic reforms. Unilateral preference has often expired or countries have been taken out of the beneficiary list for different reasons. The literature highlights the importance of reducing trade policy uncertainty for long-term investment and institutional reform.39 Reciprocal tariff liberalization would also bring benefits to firms that import capital goods and intermediate goods, helping the economy become more productive. FTA agreements with “North” countries tend to be 39 For example, Edwards and Lawrence (2012).
  • 84.
    68 deeper than South-Southagreements, and certainly deeper than unilateral preferential regimes. The Economic Partnership Agreements (EPAs) while not the deepest agreements per global standards, go beyond commitments to reduce tariffs and include disciplines in Sanitary and Phyto-Sanitary (SPS) measures and Technical Barriers to Trade (TBT) measures, provisions on trade facilitation and trade capacity building, and “rendez-vous clauses” in view to continue deepening the agreement in other areas of reform, such as services trade, competition, intellectual property, and investment. 5.16. For Equatorial Guinea, the process of a WTO accession can be an important driver of reform and higher integration into the global economy. Equatorial Guinea is the only CEMAC country that is not yet part of WTO, while the country expressed interest in joining in 2008, there has been little progress to date. The WTO provides a rules-based trading system with guaranties for market access in terms of most-favored nation and national treatment. Moreover, the process of accession involves bilateral, plurilateral, and multilateral negotiations that can accelerate domestic reforms towards improving the environment for investment in trade-oriented economic opportunities. WTO accession has been used as a platform to launch, deepen and consolidate a structural transformation of the economies of acceding governments.40 An accession process typically involves a series of economy-wide reforms undertaken by the acceding government, which are made in the framework of multilateral trading rules. 5.17. The CEMAC countries are also involved in other integration efforts in Africa. The CEMAC countries are founding members of the African Union (AU) initiated in 2002, which aims at strengthening regional economic communities in African and the recently signed Continental Free Trade Area (CFTA). The AU recognizes 8 regional economic communities of which CEMAC is included as part of the Economic Community of Central African States (ECCAS).41 CAR and Chad are also members of another regional economic community, the Community of Sahel-Saharan States (CEN-SAD). With its customs union, trade integration in CEMAC is more advanced, relative to ECCAS or CEN-SAD. Regional integration and intra-community trade 5.18. Regional integration remains weak among CEMAC countries, despite being a customs union42 . CEMAC has not been successful at promoting trade among its members. As a way of comparison, Table 17 reports the evolution of the share of intra-regional exports of total exports for CEMAC as well as selected African and non-African preferential trade blocs. The share of intra-regional exports is the lowest across periods for CEMAC and has not exceeded an average of 4 percent. Intra-regional trade has been higher in ECOWAS, COMESA, SADC, WAEMU. Among African trade blocs in Table 17, EAC has experienced the highest share of intra-regional trade, even above MERCOSUR, a South American customs union, but below ASEAN (Association of Southeast Asian Nations). Food and agriculture is the only product category in which the reported intra-CEMAC export share is above 5 percent of total exports for all years except 2013 (Figure 39). Yet, the value and the proportion of food and agriculture exports in internal trade have declined over the past ten years and accounted for only 10 percent of intra-community exports in 2014-2015. CEMAC countries do not trade much of petroleum, minerals and metals, and wood products within the region. 40 See for instance, the evidence found by Haddad, Hollweg and Portugal-Perez (2015). 41 ECCAS includes all CEMAC member, plus Angola, Burundi, D.R. Congo, and São Tomé and Principe. 42 Typically, a customs union has a common external tariff (CET) and its members trade their products duty-free.
  • 85.
    69 Table 17: Shareof intra-regional exports for selected trade blocs. Share of intra-regional exports 2000-2004 2005-2009 2010-2014 2015-2016 CEMAC 1.6 2.9 3.3 1 ECOWAS 9.4 9 7.4 8.1 COMESA 4.7 5 7.8 9 SADC 9 9.9 11.6 10.8 WAEMU 14.2 14.1 12.8 11.1 MERCOSUR 12.3 13.2 13.6 12.9 EAC 16 15.4 16.5 15.7 ASEAN 20.6 21.8 22.5 21.5 Source: World Bank staff estimates using CEPII-BACI data. Figure 39: Share of intra-community exports in CEMAC exports by category Source: World Bank staff estimates using CEPII-BACI data. Note: Each bar represents the share of intra community exports in total CEMAC exports by category. For instance, in 2000, exports of food and agricultural products to CEMAC members accounted for 6 percent of CEMAC exports of food and agricultural products. 5.19. However, informal cross-border trade, particularly by small-scale informal traders, is of considerable importance in the CEMAC region. Informal cross-border trade seems to be significant in many African countries. According to Ayadi et al. (2013) although informal trade represents only a small share of Tunisia’s total trade (5 percent of total imports), informal trade is an important part of the Tunisia’s bilateral trade with Libya and Algeria; it accounts for more than half the official trade with Libya and more than total official trade with Algeria. Similarly, in Niger, where smuggling of hydrocarbons and revenue losses due to domestic sales intended for export are the main sources of revenue losses, informal trade accounts for US$40 per capita per year, which, however, is still low compared to US$250 per capita per year in South Nigeria (World Bank 2017b). It can be expected that the informal cross-border trade is of similar significance in the CEMAC region, thereby leading to under- recorded trade statistics within the region. Research on informal trade and smuggling in Africa attributes 0 2 4 6 8 10 12 2000 2001 2002 2003 2004 2005 2006 2007 2008 2009 2010 2011 2012 2013 2014 2015 % Total Food and Agriculture Petroleum Minerals and metals Wood
  • 86.
    70 smuggling, informal cross-bordertrade, and customs fraud to two main causes: (1) differences in prices and tax burdens in neighboring countries; and (2) the complexities of customs clearance procedures and internal control issues in customs units (World Bank 2017b). 5.20. Regional trade within CEMAC countries is impeded by supply-side limitations, poor infrastructure, remaining tariffs and non-tariff barriers, behind-the-border barriers, as well as the lack of trade complementarity. Trade complementarity indices can be calculated to measure the overlap of what two countries sell to and buy from each other to evaluate if they are natural trading partners.43 The index ranges between 0 and 100, with 100 indicating a perfect overlap. Figure 40 reports trade complementarity indices for CEMAC exports to the same bloc as well as other countries. Subject to the data caveat on unreported trade in the region, the degree of overlap between what CEMAC countries sell to and buy from each other is significantly lower than the degree of complementarity between these countries and some principal trading partners. The highest complementarity is recorded for top EU partners (average of France, Belgium, Italy and Spain); almost twice as the complementarity between CEMAC countries.44 Figure 40. Trade Complementarity Indices for CEMAC countries, 2014 Source: Staff calculations using data of WITS. Notes: Top EU partners includes France, Belgium, Italy, and Spain. CEMAC includes CAR, Cameroon, and Congo. C. Trade policy in CEMAC Import tariffs 5.21. CEMAC’s common trade policy includes two main instruments: the common external tariff (CET) and a zero-rate preferential tariff for intra-CEMAC trade, both of which have been subject to flaws. During its summit in October 2017 in N’Djamena the Conference of CEMAC Heads of State confirmed the need for improved implementation of the CEMAC trade regime and recommended that states should exercise the greatest caution in applying the CEMAC common trade policy instruments. 43 The trade complementarity index is estimated for each country pair, for each direction of trade. For the complementarity index among CEMAC, the index between CAR, Cameroon, and Congo is calculated for each direction of trade and then the average among the 6 pairwise indices is taken. Indices are averaged similarly for other countries. 44 As a comparison, the complementarity for the pair France and Belgium would average 71 percent. 0 5 10 15 20 25 30 35 40 45 Other CEMAC Top EU China USA Percent
  • 87.
    71 5.22. As ablock, CEMAC countries apply relatively high tariffs (i.e. CET) to imports from third countries. The CEMAC CET schedule contains 5,478 tariff lines with all tariffs applied in an ad-valorem basis over the CIF import value. The common external tariff (CET), adopted in 2000, comprises five duty rate categories (Figure 41) as follows: a 0 percent tariff for certain cultural and aviation products (31 tariff lines or 0.6 percent of lines); a 5 percent tariff for basic needs (281 tariff lines or 5.1 percent of lines); a 10 percent tariff for raw materials and capital goods (2,510 tariff lines or 45.8 percent of lines); a 20 percent tariff for miscellaneous goods (671 tariff lines or 12.3 percent of lines); and a 30 percent tariff for consumer goods (1,968 tariff lines or 35.9 percent of lines). For 17 tariff lines, the CEMAC tariff schedule does not determine a CET. Figure 41: Frequency of CET bands Source: World Bank staff estimates using the CEMAC tariff schedule. 5.23. The average tariff based on the CET is about 18.1 percent, across all tariff lines. By global standards, tariffs are high, with double-digit average tariffs across sectors of the economy (Table 18). Tariffs are particularly high for certain manufactured goods such as footwear, where more than 90 percent of tariff lines are in the highest tariff band of 30 percent; and for stone, ceramic, and glass products, where more than 80 percent of tariff lines pay the highest duty rate of 30 percent. Food products are also highly protected with an average tariff of close to 25 percent. 5.24. Neighboring countries in ECOWAS maintain a CET with similar 5 tariff band levels, but the CEMAC CET is, on average, more restrictive. The ECOWAS tariff schedule establishes tariff rates at 0, 5, 10, 20, and 35 percent. However, the top band that assess tariff duties at 35 percent (versus 30 percent in CEMAC) applies only to 196 tariff lines (versus 1,968 tariff lines in CEMAC’s top duty band of 30 percent). Thus, the simple average tariff in the ECOWAS tariff schedule is 12.4, versus 18.1 in the CEMAC tariff schedule. 0 .1.2.3.4.5 Fraction 0 10 20 30 Ad-varolem duty, percent
  • 88.
    72 Table 18. CEMACCommon External Tariff, by broad sectors Percentage of tariff lines by duty rate Aver. tariff Duty-free 5% 10% 20% 30% Animal products 22.1 0.0 10.2 1.5 49.6 37.9 Vegetable prod. 23.7 0.0 10.6 17.3 1.8 70.4 Food prod. 24.6 0.0 10.2 13.6 1.3 74.6 Minerals 10.4 0.0 4.5 89.2 6.3 0.0 Fuels 10.2 0.0 0.0 98.3 1.7 0.0 Chemicals 11.1 0.0 13.5 76.5 1.5 7.9 Plastic and rubber 15.7 0.5 3.7 64.8 2.3 28.7 Hide and skins 19.3 0.0 0.0 52.9 1.4 45.7 Wood and paper prod. 21.7 4.2 5.1 27.3 1.8 60.7 textiles and textile prod. 21.9 0.0 0.5 30.0 19.3 50.2 Footwear and headgear 29.1 0.0 0.0 0.0 8.5 91.5 Stone, ceramic, glass prod. 26.1 0.0 0.5 18.8 0.0 80.7 Base metals 16.6 0.0 0.5 54.9 22.8 21.6 Machinery, elect. equip. 13.8 0.3 0.1 72.6 15.9 11.2 Vehicles and transport 15.0 8.2 1.8 49.4 22.4 18.2 Misc. 21.5 0.0 9.8 24.2 10.6 54.1 Source: Estimates based on the CEMAC tariff schedule. 5.25. Additional taxes and fees are assessed on imports into CEMAC that further increase customs charges on imports on top of already high import duties. Some of these charges include a statistical tax of up to 2 percent and taxes to support integration institutions (TCI, CCI, and OHADA taxes) that add up to 1.45 percent. At least in some CEMAC countries, several agricultural goods are still charged a Community Preference Levy (TPC) of 0.4 percent, which elimination should be considered. Excise taxes (ranging from 20 to 50 percent) may apply to certain luxury and durable goods and to beverages and tobacco. And a VAT of 18 percent is also generally applied. 5.26. Eliminating the top tariff band of 30 percent to converge to a tariff schedule with only 4 bands would simplify the tariff regime and lower the average level of tariff protection. This would reduce import prices for consumers. This would also reduce the degree of tariff dispersion that for any given level of average protection create greater distortions and welfare losses. If all items in the 30 percent duty band were to transition to a maximum tariff of 20 percent, the average tariffs in the CEMAC tariff schedule would fall to 14.5 percent and tariff dispersion, measured by the coefficient of variation would, would fall from 53 to 38 percent. Tariff reductions are likely to reduce the tariff revenue in the short run. Yet, Cirera et al (2011) show that its impact on GDP could be positive in the medium run, especially if complementary tax policies and enhanced efficiency in customs tax collection are implemented. Tariff reductions should also be considered for capital goods and intermediates to foster Global Value Chain trade (i.e. import to export). 5.27. Given a series of exceptions and safeguards, the CEMAC countries establish national tariffs that deviate from the CEMAC CET for several hundred tariff lines. These deviations do not tend to significantly impact the average level of tariff protection, with the average MFN rate by most CEMAC
  • 89.
    73 countries roughly around18 percent; yet, the deviation can be significant for certain goods. On a trade- weighted basis, the average rate by the CEMAC countries ranges roughly from 12 to 16 percent, depending on their import structure (Figure 42).45 The fact that the import weighted average rate is lower than the simple average may reflect in part that high tariffs discourage trade. For Cameroon the latest available tariff schedule is for 2014. For the rest of the CEMAC countries tariff schedules are available for 2015. The estimated average tariff for 2015 for the Republic of Congo (11.9 percent) is substantially lower than the CET, and tariffs rates by most HS chapters tended to deviate notably from the CET. This would suggest that the Republic of Congo did not follow the CET during that year. However, no further information to that effect was found and it is possible that the tariff schedule reported to UN agencies for 2015 contains errors.46 Figure 42: MFN duty rates applied by CEMAC countries, 2015 Source: Estimates based on TRAINS and Comtrade. Note: Tariff information for Cameroon is for 2014. For the Republic of Congo, 2015 and 2014 (*) is shown. Data point labels refer to the HS chapter. 5.28. Albeit small on average, there are some significant deviations from the CET related to differing national MFN tariffs. In a perfect customs union, there should not be deviations from the CET. A closer look at the average tariff by HS chapter (Figure 43) shows that the CEMAC countries maintain MFN rates by chapter that are generally consistent with the duty rate levels of the CET. However, Cameroon and the Republic of Congo maintain significantly higher MFN rates than the rate established in the CET for preparations of cereals (HS chapter 19), where the average tariff in Cameroon and the Republic of Congo was 28 percent (versus an average CET for that chapter of close to 19 percent). For the Republic of Congo, tariffs exceed the CET for cereals (HS chapter 10). Notable deviations toward lower tariffs than in the CET include lower duties in Cameroon and Gabon for pharmaceuticals in chapter 30, as well as lower tariffs for tin and tin products in chapter 80 in all countries except for Chad. 45 For CAR, Chad, and Gabon imports are measured using export mirror data. 46 WTO, ITC, and UNCTAD (2017) also calculates an average tariff for Congo for 2015 at 11.9 percent. 0 2 4 6 8 10 12 14 16 18 20 Cameroon* CAR Chad Congo Congo* Gabon Percent Simple average MFN rate Trade-weighted average rate
  • 90.
    74 5.29. Another importantperforation to a common tariff policy refers to preferential rates under trade agreements. While the CET applies on a most-favorable nation (MFN) basis, bilateral preferences with non-CEMAC parties can deviate from the CET. Since 2016, Cameroon has lowered duties on EU imports as part of the interim EPA, as discussed in the previous section, but these bilateral preferences have not been “multi-lateralized” within the community. Thus, Cameroon is extending preferential tariffs to EU products that face higher CET duty rates in other CEMAC countries. Deviations in the effectively applied tariff among CEMAC countries would become more pronounced over time as liberalization staging under trade agreements continues to include goods with the highest tariffs. Figure 43. Deviations from the CET by country and HS chapter, 2015 Source: Estimates based on TRAINS and CEMAC tariff schedule. Note: Tariff information for Cameroon and the Republic of Congo is for 2014. Data point labels refer to HS chapter. 5.30. Implementation of a free trade area within CEMAC has been challenging. As part of the reforms to create the CEMAC customs union, tariffs for intra-CEMAC trade were removed by the late- 1990s. Although only VAT should be assessed to products from other CEMAC countries, according to some sources, duties are still collected in practice. As discussed in Chapter 7 on Regional Barriers to Agriculture Trade, there is also evidence of multiple “petty” harassments or “tracasseries”, a small scale generalized form of corruption that consists in many small informal payments without receipt or cause to public officials including at the border, that increase trade costs. Determining origin for duty-free treatment under the application of rules of origin also seems to be an area of concern.47 Simplifying 47 Certificates of origin for qualification (meeting raw-material or value-added content requirements) are issued by customs authorities where the producer is situated. Reportedly, lack of expertise at these offices can result in certificates that are rejected in other CEMAC countries. 1 2 3 4 5 6 78 910 1112 131415161718 19 202122232425262728293031323334353637 38394041 42 43 4445464748 49 50 51525354555657585960616263646566676869707172737475 76 787980 8182838485868788 89 90 9192 9394 959697 1 2 34 5 6 78 9 10 11 12 1314 15 161718 19 20212223242526272829 30 31 32 3334353637 38 394041424344454647 48 49 50 515253545556575859606162 63646566676869707172737475 7678 7980 8182838485868788 89 90 9192 9394 959697 1 2 3 4 5 6 78 9 10111213141516 17 18 19 2021222324252627282930313233343536 373839404142434445464748 49 50515253545556575859606162636465666768697071727374757678 79 808182838485868788 89 9091929394 959697 1 2 34 5 6 78 9 10 11 12 131415161718 19 202122232425262728293031323334353637 3839404142434445464748 49 50 5152535455565758596061626364656667686970717273 7475 7678 7980 8182838485868788 89 90 9192 9394 959697 1 2 3 4 5 6 78 9 1011 121314 15 16 17 18 19 20212223242526272829 30 31 32 33 343536 37 3839404142434445464748 49 50 5152535455565758596061626364656667686970717273747576 78 7980 8182838485868788 89 90 91929394959697 -5 05 10-5 05 10 0 50 100 0 50 100 0 50 100 CAR Cameroon* Chad Congo* Gabon hs2 Graphs by Country
  • 91.
    75 rules of originprocedures and strengthening capacity to implement the regime would be particularly important going forward to avoid tariff avoidance, given bilateral preferences beyond the CEMAC region.48 Furthermore, community transit trade provisions apparently are not always followed. Non-tariff measures 5.31. Beyond tariffs, a range of non-tariff measures (NTMs) and procedural obstacles to trade are reported for the CEMAC region, with variations by country.49 Many imports are subject to standards (sanitary and phytosanitary (SPS) measures and technical barriers to trade (TBT)) that include certificates of conformity for imported goods. Application of standard measures, however, faces many constraints, including numerous players with unclear roles and overly general regulations, as well as lack of human and financial resources. The CEMAC agreement established a process for the harmonization and mutual recognition of technical measures and procedures and for approval and certification procedures. This process, however, has not advanced in practice and standards regimes tend to differ across CEMAC countries. NTMs related to export measures are not harmonized among the members. Export controls are applied by all countries for certain natural resources (e.g. timber) reportedly for environmental reasons. 5.32. Para-tariffs, price controls, quantity controls, and mandatory inspection are also common and vary by country. Beyond standards, non-tariff measures also include documentation charges that vary across countries and the use of minimum prices in most CEMAC countries, as opposed to transaction value for customs valuation. National regulations may also establish import licenses or approval based on national regulations. Import licenses or prior authorization are required for certain food items in Chad, the Republic of Congo, and Gabon; for pharmaceutical products in the Central African Republic and Cameroon; and for certain manufacturing goods in Chad. Also, while not a CEMAC regulation, inspection measures are mandatory in most CEMAC countries, except Gabon; these measures vary in terms of exemption thresholds and minimum fees (which disproportionally affects small shipments). 5.33. Imports are subject to technical barriers. The main SPS and TBT measures include: labelling or inspection requirements for SPS or TBT purposes; SPS certification requirements; and TBT authorization requirements. Together, these policies affect about half of the tariff schedule. Products principally affected include fish, electrical equipment, plastic products, cotton, man-made fabrics, and paper and paperboard. SPS and TBT measures may, in principle, serve legitimate social purposes (i.e. health and safety), but according to some accounts on their implementation in CEMAC they tend to pose significant trade barriers. 5.34. Transparency of import and export regulations and procedures is lacking in the CEMAC countries and detailed official information is not readily available. Related to this, corruption is often cited as a procedural obstacle to trade in the region both for exports and imports. Provisions in the WTO Trade Facilitation Agreement (TFA) call for increased transparency in this respect via trade information portals. Among the CEMAC countries, Cameroon and Equatorial Guinea (not a party of the WTO) are not 48 This include preferences currently in place and expected over time under the EU-Cameroon EPA. CAR and Chad are part of another regional grouping (CEN-SAD), although an FTA has not yet been implemented. 49 This includes WTO Trade Policy Review documents, as wells as separate concerns in trade documents by the major partners, such as the United States and the EU, and a compilation of alleged barriers by Martinez et al. (2009).
  • 92.
    76 signatories of theTFA. Furthermore, trade portals are a “soft” provisions in the TFA in the sense that they are prescribed as best practices. 50 To date, the most comprehensive collection of NTM information at the product level is provided by a recent effort by international organizations. This has resulted in a consistent database (in terms of data collection and classification) for over 80 countries. Among the CEMAC countries, only Cameroon has been included in the database at this point. 5.35. Based on a recent inventory of official measures affecting imports to Cameroon, about half of the tariff lines and over two-thirds of imports are subject to NTMs. Even though NTMs differ within CEMAC, the data for Cameroon may provide an indication of the prevalence of NTMs in the region (Figure 44). “Core” NTM measures, such as price and quantity controls, that are more disruptive to trade are not particularly high in Cameroon. Quantity control measures are rare and only applied to 6 tariff lines related to gases and diamonds. About 13 percent of imports are subject to price controls that mostly represent customs fees for inspections of animal products. Figure 44. Incidence of import NTMs in Cameroon, 2015 Source: Estimates based on UNCTAD-NTM and Comtrade. D. Conclusions and Policy Recommendations 5.36. CEMAC’s common commercial policy includes two main instruments, the CET and a zero-rate preferential tariff for intra-community trade, both of which have been subject to flaws. During its summit in October 2017 in N’Djamena the Conference of CEMAC Heads of State confirmed the need for improved implementation of the CEMAC trade regime and recommended that states should exercise the greatest caution in applying the CEMAC common commercial policy instruments. 5.37. Some specific recommendations for trade policy in CEMAC are as follows: • Eliminate the top tariff band of 30 percent to converge to a tariff schedule with only 4 bands would simplify the tariff regime and lower the average level of tariff protection. • Tariff reductions should be considered for capital goods and intermediates to foster GVC trade. 50 Trade portals or trade information portals are database systems that collect consolidated information on trade requirements and procedures, including tariff and non-tariff measures (e.g., import licenses, sanitary standards, technical regulations, quotas or prohibitions, etc.), forms and instructions. This facilitate trades by increasing transparency and predictability, which in turn reduces trade costs. 0.0 10.0 20.0 30.0 40.0 50.0 60.0 70.0 80.0 SPS TBT Quantity controls Price controls Any NTM Percent Coverage ratio Frequency ratio
  • 93.
    77 • Improve thetransparency on import and export regulations and procedures and other non-tariff measures in CEMAC countries, including by collecting data in a consistent fashion. • Assess CEMAC countries NTM regimes with the objective to simply, harmonize, and streamline NTMs, including simplifying rules of origin procedure for CEMAC products. • Move to automated approaches to border screening and one-stop border posts. • Consider the reduce and/or elimination of some additional taxes, fees, and informal payments assessed on imports into CEMAC, including “tracasseries”, that further increase customs charges on imports on top of already high import duties.51 5.38. CEMAC countries should consider negotiating the EPA with the EU as a block. An EPA can guarantee market access for CEMAC exports in the future and can also serve as an anchor for policy reform in different areas. In addition, Cameroon has ratified the interim EPA and started liberalizing tariffs on EU products since August 2016, which has been creating tensions with other CEMAC members. It would be important to assess Cameroon experience under the interim EPA, including the potential adjustment costs if there are local firms competing with European imports; the implementation of aid for trade programs; and policy reform in other areas outlined in the interim agreement. Such an assessment could provide valuable lessons for prospective negotiations on the EPA at the CEMAC level. 51 The Chapter on agriculture, provide several recommendations on improving border operations.
  • 94.
    78 Annex Table A.2. Top10 exported products during 2014-2015 Cameroon Central African Republic Chad HS6 Share in total exports Product Description HS6 Share in total exports Product Description HS6 Share in total exports Product Description 1 270900 39% Petroleum oils and oils obtained from bituminous minerals, crude 440349 28% Other tropical wood 270900 89% Petroleum oils and oils obtained from bituminous minerals, crude 2 180100 10% Cocoa beans 870422 17% Other motor vehicles for the transport of good 710812 5% Other unwrought forms of gold 3 440729 6% Tropical wood 870899 15% Other parts and accessories of vehicles 520100 2% Cotton not carded or combed. 4 80300 6% Bananas 440729 13% Other tropical wood 271000 2% Petroleum oils and oils obtained from bituminous minerals other than crude 5 271000 5% Petroleum oils and oils obtained from bituminous minerals other than crude 520100 11% Cotton not carded or combed. 130120 1% Gum Arabic 6 710812 5% Other unwrought forms of gold 440399 3% Other tropical wood 120740 1% Sesamum seeds 7 440399 3% Other tropical wood 930630 1% Other cartridges and parts thereof 970110 0% Paintings drawings and pastels 8 520100 3% Cotton not carded or combed. 261590 1% Tantalum or niobium ores and concentrates 890800 0% Vessels and other floating structures for breaking up 9 760110 3% Aluminium not alloyed 240310 1% Smoking tobacco 880330 0% Other parts of aeroplanes or helicopters 10 440349 3% Other tropical wood 871000 0% Tanks and other armoured fighting vehicles 852520 0% Transmission apparatus Average yearly exports in 2014-2015: 11.3 Billion USD Average yearly exports in 2014-2015: 0.22 Billion USD Average yearly exports in 2014-2015: 5.1 Billion USD
  • 95.
    79 Congo, Republic ofEquatorial Guinea Gabon HS6 Share in total exports Product Description HS6 Share in total exports Product Description HS6 Share in total exports Product Description 1 270900 60% Petroleum oils and oils obtained from bituminous minerals, crude 270900 69% Petroleum oils and oils obtained from bituminous minerals, crude 270900 82% Petroleum oils and oils obtained from bituminous minerals, crude 2 740311 17% Refined copper 271111 22% Liquefied Natural gas 260200 8% Manganese ores and concentrates 3 890520 4% Floating or submersible drilling or production platforms 290511 4% Saturated monohydric alcohols 440799 2% Other tropical wood 4 890190 4% Other vessels for the transport of both persons and goods 271112 2% Liquefied Propane 440729 2% Other tropical wood 5 271000 3% Petroleum oils and oils obtained from bituminous minerals other than crude 440349 1% Other tropical wood 271000 1% Petroleum oils and oils obtained from bituminous minerals other than crude 6 440349 2% Other tropical wood 271113 1% Liquefied Butanes 440839 1% Other tropical wood 7 741999 1% Other articles of copper 440399 1% Other tropical wood 710812 1% Other unwrought forms of gold 8 440729 1% Other tropical wood 880240 0% Aeroplanes and other aircraft 441213 0% Plywood consisting solely of sheets of wood 9 890590 1% Other light-vessels, fire-floats, dredgers, floating cranes, and other vessels 440839 0% Other tropical wood 400122 0% Natural rubber in other forms 10 710812 1% Other unwrought forms of gold 271000 0% Petroleum oils and oils obtained from bituminous minerals other than crude 843143 0% Parts for boring or sinking machinery Average yearly exports in 2014-2015: 19 Billion USD Average yearly exports in 2014-2015: 18 Billion USD Average yearly exports in 2014-2015: 15 Billion USD
  • 96.
    80 Table A.3. Preferenceutilization rates of exports from selected African countries. to the EU by country in 2016 Category Total exports to the EU (1000 euros) Value of exports to the EU eligible for preferences (1000 euros) Value of exports entering the EU under preferences (1000 euros) Share of eligible exports Utilization rate of preferences (I) (II) (III) (IV=II/I) (V=III/II) Ivory Coast Food and Agriculture 3,884,809 1,286,888 1,248,725 0.33 0.97 Petroleum 365,333 6,777 6,775 0.02 1.00 Minerals and metals 5618 1 0 0.00 0.00 Total 4,255,761 1,293,665 1,255,500 0.30 0.97 Ghana Food and Agriculture 1,877,688 738,623 718,746 0.39 0.97 Petroleum 320,422 1,318 0 0.00 0.00 Minerals and metals 343 1 0.01 0.00 0.01 Total 2,198,452 739,943 718,746 0.34 0.97 Nigeria Food and Agriculture 1,039,482 174,354 93,802 0.17 0.54 Petroleum 8,681,794 3,041 0 0.00 0.00 Minerals and metals 1,167,899 32,050 11,637 0.03 0.36 Total 10,889,175 209,445 105,439 0.02 0.50 South Africa Food and Agriculture 19,958,164 8,686,478 6,736,341 0.44 0.78 Petroleum 18,412 12,184 12,095 0.66 0.99 Minerals and metals 1,815,007 14,956 10,201 0.01 0.68
  • 97.
    81 CHAPTER 6: Barriersto Regional Trade in Agriculture A. Introduction52 6.1. The CEMAC region has a vast potential for agriculture production and trade. The oil price shock, prospects for continued low oil prices and depleting oil resources make a compelling case for economic diversification by reviving agriculture. Increased investments in agriculture can be a means to increase regional food security, reduce the food import bill and create jobs for the youth. As of today, agricultural activity in CEMAC is underdeveloped and faces many constraints, including access to land and finance; poor rural infrastructure; informality; limited access to improved inputs; insufficient agricultural advisory services; a high tax and regulatory burden and a high cost of agricultural inputs. Regional agricultural trade in CEMAC also suffers from a lack of standard practices and a lack of harmonization between national policies and CEMAC policies. 6.2. This chapter analyzes agricultural production and trade in the CEMAC region. It first provides a brief overview of the agricultural sector in CEMAC and assess regional trade in agricultural products. Then, drawing in field work obstacles to regional agricultural trade along CEMAC’s main trade corridor are being analyzed. The chapter concludes with policy recommendations that would help CEMAC countries realize their potential for regional agricultural trade. The chapter focuses on regionally-traded commodities that are relevant to poor producers and poor consumers, as such recommendations would be most relevant for inclusive growth. B. Agriculture in CEMAC 6.3. Despite the region’s vast potential for agriculture production and trade, the agriculture sector in CEMAC remains largely underdeveloped. Across the region, agricultural imports represent close to one fifth of the total import bill with Cameroon and Republic of Congo each importing over a billion dollars-worth of agricultural products in 2015. Importantly for the people of CEMAC, the pattern of petroleum dependent development has led to very unequal growth with high poverty rates in all countries, particularly in rural areas. Undernourishment affects a substantial proportion of the CEMAC population which is made worse by political fragility and violence in several countries of the region. 6.4. Agricultural value added as a share of GDP varies widely, from only 2.6 percent of GDP value added in the Equatorial Guinea to 50 percent in Chad. Only two countries derive a significant share of their value added from agriculture, Chad (50 percent) and the Central African Republic (43 percent). In the other countries, the shares of agriculture in GDP are below 20 percent, with Cameroon at 17 percent.53 6.5. Agriculture employs a large share of the population in most CEMAC countries. More than half of the population is employed in agriculture in Cameroon, the Central African Republic and Chad (62 52 This chapter is based on a World Bank (2018c): Breaking Down the Barriers to Regional Agricultural Trade in Central Africa. This report and World Bank (2018c) cooperated closely and shared resources on the cross-border evaluations. These efforts included two field missions in Cameroon and the border areas of the neighboring countries, a data collection exercise in which university students joined trucks carrying agriculture produce from Cameroon to Gabon and Equatorial Guinea, and a perception survey of the different actors engaged in agricultural trade. 53 World Development Indicators (2016).
  • 98.
    82 percent, 72 percentand 77 percent respectively) and 41 percent of people work in agriculture in the Republic of Congo. Agriculture represents a smaller share of employment in Equatorial Guinea (19 percent of employment) and Gabon (16 percent of employment).54 6.6. The region exports a wide variety of agricultural products, with cash crops exported outside CEMAC playing an important role. Cameroon is a strong exporter of cocoa, fruits (pineapples and guavas) and chicken. The Central African Republic mostly exports vegetables to non-CEMAC countries in Africa. The Republic of Congo exports tea and coffee (although with an important yearly fluctuation in coffee exports).55 Regional trade in agriculture 6.7. Despite the political drive for regional integration, recorded intra-regional trade remains low. For CEMAC member states, exports within CEMAC account for only 2.1 percent of total exports, and imports for only 3.9 percent of total imports, according to official statistics. This compares to 15 percent 54 World Development Indicators (2017) 55 UN Comtrade. Box 8. Agriculture in CEMAC suffers from numerous constraints: • Insufficient rural infrastructure and poor access to markets. Agro-pastoral areas are often isolated and the poor quality of rural roads makes access to markets difficult. Rural electrification is also low (e.g. at less than 5% in Cameroon). Access to markets is further impeded by high marketing costs and business procedures that discourage participation by small entrepreneurs. Access to water is also insufficient. In Cameroon, only about 2.8 percent of arable land is under irrigation. • Access to advisory services is insufficient and lacks coordination. The definition of a public policy for advisory services would lead to greater complementarity, synergy and rationalization in the use of resources. • Access to agricultural inputs is limited. Most agricultural inputs (e.g. seeds, fertilizers, animal feed) are imported, usually at high cost (also due to high import tariffs) and at varying quality. The level of access to quality seeds low (less than 5 percent in Cameroon) and so is the use of fertilizers and pesticides. Most CEMAC countries do not have an effective policy and regulatory frameworks for seed development and trade. • Access to mechanization is very limited. Access to mechanization is hindered by: (i) small size of land holdings and a limited land market; (ii) financing difficulties (weak financial standing of farmers, difficulty gaining access to credit); (iii) an environment that makes farming with machines difficult (almost non-existent after-sales service, unorganized market for farm products); and (iv) low level of technical knowledge among machine users. Available data for tractors per 100km2 show low ratios for Cameroon (0.1), CAR (0.1), Chad (0.1) and ROC (2.9), compared to low income countries (6.7) and the Sub-Saharan average, excluding high income countries (14.4). • Access to finance is low and not adapted to farmers’ needs. Loan volumes are small and are essentially short- term loans to meet working capital needs. Access to medium term financing remains one of the major constraints for the development of farms. Common constraints to the development of financial services for farmers and agricultural SMEs are: (i) agricultural cooperatives and SMEs do not fulfil the requirements of financial institutions notably in terms of collateral; (ii) financial institutions lack long-term resources to finance long-term investments; (iii) financial institutions lack information and know-how about agriculture finance and regard the agriculture sector as disorganized and undeveloped; and (iv) the rural presence of formal financial institutions is low. Over the past five years, agricultural credit in Cameroon has never exceeded 8 percent of the total volume of credit, while in ROC, bank credit to agriculture accounts for 6 percent of short-term and 17 percent of the medium-term credit. Box 10. Unrecorded and informal trade in agricultural products is widespread.Box 11. Agriculture in CEMAC suffers from numerous constraints: • Insufficient rural infrastructure and poor access to markets. Agro-pastoral areas are often isolated and the poor quality of rural roads makes access to markets difficult. Rural electrification is also low (e.g. at less than 5% in Cameroon). Access to markets is further impeded by high marketing costs and business procedures that discourage participation by small entrepreneurs. Access to water is also insufficient. In Cameroon, only about 2.8 percent of arable land is under irrigation. Access to markets is often impeded by high marketing costs and business procedures that discourage participation by small entrepreneurs. • Access to advisory services is insufficient and lacks coordination. The definition of a public policy for advisory services would lead to greater complementarity, synergy and rationalization in the use of resources.
  • 99.
    83 of exports and11.5 percent of imports in 2010 for the UEMOA trade community. Explanations for this low regional trade integration include the preponderance of oil in the region’s export basket, the weakness of manufacturing sector in these countries and the more informal nature of intra-regional trade, which means that inter-CEMAC trade is less likely to be recorded in official statistics.56 6.8. CEMAC demand for agricultural products is increasingly being met from outside the region (Table 19). In all the member states of the Community, more than 95 percent of agricultural exports went to the third countries (ROW - rest of the world) in 2015 and more than 75 percent of recorded agricultural imports came from the ROW. According to official statistics, agricultural exports have remained rather constant between 2004 and 2015, ranging between US$1,395mn in 2006 to US$2,324mn in 2009, before decreasing to US$2,047mn in 2015, while imports have increased by 174 percent from 2004 (US$1,471mn) to 2015 (US$4,033mn). This suggests that the increase in demand for agricultural products was met mostly by the ROW. Indeed, agricultural imports from the ROW increased by 179 percent between 2004 and 2015, compared to an increase of imports from CEMAC countries of only 41 percent. Table 19: Recorded agricultural exports by destination (%) Source: UN COMTRADE 6.9. According to formal trade data, Cameroon is the leading exporter of agricultural goods within CEMAC (US$13mn in 2015). The main exports according to these data are: milled rice, soups and broths, mineral water and other preparations. Congo exported US$2mn worth of agricultural products to CEMAC in 2015, mostly sugar cane and its derivatives. The other countries of the CEMAC region, the Central African Republic, Chad, Equatorial Guinea and Gabon exported less than US$1mn worth of agricultural products to their CEMAC partners. 6.10. Cameroon’s importance for food production in CEMAC has also increased in terms of value and share in the region. In correlation with the production gains, Cameroon has also constantly increased the value of its net food production, which accounts for almost two thirds of CEMAC’s total, as shown in Figure 45. Apart from livestock, Cameroon has the highest production value levels per capita for all the different food sub-sectors, including for cereals on par with Chad. 56 Trade in agriculture in the region is governed by the instruments establishing the UEAC, which provide for a common market for agricultural products through several measures: (i) the removal of domestic customs duty and non-tariff barriers; (ii) the establishment of a common policy towards third-party countries; (iii) the establishment of a competition policies, notably regarding state aid; (iv) the implementation of the principle of the free movement of people, services and capital; (v) the harmonization and recognition of technical standards and certification procedures. Country Region 2004 2005 2006 2007 2008 2009 2010 2011 2012 2013 2014 2015 CAF CEMAC 0.2 4.6 3.0 6.2 2.4 3.8 0.1 1.7 CAF ROW 99.8 100.0 100.0 95.4 97.0 93.8 97.6 96.2 100.0 99.9 100.0 98.3 CMR CEMAC 1.9 2.8 1.9 3.2 3.3 1.8 1.0 0.7 0.7 0.5 0.8 0.7 CMR ROW 98.1 97.2 98.1 96.8 96.7 98.2 99.0 99.3 99.3 99.5 99.2 99.3 COG CEMAC 16.7 28.4 28.0 14.2 28.3 22.0 0.7 1.0 0.2 2.9 3.9 COG ROW 83.3 71.6 72.0 85.8 71.7 78.0 99.3 99.0 100.0 99.8 97.1 96.1 GAB CEMAC 8.6 8.8 12.4 39.5 64.7 79.4 90.5 69.2 68.8 58.1 9.6 4.4 GAB ROW 91.4 91.2 87.6 60.5 35.3 20.6 9.5 30.8 31.2 41.9 90.4 95.6 GNQ CEMAC 0.7 0.0 0.1 0.8 0.9 0.7 0.1 0.0 0.0 8.3 9.9 0.3 GNQ ROW 99.3 100.0 99.9 99.2 99.1 99.3 99.9 100.0 100.0 91.7 90.1 99.7 TCD CEMAC 1.3 0.0 0.1 0.2 0.1 0.1 1.9 1.1 0.7 0.5 0.0 1.4 TCD ROW 98.7 100.0 99.9 99.8 99.9 99.9 98.1 98.9 99.3 99.5 100.0 98.6
  • 100.
    84 6.11. Cameroon’s agriculturalproduction performance is made possible by a wide range of agro- ecological zones, allowing the cultivation of 14 major crops, the most diverse in CEMAC. Cameroon has five major agro-ecological zones: the inland equatorial forest; the maritime equatorial forest; the highland tropical, Guinea-savannah, and Sudan-savannah. This subset of zones represents a majority of the agro-ecological zones within which small-scale food production is done in sub-Saharan Africa. In comparison, the climate conditions in the other CEMAC countries make it difficult to cultivate a wide range of food crops: in the more humid countries in the south (Gabon, Equatorial Guinea and Congo) dry cereals production is limited (Central African Republic is in a similar situation), while for Chad in the north fruit and vegetable production is difficult. Figure 45. Net Food Production Value (constant 2004-2006 $) Source: FAOStat Regional food security 6.12. About 45 percent of CEMAC’s population suffers from undernourishment and, of these, 10 percent suffer from an extreme food deficit57 . Insufficient trade integration reduces the overall accessibility of food in the region, leading to even higher imports from the rest of the world. Undernourishment is most prevalent in the Central African Republic and Chad, where a respective 58.6 percent and 32.5 percent of people are malnourished, but is rather low in Gabon and Cameroon. Child stunting is more homogenously prevalent across the Community, ranging from 17.5 percent of stunting in Gabon to 40.7 percent of stunting in the Central African Republic. Obesity affects only small proportions of the population in CEMAC, with the exceptions of Equatorial Guinea and Gabon, where the reliance on imported processed food leads to obesity rates higher than 13 percent (see Table 20). 57 Less than 300 calories per person per day. 56% 57% 58% 58% 61% 57% 62% 58% 60% 61% 13% 13% 13% 13% 13% 11% 12% 11% 11% 10% 22% 20% 20% 20% 18% 24% 18% 24% 21% 22% 5% 5% 5% 5% 6% 5% 5% 5% 5% 4% 4% 3% 3% 3% 3% 3% 3% 3% 3% 2% 0 1 2 3 4 5 6 7 8 9 10 2005 2006 2007 2008 2009 2010 2011 2012 2013 2014 Billions Cameroon Central African Republic Chad Congo Equatorial Guinea Gabon
  • 101.
    85 Table 20. KeyFood Security and Nutrition Indicators in CEMAC Source: FAO, The State of Food Security and Nutrition in the World 2017. C. Bottlenecks to agricultural trade Transport 6.13. Poor quality transport infrastructure and the associated costs are an important bottleneck for producers and traders of agricultural products. Despite the gains in productivity and exports to the CEMAC region, the transport infrastructure has not improved and transport costs have increased in recent years, both for short and long-distance legs. Producers have the typical options of hiring a transporter for their goods, as even large producers do not seem to own their own trucks. Depending on the size of the production and the marketing mechanism, producers can choose from transport by motorcycle, small car, larger car (pick-up), small and medium sized trucks. Road access to the field is often too difficult for trucks larger than 10-12 tons, although this would represent the typical load for export and for larger producers or those organized for grouped sales. Survey results confirm that a third of respondents complaining about the difficulties to bring their agricultural products to the immediate market. 6.14. The costs of evacuating agricultural commodities from the field to the nearest market often accounts for most of the production cost. For example, data collected in the production areas around Bafoussam in the Western region of Cameroon indicate that short distance transport costs (up to 25 km, from field to immediate market or buyer) can amount from: 0.51 US$/ton/km (the example of a 10-ton truck transporting production of 4 hectares of maize for 20 km at a cost of 15,000 XAF (28.3 US$) per hectare) to 0.63 US$/ton/km (the example of a 3-tonne pick-up truck transporting tomatoes at a cost of 25,000 XAF (47.2 US$) per trip of 25 km) to 0.91 US$/ton/km (the example of a car transporting 1 ton of mixed load at a cost of 12,000 XAF (22.6 US$) per trip of 25 km). This range of short distance costs represent between 4 and 8 times higher costs per ton/km when compared with long distance transport from the literature on transport costs in Sub-Saharan Africa.58 Compared with production costs, short distance transport represents between 15 percent and 25 percent of the total, depending on load size and perishable nature. In addition, producers are also increasingly complaining about the insufficient number of available vehicles, which has increased costs in recent years. 6.15. Similarly, transporting agricultural products from production area markets to consumption centers within Cameroon and in CEMAC is costly. Long distance transport of agricultural products is generally done with larger trucks of 12 tons or more, depending on destination. As an illustration, for 58 See Teravaninthorn, S. and Raballand, G. (2009): Le prix et le coût du transport en Afrique. 2004-06 2014-16 2014-16 2016 2005 2016 2005 2016 2005 2014 2005 2016 2005 2015 Equatorial Guinea na na na 3.1 35 26.2 8.3 9.7 8.2 13.3 48 43.7 na 7.4 Gabon 9.7 7 3.4 na 17.5 na 7.7 10.5 13.6 57.8 59.1 na 6 Cameroon 20.2 7.9 27.6 5.2 35.4 31.7 8.7 6.7 5.6 8.6 45.3 41.4 23.5 28.2 CAR 39.9 58.6 7.1 45.1 40.7 8.5 1.8 2.6 4.1 49 46 23.1 34.3 Chad 39.2 32.5 na 13 44.8 39.9 4.4 2.5 3.2 5.5 51.1 47.7 2.0 0.3 Congo 33.4 28.2 8.2 31.2 21.2 8.5 5.9 5.4 8.2 57.9 51.9 19.1 32.9 Prevalence of Anaemia among Women of Reproductive Age (15-49 years, %) Prevalence of Exclusive Breatfeeding among Infants (0- 5 months, %) Prevalance of Undernourishment in the Total Population (%) Prevalance of Severe Food Insecurity in the Total Population (%) Prevalence of Wasting in Children (<5 years, %) Prevalence of Stunting in Children (<5 years, %) Prevalence of Overweight in Children (<5 years, %) Prevalence of Obesity in the Adult Population (>18 years, %)
  • 102.
    86 the Western regionof Cameroon, the transport on the first leg of transboundary corridors from Foumbot to Yaoundé (270 km) and to Douala (300 km) usually cost between 150,000 XAF (US$283) and 250,000 XAF (US$471.7), respectively, and trips take 7 to 8 hours. The 260-km trip from Yaoundé to the southern border markets like Abang Minko costs on average 210,000 XAF (US$377.4), with a similar duration of 7 hours. Within Cameroon, on this route, the resulting average cost per ton/km for long distance transport is $0.12, in line with other estimates in the literature (for example, along the Douala - N'Djamena corridor, the transport cost per ton/km is also estimated at US$0.12, while for Douala - Bangui at US$0.17/ton/km). 6.16. Both short and long-distance transport result in significant losses due to the poor condition of the infrastructure. Particularly for perishable goods, poor road condition coupled with the often over- loading of trucks lead to important losses or product damage. In addition, the over-fragmentation of transport from production to consumption increases these risks, as products are shifted from various means of transportation and in different configuration. For example, a basket of tomatoes or bag of avocadoes would first be transported from field to the immediate market by motorcycle or small pick- up, unloaded and then loaded into a 12 to 20-ton truck that may stop for unloading in Yaoundé or Douala before continuing to one of the border markets in the south, where the load would be broken down to be carried by car by small and medium Gabonese traders, who would wholesale in Libreville to retailers who might then repack and transport the cargo for final sale. Data on the losses along the entire chain are not available, given the multitude of actors involved, but information from one of the urban markets in Douala indicate that for the Foumbot-Douala leg only, losses for a truck of tomatoes would be roughly 8 percent (20 baskets from a total load of 250 baskets). In addition, another 20 percent of the load (50 out of 250 baskets) would be damaged and would sell for a lower price. Similarly, for livestock, transporters indicated that between one and four animals die on a regular trip from production area to urban market. 6.17. For long distance traffic, the agricultural cargo losses are exacerbated by theft. Transporters report constant theft issues, particularly in the case of smaller trucks on the Foumbot to Douala and Yaoundé routes. Data collected during the field visits indicates that 3 out of 10 trucks are subject to theft on a typical domestic trip from production to an urban center (a 250-km leg), with losses estimated at 8-10 baskets for perishable goods like tomatoes or 1-2 bags for dry goods. Based on the typical volume, theft losses are approximately 1 percent, a conservative estimate given that transporters also report that products are removed from their cargo at the various checkpoints along the trip and during technical stops for urgent truck maintenance. 6.18. In addition to road toll payments, transporters also pay several types of access fees along the corridors. In the production areas in the Western Region, most local authorities charge access fees (droit de circulation) for trucks coming to load agricultural products, regardless of whether they pick up the goods from the field or from a market. For example, at the Foumbot market, the fees range are 550 XAF (US$1) for 7-ton truck, 1000 XAF (US$1.9) for a 10-ton truck, 1,500 XAF (US$2.8) for a 15-ton truck, 3,000 XAF (US$5.7) for a 20-ton truck and 5,000 XAF (US$9.4) for a 26-ton truck. Intermediaries 6.19. The high number of intermediaries increases the transaction costs for agricultural trade. Insufficient commercial linkages and marketing bottlenecks lead to many intermediaries along the
  • 103.
    87 main channels. Thereare six major blocks in a typical agricultural trade corridor (farm/field, immediate market, collection market, urban markets, border market and finally the foreign market) and various degrees of intermediation, depending on available commercial linkages and information, market infrastructure, size of actors, power of negotiation and availability of buyers. At the producing end, farmers sometimes have the option of directly selling their output to large urban and foreign buyers, local intermediaries (buyam sellam) or transport themselves the goods to a larger market (urban or border). Otherwise, the immediate outlets for agricultural products are the rural market, mostly organized weekly, at the intersection of multiple villages and production basins, usually no further than 25 km from the farm. In these immediate markets, the producers have the possibility to sell their goods directly (retail for localized consumption) or sell to an intermediary, who groups production for large, mostly Cameroonian buyers that pass with their trucks through the small rural markets. The next level, the collection market, is used for greater transactions: larger producers sell their goods – through intermediaries – to the foreign and Cameroonian buyers, who continue from this market directly to the border or Yaoundé/Douala. Border markets are often used as an intermediary point to fragment large consignments of agricultural goods for medium-sized buyers, who cross the border as intermediaries between the wholesale and retail phases. For goods that do not pass through border markets, the end- point is the wholesale-to-retail urban markets in the capitals and large cities of neighboring CEMAC countries. Price uncertainty 6.20. Higher than expected price volatility leads to unpredictable returns. Producers and a significant number of other market actors identified price volatility as a major impediment to agricultural production and trade. 85 percent of producers interviewed believe that prices they receive for their agricultural products are neither fair nor predicable. On the supply side, one major determinant for price volatility is over-production at certain times, due to producers’ reactions to past price peaks in a certain month and to relatively high demand in recent years, including from other CEMAC countries. On the demand side, prices fluctuate significantly depending on the presence of foreign buyers from Nigeria, Equatorial Guinea and Gabon on the Cameroonian market, which can sometimes be affected by political concerns (i.e. the recent coup attempt and related border closing between Equatorial Guinea and Gabon).59 Price uncertainty is exacerbated by lack of a market information system for disseminating prices, coupled with insufficient awareness.60 Poor market management 6.21. Poor market management and market infrastructure hamper commercial linkages. Particularly in the important production basin around Bafoussam in the Western region of Cameroon, the market facilities are insufficient for the size and type of agricultural trade currently practiced. Larger, urban markets are in no better position when it comes to infrastructure and management. Scarce market infrastructure, especially storage facilities, seem to be captured by local elites and intermediaries. In addition, market fee collection does not seem to be systematic and the collected funds are not 59 Producers interviewed during field visits universally praised the presence of foreign traders, but their presence is neither constant nor predictable which adds to price volatility. In some locations, daily price fluctuations depend on the arrival time of foreign buyers. 60 Limited available price information can be counter-productive as producers may respond to past price peaks with over-production, pushing price lower.
  • 104.
    88 earmarked for marketmaintenance or development. Except for the Foumbot market, no receipts seemed to be issued for the paid fees, which were collected on behalf of the local public authority (town hall, municipality or local chieftain). In the absence of an official market management, traders organize themselves in collective interest groups to ensure that basic functions like cleaning and security are set- up, at a separate cost to the market participants. Petty harassments (“tracasseries”) 6.22. Throughout the CEMAC region valid trade functions are currently not exercised as such and have, de facto, become “tracasseries”. These petty harassments are a major problem and significant driver of cost within Cameroon, at the border, and in the neighboring CEMAC countries. These harassments are a generalized form of corruption consisting of many small payments without receipt or cause to public officials, particularly to the police, army/gendarmerie, weighbridge officials, road traffic and prevention officers, and other local authorities. Field discussions demonstrate a universal recognition among agriculture traders and transporters that regardless of whether all paperwork and cargo are in order, payments are still required. Without these payments, public agents will simply delay the truck until a payment is made. The most often cited example, which was also highlighted in the March 2018 transporter’s strike, is that weigh stations are uncalibrated so produce different results at each stop requiring a “corrective” payment without a receipt. 6.23. While each payment may seem small, tracasseries are major cost to the regional economy. Based on data collected, petty harassment increases the cost of transporting agriculture commodities between Foumbot and Douala by 25% or US$ 0.03 per ton per kilometer. In other countries, transporters say the cost is even greater. In Equatorial Guinea first hand reports suggest that tracasseries add US$ 0.06 per ton per kilometer (US$ 15 per ton from the Cameroon border to Bata), while in Gabon the cost is even higher at US$ 0.30 per ton per kilometer (US$ 135 per ton from the Cameroon border to Libreville). 6.24. More than directly undermining regional agriculture competitiveness, tracasseries impose many other costs on the broader economy. By failing to adequately control vehicle weight limits, for instance, roads deteriorate more quickly leading to higher maintenance costs for roads and vehicles alike. Indeed, the present system arguably encourages overloading since transporters know they must pay a bribe regardless of actual vehicle weight. Inadequate application of sanitary and phytosanitary (SPS) measures is also a major economic concern. Genuine threats to animal and plant health and food safety do arise during agriculture trade that can have devastating effects on entire populations and agriculture ecosystems. Managing these risks effectively requires well-functioning, professional systems and cannot be achieved simply through the collection of fees or selling of SPS permits. Trading agricultural commodities in CEMAC 6.25. Limited clarity, consistency and transparency in border clearance requirements are further a vector for corruption and lead to a multitude of formal and informal border costs. Tariffs and procedural requirements are typically established on paper, yet not necessarily available at border level for traders and travelers who wish to consult them - formalities (and related costs) can also vary from one site to another and frequently involve a margin of discretion related to the individual judgment of the official on duty. The enforcement of CEMAC provisions also appears irregular at best, despite users
  • 105.
    89 (including both borderofficials and traders) often being aware of them. Trading/security conditions and governance levels affect the likelihood that CEMAC provisions will be enforced. 6.26. Actual trading costs at the surveyed locations are consistently higher than official listed tariffs. Real costs are often not aligned with official tariff lists, and frequently include many unofficial cost items such as mandatory informal payments extorted by certain authorities, both at border level and along the roads leading to main consumption areas. As an illustration, Table 1 in the Annex compares actual trade costs as reported by traders at the Abang-Minko/ Eboro border between Cameroon and Gabon with official fees based on information provided by authorities. 6.27. Traders’ responses to informality and tracasseries lead to a vicious circle of further informal practices. Often the payments (formal and informal) are determined by size of consignment, which in turn is estimated by number of bags, traders are now often overloading bags with the help of existing market. Also, the loads of trucks are often disguised, with higher taxed commodities hidden at the center and surrounded by lower value commodities. In addition, as smaller consignments in cars or on motorcycles are rarely checked and taxed – formally and informally – proportionally less, at various border posts it is common to “decompose” a large truck’s load into small batches of 2-3 bags per motorcycle, which then crosses the border with less hassle, only to “re-compose” the cargo into a different truck on the other side. Ethnic ties can play a key role in informal trade, often avoiding official scrutiny. Overall, informal practices are causing higher risk-taking for border users. 6.28. Unrecorded and informal trade in agricultural products is widespread. Understanding, regulating and improving agricultural trade in the CEMAC area is complicated by the inaccurate trade statistics that miss the large portion of unrecorded and informal flows.61 Between Cameroon and Gabon and Equatorial Guinea most actual border crossings take place through the formal check points rather than unchartered routes. Nevertheless, official records of the trade flows are not matching the reality. Between Cameroon and Central African Republic, at Garoua-Boulai, growing insecurity and instability in CAR have recently led to the introduction of a mandatory military convoy for all trucks in transit, thus eliminating any possibility of diversion from the formal crossing channel. Between Cameroon and Chad, the length of the border and the geography of the region (clear landscapes with small minimal shrub vegetation and the easily passable Logone River) make it easy to cross the border through non- designated areas, particularly in the dry season when even medium sized trucks can cross through the bush. Overall, official statistics miss both the typology of traded agricultural products, as well as the volumes, often larger than those officially recorded (see Box 9). 61 Nkendah (2010, 2013), Amin and Hoppe (2013), and World Bank (2013) indicate that most regional agriculture trade in CEMAC takes place through informal channels and is not recorded in official trade statistics.
  • 106.
    90 6.29. Adding tothe high trade costs and cumbersome procedures, the security situation in the region and the frequent political crises are further impacting agricultural trade by increasing losses, risks taken by traders and informality. In the northern parts of Cameroon (and to some degree in the Adamaoua region in the middle section of Cameroon), the Boko Haram-induced security risks has reduced exchange flows between Cameroon and Nigeria, as well as less livestock transit from Chad into Nigeria. In addition, the Douala-N’Djamena corridor has also been disrupted because of the risk of attacks on the last segment of about 240km between Mora and the border with Chad at Kousseri. As a result, traffic has been re-directed to cross through Touboro into southern Chad and continue through Moundou up to N’Djamena adding hours to the total journey. The number of cross-border livestock theft incidents in Cameroon has also increased on both Nigerian and Chadian sides, limiting the usual cross-border transactions and momentarily fluctuating livestock prices. The recent closure of the Cameroon–Equatorial Guinea border resulted in the re-channeling of trade through unofficial, rural routes. Chapter 7 on Political Economy Considerations for Regional Integration puts the often-volatile security situation and the impact on regional integration in CEMAC in a broader context. Final consumer prices in CEMAC reflect the costly and burdensome trade processes 6.30. Domestic, border and foreign factors contribute to increased costs of trading agricultural products, which in turn result in higher final consumer prices, while squeezing the margins of producers. An overall price build-up analysis indicates that intermediation costs (along the corridor, at the terminal market and including market access costs) are the most important cost driver, accounting Box 9. Unrecorded and informal trade in agricultural products is widespread. Formal trade data do not match trade flows recorded at border-crossing. Field visits indicate a significant discrepancy between formal and informal trade data. As such, official trade data more often reflect the ease of recording data rather than actual trade flows. According to UN Comtrade data, Gabon’s main imports from CEMAC are palm oil (US$3.3 million), soups, broths and preparations ($3.1 million), chocolate (US$2.8 million), milk and cream in solid forms (US$2.4 million) and chewing gum (US$1 million). The reality as recorded at the main borders posts between the two countries is indicating significant unreported trade. For example, the estimated value of plantain imported in 2017 at Abang-Minko/Eboro border post alone is US$6.5 million. Official trade data for the Central African Republic indicate that the main imports from the other CEMAC countries are frozen sardines (US$1.9 million), soups, broths and preparations (US$1.6 million), mineral waters (US$1.5 million), milk and cream in solid forms (US$0.6 million) and chewing gum (US$0.3 million). In reality, trade flows at Garoua-Boulai appear to mostly feature long-distance, heavy trucks (25-40 ton) transporting a variety of commodities from Cameroon and other third countries to CAR. These include CEMAC-originated items from Cameroon such as onion (from Garoua/Maroua), garlic, and groundnuts, as well as goods arriving from third countries including rice (from Asia), flour (from Europe), and sugar (from Brazil), along with beverages, biscuits and other processed items. Information on volumes was not available during the field visit. According to official data, Chad’s main imports from CEMAC are sauces and sauce preparations (US$8.1 million), semi-milled or wholly milled rice (US$ 4.6 million), sweet biscuits (US$2.7 million), sugar confectionery (US$2.4 million) and soups, broths and preparations (US$2.1 million). Data obtained during field work on agricultural goods traded at Kousseri/N’Djamena border crossing indicate food maize, plantain, potato, onion, avocado and tomatoes (as exports from Cameroon) and cattle (as imports to Cameroon) are much more likely to be the main trade items. Box 12. Simulations of removal or tracasseries on intra- regional trade and growth in CEMACBox 13. Unrecorded and informal trade in agricultural products is widespread. Formal trade data do not match trade flows recorded at border-crossing. Field visits indicate a significant discrepancy between formal and informal trade data. As such, official trade data more often reflect the ease of recording data rather than actual trade flows. According to UN Comtrade data, Gabon’s main imports from CEMAC are palm oil (US$3.3 million), soups, broths and preparations ($3.1 million), chocolate (US$2.8 million), milk and cream in solid forms (US$2.4 million) and chewing gum (US$1 million). The reality as recorded at the main borders posts between the two countries is indicating significant unreported trade. For example, the estimated value of plantain imported in 2017 at Abang-Minko/Eboro border post alone is US$6.5 million. Official trade data for the Central African Republic indicate that the main imports from the other CEMAC countries are frozen sardines (US$1.9 million), soups, broths and preparations (US$1.6 million), mineral waters (US$1.5 million), milk and cream in solid forms (US$0.6 million) and chewing gum (US$0.3 million). In reality, trade flows at Garoua-Boulai appear to mostly feature long-distance, heavy trucks (25-40 ton) transporting a variety of commodities from Cameroon and other third countries to CAR. These include CEMAC-originated items from Cameroon such as onion (from Garoua/Maroua), garlic, and groundnuts, as well as goods arriving from third countries including rice (from Asia), flour (from Europe), and sugar (from Brazil), along with beverages, biscuits and other processed items. Information on volumes was not available during the field visit. According to official data, Chad’s main imports from CEMAC are sauces and sauce preparations (US$8.1
  • 107.
    91 for 42 percentof the total (as the figure below summarizes). Transport costs and petty harassment account for about a third of the total, while production costs are almost 20 percent. Border crossing costs on their own are roughly 7 percent, while the producer’s margin is only 3 percent. Table 21. Price build-up for selected commodities on the Cameroon to Gabon corridor (% of final consumer prices)
  • 108.
    92 Box 10. Simulationsof removal of tracasseries on intra- regional trade and growth in CEMAC Djiofack (2018) uses ENVISAGE, a dynamic global CGE model developed by the World Bank, to assess the removal of petty harassments (tracasseries) related trade costs on trade and growth in CEMAC. Two policy scenarios are being considered: • Scenario 1 assumes that only Cameroon removes tracasseries and this results in a 14 percent price reduction for agriculture and manufacturing products imported from Cameroon in 2018. • Scenario 2 assumes that all CEMAC countries implement reforms to reduce petty harassment affecting intra-regional trade. Scenario 2 simulates a 14% reduction on all agriculture and manufacturing products trade among all CEMAC countries. Scenario 1: The removal of tracasseries increases demand for Cameroonian exports in other CEMAC countries. Relative to the baseline and by 2030, Cameroon’s exports to CEMAC increase by about 23 percent. The impact is also positive for growth, albeit small (0.32 percentage points above the baseline). This is largely due to the small scale of formal intra-regional trade in CEMAC; given the importance of unrecorded trade, the actual growth impact may be larger. Scenario 2: A CEMAC-wide removal of tracasseries costs brings significant gains in intra-regional trade for all countries. Relative to the baseline, intra-regional exports increase by about 25 percent by 2030 and gains in terms of GDP range from around 0.34 percent increase in Cameroon to almost 1 percent in the Republic of Congo (see Figures 1 and 2). Figure 1: Impact on Exports (% increase over base line) Figure 2: Impact on Growth (percentage point increase over base line) Source: Djifack (2018) Methodology: ENVISAGE is a recursive dynamic CGE model that has been successfully applied in numerous countries. This approach links a sequence of static equilibriums with a set of equations, which update, at every period, certain macroeconomic variables such as population, productivity and the capital stock. The model is based on the GTAP 9 database, which contains a consistent set of Social Accounting Matrices (SAM) for 141 regions; it is the standard database for global CGE models. However, the version of the ENVISAGE considered for this study has been aggregated to incorporate 11 regions of interest for the study including: Cameroon, Central African Republic, Chad, Congo, Gabon, Rest of Central Africa, United States of America, EU and EFTA, China, Rest of Africa, and the rest of the world (ROW). Sectors were also aggregated to reflect the most important products traded between central African Economies. Tracasserie-related costs are modelled as a traditional “iceberg effect”: transportation is treated as a source of exogenous friction that is fixed and proportional to the value shipped. The evaluation period is 2015-2030. Box 14. Exchange rate regime and economic outcomes for the CFA zone – a brief review of the literature.Box 15. Simulations of removal or tracasseries on intra- regional trade and growth in CEMAC 20.5 26 23.9 24.6 23.7 Cameroon CAR Chad Gabon ROC 0.34 0.48 0.54 0.72 0.98 Cameroon CAR Chad Gabon ROC
  • 109.
    93 D. Conclusions andpolicy recommendations 6.31. Factors restricting agricultural trade in the CEMAC area are multiple, inter-related and costly. While many bottlenecks are national in nature and covered in detail in World Bank (2018c), this section highlights scope for regional intervention at the CEMAC level, particularly with regards to the harmonization of procedures and regulations along regional trade corridors. 6.32. At a general policy level, regional agricultural trade in CEMAC suffers from a lack of standard practices and a lack of harmonization between national policies and CEMAC policies. Within Cameroon, for example, there is no single set of regulations governing agricultural trade with the CEMAC neighbors. Official regulations were also often found to clash with border practices. Recommendations to address this include the following: • Advisory and policy support for national governments, particularly the Customs Authority and the Ministry of Trade, to establish a single and coherent set of regulations and to develop capacity and oversight necessary to consistently apply these. • Reducing border taxes that act as non-tariff barriers, even if export tariffs are or will be soon removed. • Establishing a regional dialogue on sanitary and phytosanitary (SPS) declaration requirements. There is little/no purpose in charging for certification when the importer has no declaration requirements. Furthermore, understanding the current scope of animal and plant diseases in CEMAC is necessary to identify appropriate, targeted risk-based mitigation measures; risks of contamination will grow more important with deepening regional integration. • At the CEMAC level, establishing a trade regime for agricultural products that all governments can adhere to. The primary political economy obstacle seems to be revenue generation or re- distribution from border activities. Experience from other trade blocs, including the EU, may be relevant as to how best to decrease dependency on border taxes. 6.33. Along transport corridors, efforts to eliminate petty harassment could reduce trade costs by an estimated 14 percent and bring multiple benefits. Simulations show that a reduction of unofficial fees related to bribes and corruption for goods transported along CEMAC’s trade corridors would increase intra-regional trade by about 25 percent and add between 1 to 2 percent to the growth rate of CEMAC countries. While reducing the number of checkpoints along the corridors as well as enforcing anti-corruption measures would fall under the national policy domain, development and promotion of CEMAC-wide ‘traders’ charter’ that details the rights and obligations of trade corridor users could incentivize traders to adhere to existing regulations (e.g. not over-charging vehicles, ensuring necessary paperwork is in order, refusing to turn a fine into a bribe), while setting standards and expectations for border agencies. 6.34. At the border, there are opportunities to facilitate agricultural trade by improving management, collecting better information, and investing in infrastructure. The current proliferation of border agencies significantly increases the delays, costs and corruption, without adding much value to the trading process. There is scope to consolidate agencies (some agencies could in theory form joint units or be present only on the more concerned side of the border) and enhance inter-agency coordination. At the regional level, establishing joint, international border committees to coordinate
  • 110.
    94 functions and regularizeprocedures across countries would be necessary; national Customs could act as lead agencies.
  • 111.
    95 Annex Table A.1. Officialand actual cost of clearing a truck at Abang-Minko/Eboro border between Cameroon and Gabon Official Cost Actual Cost Variance Official Cost Actual Cost Variance Official Cost Actual Cost Variance Police - 5,000 5,000 - 5,000 5,000 - 5,000 5,000 Army - 2,000 2,000 2,000 2,000 2,000 2,000 Immigration - 2,000 2,000 - 2,000 2,000 - 2,000 2,000 Town Hall ? 2,000 2,000 ? 2,000 2,000 ? 2,000 2,000 Assemblée ? 1,000 1,000 ? 1,000 1,000 ? 1,000 1,000 Loading Fee Town Hall ? 1,000 1,000 ? 2,000 2,000 ? 5,000 5,000 Customs Exit Fee Customs 2% 10,000 n/a 2% 15,000 n/a 2% 15,000 n/a Phytosanitary Phyto Police 5,100 5,000 (100) 8,500 10,000 1,500 8,500 10,000 1,500 LVO fee BGFT 5,000 5,000 - 10,000 10,000 - 15,000 10,000 (5,000) Police ? ? ? ? ? ? - 2,000 2,000 Army ? ? ? ? ? ? - 2,000 2,000 Overtime Fee Customs ? 5,000 5,000 ? 5,000 5,000 ? 15,000 15,000 Phyto Inspection AGASA 10,000 5,000 (5,000) 20,000 25,000 5,000 30,000 50,000 20,000 Identification note fee CGC 10,000 5,000 (5,000) 10,000 10,000 - 10,000 25,000 15,000 Certificate of authorization for consumption (issue fee) DGCC ? 5,000 5,000 16,800 25,000 8,200 48,000 48,000 - Town hall ? 2,500 2,500 ? 5,000 5,000 ? 10,000 10,000 Assembleé ? 5,000 5,000 ? 5,000 5,000 ? 15,000 15,000 Army - 5,000 5,000 - 5,000 5,000 - 5,000 5,000 Police - 5,000 5,000 - 5,000 5,000 - 10,000 10,000 Total per vehicle (XAF) 30,100 70,500 30,400 65,300 134,000 53,700 111,500 234,000 107,500 Cost per ton (XAF) 30,100 70,500 30,400 16,325 33,500 13,425 11,150 23,400 10,750 Total per vehicle (US$) 56.90 133.27 57.47 123.44 253.31 101.51 210.78 442.34 203.21 Cost per ton (US$) 56.90 133.27 57.47 30.86 63.33 25.38 21.08 44.23 20.32 ? = Information on official costs not available from responsible agency. Entry Fee Paid to enter the market for loading purposes Exit Fee Paid at the Poste Avancé. Information only available for mid- size trucks. Costs to Enter Gabon Unspecified Fees Total Costs at Border Fee Name Responsible Agency Minibus (1 ton) Small Truck (4 tons) Mid-Size Truck (10 tons) Costs to Exit Cameroon
  • 112.
    96 CHAPTER 7: PoliticalEconomy Considerations of Regional Integration in CEMAC A. Introduction 7.1. “Regional cooperation and integration have long been high on the agenda of African countries, regions and regional organizations. Burgeoning regional policies, strategies and protocols have been matched by widening ambitions and mandates in most regional organizations, often supported by donor-financed expansions in budgets, staff and programs. Yet policy-makers, member state representatives and non-state actors frequently express frustration with the gap between commitment and what takes place on the ground.” (Vanheukelom et al. 2016) 7.2. This chapter complements the analysis of previous chapters by bringing a political economy perspective to regional integration and regional development in CEMAC. Following a brief history of regional integration in CEMAC, this chapter highlights several political factors, related to national interest, multi-adhesion to overlapping regional initiatives and external influences that are closely associated with the current state of regional integration in CEMAC. B. CEMAC and regional integration in Central Africa 7.3. The Charter of the Organization of African Unity and the Constitutive Act establishing the African Union define regional integration as one of the foundations of African unity. The creation of the Organization of African Unity (OAU) in 1964 reflected the awareness of the leaders that Africa’s strength was rooted in Pan-African cooperation. The Lagos Plan of Action62 and the Abuja Treaty63 elaborated the specific economic, political and institutional mechanisms for attaining this objective. The adoption of the New Partnership for Africa’s Development (NEPAD) in 2001 provided an overall development framework for the continent which adopted regional integration as one of its core objectives. The establishment of the Commission of the African Union (AU) in 2001, the incorporation of NEPAD into its structures, and the launch of AU’s African Continental Free Trade Area (CFTA) in March 2018, which was signed by 44 African states, further underlines this commitment to regional integration. 7.4. Central Africa has a long history of regional integration. After independence from France, the nations of Central Africa embarked on a journey of economic integration that culminated with the signing of the Central African Economic and Monetary Community (CEMAC) treaty in 1994. This process began in 1959 when four members of the former Federation de l'Afrique Equatoriale Française, the Central African Republic, Chad, Congo and Gabon, signed a Convention establishing the Equatorial African Customs Union, the Union Douanière Equatorial (UDE). In 1964, the customs union was expanded when Cameroon and the UDE signed the Customs and Economic Union of Central Africa (UDEAC), eventually joined by Equatorial Guinea in 1983. While UDEAC was soon stalling, the formation 62 The 1980 Lagos Plan of Action for the economic Development of Africa 1980-2000 63 Signed in 1991 and entered into force in 1994: The created African Economic Community’s stated goals include the creation of free trade areas, customs unions, a single market, a central bank, and a common currency over a period extending up to 2028
  • 113.
    97 of Economic Communityof Central African States (ECCAS)64 was expected to bring new life to regional integration in Central Africa, but ECCAS also was quickly paralyzed by war and conflicts between its members (Bach 2016). Economic crises in the 1980s created momentum for renewed economic integration, leading to the establishment of CEMAC in 1994, which called for the creation of a common market and full monetary integration. However, it is only in 1999 that CEMAC became effective and replaced UDEAC. A Community Integration Tax (TCI), equivalent to one percent of imports of third party countries was also introduced to cover the recurrent expenditures of CEMAC organs and institutions.65 7.5. The new Treaty established two unions, the Union Économique de l'Afrique Centrale (UEAC) and the Union Monétaire de l'Afrique Central (UMAC) to fulfil the objectives of CEMAC. Together, these two unions aim to (i) set up a multilateral device for monitoring economic and financial policies in their Members States, (ii) manage the common currency, (iii) create a safe environment for economic activity, (iv) harmonize the regulations of sectoral policies, (v) create a common market for goods, services, capital and people. 7.6. In 2008, CEMAC was reformed to move from inter-state cooperation to supra-nationalism. While the revised treaty maintained the institutions in place, it strengthened the power of the institutions and converted the Secretariat into a Commission, echoing a similar move by the West African Economic and Monetary Union (UEMOA) in 2006 and replicating EU’s Maastricht treaty (Bach 2016).66 It further established a Community Parliament and Community Court of Justice for CEMAC. 7.7. CEMAC was created to promote regional integration and to ensure the effective implementation of policies throughout the sub-region. Upon its creation, CEMAC set out to promote trade, establish a Central African common market and unite the inhabitants of the sub-region. CEMAC member states, in their drive for regional integration, were influenced by economic theories of integration and the assumption that integration has a positive impact on the gross national product of all its member states through an increase in the size of the markets, the efficiency of institutions within member states, and an increase in economies of scale (Jaber 1979). 7.8. CEMAC and ECCAS co-exist with overlapping mandates. ECCAS was revived in 1999, after signing the initial protocol on relations between the African Union (AU) and the Regional Economic Communities (REC). This provided ECCAS with security mandate through the Council for Peace and Security in Central Africa (COPAX) and a mandate to form a Free Trade Area (FTA) as part of the African Economic Community (AEC); ECCAS also became one of the eight AU-recognized REC. CEMAC represents a smaller group of countries, where the monetary and economic union and several regional institutions provide a level of internal coherence and legitimacy. ECCAS has less internal coherence, but greater political legitimacy at the African Union level through a broad regional mandate that spans trade, 64 ECCAS was established in 1983 by the UDEAC/CEMAC members and the members of the Economic Community of the Great Lakes States (CEPGL) (Burundi, Rwanda and DRC (then Zaire)) and Sao Tomé and Principe. Angola remained an observer until 1999, when it became a full member. 65 While the introduction of TCI significantly improved the financing of CEMAC institutions compared to the situation under UDECA, where contributions were paid through national treasuries, TCI contributions are often plagued by partial or late payments (Awouwou 2008). 66 The Commission is intended to initiate draft legislation and apply and implement Community policies and programs.
  • 114.
    98 infrastructure, energy67 , agricultureand peace and security (Byiers 2017); the UN General Assembly further granted ECCAS observer status at the United Nations in 2001 (Awoumou 2008). 67 ECCAS members established the Central African Power Pool (CAPP) in 2003 as an ECCAS specialized agency. Box 11. CEMAC structure and decision-making processes CEMAC consists of four institutions: the Economic Union of Central Africa (UEAC); the Monetary Union of Central Africa (UMAC); the Community Parliament; and the Court of Justice. The organs of the CEMAC are the Conference of Heads of State; the Council of Ministers; the Ministerial Committee; the CEMAC Commission; the Bank of Central African States (BEAC); the Development Bank of Central African States (BDEAC); the Banking Commission of Central Africa (COBAC). CEMAC has also several specialized institutions that support the implementation of the community policies and programs in areas such as agriculture, health, infrastructure. Examples are the Economic Commission on Cattle, Meat and Fishery Resources (CEBEVIRHA), the Inter-State Committee on Pesticides (CPAC), the Institute for Statistics and Applied Economics (ISSEA) or the Sub-Regional Multi-Sectoral Institute for Applied Technology (ISTA), International Commission of the Congo-Ubangi-Sangha Basin (CICOS). There are also several schools and training facilities, such as an inter-state school for customs officers (EIED), a Tourism School (EHT-CEMAC), Institute of Economy and Finance (IEF) or an inter-state center for higher education on public health (CIESPAC). The Monetary and the Economic Union: The Monetary Union (UMAC) and the Economic Union (UEAC) are the Community’s two main pillars. They are supposed to guide and root the regionalisation process. UMAC’s main institution is BEAC, which issues the common currency and guarantees its stability by defining and managing monetary policies, exchange operations and reserves in member states. UEAC, the economic union, is less advanced. Despite a comprehensive body of legislations, progress in establishing an economic union has so far been slower than expected, particularly with regards to the free movement of citizens and the continued existence of intra-regional tariff and non- tariff barriers. The CEMAC Parliament and the Court of Justice: The Court of Justice, which has been in place since 2000, integrates judicial and audit functions. The Court is composed of a Judicial and an Audit Chamber, and each chamber has six judges. The Judicial Chamber guards CEMAC treaties and agreements, while the Audit Chamber is charged with monitoring CEMAC’s budget and accounts. The Parliament, which is not yet fully operational, is intended to have a representative role, as its members are considered deputies of the entire CEMAC population. The Conference of Heads of State: CEMAC’s main decision-making power rests with members' political leaders, gathered annually in the Conference of Heads of State. The presidency of the Conference is rotating and is entrusted each year to the Head of State of a different Member State, following alphabetic order. The Conference's main function is to determine the main orientations of the Community and its institutions. It nominates the heads of most Community bodies, such as the Executive Secretary and its deputy, the Governor, Vice-Governor and Secretary General of the BEAC and the directors of all affiliated institutions. Only the Director of the BDEAC is not elected by the Conference of Heads of States but chosen by the Bank’s General Assembly, composed of representatives from the CEMAC Member States, the BEAC and the African Development Banks, and external donors, such as France. All decisions of the Conference of Heads of State are taken by consensus. The CEMAC Commission: The main management and administrative body of CEMAC is the Executive Secretariat. Similar to the European Union, the Commission is composed of an equal number of Commissioners from each Member State, led by a President and a Vice-President. The CEMAC commission is charged with regional macro surveillance and monitoring the regional development strategy (CEMAC-PREF). The Ministerial Councils: There are two Ministerial councils that guide and monitor the implementation of the two unions: the Ministerial Committee in charge of UMAC, and the Council of Ministers for UEAC. Each council comprises three Ministers from each Member State and meets twice per year. The main role of these councils is to ensure the direction of the two unions and to promote the progressive harmonisation of policies. The UMAC Ministerial Committee in addition supervises the activities of the BEAC, ratifies the Bank’s budget and accounts and examines its annual report. The annual presidency of both Ministerial councils is assured by the same Member State that is heading the Heads of State’s Conference. Source: CEMAC, International Democracy Watch.
  • 115.
    99 C. Political economyaspects affecting regional integration and regional development 7.9. In addition to economic and structural factors, political factors can also be an important driver or stumbling block for regional integration. This section explores some political economy aspects of regional integration in CEMAC: CEMAC legitimacy and identity 7.10. The coexistence of overlapping regional bodies leads to challenges regarding commitment to and functionality of the separate initiatives. All CEMAC members are members of ECCAS as well, but ECCAS countries also have overlapping memberships. For example, Angola and DRC are also members of COMESA and SADC, while Burundi and Rwanda are part of EAC. Figure 46 depicts the multitude of regional initiative in Africa. This multi-adhesion to overlapping regional initiatives often leads to a commitment, financial and functionality dilemma,68 as different countries do not attach their ambitions and loyalty to each organization in the same way (Byiers 2017). CEMAC and ECCAS member countries are aware that duplication in memberships and mandates can reduce traction and by request of Heads of State both organizations established a steering committee in 2010 to harmonize integration policies, programs and instruments by 2023, progress has reportedly been slow. The EU's financial agreement with ECCAS and CEMAC also supports coordination and rationalization between the two, with the long- term objective of establishing a single organization.69 Collaboration versus competition 7.11. Unproductive rivalry among the CEMAC member states have at times compromised concerted efforts. According to Kewir (2015), and Nguh and Ndedi (2017), rivalries between, for example, Gabon and Cameroon over where to locate the headquarters of the Bank of Central African States, (BEAC) and which country should furnish the governor, or more recently over the location of the CEMAC sub- regional stock exchange,70 have often posed a political threat to the stability and integration of the region. Since the start of oil production, Equatorial Guinea has reportedly also resisted and contested regional policies and displayed increased leadership ambition (Awoumou, 2008). 68 As an example, dual membership in CEMAC and ECCAS carries third-party import levies of 1% and 0.4%, respectively. 69 http://europa.eu/rapid/press-release_PRES-08-323_en.htm
  • 116.
    100 Figure 46: Overlappingregional initiatives in Africa Source: Sy (2015) 7.12. Joint leadership is needed. As Kewir (2015) points out, Cameroon and Gabon would be in a good position to bring the needed impetus to the region to implement reforms and bring dynamism to integration in Central Africa. The two countries are politically the most stable in the region and, jointly, they represent the largest share economically and demographically, have large reserves of natural resources and are strategically located with natural ports facilities. To provide the needed leadership for the region, they would have to overcome rivalries, agree to joint positions regarding CEMAC projects and policies, increase the frequency of meetings between government officials and ideally engage in joint projects (Nguh and Ndedi 2017). National interest versus community agenda 7.13. Sovereignty constitutes a challenge for CEMAC members. Lack of political commitment from member states, regional rivalry and an inability to move beyond national and short-term interest has failed to enable CEMAC member countries to attain the expected level of economic and monetary integration or implement structural policies aimed at economic diversification (e.g. Laurens, 2008). Regional integration inherently entails the loss of some sovereignty to the transnational organization,
  • 117.
    101 but rather thanseeing this as necessary to boot the trade that will increase living standards, CEMAC member countries often see it as a threat to sovereignty71 ; CEMAC national governments have therefore often elected to hold fast to their pre-association independence. This is dissimilar to the prevailing situation with an analogous organization like the EU, which has attained political integration; running a functional Council, Parliament, Court of Justice and other institutions whose powers are binding for all members and override decisions made at national levels. 7.14. Cameroon’s decision to sign an Economic Partnership Agreement (EPA) with the European Union is seen by some observers as case of national interests undermining the CEMAC Customs Union and its Common External Tariff. Cameroon is the only CEMAC member to have signed the EPAs which went into effect in 2016. Other CEMAC members have criticized Cameroon for undermining CEMAC’s Common External Tariffs which is levied against imports from non-member countries as now goods imported under the EPA into Cameroon can circulate freely in CEMAC. Rather than boosting integration, this could hinder efforts to establish a functional sub-regional common market. 7.15. Fiscal policy and public debt management are subject to regional surveillance by the CEMAC Commissions, but compliance is weak. CEMAC members adopted a multilateral surveillance framework in 1994 to advance macroeconomic convergence and to supervise national fiscal policies. CEMAC’s regional macro surveillance framework set limits on key macroeconomic indicators to promote national policies consistent with the common currency. The regional convergence framework was initially adopted in 1994 with the objective to prevent excessive fiscal deficits (and deficit financing) to ensure the sustainability of the peg (IMF, 2009).72 Members with policies that are inconsistent with the union's objectives are required to adopt adjustment programs to achieve convergence. However, to date there are no sanctions for non-compliance and enforcement of the framework has not been implemented consistently; this possibly reflects a lack of political will at the national level (IMF 2017). Enshrining the regional fiscal framework in national legislation and strengthening regional enforcement by the CEMAC Commission, including through a mandate for the Commission to validate the data submitted by national authorities, would be important in this regard. This would require strong political support and adequate resources, but could significantly increase compliance, and eventually foster deeper regional integration through increase fiscal convergence.73 External influences 7.16. Historic, economic and political ties with France have been an important factor in the development of the region. For CEMAC, particularly the French influence has extended from the colonization era to the current monetary arrangement of the CFA zone, which continues to be a significant determinant of economic policies in the region (see Box 1). Byiers (2017) further argues that close ties to France have given rise to an orientation and mobility of elites towards France, which has further strengthened the economic and political ties between each country and France rather than with the region. However, Kavanagh (2006) also points out that the CEMAC region has also benefited from the stability gained by having France as guarantor and from the low inflation due to the monetary union. 71 https://www.voanews.com/a/central-africa-economic-integration-difficult-after-20-years/1861181.html. 72 See Box 1 in Chapter 1 for a description of CEMAC’s regional surveillance framework. 73 Darvas et al. (2005) find that the Maastricht “convergence criteria,” used to determine eligibility for EMU, have indirectly moved Europe closer to an optimum currency area by reducing countries’ abilities to create idiosyncratic fiscal shocks.
  • 118.
    102 Governance challenges andlimited private sector involvement 7.17. Weak governance can give importance to personalized relations in regional integration (e.g. Vanheukelom et al. 2016). Weak governance remains a challenge in the region and within regional institutions (see Chapter 1 for the different governance indicators). While the longevity of presidential mandates has been associated with stability74 , it also has been accredited with political resistance to change and innovation, which may adversely impact regional dynamics and interactions (Byiers 2017). The importance of Summits of Heads of States in driving regional agendas in Central Africa may further limit the participation of the private sector and non-state actors which have been credited elsewhere as an important driver of advancing regional integration (Bertelsmann-Scott 2013). Internal conflicts 7.18. Internal conflicts within CEMAC countries have often been a threat to regional integration, as they often spillover to neighboring countries (Nguh 2015, Ndedi 2015). The security situation in the region and the frequent political crises are impacting regional agricultural trade by increasing losses, risks taken by traders and informality (World Bank 2018c). In Northern Cameroon, the Boko Haram- induced security situation has reduced exchange flows between Cameroon and Nigeria, as well as less livestock transit from Chad into Nigeria. In addition, the Douala-N’Djamena corridor has also been disrupted because of the risk of attacks on the last segment between Mora and the border with Chad and Kousseri. The 4-month closure of the border with Cameroon, following the foiled coup d’etat in Equatorial Guinea in December 2017, also resulted in the re-channeling of trade through unofficial, rural routes. D. Conclusions and recommendations 7.19. For the regional integration in CEMAC to succeed the political will for integration needs to go beyond aspirations that ebb and rise counter-cyclically with oil prices. Regional integration requires a sub-ordination of national interests and a dedicated political prioritization. In the case of Europe, integration started with the desire to maintain peace in Europe following the devastation of two World Wars in the first part of the last century. Within CEMAC, push-factors towards deeper regional integration could come from areas where national and elite interests align and where CEMAC and ECCAS can play a supporting role. Such areas could be the threat of overspills for violent conflicts, regional food security and sub-regional infrastructure. 7.20. Peace, security and stability are crucial for growth and integration in the CEMAC region. A joined and sustained investment in security through COPAX could play a vital role for regional security and integration. ECCAS’s Council for Peace and Security in Central Africa (COPAX) is the main political and military coordination forum for the promotion, maintenance and the consolidation of peace in the region. While CEMAC initially responded to the crisis in CAR, ultimately it has led to considerable traction for ECCAS peace and security initiatives. Byiers (2017) suggests that the connections between violence and illicit financing from natural resource extraction could also provide a potential role for 74 Before the passing of the former president of Gabon, Omar Bongo, the combined number of years spent in office by the presidents of the six member states of CEMAC amounted to 147 years which is indicative of political resistance to change and innovation.
  • 119.
    103 regional bodies lookingat money-laundering (through the CEMAC related GABAC75 ) and for better coordination of natural resource management. 7.21. Regional food security should be a common goal. About 45 percent of CEMAC’s population suffers from undernourishment. Given food shortages and malnutrition across the entire CEMAC region, achieving food security could be another common push factor to deepen regional integration, both through facilitating intra-regional trade in agricultural products and increasing regional production. 7.22. The development of sub-regional infrastructure is important. Access to the sea is of particularly importance for Chad and CAR, CEMAC’s two land-locked countries. The development of sub-regional infrastructure linking Cameroon, Chad and Central African Republic through road and rail constructions has started (Nono, 2015). CEMAC is also being supported by the EC in strengthening digital connections among member states. While physical connections may be a good entry point to promote deeper regional integration and cooperation, it has to be recognized that large-scale infrastructure projects are often subject to different interests and power struggles; as evident from recent attempts to establish a regional power pool. 75 Task Force on Money Laundering in Central Africa (Groupe d’Action contre le blanchiment d’Argent en Afrique Centrale – GABAC).
  • 120.
    104 REFERENCES Abid, M. (2016).Size and Implication of Informal Economy in African Countries: Evidence from a Structural Model. International Economic Journal, 30:4, 571-698. African Development Bank (2010). Financial Sector Integration in Three Regions in Africa – How Regional Financial Integration Can Support Growth. Development and Poverty Reduction. Tunis. Agbor, J. A. (2012). The future of the CEAM CFA Franc. Global Views, Policy Paper 2012-06. The Brookings Institute. Ahmed, H. and N. Hamid (2011). Financing constraints: determinants and implications for firm growth in Pakistan. Lahore J. Econ. 16, 317–346. Akitoby, B. and M. Cinyabuguma. 2004. “Sources of growth in the Democratic Republic of the Congo: A cointegration approach.” IMF Working Paper 04/114. Washington, DC. Almeida, R., & Carneiro, P. (2009). Enforcement of Labor Regulation and Firm Size. Journal of Comparative Economics, 37, 28-46. Araujo, J. and M. Brueckner, M. Clavijo, E. Vostroknutova and K. Wacker (2014). “Benchmarking the determinants of economic growth in LAC”, World Bank, Report No. 91015-LAC. Avom, D. (2007). Integration regionale dans la CEMAC: des problemes institutionnels recurrents. Afrique Contemporaine, 2007/ 2/222. Awasthi, Rajul, Michael Engelschalk (2018), “Taxation and the Shadow Economy”, WPS8391, World Bank. Atérido, R., Hallward-Driemeier, M., & Pages, V. (2011). Big constraints to small firms’ growth? Business environment and employment growth across firms. Economic Development and Cultural Change, 59 (3), 609--647. Awoumou, C. D. G. (2008): ECCAS or CEMAC: Which Regional Economic Community for Africa? in: C. Ayangafac (ed.): Political Economy of regionalization in Central Africa. Institute of Securities Studies. Ayadi, L., N. Benjamin, S. Benassi and G. Raballand. (2013). Estimating Informal Trade across Tunisia’s Land Borders. World Bank Policy Research Paper 6731, December 2013, Washington, DC. Bach, D. (2016): Regionalism in Africa. Genealogies, institutions and trans-state networks, Routledge Paperbacks. Bagnai, A. (2010). Macroeconomic Convergence in Central Africa: A Survey of the Theory and Empirical Evidence. Economic Commission for Africa. Bah, E.-h., & Fang, L. (2015). Impact of the business environment on output and. Journal of Development Economics, 159-171. Barro, R. and X. Sala-i-Martin (2013). “Convergence.” Journal of Political Economy 100(2), pp.
  • 121.
    105 223-251. Bartelsman, Eric andMark Doms (2000), “Understanding Productivity: Lessons from Longitudinal Microdata”, Journal of Economic Literature, 38, 3, September, pp. 569-594. Bastos, F., & Nasir, J. (2004). Productivity and the Investment Climate: What Matters Most? World Bank Policy Research Working Paper 3335. Baumol, W. (1986). “Productivity Growth, Convergence, and Welfare: What the Long-Run Data Show.” American Economic Review 76(5), pp. 1072-1085. Bayraktar, Nihal and Blanca Moreno-Dodson (2018a) Public spending and growth in an economic and monetary union: the case of WAEMU, Eurasian Journal of Economics and Finance, vol. 6(1), pages 107-132. Bayraktar, Nihal and Blanca Moreno-Dodson (2018b). “Tax Structure and the Private Sector in CEMAC.” Background paper for the CEM. Bayraktar, Nihal, Tuan Le, Blanca Moreno-Dodson (2016) "Tax Revenues and Tax Efforts Across the World". Handbook of Research on Public Finance in Europe and the MENA Region, edited by Mustafa Erdogdu and Bryan Christiansen. IGI Global: Hershey, Pennsylvania. Beck, T., Demirgüç-Kunt, A., & Maksimovic, V. (2005). Financial and legal constraints to growth: Does firm size matter? The Journal of Finance, 60(1), 137-177. Bernan, N., & Héricourt, J. (2010). Financial factors and the margins of trade: Evidence from cross-country firm-level data. Journal of Development Economics, 93 (2), 206-2017. Bernard, A. and S. Durlauf (1996). “Interpreting tests of the convergence hypothesis.” Journal of Econometrics, 71, pp. 161-173. Bertelsmann-Scott, T. (2003): “The private sector as a driver of regional integration”. Political Economy of Regional Integration in Southern Africa Series, ECDPM. Bikai, J. L, F.F. Owoundi (2016). “Le Choix d’un Régime de Change Permet-il de Limiter les Mésalignements du Taux de Change? L’Exemple des Pays d’Afrique Subsaharienne.” BEAC Working Paper 2/16. Banque des Etats de lAfrique Central (BEAC). Bosworth, B., S. Collins and Y. Chen (1995). “Accounting for Differences in Economic Growth.” Brookings Discussion Paper in International Economics, No. 115, 1-63. Butler, A.W., Cornaggia, J., (2007). Does Access to Finance Improve Productivity? Evidence from a Natural Experiment. Mimeo. Byiers, B. (2017): Understanding regional economic policies in Central Africa. Struggling to integrate in an intertwined region. ECDPM. Calderon, C. and C. Cantu (2018): Foreign trade and growth in CEMAC: Intensity and Concentration”. Background paper for the CEM. World Bank. Carlin, W. and P. Seabright. (2007). Bring Me Sunshine: Which parts of the business climate should public policy try to fix? Annual Bank Conference on Development Economics, Bled Slovenia, 2007.
  • 122.
    106 CEMAC (1994). “TraiteInstituant la Communaute Économique et Monetaire de l'Afrique Centrale.” CEMAC (2017). “CEMAC Economic and Financial Reforms Program (PREF – CEMAC).” CEMAC. Cirera, X., Willenbockel, D. and Lakshman, R. (2011) What is the evidence of the impact of tariff reductions on employment and fiscal revenue in developing countries? A systematic review. EPPI-Centre Technical Report No 1907. London: EPPI-Centre, University of London Clark, P. B. and MacDonald, R. (1999) “Exchange rates and economic fundamentals: a methodological comparison of BEERs and FEERs”, in MacDonald, R and Stein, J (eds.), Equilibrium exchange rates, Kluwer Academic Publishers. Cooper, R.N., R. Dornbusch and R.E. Hall (1982), The Gold Standard: Historical Facts and Future Prospects’, Brookings Papers on Economic Activity, Vol. 1982, No 1, pp 1-56. Coulibaly, I. and J. Davis (2013). “Exchange rate regimes and economic performance” Does CFA zone membership benefit their economies?” MPRA Paper No. 54075. Crowe Horwath (2016) Africa Tax Facts Guide. https://www.crowehorwath.net/uploadedFiles/MU/additional- content/home/Africa%20Tax%20Facts%20Guide%202016.pdf Dawson, J. and M. Strazicich (2010). “Time-series tests of income convergence with two structural breaks: evidence from 29 countries.” Applied Economics Letters 17(9), pp. 909-912. Demirguc-Kunt, A., Maksimovic, V. (1998). Law, finance, and firm growth. J. Finance 53 (6), 2107–2137. Demirguc-Kunt, Love, I., Maksimovic, V. (2006). Business environment and the incorporation decision. J. Bank. Finance 30 (11), 2967–2993. Denison, Edward F. (1989), Estimates of Productivity Change by Industry: An Evaluation and an Alternative, The Brookings Institution, Washington, DC. Diewert, Erwin W. (2000), The Challenge of Total Factor Productivity Measurement, International Productivity Monitor. Djiofack, C. (2018): Using a dynamic global CGE model (ENVISAGE) to model the impact of removing petty harassment costs (tracasseries) on intra-regional trade and growth in CEMAC. Background paper to the CEM. World Bank. Dinh, H.T., Mavridis, D.A., Nguyen, H.B. (2012). The binding constraint on the growth of firms in developing countries. In: Dinh, H.T., Clarke, G.R.G. (Eds.), Performance of Manufacturing Firms in Africa: An Empirical Analysis. World Bank, Washington D.C, pp. 87–137. Doe, Lubin (2006) "Harmonization of Domestic Consumption Taxes in Central and Western African Countries," IMF Working Paper No: WP/06/8 (January). Dramani, L. (2010). “Convergence and Economic Integration in Africa: the Case of the Franc Zone Countries.” AERC Research Paper 200, African Economic Research Consortium,
  • 123.
    107 Nairobi. Eifert, B., Gelb,A., & Ramachandran, V. (2005). Business environment and comparative in africa: Evidence from the investment climate data. Proceedings of ABCDE Conference, Senegal. Escribano, A., J.L. Guasch and M. de Orte. (2006). CHILE Investment Climate Assessment (ICA) on Productivity and on Allocative Efficiency: Effects on Exports, Foreign Direct Investment, Wages and Employment. Edwards, L., and RZ. Lawrence 2012. A strategic view of South African trade policy in relation to the future global trading environment”, South African Journal of International Affairs, 19(3): 277-298. Essien, A. (2006). Regional Trade Agreements in Africa: A Historical and Bibliographic Account of ECOWAS and CEMAC. European External Action Service (2018) “Trade: How to take advantage of the EU-Cameroon EPA”. Fafchamps, M., Schundeln, M., (2013). Local financial development and firm performance: evidence from Morocco. J. Dev. Econ. 103, 15–28. Ferrantino, M. (2006). "Policy Anchors: Do free trade agreements serve as vehicles for developing country policy reform?" Office of Economics Working Paper No. 2006-04-A, US International Trade Commission, Washington, D.C. Fiess, N. and A. Kouevi (2018)” Productivity of non-oil sectors in CEMAC countries”. Background paper to the CEM. World Bank. Fiess, N. and R. MacDonald (2018). “The CEMAC and Currency Regime Issues.” Background paper to the CEM. World Bank. Fowowe, B. (2017). Access to finance and firm performance: Evidence from African countries, Review of Development Finance 7 (2017) 6–17. Frankel, J.A. and A. Rose. (1998). “The Endogeneity of the Optimum Currency Area Criteria.” Economic Journal 108(449): 1009-25. Frankel, J.A. (2003), “Experience and lessons from exchange rate regimes in emerging markets”, NBER working paper No 0032, NBER. Frankel. J. A. (2017). The currency-plus-commodity basket: a proposal for exchange rates in oil- exporting countries to accommodate trade shocks automatically. CID Working Paper No. 333.Harvard University. Ghosh, S. and A. Kraay. (2000). “Measuring growth in total factor productivity.” PREM Note, No. 42, World Bank. Washington, DC. Ghura, D., K. Kpodar, and R.J. Singh (2010), “Financial Deepening in the CFA Franc Zone: The Role of Institutions”, in M. Quintyn and G. Verdier (eds.) African Finance in the 21st Century, International Monetary Fund and Palgrave Macmillan. Giannetti, M., & Ongena, S. (2009). Financial integration and firm performance: Evidence from
  • 124.
    108 foreign bank entryin emerging markets. Review of Finance, 13(2), 181-223. Giannone, D., M. Lenza and L. Reichlin. (2009). “Business Cycles in the Euro Area.” ECB Working Paper Series No. 1010. Girma, S., Gong, Y., Gorg, H. (2008). Foreign direct investment, access to finance, and innovation activity in Chinese enterprises. World Bank Econ. Rev. 22 (2), 367–382. Grekou, C. (2015). Revisiting the nexus between currency misalignment and growth in the CFA zone. Economic Modelling. 45,142-154. Gui-Diby, S. and M.-F. Renard (2015). “Foreign Direct Investment Inflows and the Industrialization of African Countries.” World Development 74, pp. 43-57. Haddad, Mona, C.H. Hollweg and A. Portugal-Perez (2015) "The structural reform implications of WTO accession", in Dadush and Osakwe, "WTO Accessions and Trade Multilateralism: Case Studies and Lessons from the WTO at Twenty", Cambridge University Press, 2015, Hadi, A. (1992). Identifying multiple outliers in multivariate data. Journal of the Royal Statistical Society. Serie B (Methodological), 761-771. Hadi, A. (1994). A modification of a method for the detection of outliers in multivariate samples. Journal of the Royal Statistical Society. Series B (Methodological), 393-396. Haile, F. (2016). “Growth and Structural Change in Tanzania: Retrospect and Prospect.” World Bank, Background study for the World Bank Tanzania Systematic Country Diagnostic. Haile. F. and L. Moller (2018). “Explaining Growth in CEMAC (2000-2016).” Background paper for this CEM. Harger, K., A. Young and J. Hall (2017). “Globalizations, Institutions, and Income Convergence.” Journal of Regional Analysis and Policy (forthcoming). Hassan, M. and F. Schneider (2016) "Size and Development of the Shadow Economies of 157 Countries Worldwide: Updated and New Measures from 1999 to 2013," IZA Discussion Paper No. 10281 (October). http://ftp.iza.org/dp10281.pdf Herrera, S. and W. Kouame. (2017). Productivity in the Non-Oil Sector in Nigeria: Firm-Level Evidence. Policy Research Working Paper; No. 8145. World Bank, Washington, DC IMF (International Monetary Fund) (2009). Chad: 2008 Article IV Consultation – Staff Report. IMF Country Report 09/68. Washington, DC. IMF (2015). Central African Monetary and Economic Community (CEMAC): Selected Issues. IMF Country Report No. 15/308. Washington, DC. IMF (2016). Regional Economic Outlook: Sub-Saharan Africa – Multispeed Growth. World Economic and Financial Surveys, October 2016. IMF (2016a). Central African Monetary and Economic Community (CEMAC): Staff Report on the Common Policies of Member Countries. IMF Country Report 16/277. Washington, DC. IMF (2016b). Central African Monetary and Economic Community (CEMAC): Selected Issues. IMF Country Report 16/290. Washington, DC.
  • 125.
    109 IMF (2016c). RegionalEconomic Outlook: Sub-Saharan Africa – Multispeed Growth. World Economic and Financial Surveys, October 2016. IMF (2017). Central African Monetary and Economic Community (CEMAC): Staff Report on the Common Policies of Member Countries. IMF Country Report 17/176. Washington, DC. Jaber, T. (1979). “The relevance of traditional integration theories to LDC’s,” Journal of Common Market Studies, 9/3: 254. Johansen, S. (1995) “Likelihood-based inference in cointegrated vector autoregressive models”, Oxford University Press, Oxford, UK. Kaufmann, D., A. Kraay and M. Mastruzzi (2010). “The Worldwide Governance Indicators: Methodology and Analytical Issues.” Policy Research Working Paper 5430, World Bank. Washington, DC. Kavanagh, M. (2006). The 1994 Devaluation of the CFA Franc & The Changing Role of France in African Development. International Development Studies, Working Paper 06-04, Yale. Keen, Michael and Mario Mansour (2009) "Revenue Mobilization in Sub-Saharan Africa: Challenges from Globalization," IMF Working Paper No: WP/09/157 (July). Keen, Michael and Mario Mansour (2010a), "Revenue Mobilization in Sub-Saharan Africa: Challenges from Globalization I - Trade Reform," Development Policy Review, 28(5): 553- 571. Keen, Michael and Mario Mansour (2010b) "Revenue Mobilization in Sub-Saharan Africa: Challenges from Globalization II - Corporate Taxation," Development Policy Review, 28(5): 573-596. Kewir, K. (2015). Leadership and Economic Integration: the case of the Cameroon-Gabon couple. Center for Strategic Research and Analysis. http://cesran.org/leadership-and- economic-integration-the-case-of-the-cameroon-gabon-couple.html Krueger, A. (1983), Trade and Employment in Developing Countries, 3: Synthesis and Conclusions, University of Chicago Press, Chicago, IL Krugman, P. (1988). Financing vs. Forgiving a Debt Overhang. Journal of Development Economics, 29(3), 253 -268. Lall, Sanjaya. (2005). Is African industry competing? Queen Elizabeth House Working Paper Series no. 122. Oxford University. Laporte G. (2012). What future for the ACP and the Cotonou Agreement? Preparing for the next steps in the debate (ECDPM Briefing Note 34). Maastricht. Laurens, Bernard L. (2008). “The Case of CEMAC,” Workshop on Regional Financial Integration in Africa, December 1, 2008, Tunis. Le Goff, M. and R. Singh (2012), “Does Trade Reduce Poverty? A View from Africa”, paper presented at the Annual Conference of the Center for the Study of African Economies, Oxford, March 18-20, 2012. Levine, R., (2005), Finance and growth: theory and evidence. In: Aghion, P., Durlauf, S. (Eds.),
  • 126.
    110 Handbook of EconomicGrowth, vol. 1, part A. Elsevier Science, The Netherlands, pp. 865–934. Levinsohn, J., & Petrin, A. (2003). Estimating production functions using inputs to control for unobservables. The Review of Economic Studies, 70 (2), 317-341. Limão, N. and A. J. Venables (2001). Infrastructure, geographical disadvantage, transport costs, and trade, World Bank Economic Review 15 (3): 451-479. MacDonald, R. (2008), ‘An Exchange Rate Regime Proposal for Qatar’, Planning Authority of Qatar. MacDonald, R. (2010), “International Experiences in operating exchange rate regimes: drawing lessons from the United Arab Emirates” in R. MacDonald and A. Al Faris (Eds), Currency Union and Exchange Rate Issues: Lessons from the Gulf States. Edward Elgar. Mansour, Mario (2014) "A Tax Revenue Dataset for Sub-Saharan Africa: 1980-2010," No I19, Working Papers from FERDI. Martijn, J. K. and Ch. Tsangarides (2008). “Trade in CEMAC: Developments and Reform Opportunities.” In: Gulde, A.-M. and Ch. Tsangarides (eds.). The CFA Franc Zone: Common Currency, Uncommon Challenges. IMF, Washington, DC. pp. 335-363. Melitz, M. (2003). The impact of trade on intra‐industry reallocations and aggregate industry productivity. Econometrica, 71 (6), 1695-1725. Melitz, M., & Ottaviano, G. (2008). Market size, trade, and productivity. The review of economic studies, 75 (1), 295-316. Miller, T. and A. Kim (2017) “Index of Economic Freedom.“ The Heritage Foundation, Washington, DC. Mo Ibrahim Foundation (2016). “A Decade of African Governance 2006-2015. 2016 Ibrahim Index of African Governance.” Index Report. Mo Ibrahim Foundation. Moller, L. and K. Wacker (2017). “Explaining Ethiopia’s Growth Acceleration—The Role of Infrastructure and Macroeconomic Policy”, World Development, 96, 198-215. Moreno-Dodson, B. and N. Bayraktar (2018) "Taxes and Private Sector Activity in the WAEMU Region," in: A. Zafar (ed.): Competitiveness Challenges in the CFA Zone in Sub-Saharan Africa, unpublished document. Mundell, R. (1997), “The international Monetary System in the 21 Century: Could Gold Make and Comeback?” Ndedi, A. (2015). “Roadmap for Regional Integration within the Central African Economic and Monetary Community (CEMAC) under the NEPAD Framework.” https://papers.ssrn.com/sol3/Data_Integrity_Notice.cfm?abid=2551739 Nguh, A. (2015). Challenges for an Effective Integration within the CEMAC Sub-Region: Challenges Facing the Central Africa Regional Economic Community. Nguh, A. and A. Ndedi (2017): “Factors hindering regional integration in CEMAC and the way
  • 127.
    111 forward”. Background paperto the CEM. Ntuda Ebode, J. V. (2004). Géopolitique des sous-régions africaines: quel destin pour l’Afrique médiane latine? Nubukpo, K., M. Ze Belinga, B. Tinel, and D. Moussa Dembele (eds.) (2016). Sortir l’Afrique de la servitude monétaire. À qui profite le franc CFA ?, Afrique contemporaine, vol. 259, no. 3, pp. 181-185. Nyanteng, V.K. (1998). Rice in West Africa: consumption imports and production with projections to the year 2000. Monrovia, WARDA. OECD (1996a), Industry Productivity: International Comparison and Measurement Issues, OECD, Paris. OECD (2001), Measuring Productivity: Measurement of Aggregate and Industry-level Productivity Growth, OECD, Paris. Okigbo, B.N. (1982). In The developmental effectiveness of food in Africa, p. 11-67. New York, Agricultural Development Council. Pattillo, C., Ch. Tsangarides and P. van den Boogaerde (2008). “Growth and Convergence in the CFA Franc Zone.” In: Gulde, A.-M. and Ch. Tsangarides (eds.). The CFA Franc Zone: Common Currency, Uncommon Challenges. IMF, Washington, DC. pp. 299-334. Pesaran, M. H.; Y. Shin and R. P. Smith (1999). ”Pooled mean group estimator for dynamic heterogenous panels”, Journal of the American Statistical Association, 94, 446, 621-634. Petersen. H. (2009) "Tax Systems and Tax Harmonisation in the East African Community", available at http://www.eacgermany.org/index.php/eac-giz.../tax-harmonisation PricewaterhouseCoopers (2017). Worldwide Tax Summaries - Corporate Taxes. http://www.pwc.com/gx/en/services/tax/worldwide-tax-summaries/downloads.html Rajan, R. G., & Zingales, L. (1998). Financial Dependence and Growth. The American Economic Review, 88(3), 559--586. Rajan, R. G., & Zingales, L. (2001). Financial systems, industrial structure, and growth. Oxford review of economic Policy, 17(4), 467-482. Sacerdoti, E., S. Brunschwig and J. Tang (1998). “The Impact of Human Capital on Growth: Evidence from West Africa.” IMF Working Paper 98/162. Washington, DC Sachs, J. and A. Warner (1995). Economic Convergence and Economic Policies. NBER Working Paper No. 5039. Sala-i-Martin, X. (1996). “The Classical Approach to Convergence Analysis.” Economic Journal 106, pp. 1019-1036. Solarin, S. A. and P. K. Sahu (2013). “Convergence and Divergence in CFA FRANC Countries: A Time Series Analysis.” Journal of Applied Business and Economics 14(2), pp. 112-127. Strazicich, M., J. Lee and E. Day (2004). “Are incomes converging among OECD countries? Time series evidence with two structural breaks.” Journal of Macroeconomics 26, pp. 131-145.
  • 128.
    112 Subramanian, U., Anderson,W., & Lee, K. (2005). Measuring the Impact of the Investment Climate on Total Factor Productivity: The Case of China and Brazil. World Bank Policy Research Working Paper 3792. Sy, A. (2015). The role of the CFA franc in the Economic Integration of the West Africa region. Presentation held at the Second International Conference on Sustainable Development in Africa, Dakar, November 2015. Tahari, A., D. Ghura, B. Akitoby and E. Aka (2004). “Sources of Growth in Sub-Saharan Africa.” IMF Working Paper 04/176. Washington, DC. Tomljanovich, M. and T. Vogelsang (2002). “Are U.S. regions converging? Using new econometric methods to examine old issues.” Empirical Economics 27, pp. 49-62. Transparency International (2017). Corruption Perceptions Index 2016. https://www.transparency.org/news/feature/corruption_perceptions_index_2016#table Trevino, J. P. (2011). “Oil-Price Boom and Real Exchange Rate Appreciation: Is There Dutch Disease in the CEMAC?” IMF Working Paper 11/268. Washington, DC. UNCTAD (2012). Economic Development in Africa Report: Structural transformation and sustainable development in Africa. United Nations publication. UNCTAD (2015). Strengthening the private sector to boost continental trade and integration in Africa. UNCTA Policy Brief No. 33, March. Van den Boogaerde, P. and Ch. Tsangarides (2005). “Ten Years After the CFA Franc Devaluation: Progress Toward Regional Integration in the WAEMU.” IMF Working Paper 05/145. Washington, DC. Van Parys, Stefan and Sebastian James (2010) "The effectiveness of tax incentives in attracting investment: panel data evidence from the CFA Franc zone," International Tax and Public Finance, 17: 400-429. Vanheukelom, J., B. Byiers, S. Bilal and S. Woolfrey (2016). The political economy of regional integration in Africa – What drives and constrains regional organisations? Synthesis Report. European Center for Development Policy Management, Maastricht. Weber, S. (2010). “bacon: An effective way to detect outliers in multivariate data using Stata (and Mata)”. The Stata Journal, 10 (3), 331-338. World Bank (2005). World Development Report 2005: A better Investment Climate. World Bank (2009), "Simplification of Tax Declaration and Payment Formalities," Paper written by CEMA SARL (October). World Bank (2012). Cameroon Economic Update, July 2012: Stepping Out into the World. Cameroon economic update. World Bank (2016). Doing Business 2017–Equal Opportunity for All. Washington, DC. World Bank (2017). Doing Business 2018–Reforming to Create Jobs. Washington, DC.
  • 129.
    113 World Bank (2017a),“Etude sur les ecarts fiscaux en Republique Democratique du Congo”. Study prepared by Leif Jensen and Gregoire Rota-Graziosi. World Bank (2017b). Customs revenues and informal trade in Niger. Report No. ACS22612, June 2017, Washington, DC. World Bank (2018a). Elasticity of CEMAC reserves to oil prices. World Bank. Mimeo. Background note to this report. World Bank (2018b). Regent regional development in CEMAC. World Bank. Mimeo. World Bank (2018c). Breaking Down the Barriers to Regional Agricultural Trade in Central Africa. World Bank. World Trade Organization (2017) Zafar, A. (ed.) (2018): Competitiveness Challenges in the CFA Zone in Sub-Saharan Africa, unpublished document.