Distributed Computing for Everyone
0 likes70 views

This document discusses the significance of distributed computing, particularly focusing on Hadoop and Spark, in handling increasing data volumes efficiently. It demonstrates how to write parallel code using SparkR to analyze NASA precipitation data, highlighting performance improvements achieved through parallel processing. Additionally, it showcases the usage of Koalas for exploiting Spark's distributed computation engine with a pandas-like interface for processing large datasets.


![Define functions to convert files to RDS (resp. Parquet)
imerg_nc_rds converts and saves files to RDS
imerg_nc_rds <- function(file){
library(data.table)
library(ncdf4)
library(arrow)
imer <- ncdf4::nc_open(file)
lon <- ncdf4::ncvar_get(imer, "lon")
lat <- ncdf4::ncvar_get(imer, "lat")
rf.array <- ncdf4::ncvar_get(imer, "precipitationCal")
nc_atts <- ncdf4::ncatt_get(imer, 0)
date_time_start <- as.POSIXlt(nc_atts$BeginDate)
dimnames(rf.array)[[1]] <- imer$dim$lat$vals
dimnames(rf.array)[[2]] <- imer$dim$lon$vals
ncdf4::nc_close(imer)
precip_summary <- data.table::data.table(reshape2::melt(rf.array,
varnames = c("lat", "lon"),
value.name = "precipitation"))
filename = sub('.nc4$', '.rds', basename(file))
precip_summary2 <- cbind(precip_summary, date_time_start)
saveRDS(precip_summary2, file.path("/home/testlv/x123/sohpc21_r", "output", "rds",
basename(filename)))](https://image.slidesharecdn.com/ashpc222demoslides-220715144615-7dfa4a76/85/Distributed-Computing-for-Everyone-19-320.jpg)

![imerg_nc_parquet converts and saves files to Parquet
imerg_nc_parquet <- function(file){
library(data.table)
library(ncdf4)
library(arrow)
imer <- ncdf4::nc_open(file)
lon <- ncdf4::ncvar_get(imer, "lon")
lat <- ncdf4::ncvar_get(imer, "lat")
rf.array <- ncdf4::ncvar_get(imer, "precipitationCal")
nc_atts <- ncdf4::ncatt_get(imer, 0)
date_time_start <- as.POSIXlt(nc_atts$BeginDate)
dimnames(rf.array)[[1]] <- imer$dim$lat$vals
dimnames(rf.array)[[2]] <- imer$dim$lon$vals
ncdf4::nc_close(imer)
precip_summary <- data.table::data.table(reshape2::melt(rf.array,
varnames = c("lat", "lon"),
value.name = "precipitation"))
filename = sub('.nc4$', '.df', basename(file))
precip_summary2 <- cbind(precip_summary, date_time_start)
write_parquet(precip_summary2, file.path("/home/testlv/x123/sohpc21_r", "output", "parquet",
basename(filename)))
return(paste("SAVED TO PARQUET", filename, sep=" "))
}](https://image.slidesharecdn.com/ashpc222demoslides-220715144615-7dfa4a76/85/Distributed-Computing-for-Everyone-21-320.jpg)


![Concatenate two dataframes
Koalas implements most Pandas functions. In this example we are using
concat .
file1 = 'file:///'+ file
file2 = 'file:///home/dataLAB/data/Flugdaten/On_Time_Reporting_Carrier_On_Time_Performance_1987_present_2015_
df = pd.concat(map(pd.read_csv, [file1, file2]))
kdf = ks.concat(list(map(ks.read_csv, [file1, file2])))
/home/anaconda3.8/envs/py36/lib/python3.
6/site-packages/IPython/core/interactive
shell.py:2878: DtypeWarning: Columns (7
7,84,85) have mixed types.Specify dtype
option on import or set low_memory=Fals
e.](https://image.slidesharecdn.com/ashpc222demoslides-220715144615-7dfa4a76/85/Distributed-Computing-for-Everyone-52-320.jpg)

![SHOW TOP 3 DELAYS
%%time
top3 = df.nlargest(3, 'DepDelay')[["IATA_CODE_Reporting_Airline", "DepDelay"]]
CPU times: user 1.08 s, sys: 1.99 s, tot
al: 3.08 s
Wall time: 3.08 s](https://image.slidesharecdn.com/ashpc222demoslides-220715144615-7dfa4a76/85/Distributed-Computing-for-Everyone-54-320.jpg)

![IATA_CODE_Reporting_Airline DepDelay
21523 AA 1988.0
11524 AA 1604.0
340796 AA 1587.0
%%time
ktop3 = kdf.nlargest(3, 'DepDelay')[["IATA_CODE_Reporting_Airline", "DepDelay"]]
CPU times: user 183 ms, sys: 66.8 ms, to
tal: 249 ms
Wall time: 797 ms
ktop3](https://image.slidesharecdn.com/ashpc222demoslides-220715144615-7dfa4a76/85/Distributed-Computing-for-Everyone-56-320.jpg)


Distributed Computing for Everyone
- 1. Distributed Computing for Everyone Giovanna Roda (TU Wien, TU.it, and EuroCC Austria, BOKU Wien) Liana Akobian (TU Wien, TU.it) Dieter Kvasnicka (TU Wien, TU.it and VSC Research Center) ASHPC '22 JUNE 1ST, 2022
- 2. Since the onset of the digital age, data volumes have been rising at a higher rate than processing power, making distributed computing an indispensable technology for data-intensive tasks.
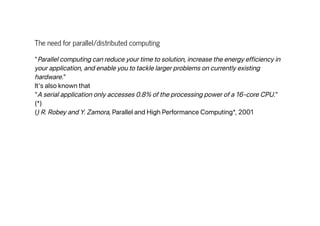
- 3. The need for parallel/distributed computing "Parallel computing can reduce your time to solution, increase the energy efficiency in your application, and enable you to tackle larger problems on currently existing hardware." It's also known that "A serial application only accesses 0.8% of the processing power of a 16-core CPU." (*) () R. Robey and Y. Zamora, Parallel and High Performance Computing*, 2001
- 4. Hadoop and Spark for distributed computing Hadoop and Spark are a popular solution for distributed computing that can not only run on multi-node clusters but also on a single computer ("standalone mode"). The framework itself takes care of identifying and expose parallelism in algorithms, so that the user can enjoy the benefits of parallel computation with minimal implementation effort.
- 5. Writing code for the Spark computing engine In the following examples, we'll showcase how to write parallel code in R, Pandas, and SQL with minimal modifications of the original sequential code.
- 6. SparkR demo INCREASING PERFORMANCE WITH SPARKR LAPPLY This demo showcases how we obtained a performance improvement by substituting the R function with the lapply function of SparkR. The example is part of the work done during the PRACE Summer of HPC 2021 by Rajani Kumar Pradhan. lapply "Big Data meets HPC"
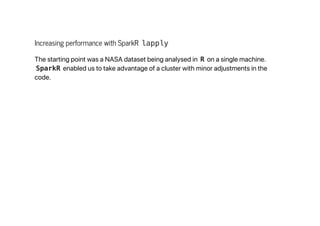
- 7. Increasing performance with SparkR lapply The starting point was a NASA dataset being analysed in R on a single machine. SparkR enabled us to take advantage of a cluster with minor adjustments in the code.
- 8. Load SparkR library Documentation: https://spark.apache.org/docs/latest/sparkr.html library(SparkR) Attaching package: 'SparkR' The following objects are masked from 'packag e:stats': cov, filter, lag, na.omit, predict, sd, va r, window The following objects are masked from 'packag
- 9. e:base': as.data.frame, colnames, colnames<-, drop, endsWith, intersect, rank, rbind, sample, startsWith, subset, s ummary, transform, union
- 10. Create Spark session sparkR.session(appName="Sparkbechmarks", master="yarn", sparkConfig = list(spark.sql.execution.arrow.sparkr.enabled = "true"), spark.driver.memory="2g", spark.executor.memory="4g", spark.driver.maxResultSize="4g") Spark package found in SPARK_HOME: /opt/cloude ra/parcels/CDH-6.3.2-1.cdh6.3.2.p0.1605554/lib /spark Launching java with spark-submit command /opt/ cloudera/parcels/CDH-6.3.2-1.cdh6.3.2.p0.16055 54/lib/spark/bin/spark-submit --driver-memor y "2g" sparkr-shell /tmp/RtmpxrB2O6/backend_po rt57a3781f0b9a
- 11. Warning message in sparkR.session(appName = "S parkbechmarks", master = "yarn", sparkConfig = list(spark.sql.execution.arrow.sparkr.enabled = "true"), : "Version mismatch between Spark JVM and SparkR package. JVM version was 2.4.0-cdh6.3.2 , whil e R package version was 2.4.0" Java ref type org.apache.spark.sql.SparkSessio n id 1
- 12. Dataset We had previously downloaded the publicly available data from IMERG stands for Integrated Multi-satellitE Retrievals for Global Precipitation Measurement (GPM). https://gpm1.gesdisc.eosdis.nasa.gov/data/GPM_L3/GPM_3IMERGDF.06 /2020/
- 13. The data is in nc4 (NetCDF-4) format. NetCDF is a set of software libraries and self- describing, machine-independent data formats for array-oriented scientific data (see ). We downloaded the data in the folder dest . https://www.loc.gov/preservation/digital/formats/fdd/fdd000332.shtml dest <- file.path(path.expand("~"), "dataLAB","data", "sohpc_case-study002")
- 14. Filter files from 2020 In this demo, we're going to process only one year of data. library(dplyr) file_name <- list.files(dest, pattern = ".*3IMERG.2020.*.nc4$", full.names = TRUE) %>% as.list() Attaching package: 'dplyr' The following objects are masked from 'packag e:SparkR': arrange, between, coalesce, collect, conta ins, count, cume_dist, dense_rank, desc, distinct, explain, expr, filter, first, group_by,
- 15. intersect, lag, last, lead, mutate, n, n_d istinct, ntile, percent_rank, rename, row_number, sample_f rac, select, slice, sql, summarize, union The following objects are masked from 'packag e:stats': filter, lag The following objects are masked from 'packag e:base': intersect, setdiff, setequal, union
- 17. CHECK LENGTH OF THE LIST (366 daily files because 2020 was a leap year) 'list' 366 typeof(file_name) length(file_name)
- 18. SHOW FIRST THREE ITEMS IN THE LIST OF FILES 1. '3B-DAY.MS.MRG.3IMERG.20200101-S000000-E235959.V06.nc4' 2. '3B-DAY.MS.MRG.3IMERG.20200102-S000000-E235959.V06.nc4' 3. '3B-DAY.MS.MRG.3IMERG.20200103-S000000-E235959.V06.nc4' head(lapply(file_name, basename),3)
- 19. Define functions to convert files to RDS (resp. Parquet) imerg_nc_rds converts and saves files to RDS imerg_nc_rds <- function(file){ library(data.table) library(ncdf4) library(arrow) imer <- ncdf4::nc_open(file) lon <- ncdf4::ncvar_get(imer, "lon") lat <- ncdf4::ncvar_get(imer, "lat") rf.array <- ncdf4::ncvar_get(imer, "precipitationCal") nc_atts <- ncdf4::ncatt_get(imer, 0) date_time_start <- as.POSIXlt(nc_atts$BeginDate) dimnames(rf.array)[[1]] <- imer$dim$lat$vals dimnames(rf.array)[[2]] <- imer$dim$lon$vals ncdf4::nc_close(imer) precip_summary <- data.table::data.table(reshape2::melt(rf.array, varnames = c("lat", "lon"), value.name = "precipitation")) filename = sub('.nc4$', '.rds', basename(file)) precip_summary2 <- cbind(precip_summary, date_time_start) saveRDS(precip_summary2, file.path("/home/testlv/x123/sohpc21_r", "output", "rds", basename(filename)))
- 20. return(paste("SAVED TO RDS", filename, sep=" ")) }
- 21. imerg_nc_parquet converts and saves files to Parquet imerg_nc_parquet <- function(file){ library(data.table) library(ncdf4) library(arrow) imer <- ncdf4::nc_open(file) lon <- ncdf4::ncvar_get(imer, "lon") lat <- ncdf4::ncvar_get(imer, "lat") rf.array <- ncdf4::ncvar_get(imer, "precipitationCal") nc_atts <- ncdf4::ncatt_get(imer, 0) date_time_start <- as.POSIXlt(nc_atts$BeginDate) dimnames(rf.array)[[1]] <- imer$dim$lat$vals dimnames(rf.array)[[2]] <- imer$dim$lon$vals ncdf4::nc_close(imer) precip_summary <- data.table::data.table(reshape2::melt(rf.array, varnames = c("lat", "lon"), value.name = "precipitation")) filename = sub('.nc4$', '.df', basename(file)) precip_summary2 <- cbind(precip_summary, date_time_start) write_parquet(precip_summary2, file.path("/home/testlv/x123/sohpc21_r", "output", "parquet", basename(filename))) return(paste("SAVED TO PARQUET", filename, sep=" ")) }
- 23. Load R microbenchmark library for timing We're going to use the microbenchmark library for timing imerg_nc_parquet with just one experiment.
- 24. library(microbenchmark) par_bench <- microbenchmark(times=1, par <- spark.lapply(file_name, imerg_nc_parquet) ) print(par_bench) Unit: seconds e xpr min lq mean par <- spark.lapply(file_name, imerg_nc_parqu et) 62.23485 62.23485 62.23485 median uq max neval 62.23485 62.23485 62.23485 1
- 25. Spark graciously distributed the 366 tasks across the cluster
- 26. Some of the nodes involved in the computations
- 27. PAR CONTAINS THE LIST OF PARQUET FILES 1. 'SAVED TO PARQUET 3B-DAY.MS.MRG.3IMERG.20200101-S000000- E235959.V06.df' 2. 'SAVED TO PARQUET 3B-DAY.MS.MRG.3IMERG.20200102-S000000- E235959.V06.df' head(par, 2)
- 28. LOOK AT THE DATAFRAME FOR JANUARY A data.frame: 5 × 4 lat lon precipitation date_time_start <dbl> <dbl> <dbl> <dttm> 1 -89.95000 -179.95 NA 2020-01-01 2 -89.85000 -179.95 NA 2020-01-01 3 -89.75000 -179.95 NA 2020-01-01 4 -89.64999 -179.95 NA 2020-01-01 5 -89.55000 -179.95 NA 2020-01-01 file_jan <- "file:///home/testlv/x123/sohpc21_r/output/parquet/3B-DAY.MS.MRG.3IMERG.20200101-S000000-E235959.V06.df" df <- read.df(file_jan) head(df, 5)
- 29. PRINT NUMBER OF RECORDS Each dataframe contains approximately 6.5 million records. 6480000 nrow(df)
- 30. AND FOR FEBRUARY A data.frame: 5 × 4 lat lon precipitation date_time_start <dbl> <dbl> <dbl> <dttm> 1 -89.95000 -179.95 NA 2020-01-02 2 -89.85000 -179.95 NA 2020-01-02 3 -89.75000 -179.95 NA 2020-01-02 4 -89.64999 -179.95 NA 2020-01-02 5 -89.55000 -179.95 NA 2020-01-02 file_feb <- "file:///home/testlv/x123/sohpc21_r/output/parquet/3B-DAY.MS.MRG.3IMERG.20200102-S000000-E235959.V06.df" df <- read.df(file_feb) head(df, 5)
- 31. 'S4' SHOW SCHEMA typeof(df) printSchema(df) root |-- lat: double (nullable = true) |-- lon: double (nullable = true) |-- precipitation: double (nullable = true) |-- date_time_start: timestamp (nullable = tr ue)
- 32. Timing for imerg_nc_rds When saving to RDS we get a similar timing. rds_bench <- microbenchmark(times=1, rds <- spark.lapply(file_name, imerg_nc_rds) ) print(rds_bench) Unit: seconds expr min lq mean median rds <- spark.lapply(file_name, imerg_nc_rds) 43.2091 43.2091 43.2091 43.2091 uq max neval 43.2091 43.2091 1 head(rds, 2)
- 33. 1. 'SAVED TO RDS 3B-DAY.MS.MRG.3IMERG.20200101-S000000- E235959.V06.rds' 2. 'SAVED TO RDS 3B-DAY.MS.MRG.3IMERG.20200102-S000000- E235959.V06.rds'
- 34. Recap: SparkR for satellite precipitation data In this demo, we've seen how we leveraged the SparkR lapply function to process files in parallel on a cluster with. The starting point was R sequential code. The performance improvement was linear in the number of cores. Further performance improvements were obtained in subsequent data processing by the use of Parquet format.
- 35. ==> Part 2
- 36. Koalas demo In this example we showcase how to use the Koalas library ( ) to write Pandas- like code that runs on the Spark distributed computation engine. https://koalas.readthedocs.io/en/latest/index.html
- 37. import pandas as pd file = '/home/dataLAB/data/Flugdaten/On_Time_Reporting_Carrier_On_Time_Performance_1987_present_2015_01.csv.g df = pd.read_csv(file) /home/anaconda3.8/envs/py36/lib/python3. 6/site-packages/IPython/core/interactive shell.py:2714: DtypeWarning: Columns (7 7,84,85) have mixed types.Specify dtype option on import or set low_memory=Fals e. interactivity=interactivity, compiler= compiler, result=result)
- 38. Year Quarter Month DayofMonth DayOfWeek FlightDate Reporting_Airline DOT_ID_Reporting_Airline IATA_CODE_Reporting_A 0 2015 1 1 1 4 2015-01-01 AA 19805 1 2015 1 1 2 5 2015-01-02 AA 19805 2 2015 1 1 3 6 2015-01-03 AA 19805 3 2015 1 1 4 7 2015-01-04 AA 19805 4 2015 1 1 5 1 2015-01-05 AA 19805 5 rows × 110 columns df.head()
- 39. DF IS A PANDAS DATAFRAME WITH ~900K ROWS type(df) pandas.core.frame.DataFrame print('Number of Rows: {}'.format(len(df))) Number of Rows: 469968
- 40. Dataset The data is part of the Airline Reporting Carrier On-Time Performance Dataset described in https://dax-cdn.cdn.appdomain.cloud/dax- airline/1.0.1/data-preview/index.html
- 41. AGGREGATE DATA WITH GROUPBY df.groupby('IATA_CODE_Reporting_Airline').size() IATA_CODE_Reporting_Airline AA 44059 AS 13257 B6 21623 DL 64421 EV 49925 F9 6829 HA 6440 MQ 29900 NK 8743
- 42. OO 48114 UA 38395 US 33489 VX 4731 WN 100042 dtype: int64
- 43. The size of df is about 23MB compressed (and double the size uncompressed) !du -sh /home/dataLAB/data/Flugdaten/On_Time_Reporting_Carrier_On_Time_Performance_1987_present_2015_01.csv.g 23M /home/dataLAB/data/Flugdaten/On_ Time_Reporting_Carrier_On_Time_Performan ce_1987_present_2015_01.csv.gz
- 44. Koalas dataframe We're now going to use a Koalas dataframe in place of a Pandas dataframe. This will allow us to use the Spark engine writing Pandas-like code.
- 45. Import Koalas import numpy as np import databricks.koalas as ks from pyspark.sql import SparkSession WARNING:root:'ARROW_PRE_0_15_IPC_FORMAT' environment variable was not set. It is required to set this environment variabl e to '1' in both driver and executor sid es if you use pyarrow>=0.15 and pyspark <3.0. Koalas will set it for you but it does not work if there is a Spark contex t already launched. WARNING:root:'PYARROW_IGNORE_TIMEZONE' e
- 46. nvironment variable was not set. It is r equired to set this environment variable to '1' in both driver and executor sides if you use pyarrow>=2.0.0. Koalas will s et it for you but it does not work if th ere is a Spark context already launched.
- 47. Load data from file In order to read from the local filesystem we need to prepend file:// to the filename. This is because Spark is configured to read from the Hadoop filesystem by default. Year Quarter Month DayofMonth DayOfWeek FlightDate Reporting_Airline DOT_ID_Reporting_Airline IATA_CODE_Reporting_A 0 2015 1 1 1 4 2015-01-01 AA 19805 1 2015 1 1 2 5 2015-01-02 AA 19805 kdf = ks.read_csv('file:///'+file) kdf.head()
- 48. Year Quarter Month DayofMonth DayOfWeek FlightDate Reporting_Airline DOT_ID_Reporting_Airline IATA_CODE_Reporting_A 2 2015 1 1 3 6 2015-01-03 AA 19805 3 2015 1 1 4 7 2015-01-04 AA 19805 4 2015 1 1 5 1 2015-01-05 AA 19805
- 49. kdf.groupby('IATA_CODE_Reporting_Airline').size() IATA_CODE_Reporting_Airline UA 38395 NK 8743 AA 44059 EV 49925 B6 21623 DL 64421 OO 48114 F9 6829 US 33489 MQ 29900 HA 6440
- 50. AS 13257 VX 4731 WN 100042 dtype: int64
- 52. Concatenate two dataframes Koalas implements most Pandas functions. In this example we are using concat . file1 = 'file:///'+ file file2 = 'file:///home/dataLAB/data/Flugdaten/On_Time_Reporting_Carrier_On_Time_Performance_1987_present_2015_ df = pd.concat(map(pd.read_csv, [file1, file2])) kdf = ks.concat(list(map(ks.read_csv, [file1, file2]))) /home/anaconda3.8/envs/py36/lib/python3. 6/site-packages/IPython/core/interactive shell.py:2878: DtypeWarning: Columns (7 7,84,85) have mixed types.Specify dtype option on import or set low_memory=Fals e.
- 53. exec(code_obj, self.user_global_ns, se lf.user_ns) /home/anaconda3.8/envs/py36/lib/python3. 6/site-packages/IPython/core/interactive shell.py:2878: DtypeWarning: Columns (7 7,84) have mixed types.Specify dtype opt ion on import or set low_memory=False. exec(code_obj, self.user_global_ns, se lf.user_ns)
- 54. SHOW TOP 3 DELAYS %%time top3 = df.nlargest(3, 'DepDelay')[["IATA_CODE_Reporting_Airline", "DepDelay"]] CPU times: user 1.08 s, sys: 1.99 s, tot al: 3.08 s Wall time: 3.08 s
- 55. IATA_CODE_Reporting_Airline DepDelay 21523 AA 1988.0 11524 AA 1604.0 340796 AA 1587.0 top3
- 56. IATA_CODE_Reporting_Airline DepDelay 21523 AA 1988.0 11524 AA 1604.0 340796 AA 1587.0 %%time ktop3 = kdf.nlargest(3, 'DepDelay')[["IATA_CODE_Reporting_Airline", "DepDelay"]] CPU times: user 183 ms, sys: 66.8 ms, to tal: 249 ms Wall time: 797 ms ktop3
- 57. Spark computation can be visualized on the Web interface
- 60. PLOT FROM KOALAS DATAFRAME kdf.groupby('IATA_CODE_Reporting_Airline').size().plot.bar() 0 50k 100k 150k 200k variable 0 value
- 61. NK DL US AS WN UA AA EV B6 OO F9 MQ HA VX 0 IATA_CODE_Reporting_Airline
- 62. The Spark SQL API This is a demo for the . We are going to showcase how to use customary SQL queries on the Spark computing engine. Spark SQL API
- 63. Create a Spark session using the Python client pyspark . from pyspark.sql import SparkSession, SQLContext spark = SparkSession.builder .master("yarn") .appName("SparkSQL") .enableHiveSupport() .getOrCreate()
- 64. Load file to a df Spark dataframe. This operation will automatically partition and distribute the data across the cluster. Since we are reading from a local file we need to prefix the filename with 'file://' (default prefix is 'hdfs://' ). file '/home/dataLAB/data/Flugdaten/On_Time_Re porting_Carrier_On_Time_Performance_1987 _present_2015_01.csv.gz'
- 65. df = spark.read.csv('file://'+file, header=True) type(df) pyspark.sql.dataframe.DataFrame
- 66. Filter out some data from the dataframe df df = df.filter('OriginState = "NY"') print('Number of Rows in filtered dataframe: {}'.format(df.count())) Number of Rows in filtered dataframe: 22 298
- 67. Create temporary view df.createOrReplaceTempView("temp_df") result = spark.sql("SELECT DISTINCT OriginCityName FROM temp_df") result.show(truncate=False) +-------------------------+ |OriginCityName | +-------------------------+ |Niagara Falls, NY | |Syracuse, NY | |Plattsburgh, NY | |Islip, NY |
- 68. |White Plains, NY | |Newburgh/Poughkeepsie, NY| |New York, NY | |Buffalo, NY | |Elmira/Corning, NY | |Rochester, NY | |Albany, NY | +-------------------------+
- 69. Count number of recorded flights grouped by origin city spark.sql("SELECT OriginCityName, count(*) as Count FROM temp_df GROUP BY OriginCityName ").show(truncate=False) +-------------------------+-----+ |OriginCityName |Count| +-------------------------+-----+ |Niagara Falls, NY |31 | |Syracuse, NY |463 | |Plattsburgh, NY |31 | |Islip, NY |377 | |White Plains, NY |726 | |Newburgh/Poughkeepsie, NY|62 | |New York, NY |17973|
- 70. |Buffalo, NY |1294 | |Elmira/Corning, NY |162 | |Rochester, NY |610 | |Albany, NY |569 | +-------------------------+-----+
- 73. Why use SQL with Spark? One of the advantages is the automated optimization done by Spark's Catalyst engine. Based on the information about the data and taking advantage of lazy evaluation, Spark can optimize a sequence of transformations. This is completely transparent to the end-user.
- 74. Conclusion We've made a case for distributed computation and shown three demos running on a Hadoop cluster with Spark: • SparkR • Koalas • Spark SQL In these demos one sees how getting started with distributed computations for classes of problems that are inherently parallel can be as straightforward as a few modifications of the existing code.