SlideShare a Scribd company logo
4
Most read
6
Most read
14
Most read
CHAPTER 8:
MULTIPLE REGRESSION ANALYSIS: THE
PROBLEM OF INFERENCE
Course:
ADVANCED QUANTITATIVE TECHNIQUES
Instructor:
DR. REHANA KOUSER
DEPARTMENT OF COMMERCE, B. Z. UNIVERSITY, MULTAN-PAKISTAN
CALCULATING T-STAT
CHAPTER OUTLINE
1. Testing hypotheses about an individual partial regression coefficient
2. Testing the overall significance of the estimated multiple regression model, that is, finding out if all
the partial slope coefficients are simultaneously equal to zero
3. Testing that two or more coefficients are equal to one another
4. Testing that the partial regression coefficients satisfy certain restrictions
5. Testing the stability of the estimated regression model over time or in different crosssectional units
6. 6. Testing the functional form of regression models
HYPOTHESIS TESTING ABOUT INDIVIDUAL REGRESSION
COEFFICIENTS
The null hypothesis states that, with X3 held constant, X2
has no influence on Y.
We follow same two approaches to test these hypotheses:
• First: Confidence Interval Approach
• Second: Test of Significance Approach
TESTING THE OVERALL SIGNIFICANCE OF THE SAMPLE
REGRESSION
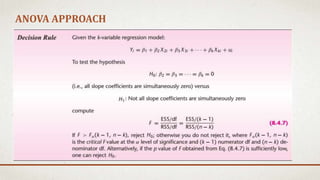
This null hypothesis is a joint hypothesis that β2 and β3 are jointly or simultaneously equal
to zero. A test of such a hypothesis is called a test of the overall significance of the observed or
estimated regression line, that is, whether Yis linearly related to both X2 and X3.
There are two approaches to test this kind of situation:
• ANOVA Approach
• Using R square Approach
ANOVA APPROACH
R SQUARE APPROACH
RELATIONSHIP BETWEEN F AND R SQUARE
THE “INCREMENTAL” OR “MARGINAL” CONTRIBUTION
OF AN EXPLANATORY VARIABLE
• By contribution we mean whether the addition of the variable to the model increases
ESS (and hence R2) “significantly” in relation to the RSS. This contribution may appropriately be
called the incremental, or marginal, contribution of an explanatory variable.
WHEN TO ADD NEW VARIABLE(S)?
When to add new variable?
• A formal method of deciding whether a variable should be added to a regression model. Often
researchers are faced with the task of choosing from several competing models involving the same
dependent variable but with different explanatory variables.
• Therefore, if the inclusion of a variable increases R¯ 2, it is retained in the model although it does
not reduce RSS significantly in the statistical sense.
When to Add a Group of Variables?
• If adding (dropping) a group of variables to the model gives an F value greater (less) than 1, R2 will
increase (decrease). One can easily find out whether the addition (subtraction) of a group of
variables significantly increases (decreases) the explanatory
power of a regression model.
TESTING THE EQUALITY OF TWO REGRESSION
COEFFICIENTS
TESTING RESTRICTIONS
TESTING RESTRICTIONS: T-STAT APPROACH
TESTING FOR STRUCTURAL OR PARAMETER STABILITY OF
REGRESSION MODELS: THE CHOW TEST
• When we use a regression model involving time series data, it may happen that there is a
structural change in the relationship between the regressand Y and the regressors.
CHOW TEST
TESTING THE FUNCTIONAL FORM OF REGRESSION: CHOOSING
BETWEEN LINEAR AND LOG–LINEAR REGRESSION MODELS
• The choice between a linear regression model (the regressand is a linear function of the
regressors) or a log–linear regression model (the log of the regressand is a function of the
logs of the regressors) is a perennial question in empirical analysis. We can use a test proposed by
MacKinnon, White, and Davidson, which for brevity we call the MWD test, to
choose between the two models.
TESTING THE FUNCTIONAL FORM OF REGRESSION: CHOOSING
BETWEEN LINEAR AND LOG–LINEAR REGRESSION MODELS
TESTING THE FUNCTIONAL FORM OF REGRESSION: CHOOSING
BETWEEN LINEAR AND LOG–LINEAR REGRESSION MODELS
• If the linear model is in fact the correct model, the constructed variable Z1 should not be
statistically significant in Step IV, for in that case the estimated Y values from the linear model and
those estimated from the log–linear model (after taking their antilog values for comparative
purposes) should not be different. The same comment applies to the alternative hypothesis H1.

More Related Content

What's hot (20)

PPTX
Heteroscedasticity
Geethu Rangan
 
PPTX
Tobin’s q theory
Sana Hassan Afridi
 
PPTX
Mundell fleming model
sammysammysammy
 
PPTX
Dummy variables
Irfan Hussain
 
PPTX
General equilibrium theory
kevalkakadiya
 
PPTX
Harrod domar model of growth
ManojSharma968
 
PPTX
Chapter 07 - Autocorrelation.pptx
Farah Amir
 
PPTX
Identification problem in simultaneous equations model
GarimaGupta229
 
PPT
MACROECONOMICS-CH4
kkjjkevin03
 
PPTX
ders 6 Panel data analysis.pptx
Ergin Akalpler
 
PPTX
Basics of growth accounting
TaranathAdhikari
 
PPTX
New keynesian economics
Sana Hassan Afridi
 
PDF
Lecture 7 - Endogenous growth theory
UNU.MERIT
 
PPTX
Revealed preference theory.docx
Satya Narayana
 
PPSX
Baumol's model of demand for money
Prabha Panth
 
PDF
Panel data
Saltanat Onalkhanova
 
PPT
Econometrics ch2
Baterdene Batchuluun
 
PDF
Chapter8
Vu Vo
 
PPTX
Specification Errors | Eonomics
Transweb Global Inc
 
PPTX
Solow model of growth
Anmol Kumar Sharma
 
Heteroscedasticity
Geethu Rangan
 
Tobin’s q theory
Sana Hassan Afridi
 
Mundell fleming model
sammysammysammy
 
Dummy variables
Irfan Hussain
 
General equilibrium theory
kevalkakadiya
 
Harrod domar model of growth
ManojSharma968
 
Chapter 07 - Autocorrelation.pptx
Farah Amir
 
Identification problem in simultaneous equations model
GarimaGupta229
 
MACROECONOMICS-CH4
kkjjkevin03
 
ders 6 Panel data analysis.pptx
Ergin Akalpler
 
Basics of growth accounting
TaranathAdhikari
 
New keynesian economics
Sana Hassan Afridi
 
Lecture 7 - Endogenous growth theory
UNU.MERIT
 
Revealed preference theory.docx
Satya Narayana
 
Baumol's model of demand for money
Prabha Panth
 
Econometrics ch2
Baterdene Batchuluun
 
Chapter8
Vu Vo
 
Specification Errors | Eonomics
Transweb Global Inc
 
Solow model of growth
Anmol Kumar Sharma
 

Similar to Econometrics chapter 8 (20)

PDF
Linear regression
Learnbay Datascience
 
PPTX
Data-Analysis.pptx
RobertRevamonte1
 
PPTX
Research methodology Regression Modeling.pptx
keshavkumar403723
 
PPT
A presentation for Multiple linear regression.ppt
vigia41
 
PPTX
Regression analysis - Estimation of relationships between the variables
Subramani Parasuraman
 
PPTX
An Introduction to Regression Models: Linear and Logistic approaches
Bhanu Yadav
 
PPTX
A Topic on REGRESSION Analysis conducted pptx
zeusrex4815162342
 
PDF
7. logistics regression using spss
Dr Nisha Arora
 
PPTX
Regression Analysis
Salim Azad
 
PPTX
Artifical Intelligence And Machine Learning Algorithum.pptx
Aishwarya SenthilNathan
 
PPTX
Applications of regression analysis - Measurement of validity of relationship
Rithish Kumar
 
PPT
Regression analysis ppt
Elkana Rorio
 
PPTX
Logistic regression
DrZahid Khan
 
PDF
Stepwise, Multiple and Cluster regression.pdf
GOLDY SINGH
 
PPT
regression.ppt
syedmirsyed
 
PPTX
Machine Learning Unit 3 Semester 3 MSc IT Part 2 Mumbai University
Madhav Mishra
 
PDF
Asset Relationship - CH 8 - Regression | CMT Level 3 | Chartered Market Techn...
Professional Training Academy
 
PPT
604_multiplee.ppt
Rufesh
 
PPTX
Simple Linear Regression.pptx helloooooo
ishwarayachak1
 
Linear regression
Learnbay Datascience
 
Data-Analysis.pptx
RobertRevamonte1
 
Research methodology Regression Modeling.pptx
keshavkumar403723
 
A presentation for Multiple linear regression.ppt
vigia41
 
Regression analysis - Estimation of relationships between the variables
Subramani Parasuraman
 
An Introduction to Regression Models: Linear and Logistic approaches
Bhanu Yadav
 
A Topic on REGRESSION Analysis conducted pptx
zeusrex4815162342
 
7. logistics regression using spss
Dr Nisha Arora
 
Regression Analysis
Salim Azad
 
Artifical Intelligence And Machine Learning Algorithum.pptx
Aishwarya SenthilNathan
 
Applications of regression analysis - Measurement of validity of relationship
Rithish Kumar
 
Regression analysis ppt
Elkana Rorio
 
Logistic regression
DrZahid Khan
 
Stepwise, Multiple and Cluster regression.pdf
GOLDY SINGH
 
regression.ppt
syedmirsyed
 
Machine Learning Unit 3 Semester 3 MSc IT Part 2 Mumbai University
Madhav Mishra
 
Asset Relationship - CH 8 - Regression | CMT Level 3 | Chartered Market Techn...
Professional Training Academy
 
604_multiplee.ppt
Rufesh
 
Simple Linear Regression.pptx helloooooo
ishwarayachak1
 
Ad

Recently uploaded (20)

PDF
Zoology (Animal Physiology) practical Manual
raviralanaresh2
 
PDF
BÀI TẬP BỔ TRỢ TIẾNG ANH 8 - GLOBAL SUCCESS - CẢ NĂM - NĂM 2024 (VOCABULARY, ...
Nguyen Thanh Tu Collection
 
PDF
LAW OF CONTRACT ( 5 YEAR LLB & UNITARY LLB)- MODULE-3 - LEARN THROUGH PICTURE
APARNA T SHAIL KUMAR
 
PPTX
Views on Education of Indian Thinkers J.Krishnamurthy..pptx
ShrutiMahanta1
 
PPTX
How to Manage Large Scrollbar in Odoo 18 POS
Celine George
 
DOCX
A summary of SPRING SILKWORMS by Mao Dun.docx
maryjosie1
 
PPTX
Soil and agriculture microbiology .pptx
Keerthana Ramesh
 
PPTX
ASRB NET 2023 PREVIOUS YEAR QUESTION PAPER GENETICS AND PLANT BREEDING BY SAT...
Krashi Coaching
 
PPTX
How to Create Rental Orders in Odoo 18 Rental
Celine George
 
PPTX
Growth and development and milestones, factors
BHUVANESHWARI BADIGER
 
PDF
community health nursing question paper 2.pdf
Prince kumar
 
PPTX
How to Configure Access Rights of Manufacturing Orders in Odoo 18 Manufacturing
Celine George
 
PPTX
HYDROCEPHALUS: NURSING MANAGEMENT .pptx
PRADEEP ABOTHU
 
PDF
1, 2, 3… E MAIS UM CICLO CHEGA AO FIM!.pdf
Colégio Santa Teresinha
 
PPTX
2025 Winter SWAYAM NPTEL & A Student.pptx
Utsav Yagnik
 
PDF
DIGESTION OF CARBOHYDRATES,PROTEINS,LIPIDS
raviralanaresh2
 
PPTX
PPT on the Development of Education in the Victorian England
Beena E S
 
PPTX
Capitol Doctoral Presentation -July 2025.pptx
CapitolTechU
 
PDF
IMP NAAC REFORMS 2024 - 10 Attributes.pdf
BHARTIWADEKAR
 
PPTX
Unit 2 COMMERCIAL BANKING, Corporate banking.pptx
AnubalaSuresh1
 
Zoology (Animal Physiology) practical Manual
raviralanaresh2
 
BÀI TẬP BỔ TRỢ TIẾNG ANH 8 - GLOBAL SUCCESS - CẢ NĂM - NĂM 2024 (VOCABULARY, ...
Nguyen Thanh Tu Collection
 
LAW OF CONTRACT ( 5 YEAR LLB & UNITARY LLB)- MODULE-3 - LEARN THROUGH PICTURE
APARNA T SHAIL KUMAR
 
Views on Education of Indian Thinkers J.Krishnamurthy..pptx
ShrutiMahanta1
 
How to Manage Large Scrollbar in Odoo 18 POS
Celine George
 
A summary of SPRING SILKWORMS by Mao Dun.docx
maryjosie1
 
Soil and agriculture microbiology .pptx
Keerthana Ramesh
 
ASRB NET 2023 PREVIOUS YEAR QUESTION PAPER GENETICS AND PLANT BREEDING BY SAT...
Krashi Coaching
 
How to Create Rental Orders in Odoo 18 Rental
Celine George
 
Growth and development and milestones, factors
BHUVANESHWARI BADIGER
 
community health nursing question paper 2.pdf
Prince kumar
 
How to Configure Access Rights of Manufacturing Orders in Odoo 18 Manufacturing
Celine George
 
HYDROCEPHALUS: NURSING MANAGEMENT .pptx
PRADEEP ABOTHU
 
1, 2, 3… E MAIS UM CICLO CHEGA AO FIM!.pdf
Colégio Santa Teresinha
 
2025 Winter SWAYAM NPTEL & A Student.pptx
Utsav Yagnik
 
DIGESTION OF CARBOHYDRATES,PROTEINS,LIPIDS
raviralanaresh2
 
PPT on the Development of Education in the Victorian England
Beena E S
 
Capitol Doctoral Presentation -July 2025.pptx
CapitolTechU
 
IMP NAAC REFORMS 2024 - 10 Attributes.pdf
BHARTIWADEKAR
 
Unit 2 COMMERCIAL BANKING, Corporate banking.pptx
AnubalaSuresh1
 
Ad

Econometrics chapter 8

  • 1. CHAPTER 8: MULTIPLE REGRESSION ANALYSIS: THE PROBLEM OF INFERENCE Course: ADVANCED QUANTITATIVE TECHNIQUES Instructor: DR. REHANA KOUSER DEPARTMENT OF COMMERCE, B. Z. UNIVERSITY, MULTAN-PAKISTAN
  • 3. CHAPTER OUTLINE 1. Testing hypotheses about an individual partial regression coefficient 2. Testing the overall significance of the estimated multiple regression model, that is, finding out if all the partial slope coefficients are simultaneously equal to zero 3. Testing that two or more coefficients are equal to one another 4. Testing that the partial regression coefficients satisfy certain restrictions 5. Testing the stability of the estimated regression model over time or in different crosssectional units 6. 6. Testing the functional form of regression models
  • 4. HYPOTHESIS TESTING ABOUT INDIVIDUAL REGRESSION COEFFICIENTS The null hypothesis states that, with X3 held constant, X2 has no influence on Y. We follow same two approaches to test these hypotheses: • First: Confidence Interval Approach • Second: Test of Significance Approach
  • 5. TESTING THE OVERALL SIGNIFICANCE OF THE SAMPLE REGRESSION This null hypothesis is a joint hypothesis that β2 and β3 are jointly or simultaneously equal to zero. A test of such a hypothesis is called a test of the overall significance of the observed or estimated regression line, that is, whether Yis linearly related to both X2 and X3. There are two approaches to test this kind of situation: • ANOVA Approach • Using R square Approach
  • 8. RELATIONSHIP BETWEEN F AND R SQUARE
  • 9. THE “INCREMENTAL” OR “MARGINAL” CONTRIBUTION OF AN EXPLANATORY VARIABLE • By contribution we mean whether the addition of the variable to the model increases ESS (and hence R2) “significantly” in relation to the RSS. This contribution may appropriately be called the incremental, or marginal, contribution of an explanatory variable.
  • 10. WHEN TO ADD NEW VARIABLE(S)? When to add new variable? • A formal method of deciding whether a variable should be added to a regression model. Often researchers are faced with the task of choosing from several competing models involving the same dependent variable but with different explanatory variables. • Therefore, if the inclusion of a variable increases R¯ 2, it is retained in the model although it does not reduce RSS significantly in the statistical sense. When to Add a Group of Variables? • If adding (dropping) a group of variables to the model gives an F value greater (less) than 1, R2 will increase (decrease). One can easily find out whether the addition (subtraction) of a group of variables significantly increases (decreases) the explanatory power of a regression model.
  • 11. TESTING THE EQUALITY OF TWO REGRESSION COEFFICIENTS
  • 15. TESTING FOR STRUCTURAL OR PARAMETER STABILITY OF REGRESSION MODELS: THE CHOW TEST • When we use a regression model involving time series data, it may happen that there is a structural change in the relationship between the regressand Y and the regressors.
  • 17. TESTING THE FUNCTIONAL FORM OF REGRESSION: CHOOSING BETWEEN LINEAR AND LOG–LINEAR REGRESSION MODELS • The choice between a linear regression model (the regressand is a linear function of the regressors) or a log–linear regression model (the log of the regressand is a function of the logs of the regressors) is a perennial question in empirical analysis. We can use a test proposed by MacKinnon, White, and Davidson, which for brevity we call the MWD test, to choose between the two models.
  • 18. TESTING THE FUNCTIONAL FORM OF REGRESSION: CHOOSING BETWEEN LINEAR AND LOG–LINEAR REGRESSION MODELS
  • 19. TESTING THE FUNCTIONAL FORM OF REGRESSION: CHOOSING BETWEEN LINEAR AND LOG–LINEAR REGRESSION MODELS • If the linear model is in fact the correct model, the constructed variable Z1 should not be statistically significant in Step IV, for in that case the estimated Y values from the linear model and those estimated from the log–linear model (after taking their antilog values for comparative purposes) should not be different. The same comment applies to the alternative hypothesis H1.