SlideShare a Scribd company logo
Empowering	
  Business	
  Users:	
  	
  
OBIEE	
  12c	
  Visual	
  Analyzer	
  &	
  	
  
Data	
  Mashup
Edelweiss	
  Kammermann
UKOUG	
  Annual	
  Conference	
  	
  -­‐	
  Birmingham-­‐	
  	
  December	
  2015
Edelweiss	
  Kammermann
• Computer	
  engineer,	
  BI	
  and	
  Data	
  Integration	
  specialist	
  with	
  over	
  18	
  years	
  of	
  consulting	
  and	
  project	
  
management	
  experience	
  in	
  Oracle	
  technology.	
  
• Co-­‐founder	
  and	
  Vice	
  President	
  of	
  	
  Uruguayan	
  Oracle	
  User	
  Group	
  (UYOUG)	
  	
  
• Business	
  Intelligence	
  articles	
  published	
  on	
  OTN	
  site	
  
• Frequent	
  speaker	
  at	
  international	
  conferences	
  as	
  Collaborate,	
  OTN	
  Tour	
  LA,	
  	
  UKOUG	
  Annual	
  
Conference,	
  OOW	
  and	
  Rittman	
  Mead	
  BI	
  Forum	
  
• Oracle	
  ACE	
  
email:	
  edelweisskf09@gmail.com	


TwiZer:	
  @EdelweissK
Uruguay
Agenda
• New	
  OBIEE	
  12c	
  Front-­‐End	
  Features	
  	
  
• Visual	
  Analyzer	
  
• BI	
  Ask	
  
• Data	
  Mashups	


Visual	
  Analyzer
• Visual	
  Analyzer	
  is	
  a	
  very	
  intuitive	
  and	
  interactive	
  web-­‐based	
  tool	
  to	
  explore	
  and	
  analyse	
  your	
  data	
  
• Part	
  of	
  the	
  new	
  front-­‐end	
  features	
  of	
  OBIEE	
  12c	
  along	
  with	
  Data	
  Mashups	
  
• It	
  was	
  available	
  first	
  in	
  the	
  Oracle	
  BI	
  Cloud	
  Service	
  (OBICS)	
  
• Self-­‐service	
  oriented	


Visual	
  Analyzer
• Visual	
  Analyzer	
  allows	
  you	
  to	
  create	
  different	
  analyses	
  or	
  reports	
  in	
  the	
  same	
  place	
  (like	
  a	
  
combination	
  of	
  Answers	
  and	
  Dashboards)	
  
• Just	
  dragging	
  and	
  dropping	
  the	
  columns	
  (or	
  double-­‐click	
  them)	
  from	
  the	
  Data	
  Elements	
  Panel	
  
• Offers	
  interactive	
  visualisations	
  
• Showing	
  the	
  results	
  immediately	
  	
  
in	
  the	
  same	
  page	
  
• A	
  complement	
  to	
  Answers	
  and	
  
Dashboards	
  for	
  data	
  exploration	
  and	
  
discovery	
  patterns	
  
Creating	
  Analyses	
  with	
  OBIEE	
  Step	
  1:	
  Define	
  Criteria
• To	
  create	
  an	
  Analysis	
  in	
  OBIEE	
  we	
  first	
  define	
  the	
  Criteria	
  
• Select	
  the	
  Subject	
  Area	
  
• Select	
  the	
  required	
  columns	
  
• Create	
  filters,	
  calculated	
  columns,	
  etc.	


Creating	
  Analyses	
  with	
  OBIEE	
  Step	
  2:	
  See	
  the	
  Results
• Then,	
  see	
  the	
  data	
  in	
  the	
  Result	
  tab	
  
• Add	
  data	
  visualisations	


Define	
  the	
  Content	
  and	
  See	
  the	
  Results	
  in	
  Visual	
  Analyzer
• In	
  Visual	
  Analyzer	
  you	
  define	
  the	
  content	
  and	
  see	
  the	
  results	
  immediately	
  in	
  the	
  same	
  place.	


Visual	
  Analyzer	
  Login
• Visual	
  Analyzer	
  can	
  be	
  called	
  from	
  the	
  OBIEE	
  12c	
  Home	
  Page	
  or	
  from	
  the	
  Visual	
  Analyzer	
  URL.	


Visual	
  Analyzer	
  Projects
• Visual	
  Analyzer	
  (VA)	
  Projects	
  are	
  composed	
  of	
  one	
  
or	
  more	
  Visualizations	
  
• Each	
  visualization	
  can	
  have	
  
• Different	
  Content	
  
• Different	
  Visualization	
  type	
  (Graph,	
  Table,	
  
Scatter,	
  Map,	
  etc.)	
  
• The	
  first	
  time	
  that	
  you	
  drag	
  columns	
  onto	
  the	
  
empty	
  canvas,	
  a	
  visualization	
  is	
  automatically	
  
created.	
  
Creating	
  VA	
  Projects	
  Step	
  1:	
  Select	
  the	
  Source
• To	
  start	
  creating	
  VA	
  Projects	
  we	
  need	
  
first	
  to	
  select	
  the	
  source.	
  
• The	
  source	
  for	
  a	
  VA	
  Project	
  could	
  be:	
  
• A	
  Subject	
  Area	
  (from	
  the	
  RPD	
  -­‐	
  
Common	
  Enterprise	
  Model	
  
Information)	
  
• A	
  Data	
  File	
  (Excel	
  file)	
  already	
  
uploaded	
  
• A	
  new	
  Excel	
  File	
  to	
  upload	
  
Creating	
  VA	
  Projects	
  Step	
  2:	
  Select	
  Content
• To	
  select	
  content	
  you	
  can	
  either:	
  
• Double-­‐click	
  on	
  the	
  columns	
  from	
  the	
  Data	
  Elements	
  panel	
  
• Drag-­‐and-­‐drop	
  the	
  columns	
  
- Ctrl-­‐click	
  can	
  be	
  used	
  to	
  select	
  many	
  columns	


Creating	
  VA	
  Projects	
  Step	
  3:	
  Setting	
  Visualization	
  Type
• Visual	
  Analyzer	
  will	
  choose	
  the	
  best	
  
visualisation	
  type	
  depending	
  on	
  the	
  
selected	
  data	
  
• This	
  visualisation	
  type	
  can	
  be	
  changed.	


Adding	
  More	
  Visualizations
• More	
  Visualizations	
  can	
  be	
  added	
  In	
  VA	
  to	
  show	
  the	
  same	
  or	
  different	
  data	
  like	
  a	
  Dashboard	
  
• Create	
  a	
  New	
  Visualization	
  from	
  the	
  VA	
  Toolbar	
  and	
  select	
  the	
  content	
  for	
  it	
  
• Duplicate	
  an	
  existing	
  one	
  using	
  Copy/Paste	
  Visualization	
  options	
  in	
  the	
  Visualization	
  Menu	


Rearranging	
  the	
  Visualizations	
  in	
  a	
  VA	
  Project
• Visualizations	
  can	
  be	
  rearranged	
  just	
  
dragging	
  and	
  dropping	
  on	
  the	
  VA	
  canvas	
  
• Can	
  be	
  also	
  resized	
  	
  
• Visualization	
  properties	
  allows	
  to	
  
• Modify	
  the	
  visualisation	
  titles,	
  axis	
  titles	
  
in	
  case	
  of	
  graphs,	
  etc.	
  
• Change	
  the	
  default	
  aggregation	
  for	
  
measures	


Filtering	
  the	
  Data	
  in	
  Visual	
  Analyzer
• The	
  data	
  can	
  be	
  filtered	
  either:	
  
• explicitly	
  selecting	
  one	
  or	
  more	
  columns	
  and	
  creating	
  the	
  conditions	
  in	
  the	
  Filter	
  area	
  
• selecting	
  data	
  in	
  a	
  visualisation	
  and	
  use	
  the	
  Keep	
  Selection	
  option	


Filtering	
  the	
  Data	
  in	
  Visual	
  Analyzer
• By	
  default	
  the	
  filters	
  apply	
  to	
  all	
  the	
  visualizations	
  in	
  the	
  project	
  
• To	
  change	
  this,	
  uncheck	
  the	
  option	
  Synchronize	
  Visualizations	
  in	
  the	
  VA	
  Project	
  Properties	


Creating	
  Calculations
• Calculations	
  can	
  be	
  added	
  in	
  Visual	
  Analyzer	
  
• Wide	
  variety	
  of	
  Functions	
  with	
  detailed	
  help	
  as	
  in	
  BI	
  Answers	
  
• Columns	
  can	
  be	
  added	
  double-­‐clicking	
  on	
  them	
  in	
  the	
  Data	
  Elements	
  Panel	


Important	
  differences	
  between	
  VA	
  and	
  Answers
• Some	
  of	
  the	
  most	
  complex	
  features	
  that	
  are	
  present	
  in	
  Answers	
  are	
  not	
  allowed	
  In	
  VA:	
  
• VA	
  cannot	
  work	
  with	
  Hierarchy	
  columns	
  or	
  groups	
  
• The	
  calculated	
  measures	
  that	
  we	
  created	
  in	
  Answers	
  and	
  save	
  in	
  the	
  catalog	
  cannot	
  be	
  
referenced	
  in	
  VA.	
  
• VA	
  Projects	
  cannot	
  be	
  included	
  in	
  Dashboards	


BI	
  Ask
• A	
  search	
  based	
  infrastructure	
  that	
  comes	
  with	
  Visual	
  Analyzer	
  
• BI	
  Ask	
  allows	
  creation	
  of	
  content	
  based	
  on	
  text	
  interaction	
  
• Based	
  on	
  Lucene	
  search	
  technology	
  (http://lucene.apache.org)	
  
• In	
  Android	
  and	
  iOS	
  mobiles	
  the	
  user	
  can	
  literally	
  talk	
  the	
  keywords	
  to	
  get	
  specific	
  results	
  (i.e	
  
Revenue	
  by	
  product)	


Creating	
  Content	
  with	
  BI	
  Ask
• Enter	
  the	
  keyword	
  for	
  the	
  columns	
  that	
  you	
  want	
  to	
  include	
  in	
  the	
  visualization	
  
• For	
  example	
  start	
  searching	
  for	
  the	
  name	
  of	
  a	
  measure	
  
• Then	
  add	
  dimension	
  column	
  names	
  
• You	
  can	
  also	
  enter	
  the	
  name	
  of	
  the	
  visualization	
  type	
  as	
  Graph,	
  Table,	
  etc.	


Save	
  the	
  Visualization	
  Created	
  with	
  BI	
  Ask
• The	
  visualization	
  created	
  by	
  BI	
  Ask	
  can	
  be	
  opened	
  in	
  Visual	
  Analyzer	
  in	
  order	
  to	
  	
  
• Perform	
  more	
  detailed	
  configurations	
  
• Save	
  it	
  to	
  the	
  catalog	
  as	
  a	
  VA	
  Project	


Data	
  Mashups
• More	
  sources	
  can	
  be	
  added	
  in	
  a	
  VA	
  Project	
  with	
  
some	
  restrictions:	
  
• These	
  sources	
  should	
  be	
  connected	
  
• Only	
  one	
  of	
  these	
  sources	
  could	
  be	
  a	
  Subject	
  
Area	
  
• Data	
  Mashup	
  is	
  the	
  process	
  to	
  connect	
  or	
  relate	
  
two	
  or	
  more	
  sources	
  in	
  OBIEE	
  12c	
  
• Gives	
  flexibility	
  to	
  the	
  business	
  users	
  to	
  merge	
  
their	
  own	
  data	
  with	
  the	
  RPD	
  Subject	
  Area.	
  
• Available	
  in	
  Visual	
  Analyzer	
  a	
  well	
  as	
  in	
  Answers	


Data	
  Mashups	
  Step	
  1:	
  Adding	
  New	
  Data	
  Source
• Press	
  the	
  Add	
  Data	
  Source	
  link	
  located	
  at	
  the	
  bottom	
  of	
  the	
  Data	
  Elements	
  Panel	
  
• Select	
  existent	
  data	
  file	
  or	
  upload	
  a	
  new	
  one	


Data	
  Mashups	
  Step	
  2:	
  Create	
  the	
  Matching	
  Criteria
• Once	
  you	
  selected	
  the	
  Excel	
  file	
  to	
  upload,OBIEE	
  12c	
  will	
  try	
  to	
  match	
  the	
  columns	
  from	
  the	
  Excel	
  
file	
  with	
  the	
  columns	
  from	
  the	
  Subject	
  Area	
  that	
  have	
  the	
  same	
  name.	
  
• This	
  can	
  be	
  manually	
  changed.	
  
• A	
  file	
  column	
  can	
  be	
  a	
  match,	
  an	
  attribute	
  or	
  a	
  measure	


Data	
  Mashups	
  Step	
  3:	
  Set	
  the	
  Purpose	
  of	
  the	
  File	
  Data
• The	
  purpose	
  of	
  this	
  new	
  File	
  Data	
  could	
  be	
  
either:	
  
• To	
  Add	
  Facts	
  adding	
  new	
  measures	
  
• To	
  Extend	
  a	
  Dimension,	
  adding	
  new	
  attributes	
  
to	
  an	
  existing	
  dimension	


Data	
  Mashups	
  Step	
  4:	
  Use	
  Both	
  Data	
  Sources
• Visualizations	
  can	
  be	
  created	
  using	
  
columns	
  from	
  both	
  Data	
  Sources	
  added	
  
in	
  the	
  VA	
  Project	


Sharing	
  and	
  Security	
  in	
  Visual	
  Analyzer
• A	
  Visual	
  Analyzer	
  project	
  can	
  be	
  shared	
  and	
  as	
  any	
  other	
  object	
  in	
  the	
  Web	
  Catalog	
  
• When	
  a	
  VA	
  Project	
  that	
  contains	
  a	
  excel	
  file	
  as	
  a	
  source	
  is	
  shared	
  with	
  traverse	
  or	
  modify	
  
permissions:	
  
• The	
  excel	
  file	
  is	
  also	
  shared	
  and	
  can	
  be	
  available	
  for	
  used	
  in	
  a	
  new	
  VA	
  project.	


Manage	
  External	
  Data	
  Sources
• A	
  external	
  data	
  source	
  (excel	
  file)	
  can	
  be	
  	
  
• Removed	
  from	
  a	
  specific	
  project	
  
• Deleted	
  from	
  the	
  storage	
  
• Downloaded	
  to	
  a	
  local	
  folder	
  
• Reloaded	
  to	
  update	
  the	
  data
Conclusions
• Visual	
  Analyzer	
  is	
  a	
  very	
  intuitive	
  and	
  interactive	
  web-­‐based	
  tool	
  for	
  
• self-­‐service	
  reporting	
  
• data	
  exploration	
  
• data	
  discovery	
  
• A	
  complement	
  to	
  Answers/Dashboards	
  oriented	
  to	
  Business	
  User	
  for	
  quick	
  and	
  easy	
  data	
  
analysis	
  	
  
• More	
  flexibility	
  with	
  Data	
  Mashups	
  and	
  BI	
  Ask	
  	
  
• Data	
  Mashup	
  allows	
  Business	
  users	
  to	
  merge	
  their	
  own	
  data	
  with	
  the	
  corporate	
  data	
  (Subject	
  
Areas)	
  
• BI	
  Ask	
  creates	
  content	
  based	
  on	
  keywords	
  	
  
Further	
  Information
• OBIEE	
  12c	
  download	
  page	
  in	
  OTN	
  
• http://www.oracle.com/technetwork/middleware/bi-­‐enterprise-­‐edition/downloads/business-­‐
intelligence-­‐2717951.html	
  
• ORACLE	
  BI	
  TECHDEMO	
  Youtube	
  Channel	
  
• https://www.youtube.com/channel/UCXpjKAy010SDUXmAA67DILg	
  
• Graph	
  Selection	
  Matrix	
  by	
  Stephen	
  Few	
  
• http://www.perceptualedge.com/articles/misc/Graph_Selection_Matrix.pdf	
  
Q	
  &	
  A
Thanks	
  for	
  attending!
email:	
  edelweisskf09@gmail.com	
  
TwiZer:	
  @EdelweissK

More Related Content

What's hot (20)

PPTX
Business intelligence
Aditya Vichare
 
PPTX
Java Sending mail
Thao Ho
 
PPTX
Multimedia database
SumitKeshri10
 
PPTX
Data flow diagram
Nidhi Sharma
 
PPTX
What is ETL?
Ismail El Gayar
 
PPTX
An introduction to Business intelligence
Hadi Fadlallah
 
PPTX
Baan erp(ENTERPRISE RESOURCE PLANNING) PRESENTATION made by priyansh kesarwani
Priyansh Kesarwani
 
PDF
Data cube
Hitesh Mohapatra
 
PDF
Data Mining and Business Intelligence Tools
Motaz Saad
 
PPTX
Business intelligence
Randy L. Archambault
 
PDF
Data Mining & Data Warehousing Lecture Notes
FellowBuddy.com
 
PPTX
Software Engineering
JayaKamal
 
PPTX
Deductive databases
Dabbal Singh Mahara
 
PPT
Medical center using Data warehousing
Saleem Almaqashi
 
PPTX
Business intelligence ppt
sujithkylm007
 
PPTX
Object oriented modeling and design
jayashri kolekar
 
PPT
OLAP
Ashir Ali
 
PPT
CORBA.ppt
rameshwarchintamani
 
PPTX
Hand gesture recognition
bakhti rahman
 
PPTX
Component and Deployment Diagram - Brief Overview
Rajiv Kumar
 
Business intelligence
Aditya Vichare
 
Java Sending mail
Thao Ho
 
Multimedia database
SumitKeshri10
 
Data flow diagram
Nidhi Sharma
 
What is ETL?
Ismail El Gayar
 
An introduction to Business intelligence
Hadi Fadlallah
 
Baan erp(ENTERPRISE RESOURCE PLANNING) PRESENTATION made by priyansh kesarwani
Priyansh Kesarwani
 
Data cube
Hitesh Mohapatra
 
Data Mining and Business Intelligence Tools
Motaz Saad
 
Business intelligence
Randy L. Archambault
 
Data Mining & Data Warehousing Lecture Notes
FellowBuddy.com
 
Software Engineering
JayaKamal
 
Deductive databases
Dabbal Singh Mahara
 
Medical center using Data warehousing
Saleem Almaqashi
 
Business intelligence ppt
sujithkylm007
 
Object oriented modeling and design
jayashri kolekar
 
OLAP
Ashir Ali
 
Hand gesture recognition
bakhti rahman
 
Component and Deployment Diagram - Brief Overview
Rajiv Kumar
 

Viewers also liked (20)

PPTX
OBIEE 11.1.1.7: Upgrade y Nuevas Características
Edelweiss Kammermann
 
PDF
New Features in OBIEE 12c
Michelle Kolbe
 
PDF
Data Visualization Tips for Oracle BICS and DVCS
Edelweiss Kammermann
 
PDF
OBIEE 12c Advanced Analytic Functions
Michael Perhats
 
PPTX
Upgrading To OBIEE 12C - Key Things Your Need To Know About
Geraint Thomas
 
PPTX
Obiee 12c: Look under the bonnet and test drive
Guillaume Slee
 
PPTX
OBIEE ARCHITECTURE.ppt
Canara bank
 
PPT
Building Oracle BIEE (OBIEE) Reports, Dashboards
iWare Logic Technologies Pvt. Ltd.
 
PPT
obiee basics ppt
rajtrainings
 
PPTX
Oracle business intelligence overview
nvvrajesh
 
PDF
Migración Discoverer a Oracle BI
avanttic Consultoría Tecnológica
 
PDF
OBIEE12c and Embedded Essbase 12c - An Initial Look at Query Acceleration Use...
Mark Rittman
 
DOCX
Introduction to oracle bi 12c
onlinetrainingplacements
 
PDF
Oracle Bi Overview
am100038
 
PDF
Enabling Self Service BI for OBIEE using Tableau
BI Connector
 
PDF
Nuevas Herramientas de Business Intelligence de Oracle
avanttic Consultoría Tecnológica
 
PPTX
But how do I GET the data? Transparency Camp 2014
Jeffrey Quigley
 
PDF
Leveraging Hadoop with OBIEE 11g and ODI 11g - UKOUG Tech'13
Mark Rittman
 
PPTX
Incredible ODI tips to work with Hyperion tools that you ever wanted to know
Rodrigo Radtke de Souza
 
PDF
Oracle BI Hybrid BI : Mode 1 + Mode 2, Cloud + On-Premise Business Analytics
Mark Rittman
 
OBIEE 11.1.1.7: Upgrade y Nuevas Características
Edelweiss Kammermann
 
New Features in OBIEE 12c
Michelle Kolbe
 
Data Visualization Tips for Oracle BICS and DVCS
Edelweiss Kammermann
 
OBIEE 12c Advanced Analytic Functions
Michael Perhats
 
Upgrading To OBIEE 12C - Key Things Your Need To Know About
Geraint Thomas
 
Obiee 12c: Look under the bonnet and test drive
Guillaume Slee
 
OBIEE ARCHITECTURE.ppt
Canara bank
 
Building Oracle BIEE (OBIEE) Reports, Dashboards
iWare Logic Technologies Pvt. Ltd.
 
obiee basics ppt
rajtrainings
 
Oracle business intelligence overview
nvvrajesh
 
Migración Discoverer a Oracle BI
avanttic Consultoría Tecnológica
 
OBIEE12c and Embedded Essbase 12c - An Initial Look at Query Acceleration Use...
Mark Rittman
 
Introduction to oracle bi 12c
onlinetrainingplacements
 
Oracle Bi Overview
am100038
 
Enabling Self Service BI for OBIEE using Tableau
BI Connector
 
Nuevas Herramientas de Business Intelligence de Oracle
avanttic Consultoría Tecnológica
 
But how do I GET the data? Transparency Camp 2014
Jeffrey Quigley
 
Leveraging Hadoop with OBIEE 11g and ODI 11g - UKOUG Tech'13
Mark Rittman
 
Incredible ODI tips to work with Hyperion tools that you ever wanted to know
Rodrigo Radtke de Souza
 
Oracle BI Hybrid BI : Mode 1 + Mode 2, Cloud + On-Premise Business Analytics
Mark Rittman
 
Ad

Similar to Empowering Business Users: OBIEE 12c Visual Analyzer and Data Mashup (20)

PDF
Power bi slide share pdf it is a very important
Satyabratarath5
 
PPTX
Tableau Visual analytics complete deck 2
Arun K
 
PPT
Tableau - Learning Objectives for Data, Graphs, Filters, Dashboards and Advan...
Srinath Reddy
 
PPTX
Analysis for office training
Kibrom Gebrehiwot
 
PPTX
Best Practices for Users - Connecting Tableau to OBIEE with BI Connector
BI Connector
 
PDF
D1-C1_Introduction to Power BI Desktop.pdf
andvp001
 
PPTX
Power BI101 SPS Chicago Suburbs 2020
Sharon Weaver
 
PDF
Business Analytics Implementation
Frank Luong PMP,MBA
 
PPTX
Intro to Power BI
Deepika Gandhi
 
PPT
COMPROG LESSON 4- INTRO TO VISUAL STUDIO.ppt
claritoBaluyot2
 
PPTX
HR Analytics.pptx
MEHULDATTA2
 
PPTX
Power BI Training Guide by workforce Dev
Mariabernadettemanza
 
PPTX
Power bi
Tarun Bamba
 
PPTX
Power BI vs Tableau
Don Hyun
 
PPTX
Power bi vs tableau
Affirma Consulting
 
PPT
Learning Tableau - Data, Graphs, Filters, Dashboards and Advanced features
Venkata Reddy Konasani
 
PPT
9544349.ppt
MichelleSaver
 
PPT
Oracle Business Intelligence Enterprise Edition
ESRI Bulgaria
 
PPTX
DSN_Power BIDSN_Power BIDSN_Power BIDSN_Power BIDSN_Power BIDSN_Power BI
EzekielJames8
 
PPTX
Introducing the Content Analysis Tool
Paula Ladenburg Land
 
Power bi slide share pdf it is a very important
Satyabratarath5
 
Tableau Visual analytics complete deck 2
Arun K
 
Tableau - Learning Objectives for Data, Graphs, Filters, Dashboards and Advan...
Srinath Reddy
 
Analysis for office training
Kibrom Gebrehiwot
 
Best Practices for Users - Connecting Tableau to OBIEE with BI Connector
BI Connector
 
D1-C1_Introduction to Power BI Desktop.pdf
andvp001
 
Power BI101 SPS Chicago Suburbs 2020
Sharon Weaver
 
Business Analytics Implementation
Frank Luong PMP,MBA
 
Intro to Power BI
Deepika Gandhi
 
COMPROG LESSON 4- INTRO TO VISUAL STUDIO.ppt
claritoBaluyot2
 
HR Analytics.pptx
MEHULDATTA2
 
Power BI Training Guide by workforce Dev
Mariabernadettemanza
 
Power bi
Tarun Bamba
 
Power BI vs Tableau
Don Hyun
 
Power bi vs tableau
Affirma Consulting
 
Learning Tableau - Data, Graphs, Filters, Dashboards and Advanced features
Venkata Reddy Konasani
 
9544349.ppt
MichelleSaver
 
Oracle Business Intelligence Enterprise Edition
ESRI Bulgaria
 
DSN_Power BIDSN_Power BIDSN_Power BIDSN_Power BIDSN_Power BIDSN_Power BI
EzekielJames8
 
Introducing the Content Analysis Tool
Paula Ladenburg Land
 
Ad

More from Edelweiss Kammermann (14)

PDF
AWDC para desarrolladores y data scientists
Edelweiss Kammermann
 
PDF
Oracle Autonomous Data Warehouse Cloud and Data Visualization
Edelweiss Kammermann
 
PDF
Working with Oracle Big Data Cloud Compute Edition and Apache Zeppelin
Edelweiss Kammermann
 
PDF
Moving OBIEE to Oracle Analytics Cloud
Edelweiss Kammermann
 
PDF
Como elegir entre BI Cloud, Data Visualization and Oracle Analytics Cloud Ser...
Edelweiss Kammermann
 
PDF
Oracle Analytics Cloud lo nuevo de Oracle BI en la nube
Edelweiss Kammermann
 
PDF
The Open Source and Cloud Part of Oracle Big Data Cloud Service for Beginners
Edelweiss Kammermann
 
PDF
Getting started with Hadoop, Hive, Spark and Kafka
Edelweiss Kammermann
 
PDF
Integrating Oracle Data Integrator with Oracle GoldenGate 12c
Edelweiss Kammermann
 
PDF
Integración de Oracle Data Integrator con Oracle GoldenGate 12c
Edelweiss Kammermann
 
PPTX
Integrando Oracle BI, BPM y BAM 11g: El ciclo completo de la información
Edelweiss Kammermann
 
PDF
Integrating Oracle BI, BPM and BAM 11g: The complete cycle of information
Edelweiss Kammermann
 
PDF
Bi Publisher 11g: Only good news
Edelweiss Kammermann
 
PDF
OBI11g: la versión mas esperada
Edelweiss Kammermann
 
AWDC para desarrolladores y data scientists
Edelweiss Kammermann
 
Oracle Autonomous Data Warehouse Cloud and Data Visualization
Edelweiss Kammermann
 
Working with Oracle Big Data Cloud Compute Edition and Apache Zeppelin
Edelweiss Kammermann
 
Moving OBIEE to Oracle Analytics Cloud
Edelweiss Kammermann
 
Como elegir entre BI Cloud, Data Visualization and Oracle Analytics Cloud Ser...
Edelweiss Kammermann
 
Oracle Analytics Cloud lo nuevo de Oracle BI en la nube
Edelweiss Kammermann
 
The Open Source and Cloud Part of Oracle Big Data Cloud Service for Beginners
Edelweiss Kammermann
 
Getting started with Hadoop, Hive, Spark and Kafka
Edelweiss Kammermann
 
Integrating Oracle Data Integrator with Oracle GoldenGate 12c
Edelweiss Kammermann
 
Integración de Oracle Data Integrator con Oracle GoldenGate 12c
Edelweiss Kammermann
 
Integrando Oracle BI, BPM y BAM 11g: El ciclo completo de la información
Edelweiss Kammermann
 
Integrating Oracle BI, BPM and BAM 11g: The complete cycle of information
Edelweiss Kammermann
 
Bi Publisher 11g: Only good news
Edelweiss Kammermann
 
OBI11g: la versión mas esperada
Edelweiss Kammermann
 

Recently uploaded (20)

PDF
Bitcoin for Millennials podcast with Bram, Power Laws of Bitcoin
Stephen Perrenod
 
PPTX
Webinar: Introduction to LF Energy EVerest
DanBrown980551
 
PDF
Achieving Consistent and Reliable AI Code Generation - Medusa AI
medusaaico
 
PDF
NewMind AI - Journal 100 Insights After The 100th Issue
NewMind AI
 
PDF
Log-Based Anomaly Detection: Enhancing System Reliability with Machine Learning
Mohammed BEKKOUCHE
 
PDF
Presentation - Vibe Coding The Future of Tech
yanuarsinggih1
 
PDF
Python basic programing language for automation
DanialHabibi2
 
PDF
SWEBOK Guide and Software Services Engineering Education
Hironori Washizaki
 
PDF
Complete JavaScript Notes: From Basics to Advanced Concepts.pdf
haydendavispro
 
PDF
Smart Trailers 2025 Update with History and Overview
Paul Menig
 
PDF
Newgen Beyond Frankenstein_Build vs Buy_Digital_version.pdf
darshakparmar
 
PDF
Building Real-Time Digital Twins with IBM Maximo & ArcGIS Indoors
Safe Software
 
PPTX
UiPath Academic Alliance Educator Panels: Session 2 - Business Analyst Content
DianaGray10
 
PPTX
WooCommerce Workshop: Bring Your Laptop
Laura Hartwig
 
PPTX
COMPARISON OF RASTER ANALYSIS TOOLS OF QGIS AND ARCGIS
Sharanya Sarkar
 
PDF
How Startups Are Growing Faster with App Developers in Australia.pdf
India App Developer
 
PDF
Timothy Rottach - Ramp up on AI Use Cases, from Vector Search to AI Agents wi...
AWS Chicago
 
PDF
Newgen 2022-Forrester Newgen TEI_13 05 2022-The-Total-Economic-Impact-Newgen-...
darshakparmar
 
PDF
Empower Inclusion Through Accessible Java Applications
Ana-Maria Mihalceanu
 
PPTX
AI Penetration Testing Essentials: A Cybersecurity Guide for 2025
defencerabbit Team
 
Bitcoin for Millennials podcast with Bram, Power Laws of Bitcoin
Stephen Perrenod
 
Webinar: Introduction to LF Energy EVerest
DanBrown980551
 
Achieving Consistent and Reliable AI Code Generation - Medusa AI
medusaaico
 
NewMind AI - Journal 100 Insights After The 100th Issue
NewMind AI
 
Log-Based Anomaly Detection: Enhancing System Reliability with Machine Learning
Mohammed BEKKOUCHE
 
Presentation - Vibe Coding The Future of Tech
yanuarsinggih1
 
Python basic programing language for automation
DanialHabibi2
 
SWEBOK Guide and Software Services Engineering Education
Hironori Washizaki
 
Complete JavaScript Notes: From Basics to Advanced Concepts.pdf
haydendavispro
 
Smart Trailers 2025 Update with History and Overview
Paul Menig
 
Newgen Beyond Frankenstein_Build vs Buy_Digital_version.pdf
darshakparmar
 
Building Real-Time Digital Twins with IBM Maximo & ArcGIS Indoors
Safe Software
 
UiPath Academic Alliance Educator Panels: Session 2 - Business Analyst Content
DianaGray10
 
WooCommerce Workshop: Bring Your Laptop
Laura Hartwig
 
COMPARISON OF RASTER ANALYSIS TOOLS OF QGIS AND ARCGIS
Sharanya Sarkar
 
How Startups Are Growing Faster with App Developers in Australia.pdf
India App Developer
 
Timothy Rottach - Ramp up on AI Use Cases, from Vector Search to AI Agents wi...
AWS Chicago
 
Newgen 2022-Forrester Newgen TEI_13 05 2022-The-Total-Economic-Impact-Newgen-...
darshakparmar
 
Empower Inclusion Through Accessible Java Applications
Ana-Maria Mihalceanu
 
AI Penetration Testing Essentials: A Cybersecurity Guide for 2025
defencerabbit Team
 

Empowering Business Users: OBIEE 12c Visual Analyzer and Data Mashup

  • 1. Empowering  Business  Users:     OBIEE  12c  Visual  Analyzer  &     Data  Mashup Edelweiss  Kammermann UKOUG  Annual  Conference    -­‐  Birmingham-­‐    December  2015
  • 2. Edelweiss  Kammermann • Computer  engineer,  BI  and  Data  Integration  specialist  with  over  18  years  of  consulting  and  project   management  experience  in  Oracle  technology.   • Co-­‐founder  and  Vice  President  of    Uruguayan  Oracle  User  Group  (UYOUG)     • Business  Intelligence  articles  published  on  OTN  site   • Frequent  speaker  at  international  conferences  as  Collaborate,  OTN  Tour  LA,    UKOUG  Annual   Conference,  OOW  and  Rittman  Mead  BI  Forum   • Oracle  ACE   email:  [email protected]       TwiZer:  @EdelweissK
  • 4. Agenda • New  OBIEE  12c  Front-­‐End  Features     • Visual  Analyzer   • BI  Ask   • Data  Mashups    
  • 5. Visual  Analyzer • Visual  Analyzer  is  a  very  intuitive  and  interactive  web-­‐based  tool  to  explore  and  analyse  your  data   • Part  of  the  new  front-­‐end  features  of  OBIEE  12c  along  with  Data  Mashups   • It  was  available  first  in  the  Oracle  BI  Cloud  Service  (OBICS)   • Self-­‐service  oriented    
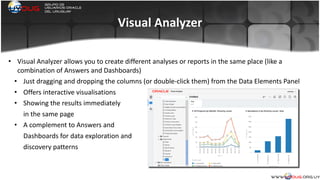
  • 6. Visual  Analyzer • Visual  Analyzer  allows  you  to  create  different  analyses  or  reports  in  the  same  place  (like  a   combination  of  Answers  and  Dashboards)   • Just  dragging  and  dropping  the  columns  (or  double-­‐click  them)  from  the  Data  Elements  Panel   • Offers  interactive  visualisations   • Showing  the  results  immediately     in  the  same  page   • A  complement  to  Answers  and   Dashboards  for  data  exploration  and   discovery  patterns  
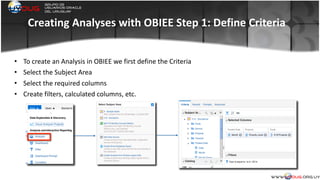
  • 7. Creating  Analyses  with  OBIEE  Step  1:  Define  Criteria • To  create  an  Analysis  in  OBIEE  we  first  define  the  Criteria   • Select  the  Subject  Area   • Select  the  required  columns   • Create  filters,  calculated  columns,  etc.    
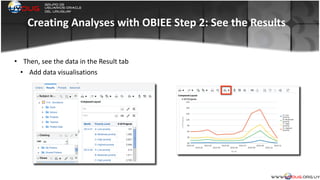
  • 8. Creating  Analyses  with  OBIEE  Step  2:  See  the  Results • Then,  see  the  data  in  the  Result  tab   • Add  data  visualisations    
  • 9. Define  the  Content  and  See  the  Results  in  Visual  Analyzer • In  Visual  Analyzer  you  define  the  content  and  see  the  results  immediately  in  the  same  place.    
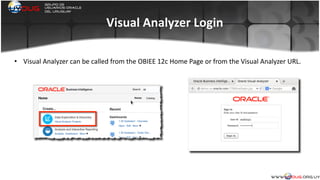
  • 10. Visual  Analyzer  Login • Visual  Analyzer  can  be  called  from  the  OBIEE  12c  Home  Page  or  from  the  Visual  Analyzer  URL.    
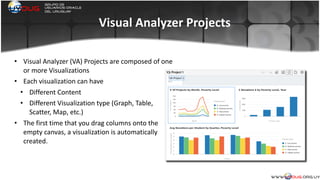
  • 11. Visual  Analyzer  Projects • Visual  Analyzer  (VA)  Projects  are  composed  of  one   or  more  Visualizations   • Each  visualization  can  have   • Different  Content   • Different  Visualization  type  (Graph,  Table,   Scatter,  Map,  etc.)   • The  first  time  that  you  drag  columns  onto  the   empty  canvas,  a  visualization  is  automatically   created.  
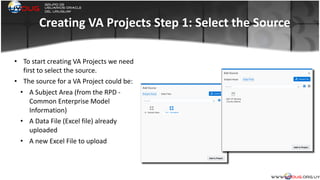
  • 12. Creating  VA  Projects  Step  1:  Select  the  Source • To  start  creating  VA  Projects  we  need   first  to  select  the  source.   • The  source  for  a  VA  Project  could  be:   • A  Subject  Area  (from  the  RPD  -­‐   Common  Enterprise  Model   Information)   • A  Data  File  (Excel  file)  already   uploaded   • A  new  Excel  File  to  upload  
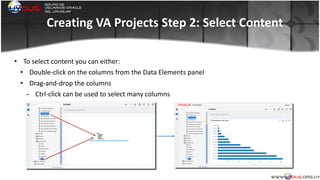
  • 13. Creating  VA  Projects  Step  2:  Select  Content • To  select  content  you  can  either:   • Double-­‐click  on  the  columns  from  the  Data  Elements  panel   • Drag-­‐and-­‐drop  the  columns   - Ctrl-­‐click  can  be  used  to  select  many  columns    
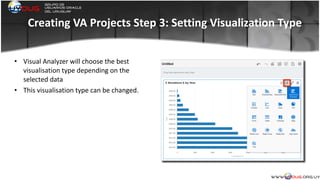
  • 14. Creating  VA  Projects  Step  3:  Setting  Visualization  Type • Visual  Analyzer  will  choose  the  best   visualisation  type  depending  on  the   selected  data   • This  visualisation  type  can  be  changed.    
  • 15. Adding  More  Visualizations • More  Visualizations  can  be  added  In  VA  to  show  the  same  or  different  data  like  a  Dashboard   • Create  a  New  Visualization  from  the  VA  Toolbar  and  select  the  content  for  it   • Duplicate  an  existing  one  using  Copy/Paste  Visualization  options  in  the  Visualization  Menu    
  • 16. Rearranging  the  Visualizations  in  a  VA  Project • Visualizations  can  be  rearranged  just   dragging  and  dropping  on  the  VA  canvas   • Can  be  also  resized     • Visualization  properties  allows  to   • Modify  the  visualisation  titles,  axis  titles   in  case  of  graphs,  etc.   • Change  the  default  aggregation  for   measures    
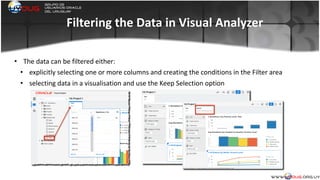
  • 17. Filtering  the  Data  in  Visual  Analyzer • The  data  can  be  filtered  either:   • explicitly  selecting  one  or  more  columns  and  creating  the  conditions  in  the  Filter  area   • selecting  data  in  a  visualisation  and  use  the  Keep  Selection  option    
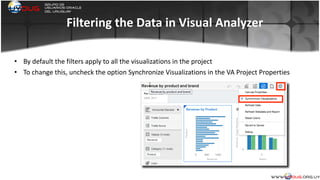
  • 18. Filtering  the  Data  in  Visual  Analyzer • By  default  the  filters  apply  to  all  the  visualizations  in  the  project   • To  change  this,  uncheck  the  option  Synchronize  Visualizations  in  the  VA  Project  Properties    
  • 19. Creating  Calculations • Calculations  can  be  added  in  Visual  Analyzer   • Wide  variety  of  Functions  with  detailed  help  as  in  BI  Answers   • Columns  can  be  added  double-­‐clicking  on  them  in  the  Data  Elements  Panel    
  • 20. Important  differences  between  VA  and  Answers • Some  of  the  most  complex  features  that  are  present  in  Answers  are  not  allowed  In  VA:   • VA  cannot  work  with  Hierarchy  columns  or  groups   • The  calculated  measures  that  we  created  in  Answers  and  save  in  the  catalog  cannot  be   referenced  in  VA.   • VA  Projects  cannot  be  included  in  Dashboards    
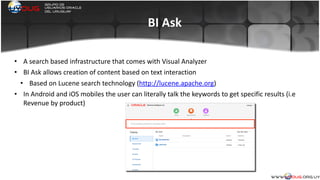
  • 21. BI  Ask • A  search  based  infrastructure  that  comes  with  Visual  Analyzer   • BI  Ask  allows  creation  of  content  based  on  text  interaction   • Based  on  Lucene  search  technology  (http://lucene.apache.org)   • In  Android  and  iOS  mobiles  the  user  can  literally  talk  the  keywords  to  get  specific  results  (i.e   Revenue  by  product)    
  • 22. Creating  Content  with  BI  Ask • Enter  the  keyword  for  the  columns  that  you  want  to  include  in  the  visualization   • For  example  start  searching  for  the  name  of  a  measure   • Then  add  dimension  column  names   • You  can  also  enter  the  name  of  the  visualization  type  as  Graph,  Table,  etc.    
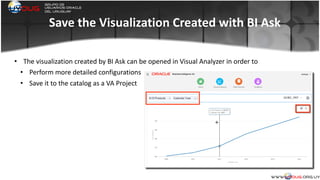
  • 23. Save  the  Visualization  Created  with  BI  Ask • The  visualization  created  by  BI  Ask  can  be  opened  in  Visual  Analyzer  in  order  to     • Perform  more  detailed  configurations   • Save  it  to  the  catalog  as  a  VA  Project    
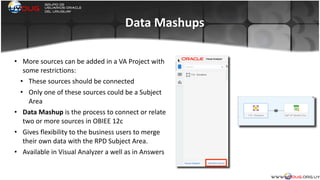
  • 24. Data  Mashups • More  sources  can  be  added  in  a  VA  Project  with   some  restrictions:   • These  sources  should  be  connected   • Only  one  of  these  sources  could  be  a  Subject   Area   • Data  Mashup  is  the  process  to  connect  or  relate   two  or  more  sources  in  OBIEE  12c   • Gives  flexibility  to  the  business  users  to  merge   their  own  data  with  the  RPD  Subject  Area.   • Available  in  Visual  Analyzer  a  well  as  in  Answers    
  • 25. Data  Mashups  Step  1:  Adding  New  Data  Source • Press  the  Add  Data  Source  link  located  at  the  bottom  of  the  Data  Elements  Panel   • Select  existent  data  file  or  upload  a  new  one    
  • 26. Data  Mashups  Step  2:  Create  the  Matching  Criteria • Once  you  selected  the  Excel  file  to  upload,OBIEE  12c  will  try  to  match  the  columns  from  the  Excel   file  with  the  columns  from  the  Subject  Area  that  have  the  same  name.   • This  can  be  manually  changed.   • A  file  column  can  be  a  match,  an  attribute  or  a  measure      
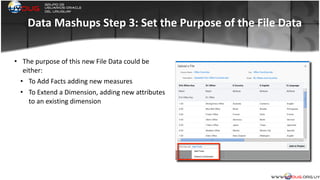
  • 27. Data  Mashups  Step  3:  Set  the  Purpose  of  the  File  Data • The  purpose  of  this  new  File  Data  could  be   either:   • To  Add  Facts  adding  new  measures   • To  Extend  a  Dimension,  adding  new  attributes   to  an  existing  dimension    
  • 28. Data  Mashups  Step  4:  Use  Both  Data  Sources • Visualizations  can  be  created  using   columns  from  both  Data  Sources  added   in  the  VA  Project    
  • 29. Sharing  and  Security  in  Visual  Analyzer • A  Visual  Analyzer  project  can  be  shared  and  as  any  other  object  in  the  Web  Catalog   • When  a  VA  Project  that  contains  a  excel  file  as  a  source  is  shared  with  traverse  or  modify   permissions:   • The  excel  file  is  also  shared  and  can  be  available  for  used  in  a  new  VA  project.    
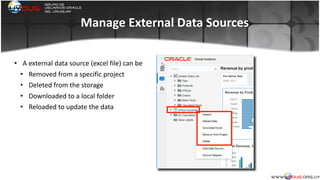
  • 30. Manage  External  Data  Sources • A  external  data  source  (excel  file)  can  be     • Removed  from  a  specific  project   • Deleted  from  the  storage   • Downloaded  to  a  local  folder   • Reloaded  to  update  the  data
  • 31. Conclusions • Visual  Analyzer  is  a  very  intuitive  and  interactive  web-­‐based  tool  for   • self-­‐service  reporting   • data  exploration   • data  discovery   • A  complement  to  Answers/Dashboards  oriented  to  Business  User  for  quick  and  easy  data   analysis     • More  flexibility  with  Data  Mashups  and  BI  Ask     • Data  Mashup  allows  Business  users  to  merge  their  own  data  with  the  corporate  data  (Subject   Areas)   • BI  Ask  creates  content  based  on  keywords    
  • 32. Further  Information • OBIEE  12c  download  page  in  OTN   • http://www.oracle.com/technetwork/middleware/bi-­‐enterprise-­‐edition/downloads/business-­‐ intelligence-­‐2717951.html   • ORACLE  BI  TECHDEMO  Youtube  Channel   • https://www.youtube.com/channel/UCXpjKAy010SDUXmAA67DILg   • Graph  Selection  Matrix  by  Stephen  Few   • http://www.perceptualedge.com/articles/misc/Graph_Selection_Matrix.pdf