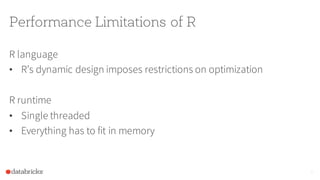
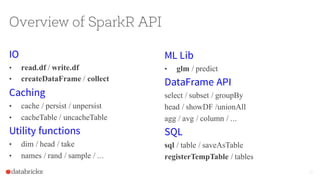
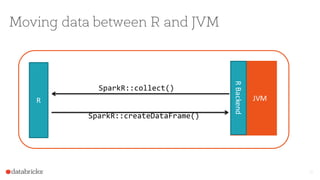
Enabling Exploratory Data
Science with Spark and R
Shivaram Venkataraman, Hossein Falaki (@mhfalaki)
About Apache Spark, AMPLab and Databricks
Apache Spark is a general distributed computingengine that unifies:
• Real-time streaming (SparkStreaming)
• Machine learning (SparkML/MLLib)
• SQL (SparkSQL)
• Graph processing (GraphX)
AMPLab (Algorithms, Machines, and Peoples lab) at UC Berkeley was where Spark and SparkR
were developed originally.
Databricks Inc. is the company founded by creators of Spark, focused on making big data
simple by offering an end to end data processing platform in the cloud
2
What is R?
Language and runtime
The cornerstone of R is the
data frame concept
3
Many data scientists love R
4
• Open source
• Highly dynamic
• Interactive environment
• Rich ecosystem of packages
• Powerful visualization infrastructure
• Data frames make data manipulation convenient
• Taughtby many schoolsto stats and computing students
Performance Limitations of R
R language
• R’s dynamic design imposes restrictions on optimization
R runtime
• Single threaded
• Everything has to fit in memory
5
What would be ideal?
Seamless manipulationand analysisof very large data in R
• R’s flexible syntax
• R’s rich package ecosystem
• R’s interactive environment
• Scalability (scaleup and out)
• Integration with distributed data sources/ storage
6
Augmenting R with other frameworks
In practice data scientists use R in conjunction with other frameworks
(Hadoop MR, Hive, Pig, Relational Databases, etc)
7
Framework	
  X
(Language	
  Y)
Distributed
Storage
1.	
  Load,	
  clean,	
  transform,	
  aggregate,	
  sample
Local
Storage
2.	
  Save	
  to	
  local	
  storage 3.	
  Read	
  and	
  analyze	
  in	
  R
Iterate
What is SparkR?
An R package distributed with ApacheSpark:
• Provides R frontend to Spark
• Exposes Spark Dataframes (inspired by R and Pandas)
• Convenientinteroperability between R and Spark DataFrames
8
+distributed/robust	
   processing,	
  data	
  
sources,	
  off-­‐memory	
  data	
  structures
Spark
Dynamic	
  environment,	
  interactivity,	
  
packages,	
  visualization
R
How does SparkR solve our problems?
No local storage involved
Write everything in R
Use Spark’s distributed cachefor interactive/iterative analysis at
speed of thought
9
Local
Storage
2.	
  Save	
  to	
  local	
  storage 3.	
  Read	
  and	
  analyze	
  in	
  R
Framework	
  X
(Language	
  Y)
Distributed
Storage
1.	
  Load,	
  clean,	
  transform,	
  aggregate,	
  sample
Iterate
Example SparkR program
# Loading distributed data
df <- read.df(“hdfs://bigdata/logs”, source = “json”)
# Distributed filtering and aggregation
errors <- subset(df, df$type == “error”)
counts <- agg(groupBy(errors, df$code), num = count(df$code))
# Collecting and plotting small data
qplot(code, num, data = collect(counts), geom = “bar”, stat = “identity”) + coord_flip()
10
SparkR architecture
11
Spark	
  Driver
R JVM
R	
  Backend
JVM
Worker
JVM
Worker
Data	
  Sources
Overview of SparkR API
IO
• read.df / write.df
• createDataFrame / collect
Caching
• cache / persist / unpersist
• cacheTable / uncacheTable
Utility functions
• dim / head / take
• names / rand / sample / ...
12
ML Lib
• glm / predict
DataFrame API
select / subset / groupBy
head / showDF /unionAll
agg / avg / column / ...
SQL
sql / table / saveAsTable
registerTempTable / tables
Moving data between R and JVM
13
R JVM
R	
  Backend
SparkR::collect()
SparkR::createDataFrame()
Moving data between R and JVM
14
R JVM
R	
  Backend
JVM
Worker
JVM
Worker
HDFS/S3/…
FUSE
read.df()
write.df()
Moving between languages
15
R Scala
Spark
df <- read.df(...)
wiki <- filter(df, ...)
registerTempTable(wiki, “wiki”)
val wiki = table(“wiki”)
val parsed = wiki.map {
Row(_, _, text: String, _, _)
=>text.split(‘ ’)
}
val model = Kmeans.train(parsed)
Mixing R and SQL
Pass a query to SQLContextand getthe resultback as a DataFrame
16
# Register DataFrame as a table
registerTempTable(df, “dataTable”)
# Complex SQL query, result is returned as another DataFrame
aggCount <- sql(sqlContext, “select count(*) as num, type, date group by type order by date
desc”)
qplot(date, num, data = collect(aggCount), geom = “line”)
SparkR roadmap and upcoming features
• Exposing MLLib functionality in SparkR
• GLM already exposed with R formula support
• UDF supportin R
• Distribute a function and data
• Ideal way for distributing existing R functionality and packages
• Complete DataFrame API to behave/feeljust like data.frame
17
Example use case: exploratory analysis
• Data pipeline implemented in Scala/Python
• New files are appended to existing data partitioned by time
• Table schemeis saved in Hive metastore
• Data scientists use SparkRto analyze and visualize data
1. refreshTable(sqlConext,“logsTable”)
2. logs <- table(sqlContext,“logsTable”)
3. Iteratively analyze/aggregate/visualize using Spark & R DataFrames
4. Publish/share results
18
Demo
19
How to get started with SparkR?
• On your computer
1. Download latest version ofSpark (1.5.2)
2. Build (maven orsbt)
3. Run ./install-dev.sh inside the R directory
4. Start R shell by running ./bin/sparkR
• Deploy Spark (1.4+) on your cluster
• Sign up for 14 days free trial at Databricks
20
Summary
1. SparkR is an R frontend to ApacheSpark
2. Distributed data resides in the JVM
3. Workers are not runningR process(yet)
4. Distinction between Spark DataFrames and R data frames
21
Further pointers
http://spark.apache.org
http://www.r-project.org
http://www.ggplot2.org
https://cran.r-project.org/web/packages/magrittr
www.databricks.com
Office hour: 13-14 Databricks Booth
22
Thank you

Enabling exploratory data science with Spark and R

  • 1.
    Enabling Exploratory Data Sciencewith Spark and R Shivaram Venkataraman, Hossein Falaki (@mhfalaki)
  • 2.
    About Apache Spark,AMPLab and Databricks Apache Spark is a general distributed computingengine that unifies: • Real-time streaming (SparkStreaming) • Machine learning (SparkML/MLLib) • SQL (SparkSQL) • Graph processing (GraphX) AMPLab (Algorithms, Machines, and Peoples lab) at UC Berkeley was where Spark and SparkR were developed originally. Databricks Inc. is the company founded by creators of Spark, focused on making big data simple by offering an end to end data processing platform in the cloud 2
  • 3.
    What is R? Languageand runtime The cornerstone of R is the data frame concept 3
  • 4.
    Many data scientistslove R 4 • Open source • Highly dynamic • Interactive environment • Rich ecosystem of packages • Powerful visualization infrastructure • Data frames make data manipulation convenient • Taughtby many schoolsto stats and computing students
  • 5.
    Performance Limitations ofR R language • R’s dynamic design imposes restrictions on optimization R runtime • Single threaded • Everything has to fit in memory 5
  • 6.
    What would beideal? Seamless manipulationand analysisof very large data in R • R’s flexible syntax • R’s rich package ecosystem • R’s interactive environment • Scalability (scaleup and out) • Integration with distributed data sources/ storage 6
  • 7.
    Augmenting R withother frameworks In practice data scientists use R in conjunction with other frameworks (Hadoop MR, Hive, Pig, Relational Databases, etc) 7 Framework  X (Language  Y) Distributed Storage 1.  Load,  clean,  transform,  aggregate,  sample Local Storage 2.  Save  to  local  storage 3.  Read  and  analyze  in  R Iterate
  • 8.
    What is SparkR? AnR package distributed with ApacheSpark: • Provides R frontend to Spark • Exposes Spark Dataframes (inspired by R and Pandas) • Convenientinteroperability between R and Spark DataFrames 8 +distributed/robust   processing,  data   sources,  off-­‐memory  data  structures Spark Dynamic  environment,  interactivity,   packages,  visualization R
  • 9.
    How does SparkRsolve our problems? No local storage involved Write everything in R Use Spark’s distributed cachefor interactive/iterative analysis at speed of thought 9 Local Storage 2.  Save  to  local  storage 3.  Read  and  analyze  in  R Framework  X (Language  Y) Distributed Storage 1.  Load,  clean,  transform,  aggregate,  sample Iterate
  • 10.
    Example SparkR program #Loading distributed data df <- read.df(“hdfs://bigdata/logs”, source = “json”) # Distributed filtering and aggregation errors <- subset(df, df$type == “error”) counts <- agg(groupBy(errors, df$code), num = count(df$code)) # Collecting and plotting small data qplot(code, num, data = collect(counts), geom = “bar”, stat = “identity”) + coord_flip() 10
  • 11.
    SparkR architecture 11 Spark  Driver RJVM R  Backend JVM Worker JVM Worker Data  Sources
  • 12.
    Overview of SparkRAPI IO • read.df / write.df • createDataFrame / collect Caching • cache / persist / unpersist • cacheTable / uncacheTable Utility functions • dim / head / take • names / rand / sample / ... 12 ML Lib • glm / predict DataFrame API select / subset / groupBy head / showDF /unionAll agg / avg / column / ... SQL sql / table / saveAsTable registerTempTable / tables
  • 13.
    Moving data betweenR and JVM 13 R JVM R  Backend SparkR::collect() SparkR::createDataFrame()
  • 14.
    Moving data betweenR and JVM 14 R JVM R  Backend JVM Worker JVM Worker HDFS/S3/… FUSE read.df() write.df()
  • 15.
    Moving between languages 15 RScala Spark df <- read.df(...) wiki <- filter(df, ...) registerTempTable(wiki, “wiki”) val wiki = table(“wiki”) val parsed = wiki.map { Row(_, _, text: String, _, _) =>text.split(‘ ’) } val model = Kmeans.train(parsed)
  • 16.
    Mixing R andSQL Pass a query to SQLContextand getthe resultback as a DataFrame 16 # Register DataFrame as a table registerTempTable(df, “dataTable”) # Complex SQL query, result is returned as another DataFrame aggCount <- sql(sqlContext, “select count(*) as num, type, date group by type order by date desc”) qplot(date, num, data = collect(aggCount), geom = “line”)
  • 17.
    SparkR roadmap andupcoming features • Exposing MLLib functionality in SparkR • GLM already exposed with R formula support • UDF supportin R • Distribute a function and data • Ideal way for distributing existing R functionality and packages • Complete DataFrame API to behave/feeljust like data.frame 17
  • 18.
    Example use case:exploratory analysis • Data pipeline implemented in Scala/Python • New files are appended to existing data partitioned by time • Table schemeis saved in Hive metastore • Data scientists use SparkRto analyze and visualize data 1. refreshTable(sqlConext,“logsTable”) 2. logs <- table(sqlContext,“logsTable”) 3. Iteratively analyze/aggregate/visualize using Spark & R DataFrames 4. Publish/share results 18
  • 19.
  • 20.
    How to getstarted with SparkR? • On your computer 1. Download latest version ofSpark (1.5.2) 2. Build (maven orsbt) 3. Run ./install-dev.sh inside the R directory 4. Start R shell by running ./bin/sparkR • Deploy Spark (1.4+) on your cluster • Sign up for 14 days free trial at Databricks 20
  • 21.
    Summary 1. SparkR isan R frontend to ApacheSpark 2. Distributed data resides in the JVM 3. Workers are not runningR process(yet) 4. Distinction between Spark DataFrames and R data frames 21
  • 22.
  • 23.