Feature Extraction for Image Classification and Analysis with Ant Colony Optimization Using Fuzzy Logic Approach
0 likes45 views

This document discusses a novel image segmentation and feature extraction method that combines Ant Colony Optimization (ACO) and fuzzy logic to address challenges of clustering in image analysis. The proposed approach enhances the identification of image structures by using fuzzy inference rules alongside ACO, thus reducing misclassifications in overlapping regions. Experimental results demonstrate improved performance in extracting features from both textured and non-textured images compared to existing methods.

![Signal & Image Processing : An International Journal (SIPIJ) Vol.2, No.4, December 2011
138
Segmentation is a process of grouping an image into units that are homogeneous with respect to
one or more characteristics. It is an important task in image analysis [1]. In past decades, attention
has been focused on monochrome image segmentation whose goal is to separate individual
objects in the perception of the scene. A common problem in segmentation of monochrome
image occurs when an image has a background of varying gray levels such as gradually changing
shades [2], it is difficult task to find the discontinuities [3]. This problem is inherent, since
intensity is the only available information from monochrome images. It has long been recognized
that the human eye can detect only in the neighborhood of one or two dozen intensity levels at
any one point in a complex image due to its brightness adaptation but can discern thousands of
color shades and intensities.
Image analysis is the extraction of meaningful information from images, mainly from digital
images by means of digital image processing techniques. Analysis facilitates the human to
understand things using images rather than tables. The images that are composed of repeated
patterns and contains unique texture surface are called textured images. These images do not
have shape, but have color and texture. The Non-Textured images instead contain the shape along
with the color and texture. These images have some clustered objects. When the structure of the
image is to be extracted, then image is segmented based different characteristics.
II. BACKGROUND
A. General Texture Analysis Methods
Different textural features have been proposed for analyzing the patterns in the image, ranging
from the local pattern spectrum, multiresolution analysis and co-occurrence of grey sale values to
texture spectrum based approaches. The most popular approaches for analyzing the texture are
Gabor filter-based approach, markov random field (MRF) [4] models and wavelet decomposition
with energy signature. These approaches are tested on images that are acquired under the ideal
conditions. These approaches have not extracted the structural information implicitly. For each
stage a different structure is extracted, thus causes for ambiguity. Texture analysis methods can
be grouped into two broad groups. The first group comprises approaches for extracting the
structural information from the images under the ideal conditions. Other group comprises of
approaches that take the image under non ideal conditions [5]. In the present approach image
under ideal conditions is considered for analysis.
B. Ant Colony Optimization Approach
This is a widely used approach in operations research and computer science. This was proposed
by Marco Dorigo in the year 1992. This is probabilistic approach for solving the computational
problems, which can be reduced to find good path through graph. This is a member of ant colony
system [6], which is used in “swarm intelligence”. When this algorithm is applied on the grey
scale image, in which each pixel is having some intensity. The information of each pixel is
gathered by simple autonomous agents and is shared to exploit the solution. The autonomous
agents called ants upon finding the all the high intensity pixel it leaves pheromone and computes
the neighbor pixel contains highest intensity. The ants evolve on the image itself by reinforcing
the pheromone levels around the pixel with different grey levels. The ant system evolves during
generations moving to adjacent pixels at each generation and having more favorable survival and
reproduction conditions depending on the local features of the image (for edge detection, the most
contrasted the most favorable a region is). In [7], the notion of visibility determined using the
maximum variation of gray level of the image intensity is used to drive the ant displacement.
Eventually all the pixels in the route are determined, therefore the shortest path is chosen. But this
approach has some limitations like time consuming, and inability finds the optimal path for image
segmentation, when objects in the image are overlapped. These limitations can be overcome with
fuzzy logic with its inference rules.](https://image.slidesharecdn.com/2411sipij12-220427055601/85/Feature-Extraction-for-Image-Classification-and-Analysis-with-Ant-Colony-Optimization-Using-Fuzzy-Logic-Approach-2-320.jpg)
![Signal & Image Processing : An International Journal (SIPIJ) Vol.2, No.4, December 2011
139
C. Fuzzy Logic (FL)
Fuzzy Logic techniques have been used in image-understanding applications such as detection of
edges, feature extraction, classification, and clustering. Fuzzy logic poses the ability to mimic the
human mind to effectively employ modes of reasoning that are approximate rather than exact [8].
With FL, we can specify mapping rules in terms of words rather than numbers. Computing with
the words explores imprecision and tolerance. Another basic concept in FL is the fuzzy if–then
rule. Although rule-based systems have a long history of use in artificial intelligence [9], what is
missing in such systems is machinery for dealing with fuzzy consequents or fuzzy antecedents. In
most applications, an FL solution is a translation of a human solution. FL can model nonlinear
functions of arbitrary complexity to a desired degree of accuracy. FL is a convenient way to map
an input space to an output space. FL is one of the tools used to model a multioutput system.
These Fuzzy Rules, as shown in the TABLE 1, are framed according to the intensities observed in
the input image for different threshold calculated from the formulas
.
III. RELATED WORK
The Gaussian distribution and the independent distribution have the problem of misclassifying the
pixels while finding their neighbors, so this may lead to the wrong interpretation in the resulting
image. To classify the image pixel rightly it is better to estimate the threshold. In this study, the
process of estimating threshold is simple which in turn leads to the satisfactory results with help
of reduced set of fuzzy rules.
The problem discussed above when we use threshold alone for classifying the pixel to which
group it belongs to, that can lead to wrong assumptions, where overlapping of the regions occur.
It is very general that the pixels in different regions will be having same intensity some times, and
causes for ambiguity for segmentation. This paper uses the threshold with fuzzy rules to classify
the pixels to the region that it exactly belongs. With the help of the fuzzy inference rules the
decision will be easy to classify the pixel based on the grey level intensity. This is unsupervised
solution making use of both threshold value and fuzzy inference rules.
The notations used in this paper are, the input image f, and its grayscale image is ff, the
thresholds are T, T1, and T2 for mean, mean-standard deviation*const, and mean+ standard
deviation * const, respectively. The input image pixels are distributed by using Gaussian
distribution. The notations m represent the number of rows or line and the n represents the
number of columns in the input images. The product represents the total number of pixels in the
input image. This mean is used for classifying the pixel to particular group. The pixels gradient
may change by one pixel, the pixel and its all eight neighbors are compared with respect to their
intensities, as the comparison goes the pixels are classified that satisfies the inference rule
mentioned in the TABLE 1.
,
1
*
0 , 0
1
( , ) (1)
/ (2)
2 / (3)
m n
m n
i j
T f i j
T T T const
T T T const
= =
= − − − − − − − − − − −
= − − − − − − − − − − − − −
= + − − − − − − − − − − − −
∑
IV. PROPOSED APPROACH
Combining the Ant Colony Optimization with Fuzzy Logic yields the structural information of
the image implicitly. Using the Fuzzy Logic a rule base is formed. When we apply ant colony
optimization to the image, the autonomous agents collects the each pixel intensity value. This
pixel is grouped into a particular group based on the fuzzy rule. All the pixels fall under a specific](https://image.slidesharecdn.com/2411sipij12-220427055601/85/Feature-Extraction-for-Image-Classification-and-Analysis-with-Ant-Colony-Optimization-Using-Fuzzy-Logic-Approach-3-320.jpg)
![Signal & Image Processing : An International Journal (SIPIJ) Vol.2, No.4, December 2011
140
group based on the fuzzy inference rules are highlighted to extract the structure. But the
complexity of this approach is forming the fuzzy rules. The process of forming the fuzzy
inference rules is probabilistic based approach, and is formed using the threshold values of the
input image. When ever a pixel is selected from the input grayscale image, it is compared against
each inference rule. Where ever the match is found that pixel value and its location are stored in
the corresponding dataset. Depending on the number of rules, those many numbers of datasets
containing the pixels meeting that particular constraint are formed. The powerful of these rules is
the ability of extract all edges in the processed image directly. According to the observations of
this study, the structure and the constituent parts of the image can be retrieved implicitly.
Depending on the problem different sets of fuzzy rules, as shown in the TABLE 1, are framed, to
process each pixel taken from the image using the ant colony optimization technique. This is
accomplished with function called pixel labeling. The job of pixel labeling is to label pixel group
or set, taking from ant colony optimization autonomous agents.
Here each pixel is verified against with its neighbors to classify it. The pixel will have 8
neighbors, with its center. If a specified match is found then the pixel is labeled to corresponding
group, and the pixel that is close in terms of intensity and also be the neighbor is considered for
the centered pixel to continue the process of classification or labeling the pixels. The neighbored
pixels are verified with defined threshold, and with inference rules. The algorithm1 explains the
way how the grouping of the pixels is performed. According to the pixel intensity values the rules
are framed. When even a pixel is picked up it is verified against this inference rule base, with
different thresholds mentioned in the (1), (2) and (3) equations respectively. If any of the rules is
matched then, it is moved into that particular set, this process is continued until all the pixels in
the image have been processed by the pixel labeling function. The Inference Rule base can be as
described in the TABLE 1.
Algorithm1 The Basic Framework of Pixel labeling
Begin pixel labeling ()
c:constant
f=read image
T=mean (f)
T1=mean-std_of_mean/c
for 1:size_of_row
for 1:size_of_col
Px<-f(i,j)
if(Px >=rule1)
ds1[]=Px
else if(Px>=rule2)
ds2[]=Px
else if(Px>= rule3)
sd3 []=Px
else if(Px>= rule4)
set4 []=Px
end else if
end else if
end else if
end if
End
In this location, some of the desired rules are explained. The four rules are dealing with the
vertical and horizontal direction lines gray level values around the checked or centered pixel of](https://image.slidesharecdn.com/2411sipij12-220427055601/85/Feature-Extraction-for-Image-Classification-and-Analysis-with-Ant-Colony-Optimization-Using-Fuzzy-Logic-Approach-4-320.jpg)

![Signal & Image Processing : An International Journal (SIPIJ) Vol.2, No.4, December 2011
143
VI. CONCLUSION
A generic unsupervised feature extraction method and new image segmentation methods have
been proposed. The frame work involves features extraction and segmentation using the fuzzy
approach. The proposed method also has very reduced set of inference rules. The results have
shown that the relevant and existing features of the image have been taken into account and to
extract the feature of the image implicitly. The first strong point of this approach is that it has
very reduced set of fuzzy inference rule. The second strong point of this approach is that it avoids
the misclassifications of the intensities belong to the overlapping regions. The third contribution
of this work is that it is not required to use any mask filter before being processed by the generic
method, which in turn consumes some time for finding the maximum response time. It has been
observed that there is some misclassification of pixel intensities at the boundaries and
overlapping places of the regions of the images, that is not implicitly extracted using by the ant
colony optimization alone. Finally this work proposes a new segmentation algorithm which
combines ACO with Fuzzy Inference rules to extract the edge feature, region feature and
physiological features taking into account, for texture and non-texture images respectively.
References
[1] S. Geman and D. Geman, “Stochastic relaxation, Gibbs distribution and Bayesian restoration of
images,” IEEE Trans. Pattern Anal. Mach. ntell., vol. 6, no. 6, pp. 721–741, Nov. 1984.
[2] D. Geman, S. Geman, C. Graffigne, and P. Dong, “Boundary detection by constrained optimization,”
IEEE Trans. Pattern A nal. Mach. Intell., vol. 12, no. 7, pp. 609–628, Jul. 2007.
[3] S. Geman and G. Reynolds, “Constrained restoration and recovery of discontinuities,” IEEE Trans.
Pattern Anal. Mach. Intell., vol. 14, no. 3, pp. 367–383, Mar. 2004.
[4] X. Descombes, F. Kruggel, and Y. von Cramon, “Spatio-temporal fMRI analysis using Markov
random fields,” IEEE Trans. Med. Imag., vol. 17, no. 6, pp. 1028–1039, Jun. 2001.
[5] Umasankar Kandswamy, Stephenie ASchucker, and Donald Adjeroh, “Comparision of Texture
Analysis Schemes Under Nonideal Conditions’,IEEE Trans on Image Processing, vol 20, no 8,
pp2260-2275, Aug. 2011.
[6] Marco Dorigo and Christian Blum, “Ant Colony Optimization :A Survey”, Elsevier Journal of
Theoretical computer science, pp 243-278, Mar. 2005.
[7] M. Dorigo, V. Maniezzo, and A. Colorni, “The ant system: Optimization by a colony of cooperating
agents,” IEEE Trans. Syst., Man, Cybern. B, Cybern., vol. 26, no. 1, pp. 29–41, Feb. 2006.
[8] H. D. Hofmann, "Application of Intelligent Measurements with Metrical Image Processing for
Quality Control", resented at the 5th International Conference, PEDAC' 92, Alexandria, EGYPT,
December 2005.
[9] R. Schoonderwoerd, O. Holland, and J. Bruten, “Ant-like agents for load balancing in
telecommunications networks,” in Proc. ACM Agents, Marina del Rey, CA, pp. 209–216, Feb.1997.](https://image.slidesharecdn.com/2411sipij12-220427055601/85/Feature-Extraction-for-Image-Classification-and-Analysis-with-Ant-Colony-Optimization-Using-Fuzzy-Logic-Approach-7-320.jpg)
Feature Extraction for Image Classification and Analysis with Ant Colony Optimization Using Fuzzy Logic Approach
- 1. Signal & Image Processing : An International Journal (SIPIJ) Vol.2, No.4, December 2011 DOI : 10.5121/sipij.2011.2412 137 Feature Extraction for Image Classification and Analysis with Ant Colony Optimization Using Fuzzy Logic Approach Subba Rao Katteda1 , Dr.C Naga Raju2 , and Maddala Lakshmi Bai3 1 Associate Professor, Department of Information Technology, St. Ann’s College of Engineering and Technology, Chirala, [email protected]. 2 Professor & HOD, Department of Information Technology, LBR College of Engineering, Mylavaram, [email protected]. 3 Associate Professor, Department of Information Technology, St. Ann’s College Of Engineering and Technology, Chirala, [email protected]. ABSTRACT The problem of structure extraction from the image which contains many clustered objects is a challenging one for high level image analysis. When an image contains many clustered objects overlapping of objects can cause for hiding the structure. The existing segmentation techniques for better understanding, not able to the address the constituent parts of the image implicitly. The approaches like multistage segmentation address to some extent, but for each stage a separate structure is extracted, and thus causes for the ambiguity about the structure. The proposed approach called Ant Colony Optimization and Fuzzy logic based technique resolves this problem, and gives the implicit structure, that meets with original structure. The segmentation approach uses the swarm intelligence technique based on the behavior of the ant colonies. The segmentation is the process of separating the non-overlapping regions that constitute an image. The segmentation is important for structured and non-structured image analysis and classification for better understanding KEYWORDS Ant Colony Optimization (ACO), Fuzzy Logic, Segmentation, Classification, Analysis. I. INTRODUCTION Over the last few decades the volume of interest, research, development of computer vision systems has increased enormously. Nowadays they appear to be important in every spear of life, ranging from the medical application to environmental science. With the advancement of the digital image processing techniques, many of the automated measurement systems have been designed to process such images. Thus there are many applications such as computer-aided diagnosis of medical images, remote sensing (e.g., identification of wheat fields, crop areas, and illegal marijuana field), optical character recognition, image manipulation for film industry, and biometrics.
- 2. Signal & Image Processing : An International Journal (SIPIJ) Vol.2, No.4, December 2011 138 Segmentation is a process of grouping an image into units that are homogeneous with respect to one or more characteristics. It is an important task in image analysis [1]. In past decades, attention has been focused on monochrome image segmentation whose goal is to separate individual objects in the perception of the scene. A common problem in segmentation of monochrome image occurs when an image has a background of varying gray levels such as gradually changing shades [2], it is difficult task to find the discontinuities [3]. This problem is inherent, since intensity is the only available information from monochrome images. It has long been recognized that the human eye can detect only in the neighborhood of one or two dozen intensity levels at any one point in a complex image due to its brightness adaptation but can discern thousands of color shades and intensities. Image analysis is the extraction of meaningful information from images, mainly from digital images by means of digital image processing techniques. Analysis facilitates the human to understand things using images rather than tables. The images that are composed of repeated patterns and contains unique texture surface are called textured images. These images do not have shape, but have color and texture. The Non-Textured images instead contain the shape along with the color and texture. These images have some clustered objects. When the structure of the image is to be extracted, then image is segmented based different characteristics. II. BACKGROUND A. General Texture Analysis Methods Different textural features have been proposed for analyzing the patterns in the image, ranging from the local pattern spectrum, multiresolution analysis and co-occurrence of grey sale values to texture spectrum based approaches. The most popular approaches for analyzing the texture are Gabor filter-based approach, markov random field (MRF) [4] models and wavelet decomposition with energy signature. These approaches are tested on images that are acquired under the ideal conditions. These approaches have not extracted the structural information implicitly. For each stage a different structure is extracted, thus causes for ambiguity. Texture analysis methods can be grouped into two broad groups. The first group comprises approaches for extracting the structural information from the images under the ideal conditions. Other group comprises of approaches that take the image under non ideal conditions [5]. In the present approach image under ideal conditions is considered for analysis. B. Ant Colony Optimization Approach This is a widely used approach in operations research and computer science. This was proposed by Marco Dorigo in the year 1992. This is probabilistic approach for solving the computational problems, which can be reduced to find good path through graph. This is a member of ant colony system [6], which is used in “swarm intelligence”. When this algorithm is applied on the grey scale image, in which each pixel is having some intensity. The information of each pixel is gathered by simple autonomous agents and is shared to exploit the solution. The autonomous agents called ants upon finding the all the high intensity pixel it leaves pheromone and computes the neighbor pixel contains highest intensity. The ants evolve on the image itself by reinforcing the pheromone levels around the pixel with different grey levels. The ant system evolves during generations moving to adjacent pixels at each generation and having more favorable survival and reproduction conditions depending on the local features of the image (for edge detection, the most contrasted the most favorable a region is). In [7], the notion of visibility determined using the maximum variation of gray level of the image intensity is used to drive the ant displacement. Eventually all the pixels in the route are determined, therefore the shortest path is chosen. But this approach has some limitations like time consuming, and inability finds the optimal path for image segmentation, when objects in the image are overlapped. These limitations can be overcome with fuzzy logic with its inference rules.
- 3. Signal & Image Processing : An International Journal (SIPIJ) Vol.2, No.4, December 2011 139 C. Fuzzy Logic (FL) Fuzzy Logic techniques have been used in image-understanding applications such as detection of edges, feature extraction, classification, and clustering. Fuzzy logic poses the ability to mimic the human mind to effectively employ modes of reasoning that are approximate rather than exact [8]. With FL, we can specify mapping rules in terms of words rather than numbers. Computing with the words explores imprecision and tolerance. Another basic concept in FL is the fuzzy if–then rule. Although rule-based systems have a long history of use in artificial intelligence [9], what is missing in such systems is machinery for dealing with fuzzy consequents or fuzzy antecedents. In most applications, an FL solution is a translation of a human solution. FL can model nonlinear functions of arbitrary complexity to a desired degree of accuracy. FL is a convenient way to map an input space to an output space. FL is one of the tools used to model a multioutput system. These Fuzzy Rules, as shown in the TABLE 1, are framed according to the intensities observed in the input image for different threshold calculated from the formulas . III. RELATED WORK The Gaussian distribution and the independent distribution have the problem of misclassifying the pixels while finding their neighbors, so this may lead to the wrong interpretation in the resulting image. To classify the image pixel rightly it is better to estimate the threshold. In this study, the process of estimating threshold is simple which in turn leads to the satisfactory results with help of reduced set of fuzzy rules. The problem discussed above when we use threshold alone for classifying the pixel to which group it belongs to, that can lead to wrong assumptions, where overlapping of the regions occur. It is very general that the pixels in different regions will be having same intensity some times, and causes for ambiguity for segmentation. This paper uses the threshold with fuzzy rules to classify the pixels to the region that it exactly belongs. With the help of the fuzzy inference rules the decision will be easy to classify the pixel based on the grey level intensity. This is unsupervised solution making use of both threshold value and fuzzy inference rules. The notations used in this paper are, the input image f, and its grayscale image is ff, the thresholds are T, T1, and T2 for mean, mean-standard deviation*const, and mean+ standard deviation * const, respectively. The input image pixels are distributed by using Gaussian distribution. The notations m represent the number of rows or line and the n represents the number of columns in the input images. The product represents the total number of pixels in the input image. This mean is used for classifying the pixel to particular group. The pixels gradient may change by one pixel, the pixel and its all eight neighbors are compared with respect to their intensities, as the comparison goes the pixels are classified that satisfies the inference rule mentioned in the TABLE 1. , 1 * 0 , 0 1 ( , ) (1) / (2) 2 / (3) m n m n i j T f i j T T T const T T T const = = = − − − − − − − − − − − = − − − − − − − − − − − − − = + − − − − − − − − − − − − ∑ IV. PROPOSED APPROACH Combining the Ant Colony Optimization with Fuzzy Logic yields the structural information of the image implicitly. Using the Fuzzy Logic a rule base is formed. When we apply ant colony optimization to the image, the autonomous agents collects the each pixel intensity value. This pixel is grouped into a particular group based on the fuzzy rule. All the pixels fall under a specific
- 4. Signal & Image Processing : An International Journal (SIPIJ) Vol.2, No.4, December 2011 140 group based on the fuzzy inference rules are highlighted to extract the structure. But the complexity of this approach is forming the fuzzy rules. The process of forming the fuzzy inference rules is probabilistic based approach, and is formed using the threshold values of the input image. When ever a pixel is selected from the input grayscale image, it is compared against each inference rule. Where ever the match is found that pixel value and its location are stored in the corresponding dataset. Depending on the number of rules, those many numbers of datasets containing the pixels meeting that particular constraint are formed. The powerful of these rules is the ability of extract all edges in the processed image directly. According to the observations of this study, the structure and the constituent parts of the image can be retrieved implicitly. Depending on the problem different sets of fuzzy rules, as shown in the TABLE 1, are framed, to process each pixel taken from the image using the ant colony optimization technique. This is accomplished with function called pixel labeling. The job of pixel labeling is to label pixel group or set, taking from ant colony optimization autonomous agents. Here each pixel is verified against with its neighbors to classify it. The pixel will have 8 neighbors, with its center. If a specified match is found then the pixel is labeled to corresponding group, and the pixel that is close in terms of intensity and also be the neighbor is considered for the centered pixel to continue the process of classification or labeling the pixels. The neighbored pixels are verified with defined threshold, and with inference rules. The algorithm1 explains the way how the grouping of the pixels is performed. According to the pixel intensity values the rules are framed. When even a pixel is picked up it is verified against this inference rule base, with different thresholds mentioned in the (1), (2) and (3) equations respectively. If any of the rules is matched then, it is moved into that particular set, this process is continued until all the pixels in the image have been processed by the pixel labeling function. The Inference Rule base can be as described in the TABLE 1. Algorithm1 The Basic Framework of Pixel labeling Begin pixel labeling () c:constant f=read image T=mean (f) T1=mean-std_of_mean/c for 1:size_of_row for 1:size_of_col Px<-f(i,j) if(Px >=rule1) ds1[]=Px else if(Px>=rule2) ds2[]=Px else if(Px>= rule3) sd3 []=Px else if(Px>= rule4) set4 []=Px end else if end else if end else if end if End In this location, some of the desired rules are explained. The four rules are dealing with the vertical and horizontal direction lines gray level values around the checked or centered pixel of
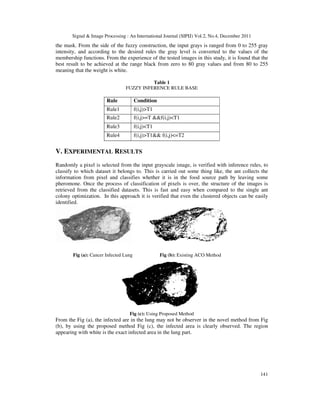
- 5. Signal & Image Processing : An International Journal (SIPIJ) Vol.2, No.4, December 2011 141 the mask. From the side of the fuzzy construction, the input grays is ranged from 0 to 255 gray intensity, and according to the desired rules the gray level is converted to the values of the membership functions. From the experience of the tested images in this study, it is found that the best result to be achieved at the range black from zero to 80 gray values and from 80 to 255 meaning that the weight is white. Table 1 FUZZY INFERENCE RULE BASE Rule Condition Rule1 f(i,j)>T1 Rule2 f(i,j>=T &&f(i,j)<T1 Rule3 f(i,j)<T1 Rule4 f(i,j)>T1&& f(i,j)<=T2 V. EXPERIMENTAL RESULTS Randomly a pixel is selected from the input grayscale image, is verified with inference rules, to classify to which dataset it belongs to. This is carried out some thing like, the ant collects the information from pixel and classifies whether it is in the food source path by leaving some pheromone. Once the process of classification of pixels is over, the structure of the images is retrieved from the classified datasets. This is fast and easy when compared to the single ant colony optimization. In this approach it is verified that even the clustered objects can be easily identified. Fig (a): Cancer Infected Lung Fig (b): Existing ACO Method Fig (c): Using Proposed Method From the Fig (a), the infected are in the lung may not be observer in the novel method from Fig (b), by using the proposed method Fig (c), the infected area is clearly observed. The region appearing with white is the exact infected area in the lung part.
- 6. Signal & Image Processing : An International Journal (SIPIJ) Vol.2, No.4, December 2011 142 Fig (d): Texture Image Fig (e): Existing ACO Method Fig (f): Using the Proposed Method The texture from Fig (d), it is observed that, the novel method could not able to extract implicitly from Fig (e), can be extracted using the proposed method from Fig (f) . The novel method has some misclassifications about the intensities that are overlapping. The proposed method is implicitly removing the misclassifications and thus producing the better results. Fig (g): Original Image Fig (h): Existing ACO Method Fig (i): Using Proposed Method The above figures Fig(i), representing the images difference between the existing and the proposed method. The proposed method is extracting the features from the images implicitly, than in the case of existing method.
- 7. Signal & Image Processing : An International Journal (SIPIJ) Vol.2, No.4, December 2011 143 VI. CONCLUSION A generic unsupervised feature extraction method and new image segmentation methods have been proposed. The frame work involves features extraction and segmentation using the fuzzy approach. The proposed method also has very reduced set of inference rules. The results have shown that the relevant and existing features of the image have been taken into account and to extract the feature of the image implicitly. The first strong point of this approach is that it has very reduced set of fuzzy inference rule. The second strong point of this approach is that it avoids the misclassifications of the intensities belong to the overlapping regions. The third contribution of this work is that it is not required to use any mask filter before being processed by the generic method, which in turn consumes some time for finding the maximum response time. It has been observed that there is some misclassification of pixel intensities at the boundaries and overlapping places of the regions of the images, that is not implicitly extracted using by the ant colony optimization alone. Finally this work proposes a new segmentation algorithm which combines ACO with Fuzzy Inference rules to extract the edge feature, region feature and physiological features taking into account, for texture and non-texture images respectively. References [1] S. Geman and D. Geman, “Stochastic relaxation, Gibbs distribution and Bayesian restoration of images,” IEEE Trans. Pattern Anal. Mach. ntell., vol. 6, no. 6, pp. 721–741, Nov. 1984. [2] D. Geman, S. Geman, C. Graffigne, and P. Dong, “Boundary detection by constrained optimization,” IEEE Trans. Pattern A nal. Mach. Intell., vol. 12, no. 7, pp. 609–628, Jul. 2007. [3] S. Geman and G. Reynolds, “Constrained restoration and recovery of discontinuities,” IEEE Trans. Pattern Anal. Mach. Intell., vol. 14, no. 3, pp. 367–383, Mar. 2004. [4] X. Descombes, F. Kruggel, and Y. von Cramon, “Spatio-temporal fMRI analysis using Markov random fields,” IEEE Trans. Med. Imag., vol. 17, no. 6, pp. 1028–1039, Jun. 2001. [5] Umasankar Kandswamy, Stephenie ASchucker, and Donald Adjeroh, “Comparision of Texture Analysis Schemes Under Nonideal Conditions’,IEEE Trans on Image Processing, vol 20, no 8, pp2260-2275, Aug. 2011. [6] Marco Dorigo and Christian Blum, “Ant Colony Optimization :A Survey”, Elsevier Journal of Theoretical computer science, pp 243-278, Mar. 2005. [7] M. Dorigo, V. Maniezzo, and A. Colorni, “The ant system: Optimization by a colony of cooperating agents,” IEEE Trans. Syst., Man, Cybern. B, Cybern., vol. 26, no. 1, pp. 29–41, Feb. 2006. [8] H. D. Hofmann, "Application of Intelligent Measurements with Metrical Image Processing for Quality Control", resented at the 5th International Conference, PEDAC' 92, Alexandria, EGYPT, December 2005. [9] R. Schoonderwoerd, O. Holland, and J. Bruten, “Ant-like agents for load balancing in telecommunications networks,” in Proc. ACM Agents, Marina del Rey, CA, pp. 209–216, Feb.1997.