SlideShare a Scribd company logo
Finding local lessons
    in software engineering


Tim Menzies, WVU, USA, tim@menzies.us

   Tsinghua University, China, Nov’09
Sound bites
•! An observation:
   –! Surprisingly few general SE results.


•! A requirement:
   –! Need simple methods for finding local lessons.


•! Take home lesson:
   –! Finding useful local lessons is remarkably simple
   –! E.g. using “W” or “NOVA”
Roadmap
•!   Motivation: generality in SE
•!   A little primer: DM for SE
•!   “W”: finding contrast sets
•!   “W”: case studies
•!   “W”: drawbacks
•!   “NOVA”: a better “W”
•!   Conclusions
Roadmap
•!   Motivation: generality in SE
•!   A little primer: DM for SE
•!   “W”: finding contrast sets
•!   “W”: case studies
•!   “W”: drawbacks
•!   “NOVA”: a better “W”
•!   Conclusions
5/4
4
Have we lived up
                        to our PROMISE?
Few general results
•!   PROMISE 2005 … 2009 : 64 presentations
•!   48 papers
      –! tried a new analysis on old data
      –! Or reported a new method that worked once for one project.
•!   4 papers
      –! argued against model generality
•!   9 papers
      –! questioned validity of prior results
•!   E.g. Menzies et al. Promise 2006
      –! 100 times
            •! Select 90% of the training data
            •! Find<a,b> in effort = x.a.LOC b
Have we lived up
                      to our PROMISE?
Only 11% of papers proposed general models

•! E.g. Ostrand, Weyuker, Bell ‘08, ‘09
    –! Same functional form
    –! Predicts defects for generations of AT&T software

•! E.g. Turhan, Menzies, Bener ’08, ‘09
    –! 10 projects
        •! Learn on 9
        •! Apply to the 10th
    –! Defect models learned from NASA projects work for Turkish
       whitegoods software
        •! Caveat: need to filter irrelevant training examples
Less Promising Results
Lessons learned are very localized
•!   FSE’09: Zimmerman et al.
      –! Defect models
         not generalizable
           •! Learn “there”, apply
              “here” only works in 4%
               of their 600+ experiments
      –! Opposite to Turhan’09 results
           •! ?add relevancy filter

•!   ASE’09: Green, Menzies et al.
      –! AI search for better software project options
      –! Conclusions highly dependent on
         local business value proposition

•!   And others
      –! TSE’06: Menzies, Greenwald
      –! Menzies et al. in ISSE 2007
      –! Zannier et al ICSE’06
Overall
The gods are (a little) angry
                     •!   Fenton at PROMISE’ 07
                           –! "... much of the current software metrics research is
                              inherently irrelevant to the industrial mix ...”
                           –! "... any software metrics program that depends on some
                              extensive metrics collection is doomed to failure ...”


                     •!   Budgen & Kitchenham:
                           –! “Is Evidence Based Software Engineering mature
                              enough for Practice & Policy? ”
                           –! Need for better reporting: more reviews.
                           –! Empirical SE results too immature for making
                              policy.

                     •!   Basili : still far to go
                           –! But we should celebrate the progress made over
                              the last 30 years.
                           –! And we are turning the corner
Experience Factories
Methods to find local lessons


•!   Basili’09 (pers. comm.):
      –! “All my papers have the same form.
      –! “For the project being studied, we find that changing X improved Y.”


•! Translation (mine):
      –! Even if we can’t find general models (which seem to be quite rare)….
      –! … we can still research general methods for finding local lessons
         learned
The rest of this talk: contrast
               set learning and “W”
W= a local lessons finder
•!   Bayesian case-based                          accuracy

     contrast-set learner
      –! uses greedy search
      –! illustrates the “local lessons” effect
      –! offers functionality missing in
         the effort-estimation literature

•!   Fast generator of baseline results
      –! There are too few baseline results
      –! And baseline results can be very
         interesting (humbling).                             Holte’85
                                                             • C4: builds decision trees “N” deep
•!   A very (very) simple algorithm                          • 1R: builds decision trees “1” deep
                                                             • For datasets with 2 classes, 1R ! C4
      –! Should add it to your toolkit
      –! At least, as the “one to beat”
Roadmap
•!   Motivation: generality in SE
•!   A little primer: DM for SE
•!   “W”: finding contrast sets
•!   “W”: case studies
•!   “W”: drawbacks
•!   “NOVA”: a better “W”
•!   Conclusions
Problem
Too much information
14/
                                 46 good
  Tree Pruning
 Can you see the big picture?

                                     ok
•! Good branches go to
   good goals
•! Bad branches go to bad
   goals
•! Select decisions that
   select for
                                    worse
   –! Most good
   –! Least bad
•! TARZAN:
   –! swings through the trees
   –! Post-processor to C4.5
                                    worst
15/
                                 46 good
  Tree Pruning
 Can you see the big picture?

                                     ok
•! Good branches go to
   good goals
•! Bad branches go to bad
   goals
•! Select decisions that
   select for
                                    worse
   –! Most good
   –! Least bad
•! TARZAN:
   –! swings through the trees
   –! Post-processor to C4.5
                                    worst
16/
                                 46 good
  Tree Pruning
 Can you see the big picture?

                                     ok
•! Good branches go to
   good goals
•! Bad branches go to bad
   goals
•! Select decisions that
   select for
                                    worse
   –! Most good
   –! Least bad
•! TARZAN:
   –! swings through the trees
   –! Post-processor to C4.5
                                    worst
17/
                                  46 good
  Comment
 Less is best

                                      ok
•! Higher decisions prune more
   branches
•! #nodes at level I much
   smaller than level I+1.
•! So tree pruning often yields
   very small sets of                worse

   recommendations


                                     worst
Don’t bury me in data
Don’t show me “what is”; just tell what “to do”
Roadmap
•!   Motivation: generality in SE
•!   A little primer: DM for SE
•!   “W”: finding contrast sets
•!   “W”: case studies
•!   “W”: drawbacks
•!   “NOVA”: a better “W”
•!   Conclusions
“W”= Simple (Bayesian) Contrast
       Set Learning (in linear time)
Mozina: KDD’04
•!   “best” = target class (e.g. “survive”)
•!   “rest” = other classes
•!   x = any range (e.g. “sex=female”)
•!   f(x|c) = frequency of x in class c

•!   b = f( x | best ) / F(best)
•!   r = f( x | rest ) / F(rest)

•!   LOR= log(odds ratio) = log(b/r)
      –! ? normalize 0 to max = 1 to 100

•!   s = sum of LORs
      –! e     = 2.7183 …
      –! p     = F(B) / (F(B) + F(R))
      –! P(B) = 1 / (1 + e^(-1*ln(p/(1 - p)) - s ))
“W”:Simpler (Bayesian) Contrast
       Set Learning (in linear time)
Mozina: KDD’04
•!   “best” = target class
•!   “rest” = other classes
•!   x = any range (e.g. sex = female)
•!   f(x|c) = frequency of x in class c

•!   b = f( x | best ) / F(best)
•!   r = f( x | rest ) / F(rest)

•!   LOR= log(odds ratio) = log(b/r)
      –! ? normalize 0 to max = 1 to 100

•!   s = sum of LORs
      –! e     = 2.7183 …                             “W”:
                                                      1)!    Discretize data and outcomes
      –! p     = F(B) / (F(B) + F(R))
                                                      2)!    Count frequencies of ranges in classes
      –! P(B) = 1 / (1 + e^(-1*ln(p/(1 - p)) - s ))   3)!    Sort ranges by LOR
                                                      4)     Greedy search on top ranked ranges
“W” + CBR
Preliminaries
•! “Query”
   –! What kind of project you want to analyze; e.g.
      •! Analysts not so clever,
      •! High reliability system
      •! Small KLOC

•! “Cases”
   –! Historical records, with their development effort

•! Output:
   –! A recommendation on how to change our projects
      in order to reduce development effort
Cases map features F to a utility
Cases   F= Controllables + others


train        test
Cases map features F to a utility
       Cases       F= Controllables + others


           train        test


  (query ! ranges)

    k-NN


relevant
Cases map features F to a utility
       Cases        F= Controllables + others


           train           test


  (query ! ranges)

    k-NN            Best
                   utilities
                      x    b = F(x | best) / F(best)

relevant
                      x    r = F(x | rest) / F(rest)

                    rest
Cases map features F to a utility
       Cases        F= Controllables + others


           train           test


  (query ! ranges)                         S = all x sorted descending by score

    k-NN            Best
                   utilities
                      x    b = F(x | best) / F(best)
                                                          if   controllable(x) &&
                                                               b > r &&
relevant                                                       b > min
                      x    r = F(x | rest) / F(rest)      then score(x) = log(b/r)
                                                          else score(x) = 0
                    rest                                  fi
Cases map features F to a utility
       Cases        F= Controllables + others


                                         queryi* =      k-NN
           train           test
                                         query + "iSi
                                                               treatedi

  (query ! ranges)                         S = all x sorted descending by score

    k-NN            Best
                   utilities
                      x    b = F(x | best) / F(best)
                                                          if   controllable(x) &&
                                                               b > r &&
relevant                                                       b > min
                      x    r = F(x | rest) / F(rest)      then score(x) = log(b/r)
                                                          else score(x) = 0
                    rest                                  fi
Cases map features F to a utility
       Cases        F= Controllables + others

                                                                          utility
                                                                                     median

                                         queryi* =      k-NN                         spread
           train           test                                                               i
                                         query + "iSi
                                                               treatedi

  (query ! ranges)                         S = all x sorted descending by score

    k-NN            Best
                   utilities
                      x    b = F(x | best) / F(best)
                                                          if   controllable(x) &&
                                                               b > r &&
relevant                                                       b > min
                      x    r = F(x | rest) / F(rest)      then score(x) = log(b/r)
                                                          else score(x) = 0
                    rest                                  fi
Cases map features F to a utility                                   treatment

       Cases        F= Controllables + others
                                                                              q 0* q i*
                                                                          utility
                                                                                            median

                                         queryi* =      k-NN                                spread
           train           test                                                                       i
                                         query + "iSi
                                                               treatedi             As is     To be


  (query ! ranges)                         S = all x sorted descending by score

    k-NN            Best
                   utilities
                      x    b = F(x | best) / F(best)
                                                          if   controllable(x) &&
                                                               b > r &&
relevant                                                       b > min
                      x    r = F(x | rest) / F(rest)      then score(x) = log(b/r)
                                                          else score(x) = 0
                    rest                                  fi
Roadmap
•!   Motivation: generality in SE
•!   A little primer: DM for SE
•!   “W”: finding contrast sets
•!   “W”: case studies
•!   “W”: drawbacks
•!   “NOVA”: a better “W”
•!   Conclusions
Results (distribution of
                                    development efforts in qi*)
Using cases from http://promisedata.org
                                                                        Cases from promisedata.org/data

                                                                        Median = 50% percentile
                                                                        Spread = 75% - 25% percentile

                                                                        Improvement = (X - Y) / X
                                                                        •! X = as is
                                                                        •! Y = to be
                                                                        •! more is better

                            150%
                                                                        Usually:
                                                                        •! spread " 75% improvement
spread improvement


                            100%                                        •! median " 60% improvement


                            50%


                             0%
                     -50%      0%           50%           100%   150%
                                     median improvement
Not-so-good news
Local lessons are very localized
Roadmap
•!   Motivation: generality in SE
•!   A little primer: DM for SE
•!   “W”: finding contrast sets
•!   “W”: case studies
•!   “W”: drawbacks
•!   “NOVA”: a better “W”
•!   Conclusions
Cases map features F to a utility                                   treatment

       Cases        F= Controllables + others
                                                                              q 0* q i*
                                                                          utility
                                                                                            median

                                         queryi* =      k-NN                                spread
           train           test                                                                       i
                                         query + "iSi
                                                               treatedi             As is     To be


  (query ! ranges)                         S = all x sorted descending by score

    k-NN            Best
                   utilities
                      x    b = F(x | best) / F(best)
                                                          if   controllable(x) &&
                                                               b > r &&
relevant                                                       b > min
                      x    r = F(x | rest) / F(rest)      then score(x) = log(b/r)
                                                          else score(x) = 0
                    rest                                  fi
Cases map features F to a utility                                   treatment

      Cases    F= Controllables + others
A greedy linear time search?
                                                                         q 0* q i*
                                                                     utility
 • Need to use much better search algorithms          median
 • Simulated annealing, Beam, *Astar, ISSAMP, MaxWalkSat
                         queryi =     k-NN           spread
 • SEESAW         test
       train (home brew)                                     i
                         query + "iSi
                                                          treatedi             As is     To be


  (query ! ranges)                    S = all x sorted descending by score

    k-NN       Best
              utilities
                 x    b = F(x | best) / F(best)
                                                     if   controllable(x) &&
                                                          b > r &&
relevant                                                  b > min
                 x    r = F(x | rest) / F(rest)      then score(x) = log(b/r)
                                                     else score(x) = 0
               rest                                  fi
Cases map features F to a utility                                   treatment

       Cases        F= Controllables + others
                                                                              q 0* q i*
                                                                          utility
                                                                                            median

                                         queryi* =      k-NN                                spread
           train           test                                                                       i
                                         query + "iSi
                                                               treatedi             As is     To be


  (query ! ranges)                         S = all x sorted descending by score

    k-NN            Best
                   utilities
                      x    b = F(x | best) / F(best)
                                                          if   controllable(x) &&
                                                               b > r &&
relevant                                                       b > min
                      x    r = F(x | rest) / F(rest)      then score(x) = log(b/r)
                                                          else score(x) = 0
                    rest                                  fi
Cases map features F to a utility                                   treatment

       Cases        F= Controllables + others
                                                                              q 0* q i*
                                                                          utility
                                                                                            median

                                         queryi* =      k-NN                                spread
           train           test                                                                       i
                                         query + "iSi
                                                               treatedi             As is     To be


  (query ! ranges)                         S = all x sorted descending by score

    k-NN            Best
                   utilities
                      x    b = F(x | best) / F(best)
                                                          if   controllable(x) &&
                                                               b > r &&
relevant                                                       b > min
                      x    r = F(x | rest) / F(rest)      then score(x) = log(b/r)
                                                          else score(x) = 0
                    rest                                  fi
Cases map features F to a utility                             treatment

       Cases         F= Controllables + others
                                                                          q 0* q i*
                                                                     utility
                   Just trying to reduce effort?
                                                                                       median

                               queryi* =     k-NN                                     spread
              •
           train        test
                     What aboutquery + " S
                                development time?                      i
                                         i i
              •      What about number of defects? i
                                                treated   As is  To be
              • What about different business contexts?
  (query ! ranges) “racing to = all x sorted descending by score
                e.g.        S market” vs “mission-critical” apps

    k-NN             Best
                    utilities
                       x    b = F(x | best) / F(best)
                                                        if   controllable(x) &&
                                                             b > r &&
relevant                                                     b > min
                       x    r = F(x | rest) / F(rest)   then score(x) = log(b/r)
                                                        else score(x) = 0
                     rest                               fi
Cases map features F to a utility                                   treatment

       Cases        F= Controllables + others
                                                                              q 0* q i*
                                                                          utility
                                                                                            median

                                         queryi* =      k-NN                                spread
           train           test                                                                       i
                                         query + "iSi
                                                               treatedi             As is     To be


  (query ! ranges)                         S = all x sorted descending by score

    k-NN            Best
                   utilities
                      x    b = F(x | best) / F(best)
                                                          if   controllable(x) &&
                                                               b > r &&
relevant                                                       b > min
                      x    r = F(x | rest) / F(rest)      then score(x) = log(b/r)
                                                          else score(x) = 0
                    rest                                  fi
Cases map features F to a utility                              treatment

       Cases        F= Controllables + others
                                                                         q 0* q i*
                                                                     utility
                                                                                       median

                                     queryi* =      k-NN                               spread
           train           test                                                                  i
                                     query + "iSi
                                                          treatedi             As is     To be


  (query ! ranges)             Is nearestall x sorted descending by score
                                     S = neighbor causing
                               conclusion instability?
    k-NN            Best
                   utilities   • Q: How to smooth the bumps between
                      x
                                   between the samples ?
                            b = F(x | best) / F(best)
                                                      if   controllable(x) &&
                                                           b > r &&
relevant                       • A: Don’t apply constraints to the data
                                                           b > min
                      x    r = F(x | • Apply it as model inputs instead
                                     rest) / F(rest)  then score(x) = log(b/r)
                                                      else score(x) = 0
                    rest                             fi
Cases map features F to a utility                                   treatment

       Cases        F= Controllables + others
                                                                              q 0* q i*
                                                                          utility
                                                                                            median

                                         queryi* =      k-NN                                spread
           train           test                                                                       i
                                         query + "iSi
                                                               treatedi             As is     To be


  (query ! ranges)                         S = all x sorted descending by score

    k-NN            Best
                   utilities
                      x    b = F(x | best) / F(best)
                                                          if   controllable(x) &&
                                                               b > r &&
relevant                                                       b > min
                      x    r = F(x | rest) / F(rest)      then score(x) = log(b/r)
                                                          else score(x) = 0
                    rest                                  fi
Cases map features F to a utility                                  treatment

       Cases        F= Controllables + others
                                                                             q 0* q i*
                                                                         utility
                                                                                           median

                                         queryi* =      k-NN                               spread
           train           test                                                                      i
                                         query + "iSi
                                                              treatedi             As is     To be


  (query ! ranges)                        Justall x sorted descending by score
                                           S = one test?

    k-NN            Best                   • What about looking for
                   utilities                 stability in “N” repeats?
                      x    b = F(x | best) / F(best)
                                                         if   controllable(x) &&
                                                              b > r &&
relevant                                                      b > min
                      x    r = F(x | rest) / F(rest)     then score(x) = log(b/r)
                                                         else score(x) = 0
                    rest                                 fi
Cases map features F to a utility                                   treatment

       Cases        F= Controllables + others
                                                                              q 0* q i*
                               1      More tests
                                                                          utility
                                                                                            median

                                         queryi* =      k-NN                                spread
           train           test                                                                       i
                                         query + "iSi
                                                               treatedi             As is     To be


  (query ! ranges)                         S = all x sorted descending by score

    k-NN            Best
                   utilities
                      x    b = F(x | best) / F(best)
                                                          if   controllable(x) &&
                                                               b > r &&
relevant                                                       b > min
                      x    r = F(x | rest) / F(rest)      then score(x) = log(b/r)
                                                          else score(x) = 0
                    rest                                  fi
Cases map features F to a utility                                   treatment

       Cases         F= Controllables + others
                                                                               q 0* q i*
                                1      More tests
                                                                           utility
                                                                                             median

                                          queryi* =      k-NN                                spread
           train            test                                                                       i
                                          query + "iSi
                                                                treatedi             As is     To be


  (query ! ranges)                          S = all x sorted descending by score

    k-NN           2 Best
                    utilities
     More models
              x             b = F(x | best) / F(best)
                                                           if   controllable(x) &&
                                                                b > r &&
relevant                                                        b > min
                       x    r = F(x | rest) / F(rest)      then score(x) = log(b/r)
                                                           else score(x) = 0
                     rest                                  fi
Cases map features F to a utility                 3         More goals
                                                                                    treatment

       Cases         F= Controllables + others
                                                                               q 0* q i*
                                1      More tests
                                                                           utility
                                                                                             median

                                          queryi* =      k-NN                                spread
           train            test                                                                       i
                                          query + "iSi
                                                                treatedi             As is     To be


  (query ! ranges)                          S = all x sorted descending by score

    k-NN           2 Best
                    utilities
     More models
              x             b = F(x | best) / F(best)
                                                           if   controllable(x) &&
                                                                b > r &&
relevant                                                        b > min
                       x    r = F(x | rest) / F(rest)      then score(x) = log(b/r)
                                                           else score(x) = 0
                     rest                                  fi
Cases map features F to a utility                   3         More goals
                                                                                      treatment

       Cases         F= Controllables + others
                                                                                 q 0* q i*
                                1      More tests
                                                                             utility
                                                                                               median

                                          queryi* =        k-NN                                spread
           train            test                                                                         i
                                          query + "iSi
                                                                  treatedi             As is     To be


  (query ! ranges)                          S = all x sorted descending by score

    k-NN           2 Best                        4      More search
                    utilities
     More models
              x             b = F(x | best) / F(best)
                                                             if   controllable(x) &&
                                                                  b > r &&
relevant                                                          b > min
                       x    r = F(x | rest) / F(rest)        then score(x) = log(b/r)
                                                             else score(x) = 0
                     rest                                    fi
Roadmap
•!   Motivation: generality in SE
•!   A little primer: DM for SE
•!   “W”: finding contrast sets
•!   “W”: case studies
•!   “W”: drawbacks
•!   “NOVA”: a better “W”
•!   Conclusions
More models
USC Cocomo suite (Boehm 1981, 2000)!

COCOMO
•! Time to build it (calendar months)
•! Effort to build it (total staff months)

COQUALMO
•! defects per 1000 lines of code

Estimate = model( p, t )
•! P = project options
•! T = tuning options
•! Normal practice: Adjust “t” using local data
•! NOVA: Stagger randomly all tunings even seen before
                                                         ?
More goals

B = BFC                           X = XPOS

Goal #1:                          Goal #2
•! better, faster, cheaper        •! minimize risk exposure


Try to minimize:
                                  Rushing to beat the competition
•! Development time and
                                  •! Get to market, soon as you can
•! Development effort and
                                  •! Without too many defects
•! # defects
More search engines
Not greedy search!

Simulated Annealling

ISSAMP

ASTAR

BEAM

MaxWalkSat

SEESAW : MaxWalkSat + boundary mutation
•! Local favorite
•! Does best at reduction defects or effort or time
More tests
Four data sets, repeat N=20 times!


Data sets
•! OSP= orbital space plane GNC
•! OSP2 = second generation GNC
•! Flight = JPL flight systems
•! Ground = JPL ground systems

For each data set
•! Search N= 20 times (with SEESAW)
•! Record how often decisions are found
Better, faster, cheaper   Minimize risk exposure
Frequency%                                     (rushing to market)

of range in
20 repeats
                                                                 If high, then
(ignore all ranges                                               more in BFC
found < 50%)
                                                                 If 50% then same
                                                                 In BFC and XPOS

                                                                 If low, then
                                                                 usually in XPOS


                                                                    “Value”
                                                                     (business context)
 Mostly: if selected by one, rejected by the other                  changes everything
Better, faster, cheaper   Minimize risk exposure
And what of                                                   (rushing to market)

defect removal
techniques?

Aa = automated analysis
Etat= execution testing and tools
Pr= peer review


    Stopping defect introduction is better than defect removal.
Roadmap
•!   Motivation: generality in SE
•!   A little primer: DM for SE
•!   “W”: finding contrast sets
•!   “W”: case studies
•!   “W”: drawbacks
•!   “NOVA”: a better “W”
•!   Conclusions
Certainly, we should always
                  strive for generality
But don’t be alarmed if you can’t find it
 •! The experience to date is that,
     –! with rare exceptions,
     –! W and NOVA do not lead to general theories

 •! But that’s ok
     –! Very few others have found general models (in SE)
     –! E.g. Turhan, Menzies, Ayse’09


 •! Anyway
     –! If there are few general results, there may be general methods to find
        local results
Btw, constantly (re)building local
models is a general model
Case-based reasoning


•! Kolodner’s theory of
   reconstructive memory


•! The Yale group
   –! Shank & Riesbeck et al.
   –! Memory, not models
   –! Don’t “think”, remember
See you at PROMISE’10?


   http://promisedata.org/2010
Supplemental slides
Contact details
We know where you live.


 •! tim@menzies.us

 •! http://menzies.us

 •! http://twitter.com/timmenzies

 •! http://www.facebook.com/tim.menzies
63/
                                         46
       Questions?
       Comments?


“You want proof? I’ll give you proof!”
64/
                                                   46
               Future work
What’s next?

                •! Better than Bgreedy?
                  –! While staying simple?

                •! Incremental anomaly
                   detection and lesson revision
                  –! Not discussed here
                  –! Turns out, that may be very
                     simple (see me later)
65/
                                  46

A little primer: DM for SE


 Summary: easier than you think
  (#include standardCaveat.h)
66/
                              46
Monte Carlo + Decision
Tree Learning
Menzies: ASE’00

•! Process models
  –! Input: project details
  –! Output: (effort, risk)
•! Increase #simulations
  –! till error minimizes
•! Learn decision trees
•! Repeat 10 times
67/
                                                          46
                 Software Management
Given nowi which subsets of changesi is most effective?
68/
                       Problem   46

Too much information
69/
                                 46 good
  Tree Pruning
 Can you see the big picture?

                                     ok
•! Good branches go to
   good goals
•! Bad branches go to bad
   goals
•! Select decisions that
   select for
                                    worse
   –! Most good
   –! Least bad
•! TARZAN:
   –! swings through the trees
   –! Post-processor to C4.5
                                    worst
70/
                                 46 good
  Tree Pruning
 Can you see the big picture?

                                     ok
•! Good branches go to
   good goals
•! Bad branches go to bad
   goals
•! Select decisions that
   select for
                                    worse
   –! Most good
   –! Least bad
•! TARZAN:
   –! swings through the trees
   –! Post-processor to C4.5
                                    worst
71/
                                 46 good
  Tree Pruning
 Can you see the big picture?

                                     ok
•! Good branches go to
   good goals
•! Bad branches go to bad
   goals
•! Select decisions that
   select for
                                    worse
   –! Most good
   –! Least bad
•! TARZAN:
   –! swings through the trees
   –! Post-processor to C4.5
                                    worst
72/
                                  46 good
  Comment
 Less is best

                                      ok
•! Higher decisions prune more
   branches
•! #nodes at level I much
   smaller than level I+1.
•! So tree pruning often yields
   very small sets of                worse

   recommendations


                                     worst
73/
                                                  46
            Don’t bury me in data
Don’t show me “what is”; just tell what “to do”
Given the size of the search space,   74/
                                      46
   the small number of decision
     points was very surprising
75/
 The “keys” effect:                                                         46
 usually, a few variables set the rest
     SAILing is easy
•! So the complexity of the whole depends on just a small part

•! Empirical evidence:
       –!   Feature subset selection: Kohavi’97
       –!   Few pathways: Bieman’92, Harrold’98
       –!   Mutation testing & rapid saturation: Budd’80, Wong’95, Michael’97
       –!   Surprisingly few internal states: Drezdel’94, Colomb’00, Menzies’99
       –!   Success of stochastic theorem provers: Crawford’94, Williams & Selman’03

•! Theoretical evidence:
       –! Menzies & Singh ‘03

•!    Easy to find these keys
       –! Score the outputs
       –! Look for ranges more frequent in “best” than “rest”
       –! A useful short-cut to data mining, model-based reasoning
76/
                  Treatment learning:                                                 46

                     9 years later
Gay, Menzies et al.’ 09
•! TARZAN is no longer a post-processor
      •! Branch queries performed directly
        on discretized data
             •! thanks David Poole
      •! Stochastic sampling
        for rule generation

•! Benchmarked against state-of-the-art
  numerical optimizers for GNC control


                                             Still generating tiny rules
                                             (very easy to read, explain, audit, implement)

More Related Content

Similar to Finding local lessons in software engineering (20)

PDF
Just the basics_strata_2013
Ken Mwai
 
PDF
2014-9-24-SBC361-ResearchMethComm
Yannick Wurm
 
PPT
Assessment Rubrics
Andrew Gaydos
 
PDF
Statistics for linguistics
aiaioo
 
PPTX
02 naive bays classifier and sentiment analysis
Subhas Kumar Ghosh
 
PPTX
The effects of preferred text formatting on performance and perceptual appeal
Paul Doncaster
 
PDF
Fixing the program my computer learned: End-user debugging of machine-learned...
City University London
 
PDF
FAIR Assessment for Repositories and Researchers
EOSCpilot .eu
 
PDF
What’s wrong with research papers - and (how) can we fix it?
Anita de Waard
 
PPTX
Simulating data to gain insights into power and p-hacking
Dorothy Bishop
 
PPTX
Sediment analysis: what is Sediment analysis
VernonSmap
 
PDF
co:op-READ-Convention Marburg - Roger Labahn
ICARUS - International Centre for Archival Research
 
PDF
Making an Impact: UX Team of One
vmcagwin
 
PDF
The Next Generation of Game Planners
Luke Dicken
 
PDF
Sequencing run grief counseling: counting kmers at MG-RAST
wltrimbl
 
PPTX
Domain-Driven Design: The "What" and the "Why"
bincangteknologi
 
PDF
Introducing Online Education to Hypermedia
C4Media
 
PPT
Creating an effective board presentation
sumidahilo
 
PPTX
A Panorama of Natural Language Processing
Ted Xiao
 
PPTX
Core Methods In Educational Data Mining
ebelani
 
Just the basics_strata_2013
Ken Mwai
 
2014-9-24-SBC361-ResearchMethComm
Yannick Wurm
 
Assessment Rubrics
Andrew Gaydos
 
Statistics for linguistics
aiaioo
 
02 naive bays classifier and sentiment analysis
Subhas Kumar Ghosh
 
The effects of preferred text formatting on performance and perceptual appeal
Paul Doncaster
 
Fixing the program my computer learned: End-user debugging of machine-learned...
City University London
 
FAIR Assessment for Repositories and Researchers
EOSCpilot .eu
 
What’s wrong with research papers - and (how) can we fix it?
Anita de Waard
 
Simulating data to gain insights into power and p-hacking
Dorothy Bishop
 
Sediment analysis: what is Sediment analysis
VernonSmap
 
co:op-READ-Convention Marburg - Roger Labahn
ICARUS - International Centre for Archival Research
 
Making an Impact: UX Team of One
vmcagwin
 
The Next Generation of Game Planners
Luke Dicken
 
Sequencing run grief counseling: counting kmers at MG-RAST
wltrimbl
 
Domain-Driven Design: The "What" and the "Why"
bincangteknologi
 
Introducing Online Education to Hypermedia
C4Media
 
Creating an effective board presentation
sumidahilo
 
A Panorama of Natural Language Processing
Ted Xiao
 
Core Methods In Educational Data Mining
ebelani
 

More from CS, NcState (20)

PPTX
Talks2015 novdec
CS, NcState
 
PPTX
Future se oct15
CS, NcState
 
PPTX
GALE: Geometric active learning for Search-Based Software Engineering
CS, NcState
 
PPTX
Big Data: the weakest link
CS, NcState
 
PPTX
Three Laws of Trusted Data Sharing: (Building a Better Business Case for Dat...
CS, NcState
 
PPTX
Lexisnexis june9
CS, NcState
 
PPTX
Welcome to ICSE NIER’15 (new ideas and emerging results).
CS, NcState
 
PPTX
Icse15 Tech-briefing Data Science
CS, NcState
 
PPTX
Kits to Find the Bits that Fits
CS, NcState
 
PPTX
Ai4se lab template
CS, NcState
 
PPTX
Automated Software Enging, Fall 2015, NCSU
CS, NcState
 
PPT
Requirements Engineering
CS, NcState
 
PPT
172529main ken and_tim_software_assurance_research_at_west_virginia
CS, NcState
 
PPTX
Automated Software Engineering
CS, NcState
 
PDF
Next Generation “Treatment Learning” (finding the diamonds in the dust)
CS, NcState
 
PPTX
Tim Menzies, directions in Data Science
CS, NcState
 
PPTX
Goldrush
CS, NcState
 
PPTX
Dagstuhl14 intro-v1
CS, NcState
 
PPTX
Know thy tools
CS, NcState
 
PPTX
The Art and Science of Analyzing Software Data
CS, NcState
 
Talks2015 novdec
CS, NcState
 
Future se oct15
CS, NcState
 
GALE: Geometric active learning for Search-Based Software Engineering
CS, NcState
 
Big Data: the weakest link
CS, NcState
 
Three Laws of Trusted Data Sharing: (Building a Better Business Case for Dat...
CS, NcState
 
Lexisnexis june9
CS, NcState
 
Welcome to ICSE NIER’15 (new ideas and emerging results).
CS, NcState
 
Icse15 Tech-briefing Data Science
CS, NcState
 
Kits to Find the Bits that Fits
CS, NcState
 
Ai4se lab template
CS, NcState
 
Automated Software Enging, Fall 2015, NCSU
CS, NcState
 
Requirements Engineering
CS, NcState
 
172529main ken and_tim_software_assurance_research_at_west_virginia
CS, NcState
 
Automated Software Engineering
CS, NcState
 
Next Generation “Treatment Learning” (finding the diamonds in the dust)
CS, NcState
 
Tim Menzies, directions in Data Science
CS, NcState
 
Goldrush
CS, NcState
 
Dagstuhl14 intro-v1
CS, NcState
 
Know thy tools
CS, NcState
 
The Art and Science of Analyzing Software Data
CS, NcState
 
Ad

Recently uploaded (20)

PPTX
Presentation: Climate Citizenship Digital Education
Karl Donert
 
PPTX
Gall bladder, Small intestine and Large intestine.pptx
rekhapositivity
 
PPTX
How to Configure Lost Reasons in Odoo 18 CRM
Celine George
 
PPTX
ROLE OF ANTIOXIDANT IN EYE HEALTH MANAGEMENT.pptx
Subham Panja
 
PPTX
ASRB NET 2023 PREVIOUS YEAR QUESTION PAPER GENETICS AND PLANT BREEDING BY SAT...
Krashi Coaching
 
PPSX
Health Planning in india - Unit 03 - CHN 2 - GNM 3RD YEAR.ppsx
Priyanshu Anand
 
PPTX
Growth and development and milestones, factors
BHUVANESHWARI BADIGER
 
PPTX
Views on Education of Indian Thinkers Mahatma Gandhi.pptx
ShrutiMahanta1
 
PPTX
A PPT on Alfred Lord Tennyson's Ulysses.
Beena E S
 
PPTX
How to Configure Access Rights of Manufacturing Orders in Odoo 18 Manufacturing
Celine George
 
PPTX
PPT on the Development of Education in the Victorian England
Beena E S
 
PDF
DIGESTION OF CARBOHYDRATES,PROTEINS,LIPIDS
raviralanaresh2
 
PDF
CONCURSO DE POESIA “POETUFAS – PASSOS SUAVES PELO VERSO.pdf
Colégio Santa Teresinha
 
PPTX
HYDROCEPHALUS: NURSING MANAGEMENT .pptx
PRADEEP ABOTHU
 
PPTX
How to Configure Prepayments in Odoo 18 Sales
Celine George
 
PDF
ARAL-Orientation_Morning-Session_Day-11.pdf
JoelVilloso1
 
PPTX
Capitol Doctoral Presentation -July 2025.pptx
CapitolTechU
 
PPTX
Optimizing Cancer Screening With MCED Technologies: From Science to Practical...
i3 Health
 
PPTX
Pyhton with Mysql to perform CRUD operations.pptx
Ramakrishna Reddy Bijjam
 
PPTX
Explorando Recursos do Summer '25: Dicas Essenciais - 02
Mauricio Alexandre Silva
 
Presentation: Climate Citizenship Digital Education
Karl Donert
 
Gall bladder, Small intestine and Large intestine.pptx
rekhapositivity
 
How to Configure Lost Reasons in Odoo 18 CRM
Celine George
 
ROLE OF ANTIOXIDANT IN EYE HEALTH MANAGEMENT.pptx
Subham Panja
 
ASRB NET 2023 PREVIOUS YEAR QUESTION PAPER GENETICS AND PLANT BREEDING BY SAT...
Krashi Coaching
 
Health Planning in india - Unit 03 - CHN 2 - GNM 3RD YEAR.ppsx
Priyanshu Anand
 
Growth and development and milestones, factors
BHUVANESHWARI BADIGER
 
Views on Education of Indian Thinkers Mahatma Gandhi.pptx
ShrutiMahanta1
 
A PPT on Alfred Lord Tennyson's Ulysses.
Beena E S
 
How to Configure Access Rights of Manufacturing Orders in Odoo 18 Manufacturing
Celine George
 
PPT on the Development of Education in the Victorian England
Beena E S
 
DIGESTION OF CARBOHYDRATES,PROTEINS,LIPIDS
raviralanaresh2
 
CONCURSO DE POESIA “POETUFAS – PASSOS SUAVES PELO VERSO.pdf
Colégio Santa Teresinha
 
HYDROCEPHALUS: NURSING MANAGEMENT .pptx
PRADEEP ABOTHU
 
How to Configure Prepayments in Odoo 18 Sales
Celine George
 
ARAL-Orientation_Morning-Session_Day-11.pdf
JoelVilloso1
 
Capitol Doctoral Presentation -July 2025.pptx
CapitolTechU
 
Optimizing Cancer Screening With MCED Technologies: From Science to Practical...
i3 Health
 
Pyhton with Mysql to perform CRUD operations.pptx
Ramakrishna Reddy Bijjam
 
Explorando Recursos do Summer '25: Dicas Essenciais - 02
Mauricio Alexandre Silva
 
Ad

Finding local lessons in software engineering

  • 1. Finding local lessons in software engineering Tim Menzies, WVU, USA, [email protected] Tsinghua University, China, Nov’09
  • 2. Sound bites •! An observation: –! Surprisingly few general SE results. •! A requirement: –! Need simple methods for finding local lessons. •! Take home lesson: –! Finding useful local lessons is remarkably simple –! E.g. using “W” or “NOVA”
  • 3. Roadmap •! Motivation: generality in SE •! A little primer: DM for SE •! “W”: finding contrast sets •! “W”: case studies •! “W”: drawbacks •! “NOVA”: a better “W” •! Conclusions
  • 4. Roadmap •! Motivation: generality in SE •! A little primer: DM for SE •! “W”: finding contrast sets •! “W”: case studies •! “W”: drawbacks •! “NOVA”: a better “W” •! Conclusions
  • 6. Have we lived up to our PROMISE? Few general results •! PROMISE 2005 … 2009 : 64 presentations •! 48 papers –! tried a new analysis on old data –! Or reported a new method that worked once for one project. •! 4 papers –! argued against model generality •! 9 papers –! questioned validity of prior results •! E.g. Menzies et al. Promise 2006 –! 100 times •! Select 90% of the training data •! Find<a,b> in effort = x.a.LOC b
  • 7. Have we lived up to our PROMISE? Only 11% of papers proposed general models •! E.g. Ostrand, Weyuker, Bell ‘08, ‘09 –! Same functional form –! Predicts defects for generations of AT&T software •! E.g. Turhan, Menzies, Bener ’08, ‘09 –! 10 projects •! Learn on 9 •! Apply to the 10th –! Defect models learned from NASA projects work for Turkish whitegoods software •! Caveat: need to filter irrelevant training examples
  • 8. Less Promising Results Lessons learned are very localized •! FSE’09: Zimmerman et al. –! Defect models not generalizable •! Learn “there”, apply “here” only works in 4% of their 600+ experiments –! Opposite to Turhan’09 results •! ?add relevancy filter •! ASE’09: Green, Menzies et al. –! AI search for better software project options –! Conclusions highly dependent on local business value proposition •! And others –! TSE’06: Menzies, Greenwald –! Menzies et al. in ISSE 2007 –! Zannier et al ICSE’06
  • 9. Overall The gods are (a little) angry •! Fenton at PROMISE’ 07 –! "... much of the current software metrics research is inherently irrelevant to the industrial mix ...” –! "... any software metrics program that depends on some extensive metrics collection is doomed to failure ...” •! Budgen & Kitchenham: –! “Is Evidence Based Software Engineering mature enough for Practice & Policy? ” –! Need for better reporting: more reviews. –! Empirical SE results too immature for making policy. •! Basili : still far to go –! But we should celebrate the progress made over the last 30 years. –! And we are turning the corner
  • 10. Experience Factories Methods to find local lessons •! Basili’09 (pers. comm.): –! “All my papers have the same form. –! “For the project being studied, we find that changing X improved Y.” •! Translation (mine): –! Even if we can’t find general models (which seem to be quite rare)…. –! … we can still research general methods for finding local lessons learned
  • 11. The rest of this talk: contrast set learning and “W” W= a local lessons finder •! Bayesian case-based accuracy contrast-set learner –! uses greedy search –! illustrates the “local lessons” effect –! offers functionality missing in the effort-estimation literature •! Fast generator of baseline results –! There are too few baseline results –! And baseline results can be very interesting (humbling). Holte’85 • C4: builds decision trees “N” deep •! A very (very) simple algorithm • 1R: builds decision trees “1” deep • For datasets with 2 classes, 1R ! C4 –! Should add it to your toolkit –! At least, as the “one to beat”
  • 12. Roadmap •! Motivation: generality in SE •! A little primer: DM for SE •! “W”: finding contrast sets •! “W”: case studies •! “W”: drawbacks •! “NOVA”: a better “W” •! Conclusions
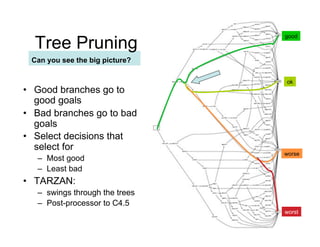
  • 14. 14/ 46 good Tree Pruning Can you see the big picture? ok •! Good branches go to good goals •! Bad branches go to bad goals •! Select decisions that select for worse –! Most good –! Least bad •! TARZAN: –! swings through the trees –! Post-processor to C4.5 worst
  • 15. 15/ 46 good Tree Pruning Can you see the big picture? ok •! Good branches go to good goals •! Bad branches go to bad goals •! Select decisions that select for worse –! Most good –! Least bad •! TARZAN: –! swings through the trees –! Post-processor to C4.5 worst
  • 16. 16/ 46 good Tree Pruning Can you see the big picture? ok •! Good branches go to good goals •! Bad branches go to bad goals •! Select decisions that select for worse –! Most good –! Least bad •! TARZAN: –! swings through the trees –! Post-processor to C4.5 worst
  • 17. 17/ 46 good Comment Less is best ok •! Higher decisions prune more branches •! #nodes at level I much smaller than level I+1. •! So tree pruning often yields very small sets of worse recommendations worst
  • 18. Don’t bury me in data Don’t show me “what is”; just tell what “to do”
  • 19. Roadmap •! Motivation: generality in SE •! A little primer: DM for SE •! “W”: finding contrast sets •! “W”: case studies •! “W”: drawbacks •! “NOVA”: a better “W” •! Conclusions
  • 20. “W”= Simple (Bayesian) Contrast Set Learning (in linear time) Mozina: KDD’04 •! “best” = target class (e.g. “survive”) •! “rest” = other classes •! x = any range (e.g. “sex=female”) •! f(x|c) = frequency of x in class c •! b = f( x | best ) / F(best) •! r = f( x | rest ) / F(rest) •! LOR= log(odds ratio) = log(b/r) –! ? normalize 0 to max = 1 to 100 •! s = sum of LORs –! e = 2.7183 … –! p = F(B) / (F(B) + F(R)) –! P(B) = 1 / (1 + e^(-1*ln(p/(1 - p)) - s ))
  • 21. “W”:Simpler (Bayesian) Contrast Set Learning (in linear time) Mozina: KDD’04 •! “best” = target class •! “rest” = other classes •! x = any range (e.g. sex = female) •! f(x|c) = frequency of x in class c •! b = f( x | best ) / F(best) •! r = f( x | rest ) / F(rest) •! LOR= log(odds ratio) = log(b/r) –! ? normalize 0 to max = 1 to 100 •! s = sum of LORs –! e = 2.7183 … “W”: 1)! Discretize data and outcomes –! p = F(B) / (F(B) + F(R)) 2)! Count frequencies of ranges in classes –! P(B) = 1 / (1 + e^(-1*ln(p/(1 - p)) - s )) 3)! Sort ranges by LOR 4) Greedy search on top ranked ranges
  • 22. “W” + CBR Preliminaries •! “Query” –! What kind of project you want to analyze; e.g. •! Analysts not so clever, •! High reliability system •! Small KLOC •! “Cases” –! Historical records, with their development effort •! Output: –! A recommendation on how to change our projects in order to reduce development effort
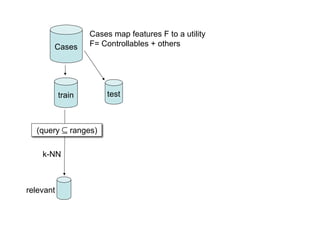
  • 23. Cases map features F to a utility Cases F= Controllables + others train test
  • 24. Cases map features F to a utility Cases F= Controllables + others train test (query ! ranges) k-NN relevant
  • 25. Cases map features F to a utility Cases F= Controllables + others train test (query ! ranges) k-NN Best utilities x b = F(x | best) / F(best) relevant x r = F(x | rest) / F(rest) rest
  • 26. Cases map features F to a utility Cases F= Controllables + others train test (query ! ranges) S = all x sorted descending by score k-NN Best utilities x b = F(x | best) / F(best) if controllable(x) && b > r && relevant b > min x r = F(x | rest) / F(rest) then score(x) = log(b/r) else score(x) = 0 rest fi
  • 27. Cases map features F to a utility Cases F= Controllables + others queryi* = k-NN train test query + "iSi treatedi (query ! ranges) S = all x sorted descending by score k-NN Best utilities x b = F(x | best) / F(best) if controllable(x) && b > r && relevant b > min x r = F(x | rest) / F(rest) then score(x) = log(b/r) else score(x) = 0 rest fi
  • 28. Cases map features F to a utility Cases F= Controllables + others utility median queryi* = k-NN spread train test i query + "iSi treatedi (query ! ranges) S = all x sorted descending by score k-NN Best utilities x b = F(x | best) / F(best) if controllable(x) && b > r && relevant b > min x r = F(x | rest) / F(rest) then score(x) = log(b/r) else score(x) = 0 rest fi
  • 29. Cases map features F to a utility treatment Cases F= Controllables + others q 0* q i* utility median queryi* = k-NN spread train test i query + "iSi treatedi As is To be (query ! ranges) S = all x sorted descending by score k-NN Best utilities x b = F(x | best) / F(best) if controllable(x) && b > r && relevant b > min x r = F(x | rest) / F(rest) then score(x) = log(b/r) else score(x) = 0 rest fi
  • 30. Roadmap •! Motivation: generality in SE •! A little primer: DM for SE •! “W”: finding contrast sets •! “W”: case studies •! “W”: drawbacks •! “NOVA”: a better “W” •! Conclusions
  • 31. Results (distribution of development efforts in qi*) Using cases from http://promisedata.org Cases from promisedata.org/data Median = 50% percentile Spread = 75% - 25% percentile Improvement = (X - Y) / X •! X = as is •! Y = to be •! more is better 150% Usually: •! spread " 75% improvement spread improvement 100% •! median " 60% improvement 50% 0% -50% 0% 50% 100% 150% median improvement
  • 32. Not-so-good news Local lessons are very localized
  • 33. Roadmap •! Motivation: generality in SE •! A little primer: DM for SE •! “W”: finding contrast sets •! “W”: case studies •! “W”: drawbacks •! “NOVA”: a better “W” •! Conclusions
  • 34. Cases map features F to a utility treatment Cases F= Controllables + others q 0* q i* utility median queryi* = k-NN spread train test i query + "iSi treatedi As is To be (query ! ranges) S = all x sorted descending by score k-NN Best utilities x b = F(x | best) / F(best) if controllable(x) && b > r && relevant b > min x r = F(x | rest) / F(rest) then score(x) = log(b/r) else score(x) = 0 rest fi
  • 35. Cases map features F to a utility treatment Cases F= Controllables + others q 0* q i* utility median queryi* = k-NN spread train test i query + "iSi treatedi As is To be (query ! ranges) S = all x sorted descending by score k-NN Best utilities x b = F(x | best) / F(best) if controllable(x) && b > r && relevant b > min x r = F(x | rest) / F(rest) then score(x) = log(b/r) else score(x) = 0 rest fi
  • 36. Cases map features F to a utility treatment Cases F= Controllables + others A greedy linear time search? q 0* q i* utility • Need to use much better search algorithms median • Simulated annealing, Beam, *Astar, ISSAMP, MaxWalkSat queryi = k-NN spread • SEESAW test train (home brew) i query + "iSi treatedi As is To be (query ! ranges) S = all x sorted descending by score k-NN Best utilities x b = F(x | best) / F(best) if controllable(x) && b > r && relevant b > min x r = F(x | rest) / F(rest) then score(x) = log(b/r) else score(x) = 0 rest fi
  • 37. Cases map features F to a utility treatment Cases F= Controllables + others q 0* q i* utility median queryi* = k-NN spread train test i query + "iSi treatedi As is To be (query ! ranges) S = all x sorted descending by score k-NN Best utilities x b = F(x | best) / F(best) if controllable(x) && b > r && relevant b > min x r = F(x | rest) / F(rest) then score(x) = log(b/r) else score(x) = 0 rest fi
  • 38. Cases map features F to a utility treatment Cases F= Controllables + others q 0* q i* utility median queryi* = k-NN spread train test i query + "iSi treatedi As is To be (query ! ranges) S = all x sorted descending by score k-NN Best utilities x b = F(x | best) / F(best) if controllable(x) && b > r && relevant b > min x r = F(x | rest) / F(rest) then score(x) = log(b/r) else score(x) = 0 rest fi
  • 39. Cases map features F to a utility treatment Cases F= Controllables + others q 0* q i* utility Just trying to reduce effort? median queryi* = k-NN spread • train test What aboutquery + " S development time? i i i • What about number of defects? i treated As is To be • What about different business contexts? (query ! ranges) “racing to = all x sorted descending by score e.g. S market” vs “mission-critical” apps k-NN Best utilities x b = F(x | best) / F(best) if controllable(x) && b > r && relevant b > min x r = F(x | rest) / F(rest) then score(x) = log(b/r) else score(x) = 0 rest fi
  • 40. Cases map features F to a utility treatment Cases F= Controllables + others q 0* q i* utility median queryi* = k-NN spread train test i query + "iSi treatedi As is To be (query ! ranges) S = all x sorted descending by score k-NN Best utilities x b = F(x | best) / F(best) if controllable(x) && b > r && relevant b > min x r = F(x | rest) / F(rest) then score(x) = log(b/r) else score(x) = 0 rest fi
  • 41. Cases map features F to a utility treatment Cases F= Controllables + others q 0* q i* utility median queryi* = k-NN spread train test i query + "iSi treatedi As is To be (query ! ranges) S = all x sorted descending by score k-NN Best utilities x b = F(x | best) / F(best) if controllable(x) && b > r && relevant b > min x r = F(x | rest) / F(rest) then score(x) = log(b/r) else score(x) = 0 rest fi
  • 42. Cases map features F to a utility treatment Cases F= Controllables + others q 0* q i* utility median queryi* = k-NN spread train test i query + "iSi treatedi As is To be (query ! ranges) Is nearestall x sorted descending by score S = neighbor causing conclusion instability? k-NN Best utilities • Q: How to smooth the bumps between x between the samples ? b = F(x | best) / F(best) if controllable(x) && b > r && relevant • A: Don’t apply constraints to the data b > min x r = F(x | • Apply it as model inputs instead rest) / F(rest) then score(x) = log(b/r) else score(x) = 0 rest fi
  • 43. Cases map features F to a utility treatment Cases F= Controllables + others q 0* q i* utility median queryi* = k-NN spread train test i query + "iSi treatedi As is To be (query ! ranges) S = all x sorted descending by score k-NN Best utilities x b = F(x | best) / F(best) if controllable(x) && b > r && relevant b > min x r = F(x | rest) / F(rest) then score(x) = log(b/r) else score(x) = 0 rest fi
  • 44. Cases map features F to a utility treatment Cases F= Controllables + others q 0* q i* utility median queryi* = k-NN spread train test i query + "iSi treatedi As is To be (query ! ranges) S = all x sorted descending by score k-NN Best utilities x b = F(x | best) / F(best) if controllable(x) && b > r && relevant b > min x r = F(x | rest) / F(rest) then score(x) = log(b/r) else score(x) = 0 rest fi
  • 45. Cases map features F to a utility treatment Cases F= Controllables + others q 0* q i* utility median queryi* = k-NN spread train test i query + "iSi treatedi As is To be (query ! ranges) Justall x sorted descending by score S = one test? k-NN Best • What about looking for utilities stability in “N” repeats? x b = F(x | best) / F(best) if controllable(x) && b > r && relevant b > min x r = F(x | rest) / F(rest) then score(x) = log(b/r) else score(x) = 0 rest fi
  • 46. Cases map features F to a utility treatment Cases F= Controllables + others q 0* q i* 1 More tests utility median queryi* = k-NN spread train test i query + "iSi treatedi As is To be (query ! ranges) S = all x sorted descending by score k-NN Best utilities x b = F(x | best) / F(best) if controllable(x) && b > r && relevant b > min x r = F(x | rest) / F(rest) then score(x) = log(b/r) else score(x) = 0 rest fi
  • 47. Cases map features F to a utility treatment Cases F= Controllables + others q 0* q i* 1 More tests utility median queryi* = k-NN spread train test i query + "iSi treatedi As is To be (query ! ranges) S = all x sorted descending by score k-NN 2 Best utilities More models x b = F(x | best) / F(best) if controllable(x) && b > r && relevant b > min x r = F(x | rest) / F(rest) then score(x) = log(b/r) else score(x) = 0 rest fi
  • 48. Cases map features F to a utility 3 More goals treatment Cases F= Controllables + others q 0* q i* 1 More tests utility median queryi* = k-NN spread train test i query + "iSi treatedi As is To be (query ! ranges) S = all x sorted descending by score k-NN 2 Best utilities More models x b = F(x | best) / F(best) if controllable(x) && b > r && relevant b > min x r = F(x | rest) / F(rest) then score(x) = log(b/r) else score(x) = 0 rest fi
  • 49. Cases map features F to a utility 3 More goals treatment Cases F= Controllables + others q 0* q i* 1 More tests utility median queryi* = k-NN spread train test i query + "iSi treatedi As is To be (query ! ranges) S = all x sorted descending by score k-NN 2 Best 4 More search utilities More models x b = F(x | best) / F(best) if controllable(x) && b > r && relevant b > min x r = F(x | rest) / F(rest) then score(x) = log(b/r) else score(x) = 0 rest fi
  • 50. Roadmap •! Motivation: generality in SE •! A little primer: DM for SE •! “W”: finding contrast sets •! “W”: case studies •! “W”: drawbacks •! “NOVA”: a better “W” •! Conclusions
  • 51. More models USC Cocomo suite (Boehm 1981, 2000)! COCOMO •! Time to build it (calendar months) •! Effort to build it (total staff months) COQUALMO •! defects per 1000 lines of code Estimate = model( p, t ) •! P = project options •! T = tuning options •! Normal practice: Adjust “t” using local data •! NOVA: Stagger randomly all tunings even seen before ?
  • 52. More goals B = BFC X = XPOS Goal #1: Goal #2 •! better, faster, cheaper •! minimize risk exposure Try to minimize: Rushing to beat the competition •! Development time and •! Get to market, soon as you can •! Development effort and •! Without too many defects •! # defects
  • 53. More search engines Not greedy search! Simulated Annealling ISSAMP ASTAR BEAM MaxWalkSat SEESAW : MaxWalkSat + boundary mutation •! Local favorite •! Does best at reduction defects or effort or time
  • 54. More tests Four data sets, repeat N=20 times! Data sets •! OSP= orbital space plane GNC •! OSP2 = second generation GNC •! Flight = JPL flight systems •! Ground = JPL ground systems For each data set •! Search N= 20 times (with SEESAW) •! Record how often decisions are found
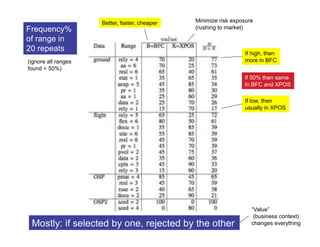
  • 55. Better, faster, cheaper Minimize risk exposure Frequency% (rushing to market) of range in 20 repeats If high, then (ignore all ranges more in BFC found < 50%) If 50% then same In BFC and XPOS If low, then usually in XPOS “Value” (business context) Mostly: if selected by one, rejected by the other changes everything
  • 56. Better, faster, cheaper Minimize risk exposure And what of (rushing to market) defect removal techniques? Aa = automated analysis Etat= execution testing and tools Pr= peer review Stopping defect introduction is better than defect removal.
  • 57. Roadmap •! Motivation: generality in SE •! A little primer: DM for SE •! “W”: finding contrast sets •! “W”: case studies •! “W”: drawbacks •! “NOVA”: a better “W” •! Conclusions
  • 58. Certainly, we should always strive for generality But don’t be alarmed if you can’t find it •! The experience to date is that, –! with rare exceptions, –! W and NOVA do not lead to general theories •! But that’s ok –! Very few others have found general models (in SE) –! E.g. Turhan, Menzies, Ayse’09 •! Anyway –! If there are few general results, there may be general methods to find local results
  • 59. Btw, constantly (re)building local models is a general model Case-based reasoning •! Kolodner’s theory of reconstructive memory •! The Yale group –! Shank & Riesbeck et al. –! Memory, not models –! Don’t “think”, remember
  • 60. See you at PROMISE’10? http://promisedata.org/2010
  • 62. Contact details We know where you live. •! [email protected] •! http://menzies.us •! http://twitter.com/timmenzies •! http://www.facebook.com/tim.menzies
  • 63. 63/ 46 Questions? Comments? “You want proof? I’ll give you proof!”
  • 64. 64/ 46 Future work What’s next? •! Better than Bgreedy? –! While staying simple? •! Incremental anomaly detection and lesson revision –! Not discussed here –! Turns out, that may be very simple (see me later)
  • 65. 65/ 46 A little primer: DM for SE Summary: easier than you think (#include standardCaveat.h)
  • 66. 66/ 46 Monte Carlo + Decision Tree Learning Menzies: ASE’00 •! Process models –! Input: project details –! Output: (effort, risk) •! Increase #simulations –! till error minimizes •! Learn decision trees •! Repeat 10 times
  • 67. 67/ 46 Software Management Given nowi which subsets of changesi is most effective?
  • 68. 68/ Problem 46 Too much information
  • 69. 69/ 46 good Tree Pruning Can you see the big picture? ok •! Good branches go to good goals •! Bad branches go to bad goals •! Select decisions that select for worse –! Most good –! Least bad •! TARZAN: –! swings through the trees –! Post-processor to C4.5 worst
  • 70. 70/ 46 good Tree Pruning Can you see the big picture? ok •! Good branches go to good goals •! Bad branches go to bad goals •! Select decisions that select for worse –! Most good –! Least bad •! TARZAN: –! swings through the trees –! Post-processor to C4.5 worst
  • 71. 71/ 46 good Tree Pruning Can you see the big picture? ok •! Good branches go to good goals •! Bad branches go to bad goals •! Select decisions that select for worse –! Most good –! Least bad •! TARZAN: –! swings through the trees –! Post-processor to C4.5 worst
  • 72. 72/ 46 good Comment Less is best ok •! Higher decisions prune more branches •! #nodes at level I much smaller than level I+1. •! So tree pruning often yields very small sets of worse recommendations worst
  • 73. 73/ 46 Don’t bury me in data Don’t show me “what is”; just tell what “to do”
  • 74. Given the size of the search space, 74/ 46 the small number of decision points was very surprising
  • 75. 75/ The “keys” effect: 46 usually, a few variables set the rest SAILing is easy •! So the complexity of the whole depends on just a small part •! Empirical evidence: –! Feature subset selection: Kohavi’97 –! Few pathways: Bieman’92, Harrold’98 –! Mutation testing & rapid saturation: Budd’80, Wong’95, Michael’97 –! Surprisingly few internal states: Drezdel’94, Colomb’00, Menzies’99 –! Success of stochastic theorem provers: Crawford’94, Williams & Selman’03 •! Theoretical evidence: –! Menzies & Singh ‘03 •! Easy to find these keys –! Score the outputs –! Look for ranges more frequent in “best” than “rest” –! A useful short-cut to data mining, model-based reasoning
  • 76. 76/ Treatment learning: 46 9 years later Gay, Menzies et al.’ 09 •! TARZAN is no longer a post-processor •! Branch queries performed directly on discretized data •! thanks David Poole •! Stochastic sampling for rule generation •! Benchmarked against state-of-the-art numerical optimizers for GNC control Still generating tiny rules (very easy to read, explain, audit, implement)