SlideShare a Scribd company logo
Free OpManager training Part 3 - Monitoring Network Performance and Network Maps
Welcome to a
free OpManager training session
Can you hear me? Can you see
the presentation?
Please confirm by commenting in the webinar chat panel
Trainer
Sharath Babu
Product Expert
Part 3
Monitoring network performance;
Network maps
Agenda
 Monitoring network performance
 Monitoring hardware sensor
 Creating custom SNMP monitor
 Monitoring WAN and VOIP links
 Network maps
Performance monitors Protocol
CPU, memory, temperature, etc. SNMP
Cisco UCS UCS API
Network devices/ other infrastructure devices such as printer, UPS,
etc.
SNMP
WAN latency check IPSLA (Cisco devices only)
VOIP latency check, mos, jitter, etc. IPSLA (Cisco devices only)
*Configure SNMP on the network devices
Monitoring Router performanceo CPU/memory usage
o Temperature, etc.
o Setting up threshold for the performance monitors
Monitoring network performance
Monitoring Switch performance
o CPU/memory usage
o Back plane utilization, etc
Monitoring Firewall performance
o CPU/memory usage
o Active session count, etc
Monitoring Printer performance
o Paper jam, low paper or no paper
o Low toner or no toner, etc
Monitoring Router performance
o CPU/memory usage
o Temperature, etc.
o Setting up threshold for the performance monitors
Monitoring bandwidth/ traffic
Interface performance counters
• Bandwidth usage
• Errors/discards
• Received and transmitted traffic
• Total bytes received
• Total bytes transferred
• Real time interface monitors
*SNMP based
monitoring
1. Enable or disable monitoring for specific
interface type
2. Configuring monitoring interval for the interface
type
3. Configuring thresholds for utilization, errors and
discards
4. Enable or disable interface status polling
Interface templates
1
2
3
4
Interface groups
1. Creating interface groups based on
site, department, customers, etc
2. Threshold settings based on custom
interface groups
3. Dashboard for groups and sub groups
4. Filters based on Interface groups in
widgets
5. Filters based on Interface groups in
reports
Monitoring hardware sensor
Power VoltageTemperature Battery Disk Array Data Fan
Supported vendor's
Sensor categories
Setting up hardware monitoring
Go to Settings > System Settings > Hardware monitor
o Enable Hardware monitor
o Suppress Hardware Alarms
o Monitor interval
o Hardware health report
Creating a custom SNMP monitor
Prerequisites
• SNMP-enabled device
• Vendor MIBs >> OpManagermibs
Mibs
• What is a mib file?
• How to obtain the mib file?
• Uploading the mib files in OpManager
Examples
• Creating a custom monitor
• Performing mathematical operations on OIDs using expressions
(.1.3.6.1.4.1.9.9.48.1.1.1.5.1*100) / (.1.3.6.1.4.1.9.9.48.1.1.1.5.1+.1.3.6.1.4.1.9.9.48.1.1.1.6.1)
• Functional expressions
(Celsius to Fahrenheit, Kilobyte to Megabyte, Average of column values, Sum of column values, etc)
• Monitor instances
WAN
Development Center HeadquartersService Provider
• Identify the network paths with high round trip time
• Identify where the outage happened by viewing the hop-wise latency graph
• Collect the IPSLA traps for events such as connection loss, threshold violation for RTT,
average payload, timeout, etc
Monitoring WAN performance
Prerequisites
• A Cisco router with an IPSLA agent enabled
• iOS version must be 12.3 or later
• SNMP read and write community configured on the device
• Configure the device to send traps to OpManager server
How to add?
• Go to Network > Select IPSLA
• Select WAN Monitor > Click plus icon at the top of the page
• Add the details of the source and destination IP
Adding WAN monitor
• Jitter: The variation in delay between arriving packets
• Latency: The time taken for the voice packets to reach the destination
• Packet loss: Data lost during transmission
• Mean opinion score (MOS): The standard for measuring codecs and is rated
on a scale of 1 to 5
VOIP performance monitoring
Network maps : #1 Business views
• Group devices based on geographical
site or department or business service
• Add link between devices and monitor
the link connectivity
• Add shortcuts in a business view for
branch offices
• Restrict user access based on business
view groups
Network maps : #2 Maps
Google Maps API is now charged Zoho Maps Free
Network maps : #3 Building racks & 3D floor view
Rack View 3D Floor View
Customizing dashboard
Network management : Dashboards and
widgets
1. Total network traffic across all servers
2. Devices which are using high % of their CPU and Memory
3. All active alarms
4. Downtime report for all devices and services
5. IT summary
Amanda (admin)
OpManager users
Joshua and Nick (Server
team)
Associated Dashboard's
• Server
George (Network team)
Associated Dashboard's
• Network
• Real time data
Associated Dashboard's
• IT Summary
• Network
• Real time data,
• Inventory, etc
Restricting user access to specific
dashboards
Questions?

More Related Content

What's hot (20)

PPTX
Free OpManager training Part3- Network performance monitoring
ManageEngine, Zoho Corporation
 
PPTX
Free OpManager training Part 2- Monitoring Server Performance
ManageEngine, Zoho Corporation
 
PDF
Season 4 [Free OpManager training] Part3 - Monitoring Network Performance
ManageEngine, Zoho Corporation
 
PPTX
Season 4 [Free OpManager training] Part2- Monitoring Server Performance
ManageEngine, Zoho Corporation
 
PPTX
[Season - 3 OpManager Training] Monitoring Network Performance
ManageEngine, Zoho Corporation
 
PPTX
Network Maps & Reporting [Free OpManager Training - Part 5]
ManageEngine, Zoho Corporation
 
PPTX
Understanding firewall-policies-their-effectiveness-in-defending-against-netw...
ManageEngine, Zoho Corporation
 
PPTX
Season 3 [free OpManager training]_Part1- Discovery and classification
ManageEngine, Zoho Corporation
 
PPTX
Overview and features of NCM
ManageEngine, Zoho Corporation
 
PPTX
Export flows, group traffic, map application traffic and more: NetFlow Analyz...
ManageEngine, Zoho Corporation
 
PPTX
Free NetFlow Analyzer training - Getting the initial settings right
ManageEngine, Zoho Corporation
 
PPTX
Network and server performance monitoring training
ManageEngine, Zoho Corporation
 
PPTX
Network fault management and IT automation training
ManageEngine, Zoho Corporation
 
PDF
[Season - 3] OpManager Training - Network Maps,Reports and Best Practices
ManageEngine, Zoho Corporation
 
PPTX
Free training on NCM - Discovery & Disaster recovery
ManageEngine, Zoho Corporation
 
PPT
Monitor and manage everything Cisco using OpManager
ManageEngine
 
PPTX
Configlets, compliance, RBAC & reports - Network Configuration Manager
ManageEngine, Zoho Corporation
 
PPTX
OpManager training - Device discovery and classification.
ManageEngine, Zoho Corporation
 
PPTX
Copy of learn_the_art_of_firewall_security(1)
ManageEngine, Zoho Corporation
 
PPTX
Server and application monitoring webinars [Applications Manager] - Part 4
ManageEngine, Zoho Corporation
 
Free OpManager training Part3- Network performance monitoring
ManageEngine, Zoho Corporation
 
Free OpManager training Part 2- Monitoring Server Performance
ManageEngine, Zoho Corporation
 
Season 4 [Free OpManager training] Part3 - Monitoring Network Performance
ManageEngine, Zoho Corporation
 
Season 4 [Free OpManager training] Part2- Monitoring Server Performance
ManageEngine, Zoho Corporation
 
[Season - 3 OpManager Training] Monitoring Network Performance
ManageEngine, Zoho Corporation
 
Network Maps & Reporting [Free OpManager Training - Part 5]
ManageEngine, Zoho Corporation
 
Understanding firewall-policies-their-effectiveness-in-defending-against-netw...
ManageEngine, Zoho Corporation
 
Season 3 [free OpManager training]_Part1- Discovery and classification
ManageEngine, Zoho Corporation
 
Overview and features of NCM
ManageEngine, Zoho Corporation
 
Export flows, group traffic, map application traffic and more: NetFlow Analyz...
ManageEngine, Zoho Corporation
 
Free NetFlow Analyzer training - Getting the initial settings right
ManageEngine, Zoho Corporation
 
Network and server performance monitoring training
ManageEngine, Zoho Corporation
 
Network fault management and IT automation training
ManageEngine, Zoho Corporation
 
[Season - 3] OpManager Training - Network Maps,Reports and Best Practices
ManageEngine, Zoho Corporation
 
Free training on NCM - Discovery & Disaster recovery
ManageEngine, Zoho Corporation
 
Monitor and manage everything Cisco using OpManager
ManageEngine
 
Configlets, compliance, RBAC & reports - Network Configuration Manager
ManageEngine, Zoho Corporation
 
OpManager training - Device discovery and classification.
ManageEngine, Zoho Corporation
 
Copy of learn_the_art_of_firewall_security(1)
ManageEngine, Zoho Corporation
 
Server and application monitoring webinars [Applications Manager] - Part 4
ManageEngine, Zoho Corporation
 

Similar to Free OpManager training Part 3 - Monitoring Network Performance and Network Maps (20)

PPTX
Monitoring network performance- Part 3_Free OpManager training
ManageEngine, Zoho Corporation
 
PPTX
Opmanager Workshop - Middle East
ManageEngine, Zoho Corporation
 
PPT
The 3 aspects of network performance management
ManageEngine
 
PPT
Management Tools Desirable features Management Architectures Simple Network ...
jeronimored
 
PPTX
ManageEngine OpUtils Technical Overview
ManageEngine, Zoho Corporation
 
PDF
Enterprise Network Monitoring Software by ServicePilot
ServicePilot
 
PPTX
10 Steps to Improve Your Network Monitoring
HelpSystems
 
PPT
Irizarry M Cis516 Week7
logic_5
 
PPT
1. Network monitoring and measurement-2.ppt
Farid Er
 
PPTX
New OpManager v12
Inuit AB
 
PPT
Chapter09
Muhammad Ahad
 
PPTX
Commissioning, Managing & Troubleshooting Industrial Networks
Creekside Marketing Group, LLC
 
PDF
6 easy ways to monitor the success of Network Management Software
Echelon Edge Pvt Ltd
 
PPTX
OpManager Technical Overview
ManageEngine, Zoho Corporation
 
PPTX
Overview OpManager
Fanky Christian
 
PPTX
Opmanagertechnicaloverview 160128123947
Sandeep Kumar Yadav
 
PPTX
Opmanager technical overview
ManageEngine, Zoho Corporation
 
PPTX
[Season - 3 Free OpManager Training] Monitoring Server Performance
ManageEngine, Zoho Corporation
 
PPT
OpManager Major Features
tecanody
 
PPT
Week 9 Assignment Op Manager
leeharris
 
Monitoring network performance- Part 3_Free OpManager training
ManageEngine, Zoho Corporation
 
Opmanager Workshop - Middle East
ManageEngine, Zoho Corporation
 
The 3 aspects of network performance management
ManageEngine
 
Management Tools Desirable features Management Architectures Simple Network ...
jeronimored
 
ManageEngine OpUtils Technical Overview
ManageEngine, Zoho Corporation
 
Enterprise Network Monitoring Software by ServicePilot
ServicePilot
 
10 Steps to Improve Your Network Monitoring
HelpSystems
 
Irizarry M Cis516 Week7
logic_5
 
1. Network monitoring and measurement-2.ppt
Farid Er
 
New OpManager v12
Inuit AB
 
Chapter09
Muhammad Ahad
 
Commissioning, Managing & Troubleshooting Industrial Networks
Creekside Marketing Group, LLC
 
6 easy ways to monitor the success of Network Management Software
Echelon Edge Pvt Ltd
 
OpManager Technical Overview
ManageEngine, Zoho Corporation
 
Overview OpManager
Fanky Christian
 
Opmanagertechnicaloverview 160128123947
Sandeep Kumar Yadav
 
Opmanager technical overview
ManageEngine, Zoho Corporation
 
[Season - 3 Free OpManager Training] Monitoring Server Performance
ManageEngine, Zoho Corporation
 
OpManager Major Features
tecanody
 
Week 9 Assignment Op Manager
leeharris
 
Ad

More from ManageEngine, Zoho Corporation (20)

PPTX
Create seamless customer experiences
ManageEngine, Zoho Corporation
 
PDF
From web interface to database: Monitor what matters
ManageEngine, Zoho Corporation
 
PDF
NetFlow Analyzer Free Training Series Part I - May 2020
ManageEngine, Zoho Corporation
 
PDF
Overcome real-time server and VM monitoring challenges
ManageEngine, Zoho Corporation
 
PPTX
Modernizing Cloud and Hyperconverged Infrastructure monitoring
ManageEngine, Zoho Corporation
 
PPTX
Deliver seamless digital experience
ManageEngine, Zoho Corporation
 
PDF
Free NetFlow Analyzer training Season 1 Part 2 - Feb 2020
ManageEngine, Zoho Corporation
 
PPTX
From web interface to the database:Monitor all that matters
ManageEngine, Zoho Corporation
 
PDF
NetFlow Analyzer Training Season 1 Part 1 - Feb 2020 - EST
ManageEngine, Zoho Corporation
 
PDF
NetFlow Analyzer Training Season 1 Part 1 - Feb 2020 - GMT
ManageEngine, Zoho Corporation
 
PDF
NetFlow Analyzer Product Overview
ManageEngine, Zoho Corporation
 
PPTX
Monitoring cloud applications and hyperconverged infrastructure
ManageEngine, Zoho Corporation
 
PPTX
Building the right website monitoring strategy
ManageEngine, Zoho Corporation
 
PPTX
Unlock the value of your big data infrastructure
ManageEngine, Zoho Corporation
 
PPTX
Key to optimal end user experience
ManageEngine, Zoho Corporation
 
PPTX
Monitoring cloud applications and containers
ManageEngine, Zoho Corporation
 
PPTX
implementing the right website monitoring strategy
ManageEngine, Zoho Corporation
 
PPTX
Big data and non relational database
ManageEngine, Zoho Corporation
 
PPTX
Visibility-from web application interface to the database
ManageEngine, Zoho Corporation
 
PPTX
Cloud applications monitoring in digital transformation era
ManageEngine, Zoho Corporation
 
Create seamless customer experiences
ManageEngine, Zoho Corporation
 
From web interface to database: Monitor what matters
ManageEngine, Zoho Corporation
 
NetFlow Analyzer Free Training Series Part I - May 2020
ManageEngine, Zoho Corporation
 
Overcome real-time server and VM monitoring challenges
ManageEngine, Zoho Corporation
 
Modernizing Cloud and Hyperconverged Infrastructure monitoring
ManageEngine, Zoho Corporation
 
Deliver seamless digital experience
ManageEngine, Zoho Corporation
 
Free NetFlow Analyzer training Season 1 Part 2 - Feb 2020
ManageEngine, Zoho Corporation
 
From web interface to the database:Monitor all that matters
ManageEngine, Zoho Corporation
 
NetFlow Analyzer Training Season 1 Part 1 - Feb 2020 - EST
ManageEngine, Zoho Corporation
 
NetFlow Analyzer Training Season 1 Part 1 - Feb 2020 - GMT
ManageEngine, Zoho Corporation
 
NetFlow Analyzer Product Overview
ManageEngine, Zoho Corporation
 
Monitoring cloud applications and hyperconverged infrastructure
ManageEngine, Zoho Corporation
 
Building the right website monitoring strategy
ManageEngine, Zoho Corporation
 
Unlock the value of your big data infrastructure
ManageEngine, Zoho Corporation
 
Key to optimal end user experience
ManageEngine, Zoho Corporation
 
Monitoring cloud applications and containers
ManageEngine, Zoho Corporation
 
implementing the right website monitoring strategy
ManageEngine, Zoho Corporation
 
Big data and non relational database
ManageEngine, Zoho Corporation
 
Visibility-from web application interface to the database
ManageEngine, Zoho Corporation
 
Cloud applications monitoring in digital transformation era
ManageEngine, Zoho Corporation
 
Ad

Recently uploaded (20)

PDF
Building Real-Time Digital Twins with IBM Maximo & ArcGIS Indoors
Safe Software
 
PDF
Jak MŚP w Europie Środkowo-Wschodniej odnajdują się w świecie AI
dominikamizerska1
 
PDF
[Newgen] NewgenONE Marvin Brochure 1.pdf
darshakparmar
 
PPTX
Designing Production-Ready AI Agents
Kunal Rai
 
PPTX
AUTOMATION AND ROBOTICS IN PHARMA INDUSTRY.pptx
sameeraaabegumm
 
PDF
Newgen 2022-Forrester Newgen TEI_13 05 2022-The-Total-Economic-Impact-Newgen-...
darshakparmar
 
PDF
"AI Transformation: Directions and Challenges", Pavlo Shaternik
Fwdays
 
PPTX
COMPARISON OF RASTER ANALYSIS TOOLS OF QGIS AND ARCGIS
Sharanya Sarkar
 
PDF
CIFDAQ Token Spotlight for 9th July 2025
CIFDAQ
 
PPTX
Future Tech Innovations 2025 – A TechLists Insight
TechLists
 
PDF
LOOPS in C Programming Language - Technology
RishabhDwivedi43
 
PDF
Mastering Financial Management in Direct Selling
Epixel MLM Software
 
PPTX
Q2 FY26 Tableau User Group Leader Quarterly Call
lward7
 
PPTX
From Sci-Fi to Reality: Exploring AI Evolution
Svetlana Meissner
 
PDF
IoT-Powered Industrial Transformation – Smart Manufacturing to Connected Heal...
Rejig Digital
 
PDF
Newgen Beyond Frankenstein_Build vs Buy_Digital_version.pdf
darshakparmar
 
PDF
Reverse Engineering of Security Products: Developing an Advanced Microsoft De...
nwbxhhcyjv
 
PPTX
Building Search Using OpenSearch: Limitations and Workarounds
Sease
 
PDF
“NPU IP Hardware Shaped Through Software and Use-case Analysis,” a Presentati...
Edge AI and Vision Alliance
 
PDF
Exolore The Essential AI Tools in 2025.pdf
Srinivasan M
 
Building Real-Time Digital Twins with IBM Maximo & ArcGIS Indoors
Safe Software
 
Jak MŚP w Europie Środkowo-Wschodniej odnajdują się w świecie AI
dominikamizerska1
 
[Newgen] NewgenONE Marvin Brochure 1.pdf
darshakparmar
 
Designing Production-Ready AI Agents
Kunal Rai
 
AUTOMATION AND ROBOTICS IN PHARMA INDUSTRY.pptx
sameeraaabegumm
 
Newgen 2022-Forrester Newgen TEI_13 05 2022-The-Total-Economic-Impact-Newgen-...
darshakparmar
 
"AI Transformation: Directions and Challenges", Pavlo Shaternik
Fwdays
 
COMPARISON OF RASTER ANALYSIS TOOLS OF QGIS AND ARCGIS
Sharanya Sarkar
 
CIFDAQ Token Spotlight for 9th July 2025
CIFDAQ
 
Future Tech Innovations 2025 – A TechLists Insight
TechLists
 
LOOPS in C Programming Language - Technology
RishabhDwivedi43
 
Mastering Financial Management in Direct Selling
Epixel MLM Software
 
Q2 FY26 Tableau User Group Leader Quarterly Call
lward7
 
From Sci-Fi to Reality: Exploring AI Evolution
Svetlana Meissner
 
IoT-Powered Industrial Transformation – Smart Manufacturing to Connected Heal...
Rejig Digital
 
Newgen Beyond Frankenstein_Build vs Buy_Digital_version.pdf
darshakparmar
 
Reverse Engineering of Security Products: Developing an Advanced Microsoft De...
nwbxhhcyjv
 
Building Search Using OpenSearch: Limitations and Workarounds
Sease
 
“NPU IP Hardware Shaped Through Software and Use-case Analysis,” a Presentati...
Edge AI and Vision Alliance
 
Exolore The Essential AI Tools in 2025.pdf
Srinivasan M
 

Free OpManager training Part 3 - Monitoring Network Performance and Network Maps

  • 2. Welcome to a free OpManager training session
  • 3. Can you hear me? Can you see the presentation? Please confirm by commenting in the webinar chat panel
  • 5. Part 3 Monitoring network performance; Network maps
  • 6. Agenda  Monitoring network performance  Monitoring hardware sensor  Creating custom SNMP monitor  Monitoring WAN and VOIP links  Network maps
  • 7. Performance monitors Protocol CPU, memory, temperature, etc. SNMP Cisco UCS UCS API Network devices/ other infrastructure devices such as printer, UPS, etc. SNMP WAN latency check IPSLA (Cisco devices only) VOIP latency check, mos, jitter, etc. IPSLA (Cisco devices only) *Configure SNMP on the network devices
  • 8. Monitoring Router performanceo CPU/memory usage o Temperature, etc. o Setting up threshold for the performance monitors Monitoring network performance Monitoring Switch performance o CPU/memory usage o Back plane utilization, etc Monitoring Firewall performance o CPU/memory usage o Active session count, etc Monitoring Printer performance o Paper jam, low paper or no paper o Low toner or no toner, etc Monitoring Router performance o CPU/memory usage o Temperature, etc. o Setting up threshold for the performance monitors
  • 9. Monitoring bandwidth/ traffic Interface performance counters • Bandwidth usage • Errors/discards • Received and transmitted traffic • Total bytes received • Total bytes transferred • Real time interface monitors *SNMP based monitoring
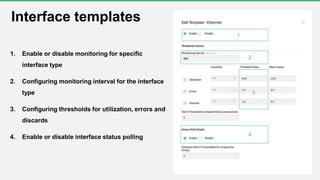
  • 10. 1. Enable or disable monitoring for specific interface type 2. Configuring monitoring interval for the interface type 3. Configuring thresholds for utilization, errors and discards 4. Enable or disable interface status polling Interface templates 1 2 3 4
  • 11. Interface groups 1. Creating interface groups based on site, department, customers, etc 2. Threshold settings based on custom interface groups 3. Dashboard for groups and sub groups 4. Filters based on Interface groups in widgets 5. Filters based on Interface groups in reports
  • 12. Monitoring hardware sensor Power VoltageTemperature Battery Disk Array Data Fan Supported vendor's Sensor categories
  • 13. Setting up hardware monitoring Go to Settings > System Settings > Hardware monitor o Enable Hardware monitor o Suppress Hardware Alarms o Monitor interval o Hardware health report
  • 14. Creating a custom SNMP monitor Prerequisites • SNMP-enabled device • Vendor MIBs >> OpManagermibs Mibs • What is a mib file? • How to obtain the mib file? • Uploading the mib files in OpManager Examples • Creating a custom monitor • Performing mathematical operations on OIDs using expressions (.1.3.6.1.4.1.9.9.48.1.1.1.5.1*100) / (.1.3.6.1.4.1.9.9.48.1.1.1.5.1+.1.3.6.1.4.1.9.9.48.1.1.1.6.1) • Functional expressions (Celsius to Fahrenheit, Kilobyte to Megabyte, Average of column values, Sum of column values, etc) • Monitor instances
  • 16. • Identify the network paths with high round trip time • Identify where the outage happened by viewing the hop-wise latency graph • Collect the IPSLA traps for events such as connection loss, threshold violation for RTT, average payload, timeout, etc Monitoring WAN performance
  • 17. Prerequisites • A Cisco router with an IPSLA agent enabled • iOS version must be 12.3 or later • SNMP read and write community configured on the device • Configure the device to send traps to OpManager server How to add? • Go to Network > Select IPSLA • Select WAN Monitor > Click plus icon at the top of the page • Add the details of the source and destination IP Adding WAN monitor
  • 18. • Jitter: The variation in delay between arriving packets • Latency: The time taken for the voice packets to reach the destination • Packet loss: Data lost during transmission • Mean opinion score (MOS): The standard for measuring codecs and is rated on a scale of 1 to 5 VOIP performance monitoring
  • 19. Network maps : #1 Business views • Group devices based on geographical site or department or business service • Add link between devices and monitor the link connectivity • Add shortcuts in a business view for branch offices • Restrict user access based on business view groups
  • 20. Network maps : #2 Maps Google Maps API is now charged Zoho Maps Free
  • 21. Network maps : #3 Building racks & 3D floor view Rack View 3D Floor View
  • 22. Customizing dashboard Network management : Dashboards and widgets 1. Total network traffic across all servers 2. Devices which are using high % of their CPU and Memory 3. All active alarms 4. Downtime report for all devices and services 5. IT summary
  • 23. Amanda (admin) OpManager users Joshua and Nick (Server team) Associated Dashboard's • Server George (Network team) Associated Dashboard's • Network • Real time data Associated Dashboard's • IT Summary • Network • Real time data, • Inventory, etc Restricting user access to specific dashboards