


![2019-08-31T01:09:19.397+0000: 1.606: [GC (Metadata GC Threshold) [PSYoungGen: 545393K->18495K(2446848K)] 545393K->18519K(8039424K),
0.0189376 secs] [Times: user=0.15 sys=0.01, real=0.02 secs]
2019-08-31T01:09:19.416+0000: 1.625: [Full GC (Metadata GC Threshold) [PSYoungGen: 18495K->0K(2446848K)] [ParOldGen: 24K->17366K(5592576K)]
18519K->17366K(8039424K), [Metaspace: 20781K->20781K(1067008K)], 0.0416162 secs] [Times: user=0.38 sys=0.03, real=0.04 secs]
2019-08-31T01:18:19.288+0000: 541.497: [GC (Metadata GC Threshold) [PSYoungGen: 1391495K->18847K(2446848K)] 1408861K->36230K(8039424K),
0.0568365 secs] [Times: user=0.31 sys=0.75, real=0.06 secs]
2019-08-31T01:18:19.345+0000: 541.554: [Full GC (Metadata GC Threshold) [PSYoungGen: 18847K->0K(2446848K)] [ParOldGen: 17382K-
>25397K(5592576K)] 36230K->25397K(8039424K), [Metaspace: 34865K->34865K(1079296K)], 0.0467640 secs] [Times: user=0.31 sys=0.08, real=0.04
secs]
2019-08-31T02:33:20.326+0000: 5042.536: [GC (Allocation Failure) [PSYoungGen: 2097664K->11337K(2446848K)] 2123061K->36742K(8039424K),
0.3298985 secs] [Times: user=0.00 sys=9.20, real=0.33 secs]
2019-08-31T03:40:11.749+0000: 9053.959: [GC (Allocation Failure) [PSYoungGen: 2109001K->15776K(2446848K)] 2134406K->41189K(8039424K),
0.0517517 secs] [Times: user=0.00 sys=1.22, real=0.05 secs]
2019-08-31T05:11:46.869+0000: 14549.079: [GC (Allocation Failure) [PSYoungGen: 2113440K->24832K(2446848K)] 2138853K->50253K(8039424K),
0.0392831 secs] [Times: user=0.02 sys=0.79, real=0.04 secs]
2019-08-31T06:26:10.376+0000: 19012.586: [GC (Allocation Failure) [PSYoungGen: 2122496K->25600K(2756096K)] 2147917K->58149K(8348672K),
0.0371416 secs] [Times: user=0.01 sys=0.75, real=0.04 secs]
2019-08-31T07:50:03.442+0000: 24045.652: [GC (Allocation Failure) [PSYoungGen: 2756096K->32768K(2763264K)] 2788645K->72397K(8355840K),
0.0709641 secs] [Times: user=0.16 sys=1.39, real=0.07 secs]
2019-08-31T09:04:21.406+0000: 28503.616: [GC (Allocation Failure) [PSYoungGen: 2763264K->32768K(2733568K)] 2802893K->83469K(8326144K),
0.0789178 secs] [Times: user=0.12 sys=1.59, real=0.08 secs]
Vanilla Format](https://image.slidesharecdn.com/gc-tuning-master-piece-jprime-2025-250515083705-1585131d/85/GC-Tuning-A-Masterpiece-in-Performance-Engineering-22-320.jpg)

![G1 GC Format
2015-09-14T11:58:55.131-0700: 0.519: [GC pause (G1 Evacuation Pause) (young), 0.0096438 secs]
[Parallel Time: 7.9 ms, GC Workers: 8]
[GC Worker Start (ms): Min: 519.4, Avg: 519.6, Max: 520.6, Diff: 1.3]
[Ext Root Scanning (ms): Min: 0.0, Avg: 2.9, Max: 7.3, Diff: 7.3, Sum: 23.4]
[Update RS (ms): Min: 0.0, Avg: 0.0, Max: 0.0, Diff: 0.0, Sum: 0.0]
[Processed Buffers: Min: 0, Avg: 0.0, Max: 0, Diff: 0, Sum: 0]
[Scan RS (ms): Min: 0.0, Avg: 0.0, Max: 0.0, Diff: 0.0, Sum: 0.0]
[Code Root Scanning (ms): Min: 0.0, Avg: 0.0, Max: 0.1, Diff: 0.1, Sum: 0.1]
[Object Copy (ms): Min: 0.0, Avg: 4.2, Max: 7.2, Diff: 7.2, Sum: 34.0]
[Termination (ms): Min: 0.0, Avg: 0.2, Max: 0.4, Diff: 0.4, Sum: 1.7
[Termination Attempts: Min: 1, Avg: 7.9, Max: 18, Diff: 17, Sum: 63]
[GC Worker Other (ms): Min: 0.0, Avg: 0.0, Max: 0.1, Diff: 0.1, Sum: 0.4]
[GC Worker Total (ms): Min: 6.4, Avg: 7.4, Max: 7.7, Diff: 1.3, Sum: 59.6]
[GC Worker End (ms): Min: 527.0, Avg: 527.1, Max: 527.1, Diff: 0.1]
[Code Root Fixup: 0.0 ms]
[Code Root Purge: 0.0 ms]
[Clear CT: 0.5 ms]
[Other: 1.3 ms]
[Choose CSet: 0.0 ms]
[Ref Proc: 0.7 ms]](https://image.slidesharecdn.com/gc-tuning-master-piece-jprime-2025-250515083705-1585131d/85/GC-Tuning-A-Masterpiece-in-Performance-Engineering-24-320.jpg)
![CMS GC Format
Before GC:
Statistics for BinaryTreeDictionary:
------------------------------------
Total Free Space: 2524251
Max Chunk Size: 2519552
Number of Blocks: 13
Av. Block Size: 194173
Tree Height: 8
2016-05-03T04:27:37.503+0000: 30282.678: [ParNew
Desired survivor size 214728704 bytes, new threshold 1 (max 1)
- age 1: 85782640 bytes, 85782640 total
: 3510063K->100856K(3774912K), 0.0516290 secs] 9371816K->6022161K(14260672K)After GC:
Statistics for BinaryTreeDictionary:
------------------------------------
Total Free Space: 530579346
Max Chunk Size: 332576815
Number of Blocks: 7178
Av. Block Size: 73917
Tree Height: 44
After GC:](https://image.slidesharecdn.com/gc-tuning-master-piece-jprime-2025-250515083705-1585131d/85/GC-Tuning-A-Masterpiece-in-Performance-Engineering-25-320.jpg)


![GC Time
[Times: user=11.53 sys=1.38, real=1.03 secs]
Kernel
Java user
sys
Real: Wall clock time](https://image.slidesharecdn.com/gc-tuning-master-piece-jprime-2025-250515083705-1585131d/85/GC-Tuning-A-Masterpiece-in-Performance-Engineering-46-320.jpg)


![Inefficiency in Collections
List<User> users = new ArrayList<>();
users.add(user);
2 5
4 6 7 8 10
9
3
wasted
1
1
ArrayList underlyingly maintains
Object[]
initial capacity = 10](https://image.slidesharecdn.com/gc-tuning-master-piece-jprime-2025-250515083705-1585131d/85/GC-Tuning-A-Masterpiece-in-Performance-Engineering-52-320.jpg)


GC Tuning: A Masterpiece in Performance Engineering
- 3. What is Garbage? HTTP Request Objects Memory Garbage
- 4. 3 - 4 Decades ago Developer Writes code to Manually evict Garbage JVM Automatically evicts Garbage Now How are objects Garbage Collected? Evolution: Manual -> Automatic
- 5. Automatic GC sounds good right? Yes, but for GC pauses CPU consumption
- 6. https://blog.gceasy.io/automobile-company-optimizes-performance-using-gceasy/ Real case study: GC Performance of a one of the Largest Car Maker
- 7. GC Throughput 96% GC Throughput means Application is spending 96% of it’s time in processing customer transactions. Remaining 4% of time in processing GC activities. What is 96% GC Throughput? 1 day has 1440 minutes (i.e. 24 hours x 60 minutes) 4% = 57.6 minutes/day/JVM is stopping
- 8. Large Car Maker Reduces Response time by 50% https://blog.gceasy.io/automobile-company-optimizes-performance-using-gceasy/
- 9. GC Throughput % 99% 98% 97% 96% 95% Minutes wasted by 1 instance per day 14.4 min 28.8 min 43.2 min 57.6 min 72 min Hours wasted by 1 instance/year 87.6 hrs 175.2 hrs 262.8 hrs 350.4 hrs 438 hrs Dollars wasted by mid- size company (1K Instances/year) $50.07K $100.14K $150.21K $200.28K $250.36K Dollars wasted by large size company (10K Instances/year) $500.77K $1.00M $1.50M $2.00M $2.50M Dollars wasted by X-Large size company (100K Instances/year) $5.00M $10.01M $15.02M $20.02M $25.03M Millions of $ wasted https://blog.gceasy.io/how-many-millions-of-dollars-enterprises-waste-due-to-garbage-collection/ Note: Calculation based on t2.2x.large 32G RHEL on-demand instances in US West (North California) EC2 instances. Cost of this type of EC2 instance is $ 0.5716/hour.
- 10. 10 Large SaaS company CEO’s tweet
- 11. GC Tuning How We Saved 70K Cores Across 30 Mission-Critical Services? https://www.uber.com/en-IN/blog/how-we-saved-70k-cores-across-30-mission-critical-services/
- 13. GC Behavior of a Healthy Application - Full Garbage Collection Event Real World GC Report: https://tinyurl.com/ybm2d24m
- 14. 14 GC Behavior of Acute Memory Leak - Full Garbage Collection Event Real World GC Report:
- 15. 15 GC Behavior when there is a Memory Leak - Full Garbage Collection Event Real World GC Report: https://tinyurl.com/2an5j4fp
- 16. Java 11+: How many Garbage Collectors? HotSpot 1.Serial 2.Parallel 3.CMS 4.G1 5.Shenandoah 6.Z GC 7.Epsilon 7
- 17. How many GC/Memory related JVM arguments are available? 600+
- 18. You are not alone! Overwhelming? Trying to understand GC Before After
- 19. There are simple techniques Don’t Fear! There are simple techniques
- 20. Key Performance Indicators GC Event’s Pause Time 1. Latency Percentage of time spent in processing customer transactions vs time spent in GC activity. i.e. productive work vs non-productive work 2. Throughput Memory, CPU, Response Time 3. Foot Print 99.994 % Memory: 2GB CPU Time: 1 hr 9min You can't optimize, what you can't measure 1.2 secs 4. Key Metric Key Metrics in any Performance Exercise
- 21. 21 Step 1: Enable GC Logging -XX:+PrintGCDetails -XX:+PrintGCDateStamps -Xloggc:<file-path> Till Java 8 -Xlog:gc*:file=<file-path> From Java 9 Enable GC logs (always) Almost zero overhead. https://blog.gceasy.io/overhead-added-by-garbage-collection ging/
- 22. 2019-08-31T01:09:19.397+0000: 1.606: [GC (Metadata GC Threshold) [PSYoungGen: 545393K->18495K(2446848K)] 545393K->18519K(8039424K), 0.0189376 secs] [Times: user=0.15 sys=0.01, real=0.02 secs] 2019-08-31T01:09:19.416+0000: 1.625: [Full GC (Metadata GC Threshold) [PSYoungGen: 18495K->0K(2446848K)] [ParOldGen: 24K->17366K(5592576K)] 18519K->17366K(8039424K), [Metaspace: 20781K->20781K(1067008K)], 0.0416162 secs] [Times: user=0.38 sys=0.03, real=0.04 secs] 2019-08-31T01:18:19.288+0000: 541.497: [GC (Metadata GC Threshold) [PSYoungGen: 1391495K->18847K(2446848K)] 1408861K->36230K(8039424K), 0.0568365 secs] [Times: user=0.31 sys=0.75, real=0.06 secs] 2019-08-31T01:18:19.345+0000: 541.554: [Full GC (Metadata GC Threshold) [PSYoungGen: 18847K->0K(2446848K)] [ParOldGen: 17382K- >25397K(5592576K)] 36230K->25397K(8039424K), [Metaspace: 34865K->34865K(1079296K)], 0.0467640 secs] [Times: user=0.31 sys=0.08, real=0.04 secs] 2019-08-31T02:33:20.326+0000: 5042.536: [GC (Allocation Failure) [PSYoungGen: 2097664K->11337K(2446848K)] 2123061K->36742K(8039424K), 0.3298985 secs] [Times: user=0.00 sys=9.20, real=0.33 secs] 2019-08-31T03:40:11.749+0000: 9053.959: [GC (Allocation Failure) [PSYoungGen: 2109001K->15776K(2446848K)] 2134406K->41189K(8039424K), 0.0517517 secs] [Times: user=0.00 sys=1.22, real=0.05 secs] 2019-08-31T05:11:46.869+0000: 14549.079: [GC (Allocation Failure) [PSYoungGen: 2113440K->24832K(2446848K)] 2138853K->50253K(8039424K), 0.0392831 secs] [Times: user=0.02 sys=0.79, real=0.04 secs] 2019-08-31T06:26:10.376+0000: 19012.586: [GC (Allocation Failure) [PSYoungGen: 2122496K->25600K(2756096K)] 2147917K->58149K(8348672K), 0.0371416 secs] [Times: user=0.01 sys=0.75, real=0.04 secs] 2019-08-31T07:50:03.442+0000: 24045.652: [GC (Allocation Failure) [PSYoungGen: 2756096K->32768K(2763264K)] 2788645K->72397K(8355840K), 0.0709641 secs] [Times: user=0.16 sys=1.39, real=0.07 secs] 2019-08-31T09:04:21.406+0000: 28503.616: [GC (Allocation Failure) [PSYoungGen: 2763264K->32768K(2733568K)] 2802893K->83469K(8326144K), 0.0789178 secs] [Times: user=0.12 sys=1.59, real=0.08 secs] Vanilla Format
- 23. GC Log Format varies JVM Vendor Oracle HP IBM Azul OpenJDK … Java Version 1.4 5 6 7 8 9 10 11 : : 22 GC algorithm Serial Parallel CMS G1 Shennandoh Z GC Epsilon Arguments -XX:+PrintGC -XX:+PrintGCDateStamps -XX:+PrintGCDetails -XX:+PrintGCTimeStamps -XX: +PrintPromotionFailure -XX: +PrintGCApplicationStoppe dTime -XX:+PrintClassHistogram -XX:PrintFLSStatistics=1 -XX:+PrintCodeCache
- 24. G1 GC Format 2015-09-14T11:58:55.131-0700: 0.519: [GC pause (G1 Evacuation Pause) (young), 0.0096438 secs] [Parallel Time: 7.9 ms, GC Workers: 8] [GC Worker Start (ms): Min: 519.4, Avg: 519.6, Max: 520.6, Diff: 1.3] [Ext Root Scanning (ms): Min: 0.0, Avg: 2.9, Max: 7.3, Diff: 7.3, Sum: 23.4] [Update RS (ms): Min: 0.0, Avg: 0.0, Max: 0.0, Diff: 0.0, Sum: 0.0] [Processed Buffers: Min: 0, Avg: 0.0, Max: 0, Diff: 0, Sum: 0] [Scan RS (ms): Min: 0.0, Avg: 0.0, Max: 0.0, Diff: 0.0, Sum: 0.0] [Code Root Scanning (ms): Min: 0.0, Avg: 0.0, Max: 0.1, Diff: 0.1, Sum: 0.1] [Object Copy (ms): Min: 0.0, Avg: 4.2, Max: 7.2, Diff: 7.2, Sum: 34.0] [Termination (ms): Min: 0.0, Avg: 0.2, Max: 0.4, Diff: 0.4, Sum: 1.7 [Termination Attempts: Min: 1, Avg: 7.9, Max: 18, Diff: 17, Sum: 63] [GC Worker Other (ms): Min: 0.0, Avg: 0.0, Max: 0.1, Diff: 0.1, Sum: 0.4] [GC Worker Total (ms): Min: 6.4, Avg: 7.4, Max: 7.7, Diff: 1.3, Sum: 59.6] [GC Worker End (ms): Min: 527.0, Avg: 527.1, Max: 527.1, Diff: 0.1] [Code Root Fixup: 0.0 ms] [Code Root Purge: 0.0 ms] [Clear CT: 0.5 ms] [Other: 1.3 ms] [Choose CSet: 0.0 ms] [Ref Proc: 0.7 ms]
- 25. CMS GC Format Before GC: Statistics for BinaryTreeDictionary: ------------------------------------ Total Free Space: 2524251 Max Chunk Size: 2519552 Number of Blocks: 13 Av. Block Size: 194173 Tree Height: 8 2016-05-03T04:27:37.503+0000: 30282.678: [ParNew Desired survivor size 214728704 bytes, new threshold 1 (max 1) - age 1: 85782640 bytes, 85782640 total : 3510063K->100856K(3774912K), 0.0516290 secs] 9371816K->6022161K(14260672K)After GC: Statistics for BinaryTreeDictionary: ------------------------------------ Total Free Space: 530579346 Max Chunk Size: 332576815 Number of Blocks: 7178 Av. Block Size: 73917 Tree Height: 44 After GC:
- 26. IBM GC Format <af type="tenured" id="4" timestamp="Jun 16 11:28:22 2016" intervalms="5633.039"> <minimum requested_bytes="56" /> <time exclusiveaccessms="0.010" meanexclusiveaccessms="0.010" threads="0" lastthreadtid="0xF6B1C400" /> <refs soft="7232" weak="3502" phantom="9" dynamicSoftReferenceThreshold="30" maxSoftReferenceThreshold="32" /> <tenured freebytes="42949632" totalbytes="1073741824" percent="3" > <soa freebytes="0" totalbytes="1030792192" percent="0" /> <loa freebytes="42949632" totalbytes="42949632" percent="100" /> </tenured> <pending-finalizers finalizable="0" reference="0" classloader="0" /> <gc type="global" id="6" totalid="6" intervalms="3342.687"> <classunloading classloaders="0" classes="0" timevmquiescems="0.000" timetakenms="1.200" /> <finalization objectsqueued="75" /> <timesms mark="28.886" sweep="1.414" compact="0.000" total="31.571" /> <tenured freebytes="1014673616" totalbytes="1073741824" percent="94" > <soa freebytes="982461648" totalbytes="1041529856" percent="94" /> <loa freebytes="32211968" totalbytes="32211968" percent="100" /> </tenured> </gc> <tenured freebytes="1014608080" totalbytes="1073741824" percent="94" > <soa freebytes="982396112" totalbytes="1041529856" percent="94" /> <loa freebytes="32211968" totalbytes="32211968" percent="100" /> </tenured> <refs soft="7020" weak="2886" phantom="9" dynamicSoftReferenceThreshold="30" maxSoftReferenceThreshold="32" /> <pending-finalizers finalizable="75" reference="15" classloader="0" /> <time totalms="33.852" /> </af>
- 27. IBM GC another Format <gc-op id="139" type="scavenge" timems="335.610" contextid="136" timestamp="2016-06-15T15:51:10.128"> <scavenger-info tenureage="4" tenuremask="7ff0" tiltratio="58" /> <memory-copied type="nursery" objects="11071048" bytes="448013400" bytesdiscarded="88016" /> <memory-copied type="tenure" objects="286673" bytes="9771936" bytesdiscarded="320608" /> <copy-failed type="nursery" objects="286673" bytes="9771936" /> <finalization candidates="112" enqueued="16" /> <ownableSynchronizers candidates="8111" cleared="11" /> <references type="soft" candidates="1256" cleared="0" enqueued="0" dynamicThreshold="32" maxThreshold="32" /> <references type="weak" candidates="2953" cleared="0" enqueued="0" /> <references type="phantom" candidates="142406" cleared="142335" enqueued="142335" /> </gc-op>
- 28. Android Dalvik GC Format 07-01 15:56:20.035: I/Choreographer(30615): Skipped 141 frames! The application may be doing too much work on its main thread. 07-01 15:56:20.275: D/dalvikvm(30615): GC_FOR_ALLOC freed 4774K, 45% free 49801K/89052K, paused 168ms, total 168ms 07-01 15:56:20.295: I/dalvikvm-heap(30615): Grow heap (frag case) to 56.900MB for 4665616-byte allocation 07-01 15:56:21.315: D/dalvikvm(30615): GC_FOR_ALLOC freed 1359K, 42% free 55045K/93612K, paused 95ms, total 95ms 07-01 15:56:21.965: D/dalvikvm(30615): GC_CONCURRENT freed 6376K, 40% free 56861K/93612K, paused 16ms+8ms, total 126ms 07-01 15:56:21.965: D/dalvikvm(30615): WAIT_FOR_CONCURRENT_GC blocked 111ms 07-01 15:56:21.965: D/dalvikvm(30615): WAIT_FOR_CONCURRENT_GC blocked 97ms
- 29. Android ART GC Format 07-01 16:00:44.690: I/art(801): Explicit concurrent mark sweep GC freed 65595(3MB) AllocSpace objects, 9(4MB) LOS objects, 810% free, 38MB/58MB, paused 1.195ms total 87.219ms 07-01 16:00:46.517: I/art(29197): Background partial concurrent mark sweep GC freed 74626(3MB) AllocSpace objects, 39(4MB) LOS objects, 1496% free, 25MB/32MB, paused 4.422ms total 1.371747s 07-01 16:00:48.534: I/Choreographer(29197): Skipped 30 frames! The application may be doing too much work on its main thread. 07-01 16:00:48.566: I/art(29197): Background sticky concurrent mark sweep GC freed 70319(3MB) AllocSpace objects, 59(5MB) LOS objects, 825% free, 49MB/56MB, paused 6.139ms total 52.868ms 07-01 16:00:49.282: I/Choreographer(29197): Skipped 33 frames! The application may be doing too much work on its main thread.
- 30. GC Log analysis tools https://developer.ibm.com/ja vasdk/tools/ IBM GC & Memory visualizer GC Viewer https://github.com/chewiebu g/GCViewer GCeasy https://gceasy.io/ Google Garbage cat (cms) https://code.google.com/arch ive/a/eclipselabs.org/p/garba gecat HP Jmeter https://h20392.www2.hpe.co m/portal/swdepot/displayPro ductInfo.do?productNumber =HPJMETER 03 02 01 05 04
- 31. https://tinyurl.com/mw4kak4a GC Tuning Worksheet
- 32. 9 GC tuning tips & tricks https://blog.gceasy.io/reduce-long-garbage-collection-pauses/
- 33. 1. Start from scratch https://tinyurl.com/jwperforma nce Student of my training program Presented in DevOps/Jenkins world conference Ryan Smith Senior Developer Support Engineer, CloudBees Remove all GC related JVM arguments
- 34. Real world data from Big Bank
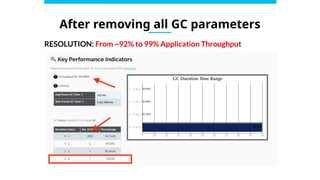
- 35. After removing all GC parameters
- 37. 2. Study GC Causes
- 38. 3. Disable Explicit System.gc() System.gc() or Runtime.getRuntime().gc() Always causes stop-the-world Full GCs. Try to avoid it. Because you are intervening with GC’s ergnomics May not always originate from your source code • 3rd party libraries, frameworks, sometimes even application servers • External tools (like VisualVM) through use of JMX. • RMI. -XX:+DisableExplicitGC This JVM argument disables System.gc() globally in your JVM.
- 40. 4. Resize Heap https://blog.gceasy.io/java-gc-tuning-improved-insurance-company-throughput/ Real case study: Large Insurance Company
- 41. 5. Resize Generation https://blog.gceasy.io/2022/03/04/garbage-collection-tuning-success-story-reducing-young-gen-size/ Real case study: Long GC Pause in Top Cloud Provider
- 42. 6. Choice of GC Algorithm CMS Parallel Serial Shenandoa h G1 Choice GC algorithm plays a key role in GC performance. 03 02 01 05 04 Z GC 06 Epsilo n 0 7
- 44. Switching GC algorithm https://blog.gceasy.io/2024/02/21/optimizing-robotics-applications-performance/ Real case study: Robotics App
- 45. 7. Tune GC Algorithm 1.Serial GC Tuning Parameters 2.Parallel GC Tuning Parameters 3.CMS GC Tuning Parameters 4.G1 GC Tuning Parameters 5.Shenandoah Tuning Parameters 6.ZGC Tuning Parameters
- 46. GC Time [Times: user=11.53 sys=1.38, real=1.03 secs] Kernel Java user sys Real: Wall clock time
- 47. Pattern: Sys > User Time
- 48. Pattern: Real Time > User Time + Sys Time
- 49. 8. Allocate Sufficient System Capacity Increase of RAM (Memory) Sometimes due to lack of memory (RAM), Operating system could be swapping your application from memory. Process swapping script will show all the process that are being swapped: https://blog.gceasy.io/2016/11/22/reduce-long-gc-pauses/ Increase GC Threads WARNING: Adding too many GC threads will consume a lot of CPU and takes away a resource from your application. Thus you need to conduct thorough testing before increasing the GC thread count. https://blog.gceasy.io/troubleshooting-high-jvm-gc-threads/
- 50. 9. High object creation rate 30 – 90% memory wasted due to inefficient programming
- 52. Inefficiency in Collections List<User> users = new ArrayList<>(); users.add(user); 2 5 4 6 7 8 10 9 3 wasted 1 1 ArrayList underlyingly maintains Object[] initial capacity = 10
- 53. Inefficiency in Collections 1 2 5 4 6 7 8 10 9 3 wasted List<User> users = new ArrayList<>(); for (int counter = 1; counter <= 11; ++counter) { users.add(user); } 1 2 5 4 6 7 8 10 9 3 11 12 15 14 17 18 20 19 13 16 1 2 5 4 6 7 8 9 3 11 12 15 14 17 18 20 19 13 16 21 22 25 24 26 27 28 29 23 31 32 35 34 37 38 40 39 33 36 30 wasted 10 for (int counter = 1; counter <= 21; ++counter) { users.add(user); }
- 54. Recommendation 1: Use Capacity new ArrayList<>(3); new ArrayList<>();
- 55. Recommendation 2: Lazy Initialization private List<User> users = new ArrayList<>(); public void addUser(User user) { users.add(user); } private List<User> users; public void addUser(User user) { if (users == null) { users = new ArrayList<>(); } users.add(user); }
- 56. Recommendation 3: avoid clear() List<User> users = new ArrayList<>(); users = null; List<User> users = new ArrayList<>(); users.clear();
- 57. How all memory is wasted? 1. Duplicate Strings: https://heaphero.io/heap-recommendations/duplicate-strings.html 2. Wrong memory size settings 3. Inefficient Collections: http://heaphero.io/heap-recommendations/inefficient-collections.html 4. Duplicate Objects: https://heaphero.io/heap-recommendations/duplicate-objects.html 5. Duplicate arrays: https://heaphero.io/heap-recommendations/duplicate-primitive-arrays.html 6. Inefficient arrays: https://heaphero.io/heap-recommendations/inefficient-primitive-arrays.html 7. Objects waiting for finalization: https://heaphero.io/heap-recommendations/objects-waiting-finalization.html 8. Boxed numbers: https://heaphero.io/heap-recommendations/boxed-numbers.html 9. Object Headers: https://heaphero.io/heap-recommendations/object-headers.html
- 58. More GC Tuning case studies Uber Saves Millions of $ https://blog.gceasy.io/2022/03/04/garbage-collection-tuning-success-story-reducing-young-gen-siz e/ Large Automobile Manufacturer Improves Response Time https://blog.gceasy.io/2022/03/04/garbage-collection-tuning-success-story-reducing-young-gen-siz e/ CloudBees (Jenkins Parent company) optimizes https://blog.gceasy.io/2019/08/01/cloudbees-gc-performance-optimized-with-gceasy/ Oracle optimizes App performance by tuning GC https://blog.gceasy.io/2022/12/06/oracle-architect-optimizes-performance-using-gceasy/
- 59. True Shift Left Initiative: Integrate GC Analysis in CI/CD Pipeline GC Analysis REST API https://blog.gceasy.io/prevent-memory-issues-monitor-gc-cicd/
- 60. What is garbage? Everything is garbage!
- 61. Thank you my friends! Ram Lakshmanan @ycrash_rca This deck will be published in: https://blog.gceasy.io https://www.linkedin.com/company/ycrash
Editor's Notes
- #6: https://gceasy.io/my-gc-report.jsp?p=c2hhcmVkLzIwMjEvMDQvOC8tLWdjLTIwMjEtMDQtMDZfMjAtMTgtNTRfbm9kZTYxLmxvZy0tMTUtMjgtMw==&s=t&channel=WEB&s=t Baseline: http://localhost:8080/yc-report.jsp?ou=SAP&de=192.168.56.170&app=yc&ts=2024-04-21T11-43-54 Benchmark: http://localhost:8080/yc-report.jsp?ou=SAP&de=192.168.56.170&app=yc&ts=2024-04-21T11-45-24
- #30: Demo: GCeasy - C:\workspace\ycrash\speeches\9-types-oom\memory-leak.zip
- #40: Baseline: https://gceasy.io/my-gc-report.jsp?p=c2hhcmVkLzIwMjQvMDUvMTkvamF2YV9nYy0yMDI0LTA0LTMwXzA3LTE2LTAyX24xLmxvZy0tNC01My0xMw==&channel=WEB&s=t Benchmark: https://gceasy.io/my-gc-report.jsp?p=c2hhcmVkLzIwMjUvMDEvOS9qYXZhX2djLTIwMjQtMDYtMjJfMDYtMzQtMTAubG9nLS0xOC03LTQ=&channel=WEB&s=t
- #41: Baseline: https://gceasy.io/my-gc-report.jsp?p=c2hhcmVkLzIwMjQvMDkvMTAvMjQtaG91ci1nYy1sb2cuZ3otLTIyLTI0LTE0&channel=WEB&s=t Benchmark: https://gceasy.io/my-gc-report.jsp?p=c2hhcmVkLzIwMjQvMDkvMTAvNTAtaG91ci1nYy1sb2cuZ3otLTIyLTI2LTMy&channel=WEB&s=t http://localhost:8080/yc-report.jsp?ou=SAP&de=192.168.56.170&app=yc&ts=2024-04-21T11-43-54 http://localhost:8080/yc-report.jsp?ou=SAP&de=192.168.56.170&app=yc&ts=2024-04-21T11-45-24
- #42: CMS GC: https://gceasy.io/my-gc-report.jsp?p=c2hhcmVkLzIwMjQvMDIvNS9nYy4yMDIzMTIxNCAoMSkubG9nLmd6LS0yMC03LTMx&channel=WEB&s=t G1 GC: https://gceasy.io/my-gc-report.jsp?p=c2hhcmVkLzIwMjMvMTIvMjEvZ2MubG9nLS01LTIxLTU0&channel=WEB&s=t
- #44: CMS GC: https://gceasy.io/my-gc-report.jsp?p=c2hhcmVkLzIwMjQvMDIvNi9nYy4yMDIzMTIxNC5sb2ctLTIzLTU5LTY=&channel=WEB&s=t G1 GC: https://gceasy.io/my-gc-report.jsp?p=c2hhcmVkLzIwMjMvMTIvMjEvZ2MubG9nLS01LTIxLTU0&channel=WEB&s=t