SlideShare a Scribd company logo
Graph-based Network & IT
Management.
SAS founded in 2013 in Paris | http://linkurio.us | @linkurious
Introduction to Linkurious.
Graph visualization and analysis
startup founded in 2013.
200+ customers worldwide (NASA,
Cisco, French Ministry of Finances).
Linkurious Enterprise and
Linkurious SDK.
Unlocking the value of graph data.
A graph is a set of entities (nodes)
and relationships (edges).
Graph databases are perfect to store
and process large connected graphs
in real-time.
Linkurious’ software helps analysts
easily detect and investigate insights
hidden in graph data.
Source: Database popularity evolution per category Avril 2017 - DB Engines ranking.
↗ 500% popularity increase since
2013 for Graph Databases
Typical use cases.
Cyber-security
Servers, switches, routers,
applications, etc.
Suspicious activity patterns,
identify impact of a compromised
asset.
IT Operations
Servers, switches, routers,
applications, etc.
Impact analysis, root cause
analysis.
Intelligence
People, emails, transactions,
phone call records, social.
Detecting and investigating
criminal or terrorist networks.
AML
People, transactions, watch-lists,
companies, organizations.
Detecting suspicious
transactions, identify beneficiary
owners.
Fraud
Claims, people, financial records,
personal data.
Detecting and investigating
criminal networks.
Life Sciences
Proteins, publications,
researchers, patents, topics.
Understanding protein
interactions, new drugs.
Enterprise
Architecture
Servers, applications, metadata,
business objectives.
Data lineage, curating enterprise
architecture.
Administration and management of an
organisation’s computer network to
ensure that all technology resources are
used properly and in a manner that
provides value for the organization.
The cost of bad IT management.
Increases infrastructure costs and
generates costly network issues.
Downtimes can impact
missions-critical services and the
organization security.
Failures and outages can also lower
consumer confidence and damage the
enterprise's brand integrity.
Average downtime costs
range from $1 million for
typical midsize company to
more than $60 million per
year for large enterprises.
IHS Inc report: “The Cost of Server,
Application & Network Downtime 2016”
A growing complexity and pressure.
High number and diversity of devices
in a fast-evolving infrastructure,
creating hairball architectures.
No single nor unified source of truth
because of siloed data.
Performance issues when querying
connections with relational
technologies.
Requirements of constant availability
of devices and equipment.
What graph technologies like Linkurious can bring to network & IT managers.
Network visibility.
Visibility is essential to run IT
infrastructure efficiently. Map
all your assets and
dependencies in an
infrastructure graph.
Greater usability.
Managing all infrastructure
components from a single
platform reduces complexity
and enhances usability by
reducing errors.
Real-time analysis.
Fast responses are criticals in
case of outages. Get instant
insights when querying highly
connected data even in large
datasets.
Easy to represent an IT infrastructure
as a graph.
Aggregates physical and virtual
infrastructure components into a
single model.
Choose the graph database of your
choice.
A 360° visibility of your network.
NETWORK
LAYER
PHYSICAL
LAYER
DATA
LAYER
APPLICATION
LAYER
Search and explore your data through
a dynamic visualization interface.
Visually and quickly track
dependencies between components.
Set up alerts to monitor patterns in
real-time.
Instant insights with graph analytics.
Empower your team with data.
Directly edit your infrastructure
data.
Assign rights and collaborate to
investigate multiple situations and
scenarios.
Share results with decision makers
via interactive visualizations.
Demo: Network & IT
management with Linkurious.
- Exploring interdependencies;
- Detecting assets with large dependencies.
Modeling our IT and network infrastructure data into a graph.
Exploring interdependencies between entities in Linkurious Enterprise
Detect assets with large dependencies thanks to automated Cypher queries.
Load data into one of the graph DB
supported by Linkurious: Neo4j,
DataStax, Titan, AllegroGraph.
Windows / Linux / Mac, on-premise
or in the cloud, supports all modern
browsers.
Use Linkurious Enterprise
off-the-shelf interface or build your
custom application with Linkurious
SDK.
How it works.
Log Management
System (GrayLog,
logstash…)
Synchronize
automatically
CMDB (SysAid,
Freshservice,
JIRA..)
Graph DB (Neo4j,
AllegroGraph,
Titan, DataStax..)
Background
US internet company in the retail
industry.
Problem
Impact of a failure in IT network is
hard to understand and to
communicate.
Benefit
Visualization helps communicate
complex results and drive action.
Impact analysis and IT operations (confidential).
Background
International vehicle manufacturer.
Problem
Complex and large manufacturing
process with multiple technology
dependencies is hard to understand
and to communicate.
Benefit
Holistic graph approach allows to
run impact analysis. Visualization
helps communicate complex results
and drive action.
Project planning and impact analysis (confidential).
www.linkurio.us
contact@linkurio.us

More Related Content

What's hot (17)

PPTX
The years of the graph: The future of the future is here
Connected Data World
 
PDF
RAPIDS cuGraph – Accelerating all your Graph needs
Connected Data World
 
PDF
Big data landscape map collection by aibdp
AIBDP
 
PDF
Big Data Landscape 2016
Josef Adersberger
 
PDF
Graphs in Telecommunications - Jesus Barrasa, Neo4j
Neo4j
 
PDF
From Knowledge Graphs to AI-powered SEO: Using taxonomies, schemas and knowle...
Connected Data World
 
PDF
Paris Spark Meetup - Trifacta - 03_04_2017
Modern Data Stack France
 
PDF
Data Wrangling on Hadoop - Olivier De Garrigues, Trifacta
huguk
 
PDF
Big data landscape v 3.0 - Matt Turck (FirstMark)
Matt Turck
 
PDF
Introduction to the graph technologies landscape
Linkurious
 
PPTX
A chart of the big data ecosystem
Matt Turck
 
PDF
Perth Microsoft Data & Analytics User Group - Building Solutions with Azure D...
Sergio Zenatti Filho
 
PDF
Scalability and Graph Analytics with Neo4j - Stefan Kolmar, Neo4j
Neo4j
 
PPTX
Solution architecture
Rajat Agrawal
 
PDF
Neo4j Graph Data Science Training - June 9 & 10 - Slides #7 GDS Best Practices
Neo4j
 
PPTX
Big data landscape version 2.0
Matt Turck
 
PPTX
Enterprise architecture for big data projects
Sandeep Sharma IIMK Smart City,IoT,Bigdata,Cloud,BI,DW
 
The years of the graph: The future of the future is here
Connected Data World
 
RAPIDS cuGraph – Accelerating all your Graph needs
Connected Data World
 
Big data landscape map collection by aibdp
AIBDP
 
Big Data Landscape 2016
Josef Adersberger
 
Graphs in Telecommunications - Jesus Barrasa, Neo4j
Neo4j
 
From Knowledge Graphs to AI-powered SEO: Using taxonomies, schemas and knowle...
Connected Data World
 
Paris Spark Meetup - Trifacta - 03_04_2017
Modern Data Stack France
 
Data Wrangling on Hadoop - Olivier De Garrigues, Trifacta
huguk
 
Big data landscape v 3.0 - Matt Turck (FirstMark)
Matt Turck
 
Introduction to the graph technologies landscape
Linkurious
 
A chart of the big data ecosystem
Matt Turck
 
Perth Microsoft Data & Analytics User Group - Building Solutions with Azure D...
Sergio Zenatti Filho
 
Scalability and Graph Analytics with Neo4j - Stefan Kolmar, Neo4j
Neo4j
 
Solution architecture
Rajat Agrawal
 
Neo4j Graph Data Science Training - June 9 & 10 - Slides #7 GDS Best Practices
Neo4j
 
Big data landscape version 2.0
Matt Turck
 
Enterprise architecture for big data projects
Sandeep Sharma IIMK Smart City,IoT,Bigdata,Cloud,BI,DW
 

Similar to Graph-based Network & IT Management. (20)

PDF
Finding answers through visualization (GraphDay Barcelona Feb 2016)
Linkurious
 
PDF
Finding the insights hidden in your graph data
DataStax
 
PDF
Network Observability – 5 Best Platforms for Observability
GauriKale30
 
PDF
Detecting eCommerce Fraud with Neo4j and Linkurious
Neo4j
 
PDF
Analytics as a Service in SL
SkylabReddy Vanga
 
PPTX
UNIT-1 Data Visualization used in daily life
AadityaRathi4
 
PPTX
UNIT-1 Data Visualization for the life use
AadityaRathi4
 
PPTX
Matrix Mapper
aarkentechnologies
 
PDF
Fast Data and Architecting the Digital Enterprise Fast Data drivers, componen...
Stuart Blair
 
PDF
AI, ML and Graph Algorithms: Real Life Use Cases with Neo4j
Ivan Zoratti
 
PDF
Mobile Data Analytics
RICHARD AMUOK
 
PDF
Data Observability- The Next Frontier of Data Engineering Pdf.pdf
Data Science Council of America
 
PDF
SPLUNK_empower-engineers-with-unified-observability.pdf
sharnoby2
 
PDF
Glenn Lazarus- Why Your Observability Strategy Needs Security Observability
itnewsafrica
 
PDF
Splunk for big_data
Greg Hanchin
 
PDF
unit-4-notes.pdf
ssuser9838f7
 
PPTX
Big Data PPT by Rohit Dubey
Rohit Dubey
 
PDF
Big Data Whitepaper - Streams and Big Insights Integration Patterns
Mauricio Godoy
 
PPTX
Module 1
Gaurav Malode
 
PDF
Big data – A Review
IRJET Journal
 
Finding answers through visualization (GraphDay Barcelona Feb 2016)
Linkurious
 
Finding the insights hidden in your graph data
DataStax
 
Network Observability – 5 Best Platforms for Observability
GauriKale30
 
Detecting eCommerce Fraud with Neo4j and Linkurious
Neo4j
 
Analytics as a Service in SL
SkylabReddy Vanga
 
UNIT-1 Data Visualization used in daily life
AadityaRathi4
 
UNIT-1 Data Visualization for the life use
AadityaRathi4
 
Matrix Mapper
aarkentechnologies
 
Fast Data and Architecting the Digital Enterprise Fast Data drivers, componen...
Stuart Blair
 
AI, ML and Graph Algorithms: Real Life Use Cases with Neo4j
Ivan Zoratti
 
Mobile Data Analytics
RICHARD AMUOK
 
Data Observability- The Next Frontier of Data Engineering Pdf.pdf
Data Science Council of America
 
SPLUNK_empower-engineers-with-unified-observability.pdf
sharnoby2
 
Glenn Lazarus- Why Your Observability Strategy Needs Security Observability
itnewsafrica
 
Splunk for big_data
Greg Hanchin
 
unit-4-notes.pdf
ssuser9838f7
 
Big Data PPT by Rohit Dubey
Rohit Dubey
 
Big Data Whitepaper - Streams and Big Insights Integration Patterns
Mauricio Godoy
 
Module 1
Gaurav Malode
 
Big data – A Review
IRJET Journal
 
Ad

More from Linkurious (20)

PDF
Using graph technology for multi-INT investigations
Linkurious
 
PPTX
Webinar: What's new in Linkurious Enterprise 2.8
Linkurious
 
PDF
Graph-based intelligence analysis
Linkurious
 
PDF
What's new in Linkurious Enterprise 2.7
Linkurious
 
PDF
GraphTech Ecosystem - part 2: Graph Analytics
Linkurious
 
PDF
3 types of fraud graph analytics can help defeat
Linkurious
 
PDF
Graph technology and data-journalism: the case of the Paradise Papers
Linkurious
 
PDF
Visualize the Knowledge Graph and Unleash Your Data
Linkurious
 
PDF
Detecting eCommerce Fraud with Neo4j and Linkurious
Linkurious
 
PDF
Graph-powered data lineage in Finance
Linkurious
 
PDF
Linkurious SDK: Build enterprise-ready graph applications faster
Linkurious
 
PDF
Fighting financial crime with graph analysis at BIWA Summit 2017
Linkurious
 
PDF
Reinforcing AML systems with graph technologies.
Linkurious
 
PDF
Using graphs technologies for intelligence analysis.
Linkurious
 
PDF
The 8 most common graph visualization mistakes
Linkurious
 
PDF
Panama papers: how ICIJ used Linkurious to investigate the Mossack Fonseca leaks
Linkurious
 
PDF
La visualisation au service de la lutte contre la fraude
Linkurious
 
PDF
Graph analysis of the European public tenders
Linkurious
 
PDF
Using graph technologies to fight fraud
Linkurious
 
PDF
Linkurious Enterprise: graph visualization platform neo4j
Linkurious
 
Using graph technology for multi-INT investigations
Linkurious
 
Webinar: What's new in Linkurious Enterprise 2.8
Linkurious
 
Graph-based intelligence analysis
Linkurious
 
What's new in Linkurious Enterprise 2.7
Linkurious
 
GraphTech Ecosystem - part 2: Graph Analytics
Linkurious
 
3 types of fraud graph analytics can help defeat
Linkurious
 
Graph technology and data-journalism: the case of the Paradise Papers
Linkurious
 
Visualize the Knowledge Graph and Unleash Your Data
Linkurious
 
Detecting eCommerce Fraud with Neo4j and Linkurious
Linkurious
 
Graph-powered data lineage in Finance
Linkurious
 
Linkurious SDK: Build enterprise-ready graph applications faster
Linkurious
 
Fighting financial crime with graph analysis at BIWA Summit 2017
Linkurious
 
Reinforcing AML systems with graph technologies.
Linkurious
 
Using graphs technologies for intelligence analysis.
Linkurious
 
The 8 most common graph visualization mistakes
Linkurious
 
Panama papers: how ICIJ used Linkurious to investigate the Mossack Fonseca leaks
Linkurious
 
La visualisation au service de la lutte contre la fraude
Linkurious
 
Graph analysis of the European public tenders
Linkurious
 
Using graph technologies to fight fraud
Linkurious
 
Linkurious Enterprise: graph visualization platform neo4j
Linkurious
 
Ad

Recently uploaded (20)

PPTX
sajflsajfljsdfljslfjslfsdfas;fdsfksadfjlsdflkjslgfs;lfjlsajfl;sajfasfd.pptx
theknightme
 
PDF
Build Fast, Scale Faster: Milvus vs. Zilliz Cloud for Production-Ready AI
Zilliz
 
PPTX
ONLINE BIRTH CERTIFICATE APPLICATION SYSYTEM PPT.pptx
ShyamasreeDutta
 
PPTX
原版西班牙莱昂大学毕业证(León毕业证书)如何办理
Taqyea
 
DOCX
Custom vs. Off-the-Shelf Banking Software
KristenCarter35
 
PDF
BRKACI-1001 - Your First 7 Days of ACI.pdf
fcesargonca
 
PPTX
Lec15_Mutability Immutability-converted.pptx
khanjahanzaib1
 
PDF
Azure_DevOps introduction for CI/CD and Agile
henrymails
 
PPTX
一比一原版(SUNY-Albany毕业证)纽约州立大学奥尔巴尼分校毕业证如何办理
Taqyea
 
PPT
introductio to computers by arthur janry
RamananMuthukrishnan
 
PPT
introduction to networking with basics coverage
RamananMuthukrishnan
 
PPTX
04 Output 1 Instruments & Tools (3).pptx
GEDYIONGebre
 
PPTX
Optimization_Techniques_ML_Presentation.pptx
farispalayi
 
PPTX
internet básico presentacion es una red global
70965857
 
PPTX
L1A Season 1 Guide made by A hegy Eng Grammar fixed
toszolder91
 
PDF
The Internet - By the numbers, presented at npNOG 11
APNIC
 
PDF
Cleaning up your RPKI invalids, presented at PacNOG 35
APNIC
 
PPTX
PM200.pptxghjgfhjghjghjghjghjghjghjghjghjghj
breadpaan921
 
PPTX
Softuni - Psychology of entrepreneurship
Kalin Karakehayov
 
PPT
Agilent Optoelectronic Solutions for Mobile Application
andreashenniger2
 
sajflsajfljsdfljslfjslfsdfas;fdsfksadfjlsdflkjslgfs;lfjlsajfl;sajfasfd.pptx
theknightme
 
Build Fast, Scale Faster: Milvus vs. Zilliz Cloud for Production-Ready AI
Zilliz
 
ONLINE BIRTH CERTIFICATE APPLICATION SYSYTEM PPT.pptx
ShyamasreeDutta
 
原版西班牙莱昂大学毕业证(León毕业证书)如何办理
Taqyea
 
Custom vs. Off-the-Shelf Banking Software
KristenCarter35
 
BRKACI-1001 - Your First 7 Days of ACI.pdf
fcesargonca
 
Lec15_Mutability Immutability-converted.pptx
khanjahanzaib1
 
Azure_DevOps introduction for CI/CD and Agile
henrymails
 
一比一原版(SUNY-Albany毕业证)纽约州立大学奥尔巴尼分校毕业证如何办理
Taqyea
 
introductio to computers by arthur janry
RamananMuthukrishnan
 
introduction to networking with basics coverage
RamananMuthukrishnan
 
04 Output 1 Instruments & Tools (3).pptx
GEDYIONGebre
 
Optimization_Techniques_ML_Presentation.pptx
farispalayi
 
internet básico presentacion es una red global
70965857
 
L1A Season 1 Guide made by A hegy Eng Grammar fixed
toszolder91
 
The Internet - By the numbers, presented at npNOG 11
APNIC
 
Cleaning up your RPKI invalids, presented at PacNOG 35
APNIC
 
PM200.pptxghjgfhjghjghjghjghjghjghjghjghjghj
breadpaan921
 
Softuni - Psychology of entrepreneurship
Kalin Karakehayov
 
Agilent Optoelectronic Solutions for Mobile Application
andreashenniger2
 

Graph-based Network & IT Management.

  • 1. Graph-based Network & IT Management. SAS founded in 2013 in Paris | http://linkurio.us | @linkurious
  • 2. Introduction to Linkurious. Graph visualization and analysis startup founded in 2013. 200+ customers worldwide (NASA, Cisco, French Ministry of Finances). Linkurious Enterprise and Linkurious SDK.
  • 3. Unlocking the value of graph data. A graph is a set of entities (nodes) and relationships (edges). Graph databases are perfect to store and process large connected graphs in real-time. Linkurious’ software helps analysts easily detect and investigate insights hidden in graph data. Source: Database popularity evolution per category Avril 2017 - DB Engines ranking. ↗ 500% popularity increase since 2013 for Graph Databases
  • 4. Typical use cases. Cyber-security Servers, switches, routers, applications, etc. Suspicious activity patterns, identify impact of a compromised asset. IT Operations Servers, switches, routers, applications, etc. Impact analysis, root cause analysis. Intelligence People, emails, transactions, phone call records, social. Detecting and investigating criminal or terrorist networks. AML People, transactions, watch-lists, companies, organizations. Detecting suspicious transactions, identify beneficiary owners. Fraud Claims, people, financial records, personal data. Detecting and investigating criminal networks. Life Sciences Proteins, publications, researchers, patents, topics. Understanding protein interactions, new drugs. Enterprise Architecture Servers, applications, metadata, business objectives. Data lineage, curating enterprise architecture.
  • 5. Administration and management of an organisation’s computer network to ensure that all technology resources are used properly and in a manner that provides value for the organization.
  • 6. The cost of bad IT management. Increases infrastructure costs and generates costly network issues. Downtimes can impact missions-critical services and the organization security. Failures and outages can also lower consumer confidence and damage the enterprise's brand integrity. Average downtime costs range from $1 million for typical midsize company to more than $60 million per year for large enterprises. IHS Inc report: “The Cost of Server, Application & Network Downtime 2016”
  • 7. A growing complexity and pressure. High number and diversity of devices in a fast-evolving infrastructure, creating hairball architectures. No single nor unified source of truth because of siloed data. Performance issues when querying connections with relational technologies. Requirements of constant availability of devices and equipment.
  • 8. What graph technologies like Linkurious can bring to network & IT managers. Network visibility. Visibility is essential to run IT infrastructure efficiently. Map all your assets and dependencies in an infrastructure graph. Greater usability. Managing all infrastructure components from a single platform reduces complexity and enhances usability by reducing errors. Real-time analysis. Fast responses are criticals in case of outages. Get instant insights when querying highly connected data even in large datasets.
  • 9. Easy to represent an IT infrastructure as a graph. Aggregates physical and virtual infrastructure components into a single model. Choose the graph database of your choice. A 360° visibility of your network. NETWORK LAYER PHYSICAL LAYER DATA LAYER APPLICATION LAYER
  • 10. Search and explore your data through a dynamic visualization interface. Visually and quickly track dependencies between components. Set up alerts to monitor patterns in real-time. Instant insights with graph analytics.
  • 11. Empower your team with data. Directly edit your infrastructure data. Assign rights and collaborate to investigate multiple situations and scenarios. Share results with decision makers via interactive visualizations.
  • 12. Demo: Network & IT management with Linkurious. - Exploring interdependencies; - Detecting assets with large dependencies.
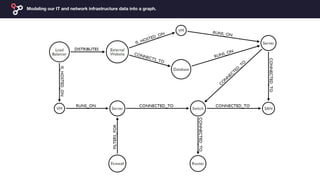
  • 13. Modeling our IT and network infrastructure data into a graph.
  • 14. Exploring interdependencies between entities in Linkurious Enterprise
  • 15. Detect assets with large dependencies thanks to automated Cypher queries.
  • 16. Load data into one of the graph DB supported by Linkurious: Neo4j, DataStax, Titan, AllegroGraph. Windows / Linux / Mac, on-premise or in the cloud, supports all modern browsers. Use Linkurious Enterprise off-the-shelf interface or build your custom application with Linkurious SDK. How it works. Log Management System (GrayLog, logstash…) Synchronize automatically CMDB (SysAid, Freshservice, JIRA..) Graph DB (Neo4j, AllegroGraph, Titan, DataStax..)
  • 17. Background US internet company in the retail industry. Problem Impact of a failure in IT network is hard to understand and to communicate. Benefit Visualization helps communicate complex results and drive action. Impact analysis and IT operations (confidential).
  • 18. Background International vehicle manufacturer. Problem Complex and large manufacturing process with multiple technology dependencies is hard to understand and to communicate. Benefit Holistic graph approach allows to run impact analysis. Visualization helps communicate complex results and drive action. Project planning and impact analysis (confidential).