SlideShare a Scribd company logo
How to Create Observable Integration
Solutions Using WSO2 Enterprise
Integrator
Chanika Geeganage and Lahiru Madushanka
Integration Team
1
Agenda
• Introduction to observability in WSO2 Enterprise Integrator
• Observability for integrations
• Observability for business processes
• Observability for messaging
• Extending EI Analytics
2
Introduction
Importance of Observability
• Observability is a measure of how well internal states of a
system can be inferred from knowledge of its external outputs.
• Observability helps in
– Decision making and building incident preparedness
– Identifying constrained resources and forecasting growth
– Helping reduce the cycle of fire fighting within teams
4
Introduction to Observability in WSO2 EI
• Events
• Logs
• Tracing
• Java Management Extensions (JMX)
5
Business / Operational Insight
5
Applications
Services and systems
Improvements / Modifications
Existing Services
Identify erroneous
incidents
Monitoring requests count
Trace messages
WSO2
Enterprise
Integrator
Monitor Infrastructure
utilization
Observability for
Integrations
ESB Event Monitoring with EI Analytics
7
Thrift Data
Agent
Thrift Data
Receiver
Real
Time
Events Dashboard
Storage
Analyze
Summarize
Worker Portal
Aggregations over long time periods
• Incremental aggregation for
– every second, minute, hour, … , year
• Support for out of order event arrival
• Fast data retrieval from memory and disk
8
Current Min
Current Hour
Sec
Min
Hour
0 - 1 - 5 ...
- 1
- 2 - 3 - 4 - 64 - 65 ...
- 2
- 124
Prerequisites for EI Analytics
• To enable mediation statistics and message tracing,
<EI_HOME>/conf/synapse.properties
9
Property Name Description
mediation.flow.statistics.enable Enables statistics for the selected ESB artifact(s).
mediation.flow.statistics.tracer.collect.payloads Enables tracing for the selected ESB artifact(s) and
records message payloads.
mediation.flow.statistics.tracer.collect.properties Enables tracing for the selected ESB artifact(s) and
records message context (transport) properties.
mediation.flow.statistics.collect.all Enables mediation statistics for all the artifacts in the
ESB profile by default.
Prerequisites for EI Analytics cont.
• To publish data from the ESB profile to EI analytics profile,
<EI_HOME>/repository/deployment/server/eventpublishers/MessageFlowConfigurationPublisher.xml
<EI_HOME>/repository/deployment/server/eventpublishers/MessageFlowStatisticsPublisher.xml
10
Property Name Description
username The username to be used when accessing the
WSO2 EI Analytics server to publish
configurations.
password The password to be used when accessing the
WSO2 EI Analytics server to publish
configurations.
receiver URL The URL of the thrift port to which the EI
configurations should be published. The format of
the URL is as follows.
tcp://<localhost>:<THRIFT_PORT>
Enabling Statistics/Tracing for Individual
Artifacts
11
Real-time Analytics
• Process events as and when received
• Default Siddhi App consists of Siddhi queries, input, and output streams
12
-- if DecompressedEventStream's componentType is ProxyService or API or InboundEndPoint, add
it into PreProcessedESBStatStream
from DecompressedEventStream[componentType == "proxy service" or componentType == "api" or
componentType == "inbound endpoint"]
select componentId, componentName, componentType, duration, ifThenElse(faultCount > 0, 1, 0)
as faultCount, startTime, entryPoint, metaTenantId
insert current events into PreProcessedESBStatStream;
Monitoring ESB Profile with Analytics
Dashboard
• ESB profile statistics overview
• Statistics for proxy services
• Statistics for sequences
• Statistics for REST APIs
• Statistics for endpoints and inbound endpoints
• Statistics for mediators and messages
13
How to Create Observable Integration Solutions Using WSO2 Enterprise Integrator
Data Purging
• By default enabled in Siddhi App
• Defined using @purge
@store(type = 'rdbms', datasource = 'EI_ANALYTICS')
@info(name = 'MediatorStat')
@purge(enable='true', interval='60 min', @retentionPeriod(sec='1 day', min='72 hours', hours='90 days', days='1
year', months='2 years', years='3 years'))
define aggregation MediatorStatAgg
from PreProcessedMediatorStatStream
select metaTenantId, entryPoint, entryPointHashcode, componentId, hashCode, componentName, componentType,
sum(duration) as totalDuration ,avg(duration) as avgDuration, min(duration) as minDuration, max(duration) as
maxDuration, count() as noOfInvocation, sum(faultCount) as faultCount, startTime
group by metaTenantId, componentId, componentName, componentType, entryPoint, entryPointHashcode, hashCode
aggregate by startTime every sec...years;
Observability for
Business Processes
Monitor via BPMN-Explorer
• Historical information of process instances
Monitor via BPMN-Explorer Cont.
• Supports advanced filtering
18
Generate Reports via BPMN-Explorer
• Process Instance Count
• Average Time Duration Of
Completed Processes
• Task Durations Of Completed
Process
• User Vs Number Of Tasks
Completed
• User Vs Average Time Taken to
Complete Tasks
• Task Instance Count Variation
Over Time
• Process Instance Count Variation
Over Time
• User Performance Of Tasks
Instances Over Time
Generate Reports via BPMN-Explorer Cont.
Observability for
Messaging
Broker-Specific MBeans
• JMX monitoring on following MBeans using JConsole or other third party monitoring tool.
(AppDynamics)
22
Property Name Description
ClusterManagementInformation MBean Cluster specific attributes.
MessageStatusInformation MBean Retrieve the lifecycle status of the
messages in the store to a specific Excel
sheet.
QueueManageInformation MBean Queue specific attributes and operations.
SubscriptionManageInformation MBean Subscription specific operations.
Message Metrics
23
Messaging Metrics Views
● Disruptor
● Publish and Subscribe
● Messages and acknowledgements
● Database
JVM Metrics
24
JVM Metrics Views
● CPU
● Memory
● Threading
● Class Loading
● File Descriptor
Extending EI Analytics
JMX Monitoring
• WSO2 Enterprise Integrator exposes a number of management resources as JMX MBeans
which helps to monitor the running server.
• To monitor statistics relating to artifacts that are deployed in the EI server Mediation Flow
Statistics View Mbean can be used.
26
How to Create Observable Integration Solutions Using WSO2 Enterprise Integrator
Customize Statistics Publishing
• A custom statistics observer can be created by implementing
org.wso2.carbon.das.messageflow.data.publisher.observer.MessageFlowObserver interface.
28
public class MyStatisticsObserver implements MessageFlowObserver {
//Invoked when this observer is notified
public void updateStatistics(PublishingFlow publishingFlow) {
//Process data
}
}
<MediationFlowStatisticConfig>
<Observers>
org.wso2.custom.MyStatisticsObserver
</Observers>
</MediationFlowStatisticConfig>
● Add all custom observers as a comma separated list in the <EI_HOME>/conf/carbon.xml.
EI logs Monitoring with Elastic Stack
• Setting up Filebeat to read log files from EI.
• Update filebeat-yaml with the path to EI logs folder.
• Setting up Logstash to take the log lines from Filebeat, convert them to JSON strings, and ship
them to Elasticsearch.
• Setting up Elasticsearch to store and search logs.
• Setting up Kibana to monitor EI.
29
ESB Statistic Monitoring with ElasticStack
• Custom message flow observer implemented to publish EI statistics to ElasticStatisticPublisher.
30
Kibana Visualization
31
Kibana Visualization
32
EI Performance Monitoring with
AppDynamics
• Configuring App Agent and WSO2 Enterprise Integrator
Edit the integrator.sh in the EI-Installation/bin by inserting the line-
-javaagent:"/path-to-app-agent-directory/javaagent.jar" 
33
EI Performance monitoring with
AppDynamics cont..
34
How to Create Observable Integration Solutions Using WSO2 Enterprise Integrator
THANK YOU
wso2.com
THANK YOU
wso2.com

More Related Content

Similar to How to Create Observable Integration Solutions Using WSO2 Enterprise Integrator (20)

PDF
Observability for Integration Using WSO2 Enterprise Integrator
WSO2
 
PPTX
Middleware monitoring with Applications Manager
ManageEngine, Zoho Corporation
 
PPTX
Log insight 3.3 customer presentation
David Pasek
 
PDF
Hbb 2852 gain insights into your business operations with bpm and kibana
Allen Chan
 
PDF
Azure Monitoring Overview
gjuljo
 
PPT
IBM Monitoring and Event Management Solutions
IBM Danmark
 
PDF
Sybase BAM Overview
Xu Jiang
 
PPT
SmartCloud Monitoring and Capacity Planning
IBM Danmark
 
PPTX
WSO2 Business Process Server 3.5.0 - Product Overview
WSO2
 
PPTX
Service Assurance Constructs for Achieving Network Transformation by Sunku Ra...
Liz Warner
 
PPTX
Service Assurance Constructs for Achieving Network Transformation - Sunku Ran...
Liz Warner
 
PPTX
Applications Performance Monitoring with Applications Manager part 1
ManageEngine, Zoho Corporation
 
PDF
SCOM 2007 & Audit Collection Services
OlivierMichot
 
PPTX
Event log analyzer by me
ER Swapnil Raut
 
PPTX
VAS - VMware CMP
Mohamed El Shorbagy ☁☁☁
 
PDF
Monitoring in Big Data Platform - Albert Lewandowski, GetInData
GetInData
 
PDF
Gain insights into your business operations with BPM Analytics
Allen Chan
 
PDF
Business Analytics System
Mahesh Patwardhan
 
PDF
WebSphere Technical University: Top WebSphere Problem Determination Features
Chris Bailey
 
PDF
Monitoring Your AWS EKS Environment with Datadog
DevOps.com
 
Observability for Integration Using WSO2 Enterprise Integrator
WSO2
 
Middleware monitoring with Applications Manager
ManageEngine, Zoho Corporation
 
Log insight 3.3 customer presentation
David Pasek
 
Hbb 2852 gain insights into your business operations with bpm and kibana
Allen Chan
 
Azure Monitoring Overview
gjuljo
 
IBM Monitoring and Event Management Solutions
IBM Danmark
 
Sybase BAM Overview
Xu Jiang
 
SmartCloud Monitoring and Capacity Planning
IBM Danmark
 
WSO2 Business Process Server 3.5.0 - Product Overview
WSO2
 
Service Assurance Constructs for Achieving Network Transformation by Sunku Ra...
Liz Warner
 
Service Assurance Constructs for Achieving Network Transformation - Sunku Ran...
Liz Warner
 
Applications Performance Monitoring with Applications Manager part 1
ManageEngine, Zoho Corporation
 
SCOM 2007 & Audit Collection Services
OlivierMichot
 
Event log analyzer by me
ER Swapnil Raut
 
Monitoring in Big Data Platform - Albert Lewandowski, GetInData
GetInData
 
Gain insights into your business operations with BPM Analytics
Allen Chan
 
Business Analytics System
Mahesh Patwardhan
 
WebSphere Technical University: Top WebSphere Problem Determination Features
Chris Bailey
 
Monitoring Your AWS EKS Environment with Datadog
DevOps.com
 

More from WSO2 (20)

PDF
Quantum Threats Are Closer Than You Think – Act Now to Stay Secure
WSO2
 
PDF
Modern Platform Engineering with Choreo - The AI-Native Internal Developer Pl...
WSO2
 
PDF
Application Modernization with Choreo - The AI-Native Internal Developer Plat...
WSO2
 
PDF
Build Smarter, Deliver Faster with Choreo - An AI Native Internal Developer P...
WSO2
 
PDF
Platformless Modernization with Choreo.pdf
WSO2
 
PDF
Application Modernization with Choreo for the BFSI Sector
WSO2
 
PDF
Choreo - The AI-Native Internal Developer Platform as a Service: Overview
WSO2
 
PDF
[Roundtable] Choreo - The AI-Native Internal Developer Platform as a Service
WSO2
 
PPTX
WSO2Con 2025 - Building AI Applications in the Enterprise (Part 1)
WSO2
 
PPTX
WSO2Con 2025 - Building Secure Business Customer and Partner Experience (B2B)...
WSO2
 
PPTX
WSO2Con 2025 - Building Secure Customer Experience Apps
WSO2
 
PPTX
WSO2Con 2025 - AI-Driven API Design, Development, and Consumption with Enhanc...
WSO2
 
PPTX
WSO2Con 2025 - AI-Driven API Design, Development, and Consumption with Enhanc...
WSO2
 
PPTX
WSO2Con 2025 - Unified Management of Ingress and Egress Across Multiple API G...
WSO2
 
PPTX
WSO2Con 2025 - How an Internal Developer Platform Lets Developers Focus on Code
WSO2
 
PPTX
WSO2Con 2025 - Architecting Cloud-Native Applications
WSO2
 
PDF
Mastering Intelligent Digital Experiences with Platformless Modernization
WSO2
 
PDF
Accelerate Enterprise Software Engineering with Platformless
WSO2
 
PDF
WSO2Con2024 - WSO2's IAM Vision: Identity-Led Digital Transformation
WSO2
 
PDF
architecting-ai-in-the-enterprise-apis-and-applications.pdf
WSO2
 
Quantum Threats Are Closer Than You Think – Act Now to Stay Secure
WSO2
 
Modern Platform Engineering with Choreo - The AI-Native Internal Developer Pl...
WSO2
 
Application Modernization with Choreo - The AI-Native Internal Developer Plat...
WSO2
 
Build Smarter, Deliver Faster with Choreo - An AI Native Internal Developer P...
WSO2
 
Platformless Modernization with Choreo.pdf
WSO2
 
Application Modernization with Choreo for the BFSI Sector
WSO2
 
Choreo - The AI-Native Internal Developer Platform as a Service: Overview
WSO2
 
[Roundtable] Choreo - The AI-Native Internal Developer Platform as a Service
WSO2
 
WSO2Con 2025 - Building AI Applications in the Enterprise (Part 1)
WSO2
 
WSO2Con 2025 - Building Secure Business Customer and Partner Experience (B2B)...
WSO2
 
WSO2Con 2025 - Building Secure Customer Experience Apps
WSO2
 
WSO2Con 2025 - AI-Driven API Design, Development, and Consumption with Enhanc...
WSO2
 
WSO2Con 2025 - AI-Driven API Design, Development, and Consumption with Enhanc...
WSO2
 
WSO2Con 2025 - Unified Management of Ingress and Egress Across Multiple API G...
WSO2
 
WSO2Con 2025 - How an Internal Developer Platform Lets Developers Focus on Code
WSO2
 
WSO2Con 2025 - Architecting Cloud-Native Applications
WSO2
 
Mastering Intelligent Digital Experiences with Platformless Modernization
WSO2
 
Accelerate Enterprise Software Engineering with Platformless
WSO2
 
WSO2Con2024 - WSO2's IAM Vision: Identity-Led Digital Transformation
WSO2
 
architecting-ai-in-the-enterprise-apis-and-applications.pdf
WSO2
 
Ad

Recently uploaded (20)

PPTX
"Autonomy of LLM Agents: Current State and Future Prospects", Oles` Petriv
Fwdays
 
PDF
Windsurf Meetup Ottawa 2025-07-12 - Planning Mode at Reliza.pdf
Pavel Shukhman
 
PDF
Achieving Consistent and Reliable AI Code Generation - Medusa AI
medusaaico
 
PPT
Interview paper part 3, It is based on Interview Prep
SoumyadeepGhosh39
 
PDF
Fl Studio 24.2.2 Build 4597 Crack for Windows Free Download 2025
faizk77g
 
PDF
CIFDAQ Weekly Market Wrap for 11th July 2025
CIFDAQ
 
PDF
"AI Transformation: Directions and Challenges", Pavlo Shaternik
Fwdays
 
PPTX
Building Search Using OpenSearch: Limitations and Workarounds
Sease
 
PDF
Newgen Beyond Frankenstein_Build vs Buy_Digital_version.pdf
darshakparmar
 
PDF
SFWelly Summer 25 Release Highlights July 2025
Anna Loughnan Colquhoun
 
PDF
Newgen 2022-Forrester Newgen TEI_13 05 2022-The-Total-Economic-Impact-Newgen-...
darshakparmar
 
PDF
Reverse Engineering of Security Products: Developing an Advanced Microsoft De...
nwbxhhcyjv
 
PDF
July Patch Tuesday
Ivanti
 
PDF
New from BookNet Canada for 2025: BNC BiblioShare - Tech Forum 2025
BookNet Canada
 
PDF
Using FME to Develop Self-Service CAD Applications for a Major UK Police Force
Safe Software
 
PDF
Python basic programing language for automation
DanialHabibi2
 
PDF
Bitcoin for Millennials podcast with Bram, Power Laws of Bitcoin
Stephen Perrenod
 
PDF
[Newgen] NewgenONE Marvin Brochure 1.pdf
darshakparmar
 
PDF
Blockchain Transactions Explained For Everyone
CIFDAQ
 
PDF
Jak MŚP w Europie Środkowo-Wschodniej odnajdują się w świecie AI
dominikamizerska1
 
"Autonomy of LLM Agents: Current State and Future Prospects", Oles` Petriv
Fwdays
 
Windsurf Meetup Ottawa 2025-07-12 - Planning Mode at Reliza.pdf
Pavel Shukhman
 
Achieving Consistent and Reliable AI Code Generation - Medusa AI
medusaaico
 
Interview paper part 3, It is based on Interview Prep
SoumyadeepGhosh39
 
Fl Studio 24.2.2 Build 4597 Crack for Windows Free Download 2025
faizk77g
 
CIFDAQ Weekly Market Wrap for 11th July 2025
CIFDAQ
 
"AI Transformation: Directions and Challenges", Pavlo Shaternik
Fwdays
 
Building Search Using OpenSearch: Limitations and Workarounds
Sease
 
Newgen Beyond Frankenstein_Build vs Buy_Digital_version.pdf
darshakparmar
 
SFWelly Summer 25 Release Highlights July 2025
Anna Loughnan Colquhoun
 
Newgen 2022-Forrester Newgen TEI_13 05 2022-The-Total-Economic-Impact-Newgen-...
darshakparmar
 
Reverse Engineering of Security Products: Developing an Advanced Microsoft De...
nwbxhhcyjv
 
July Patch Tuesday
Ivanti
 
New from BookNet Canada for 2025: BNC BiblioShare - Tech Forum 2025
BookNet Canada
 
Using FME to Develop Self-Service CAD Applications for a Major UK Police Force
Safe Software
 
Python basic programing language for automation
DanialHabibi2
 
Bitcoin for Millennials podcast with Bram, Power Laws of Bitcoin
Stephen Perrenod
 
[Newgen] NewgenONE Marvin Brochure 1.pdf
darshakparmar
 
Blockchain Transactions Explained For Everyone
CIFDAQ
 
Jak MŚP w Europie Środkowo-Wschodniej odnajdują się w świecie AI
dominikamizerska1
 
Ad

How to Create Observable Integration Solutions Using WSO2 Enterprise Integrator

  • 1. How to Create Observable Integration Solutions Using WSO2 Enterprise Integrator Chanika Geeganage and Lahiru Madushanka Integration Team 1
  • 2. Agenda • Introduction to observability in WSO2 Enterprise Integrator • Observability for integrations • Observability for business processes • Observability for messaging • Extending EI Analytics 2
  • 4. Importance of Observability • Observability is a measure of how well internal states of a system can be inferred from knowledge of its external outputs. • Observability helps in – Decision making and building incident preparedness – Identifying constrained resources and forecasting growth – Helping reduce the cycle of fire fighting within teams 4
  • 5. Introduction to Observability in WSO2 EI • Events • Logs • Tracing • Java Management Extensions (JMX) 5 Business / Operational Insight 5 Applications Services and systems Improvements / Modifications Existing Services Identify erroneous incidents Monitoring requests count Trace messages WSO2 Enterprise Integrator Monitor Infrastructure utilization
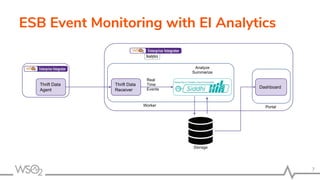
  • 7. ESB Event Monitoring with EI Analytics 7 Thrift Data Agent Thrift Data Receiver Real Time Events Dashboard Storage Analyze Summarize Worker Portal
  • 8. Aggregations over long time periods • Incremental aggregation for – every second, minute, hour, … , year • Support for out of order event arrival • Fast data retrieval from memory and disk 8 Current Min Current Hour Sec Min Hour 0 - 1 - 5 ... - 1 - 2 - 3 - 4 - 64 - 65 ... - 2 - 124
  • 9. Prerequisites for EI Analytics • To enable mediation statistics and message tracing, <EI_HOME>/conf/synapse.properties 9 Property Name Description mediation.flow.statistics.enable Enables statistics for the selected ESB artifact(s). mediation.flow.statistics.tracer.collect.payloads Enables tracing for the selected ESB artifact(s) and records message payloads. mediation.flow.statistics.tracer.collect.properties Enables tracing for the selected ESB artifact(s) and records message context (transport) properties. mediation.flow.statistics.collect.all Enables mediation statistics for all the artifacts in the ESB profile by default.
  • 10. Prerequisites for EI Analytics cont. • To publish data from the ESB profile to EI analytics profile, <EI_HOME>/repository/deployment/server/eventpublishers/MessageFlowConfigurationPublisher.xml <EI_HOME>/repository/deployment/server/eventpublishers/MessageFlowStatisticsPublisher.xml 10 Property Name Description username The username to be used when accessing the WSO2 EI Analytics server to publish configurations. password The password to be used when accessing the WSO2 EI Analytics server to publish configurations. receiver URL The URL of the thrift port to which the EI configurations should be published. The format of the URL is as follows. tcp://<localhost>:<THRIFT_PORT>
  • 11. Enabling Statistics/Tracing for Individual Artifacts 11
  • 12. Real-time Analytics • Process events as and when received • Default Siddhi App consists of Siddhi queries, input, and output streams 12 -- if DecompressedEventStream's componentType is ProxyService or API or InboundEndPoint, add it into PreProcessedESBStatStream from DecompressedEventStream[componentType == "proxy service" or componentType == "api" or componentType == "inbound endpoint"] select componentId, componentName, componentType, duration, ifThenElse(faultCount > 0, 1, 0) as faultCount, startTime, entryPoint, metaTenantId insert current events into PreProcessedESBStatStream;
  • 13. Monitoring ESB Profile with Analytics Dashboard • ESB profile statistics overview • Statistics for proxy services • Statistics for sequences • Statistics for REST APIs • Statistics for endpoints and inbound endpoints • Statistics for mediators and messages 13
  • 15. Data Purging • By default enabled in Siddhi App • Defined using @purge @store(type = 'rdbms', datasource = 'EI_ANALYTICS') @info(name = 'MediatorStat') @purge(enable='true', interval='60 min', @retentionPeriod(sec='1 day', min='72 hours', hours='90 days', days='1 year', months='2 years', years='3 years')) define aggregation MediatorStatAgg from PreProcessedMediatorStatStream select metaTenantId, entryPoint, entryPointHashcode, componentId, hashCode, componentName, componentType, sum(duration) as totalDuration ,avg(duration) as avgDuration, min(duration) as minDuration, max(duration) as maxDuration, count() as noOfInvocation, sum(faultCount) as faultCount, startTime group by metaTenantId, componentId, componentName, componentType, entryPoint, entryPointHashcode, hashCode aggregate by startTime every sec...years;
  • 17. Monitor via BPMN-Explorer • Historical information of process instances
  • 18. Monitor via BPMN-Explorer Cont. • Supports advanced filtering 18
  • 19. Generate Reports via BPMN-Explorer • Process Instance Count • Average Time Duration Of Completed Processes • Task Durations Of Completed Process • User Vs Number Of Tasks Completed • User Vs Average Time Taken to Complete Tasks • Task Instance Count Variation Over Time • Process Instance Count Variation Over Time • User Performance Of Tasks Instances Over Time
  • 20. Generate Reports via BPMN-Explorer Cont.
  • 22. Broker-Specific MBeans • JMX monitoring on following MBeans using JConsole or other third party monitoring tool. (AppDynamics) 22 Property Name Description ClusterManagementInformation MBean Cluster specific attributes. MessageStatusInformation MBean Retrieve the lifecycle status of the messages in the store to a specific Excel sheet. QueueManageInformation MBean Queue specific attributes and operations. SubscriptionManageInformation MBean Subscription specific operations.
  • 23. Message Metrics 23 Messaging Metrics Views ● Disruptor ● Publish and Subscribe ● Messages and acknowledgements ● Database
  • 24. JVM Metrics 24 JVM Metrics Views ● CPU ● Memory ● Threading ● Class Loading ● File Descriptor
  • 26. JMX Monitoring • WSO2 Enterprise Integrator exposes a number of management resources as JMX MBeans which helps to monitor the running server. • To monitor statistics relating to artifacts that are deployed in the EI server Mediation Flow Statistics View Mbean can be used. 26
  • 28. Customize Statistics Publishing • A custom statistics observer can be created by implementing org.wso2.carbon.das.messageflow.data.publisher.observer.MessageFlowObserver interface. 28 public class MyStatisticsObserver implements MessageFlowObserver { //Invoked when this observer is notified public void updateStatistics(PublishingFlow publishingFlow) { //Process data } } <MediationFlowStatisticConfig> <Observers> org.wso2.custom.MyStatisticsObserver </Observers> </MediationFlowStatisticConfig> ● Add all custom observers as a comma separated list in the <EI_HOME>/conf/carbon.xml.
  • 29. EI logs Monitoring with Elastic Stack • Setting up Filebeat to read log files from EI. • Update filebeat-yaml with the path to EI logs folder. • Setting up Logstash to take the log lines from Filebeat, convert them to JSON strings, and ship them to Elasticsearch. • Setting up Elasticsearch to store and search logs. • Setting up Kibana to monitor EI. 29
  • 30. ESB Statistic Monitoring with ElasticStack • Custom message flow observer implemented to publish EI statistics to ElasticStatisticPublisher. 30
  • 33. EI Performance Monitoring with AppDynamics • Configuring App Agent and WSO2 Enterprise Integrator Edit the integrator.sh in the EI-Installation/bin by inserting the line- -javaagent:"/path-to-app-agent-directory/javaagent.jar" 33
  • 34. EI Performance monitoring with AppDynamics cont.. 34