Human-centered AI: towards the next generation
of interactive and adaptive explanation methods
IHM 2022 – 8 April 2022
Katrien Verbert
Augment/HCI – Department of Computer Science - KU Leuven
@katrien_v
Human-Computer Interaction group
Explainable AI - recommender systems – visualization – intelligent user interfaces
Learning analytics &
human resources
Media
consumption
Precision agriculture
Healthcare
Augment Katrien Verbert
ARIA Adalberto Simeone
Computer
Graphics
Phil Dutré
LIIR Sien Moens
E-media
Vero Vanden Abeele
Luc Geurts
Kathrin Gerling
Augment/HCI team
Robin De Croon
Postdoc researcher
Katrien Verbert
Associate Professor
Francisco Gutiérrez
Postdoc researcher
Tom Broos
PhD researcher
Nyi Nyi Htun
Postdoc researcher
Houda Lamqaddam
PhD researcher
Oscar Alvarado
Postdoc researcher
https://augment.cs.kuleuven.be/
Diego Rojo Carcia
PhD researcher
Maxwell Szymanski
PhD researcher
Arno Vanneste
PhD researcher
Jeroen Ooge
PhD researcher
Aditya Bhattacharya
PhD researcher
Ivania Donoso Guzmán
PhD researcher
Explainable Artificial Intelligence (XAI)
“Given an audience, an explainable artificial
intelligence is one that produces details or reasons
to make its functioning clear or easy to understand.”
[Arr20]
4
[Arr20] Arrieta, A. B., Díaz-Rodríguez, N., Del Ser, J., Bennetot, A., Tabik, S., Barbado, A., ... & Herrera, F. (2020). Explainable Artificial
Intelligence (XAI): Concepts, taxonomies, opportunities and challenges toward responsible AI. Information fusion, 58, 82-115.
q Explaining model outcomes to increase user trust and acceptance
q Enable users to interact with the explanation process to improve the model
Research objectives
Models
6
Collaborative filtering – Content-based filtering
Knowledge-based filtering - Hybrid
Recommendation techniques
Example: TasteWeights
8
Bostandjiev,
S.,
O'Donovan,
J.
and
Höllerer,
T.
TasteWeights:
a
visual
interactive
hybrid
recommender
system.
In
Proceedings
of
the
sixth
ACM
conference
on
Recommender
systems
(RecSys
'12).
ACM,
New
York,
NY,
USA
(2012),
35-42.
Prediction models
9
Overview
10
Application domains
Algoritmic foundation
Overview
11
Application domains
Algoritmic foundation
Explanations
12
Millecamp, M., Htun, N. N., Conati, C., & Verbert, K. (2019, March). To explain or not to explain:
the effects of personal characteristics when explaining music recommendations. In
Proceedings of the 2019 Conference on Intelligent User Interface (pp. 397-407). ACM.
Personal characteristics
Need for cognition
•Measurement of the tendency for an individual to engage in, and enjoy, effortful cognitive
activities
•Measured by test of Cacioppo et al. [1984]
Visualisation literacy
•Measurement of the ability to interpret and make meaning from information presented in the form
of images and graphs
•Measured by test of Boy et al. [2014]
Locus of control (LOC)
•Measurement of the extent to which people believe they have power over events in their lives
•Measured by test of Rotter et al. [1966]
Visual working memory
•Measurement of the ability to recall visual patterns [Tintarev and Mastoff, 2016]
•Measured by Corsi block-tapping test
Musical experience
•Measurement of the ability to engage with music in a flexible, effective and nuanced way
[Müllensiefen et al., 2014]
•Measured using the Goldsmiths Musical Sophistication Index (Gold-MSI)
Tech savviness
•Measured by confidence in trying out new technology 13
User study
¤ Within-subjects design: 105 participants recruited with Amazon Mechanical Turk
¤ Baseline version (without explanations) compared with explanation interface
¤ Pre-study questionnaire for all personal characteristics
¤ Task: Based on a chosen scenario for creating a play-list, explore songs and
rate all songs in the final playlist
¤ Post-study questionnaire:
¤ Recommender effectiveness
¤ Trust
¤ Good understanding
¤ Use intentions
¤ Novelty
¤ Satisfaction
¤ Confidence
Results
15
The interaction effect between NFC (divided into
4 quartiles Q1-Q4) and interfaces in terms of confidence
Design implications
¤ Explanations should be personalised for different groups of
end-users.
¤ Users should be able to choose whether or not they want to
see explanations.
¤ Explanation components should be flexible enough to present
varying levels of details depending on a user’s preference.
16
User control
Users tend to be more satisfied when they have control over
how recommender systems produce suggestions for them
Control recommendations
Douban FM
Control user profile
Spotify
Control algorithm parameters
TasteWeights
Controllability Cognitive load
Additional controls may increase cognitive load
(Andjelkovic et al. 2016)
Ivana Andjelkovic, Denis Parra, andJohn O’Donovan. 2016. Moodplay: Interactive mood-based
music discovery and recommendation. In Proc. of UMAP’16. ACM, 275–279.
Different levels of user control
19
Level
Recommender
components
Controls
low
Recommendations
(REC)
Rating, removing, and
sorting
medium User profile (PRO)
Select which user profile
data will be considered by
the recommender
high
Algorithm parameters
(PAR)
Modify the weight of
different parameters
Jin, Y., Tintarev, N., & Verbert, K. (2018, September). Effects of personal characteristics on music
recommender systems with different levels of controllability. In Proceedings of the 12th ACM Conference
on Recommender Systems (pp. 13-21). ACM.
User profile (PRO) Algorithm parameters (PAR) Recommendations (REC)
8 control settings
No control
REC
PAR
PRO
REC*PRO
REC*PAR
PRO*PAR
REC*PRO*PAR
Evaluation method
¤ Between-subjects – 240 participants recruited with AMT
¤ Independent variable: settings of user control
¤ 2x2x2 factorial design
¤ Dependent variables:
¤ Acceptance (ratings)
¤ Cognitive load (NASA-TLX), Musical Sophistication, Visual Memory
¤ Framework Knijnenburg et al. [2012]
Results
¤ Main effects: from REC to PRO to PAR → higher cognitive
load
¤ Two-way interaction: does not necessarily result in higher
cognitive load. Adding an additional control component
to PAR increases the acceptance. PRO*PAR has less
cognitive load than PRO and PAR
¤ High musical sophistication leads to higher quality, and
thereby result in higher acceptance
22
Jin, Y., Tintarev, N., & Verbert, K. (2018, September). Effects of personal characteristics on music
recommender systems with different levels of controllability. In Proceedings of the 12th ACM
Conference on Recommender Systems (pp. 13-21). ACM.
Overview
23
Application domains
Algoritmic foundation
Learning analytics
Src: Steve Schoettler
Explaining exercise recommendations
How to automatically
adapt the exercise
recommending on Wiski to
the level of students?
How do (placebo)
explanations affect initial
trust in Wiski for
recommending exercises?
Goals and research questions
Automatic
adaptation
Explanations & trust
Young target
audience
Middle and high school
students
Ooge, J., Kato, S., Verbert, K. (2022) Explaining Recommendations in E-Learning: Effects on
Adolescents' Initial Trust. Proceedings of the 27th IUI conference on Intelligent User Interfaces
User-centred design of explanations: 3
iterations & think-alouds
Tutorial for full transparency Single-screen explanation Final explanation interface
Why?
Justification
Comparison
with others
Real
explanation
Placebo
explanation
No
explanation
Results: Real explanations…
… did increase multidimensional initial trust
… did not increase one-dimensional initial trust
… led to accepting more recommended exercises
compared to both placebo and no explanations
Results: No explanations
Can be acceptable in low-stakes situations (e.g.,
drilling exercises):
indications of difficulty level might suffice
Personal level
indication: Easy,
Medium and Hard tags
Learning analytics
Src: Steve Schoettler
32
uncertainty
Gutiérrez Hernández F., Seipp K., Ochoa X., Chiluiza K., De Laet T., Verbert K. (2018). LADA: A
learning analytics dashboard for academic advising. Computers in Human Behavior, pp 1-13. doi:
10.1016/j.chb.2018.12.004
LADA: a learning analytics dashboard
for study advisors
Evaluation method
33
Evaluation @KU Leuven Monitoraat
N = 12
6 Experts (4F, 2M)
6 Laymen (1F, 5M)
Evaluation @ESPOL (Ecuador)
N = 14
8 Experts (3F, 5M)
6 Laymen (6M)
Results
¤ LADA was perceived as a valuable tool for more
accurate and efficient decision making.
¤ LADA enables expert advisers to evaluate significantly
more scenarios.
¤ More transparency in the prediction model is required in
order to increase trust.
34
Gutiérrez Hernández F., Seipp K., Ochoa X., Chiluiza K., De Laet T., Verbert K. (2018). LADA: A
learning analytics dashboard for academic advising. Computers in Human Behavior, pp 1-13. doi:
10.1016/j.chb.2018.12.004
Overview
35
Application domains
Algoritmic foundation
Precision agriculture
36
AHMoSe
Rojo, D., Htun, N. N., Parra, D., De Croon, R., & Verbert, K. (2021). AHMoSe: A knowledge-based visual
support system for selecting regression machine learning models. Computers and Electronics in
Agriculture, 187, 106183.
AHMoSe Visual Encodings
38
Model Explanations
(SHAP)
Model + Knowledge Summary
Case Study – Grape Quality Prediction
39
¤ Grape Quality Prediction Scenario
[Tag14]
¤ Data
¤ Years 2010, 2011 (train) 2012 (test)
¤ 48 cells (Central Greece)
¤ Knowledge-based rules
[Tag14] Tagarakis, A., et al. "A fuzzy inference system to model grape
quality in vineyards." Precision Agriculture 15.5 (2014): 555-578. Source: [Tag14]
Simulation Study
¤ AHMoSe vs full AutoML approach to support model
selection.
40
RMSE (AutoML) RMSE (AHMoSe) Difference %
Scenario A
Complete
Knowledge
0.430 0.403 ▼ 6.3%
Scenario B
Incomplete
Knowledge
0.458 0.385 ▼ 16.0%
Qualitative Evaluation
¤ 10 open ended questions
¤ 5 viticulture experts and 4 ML experts.
¤ Thematic Analysis: potential use cases, trust, usability,
and understandability.
Qualitative Evaluation - Trust
42
¤ Showing the dis/agreement of model outputs with
expert’s knowledge can promote trust.
“The thing that makes us trust the models is the fact that most of the
time, there is a good agreement between the values predicted by the
model and the ones obtained for the knowledge of the experts.”
– Viticulture Expert
Overview
43
Application domains
Algoritmic foundation
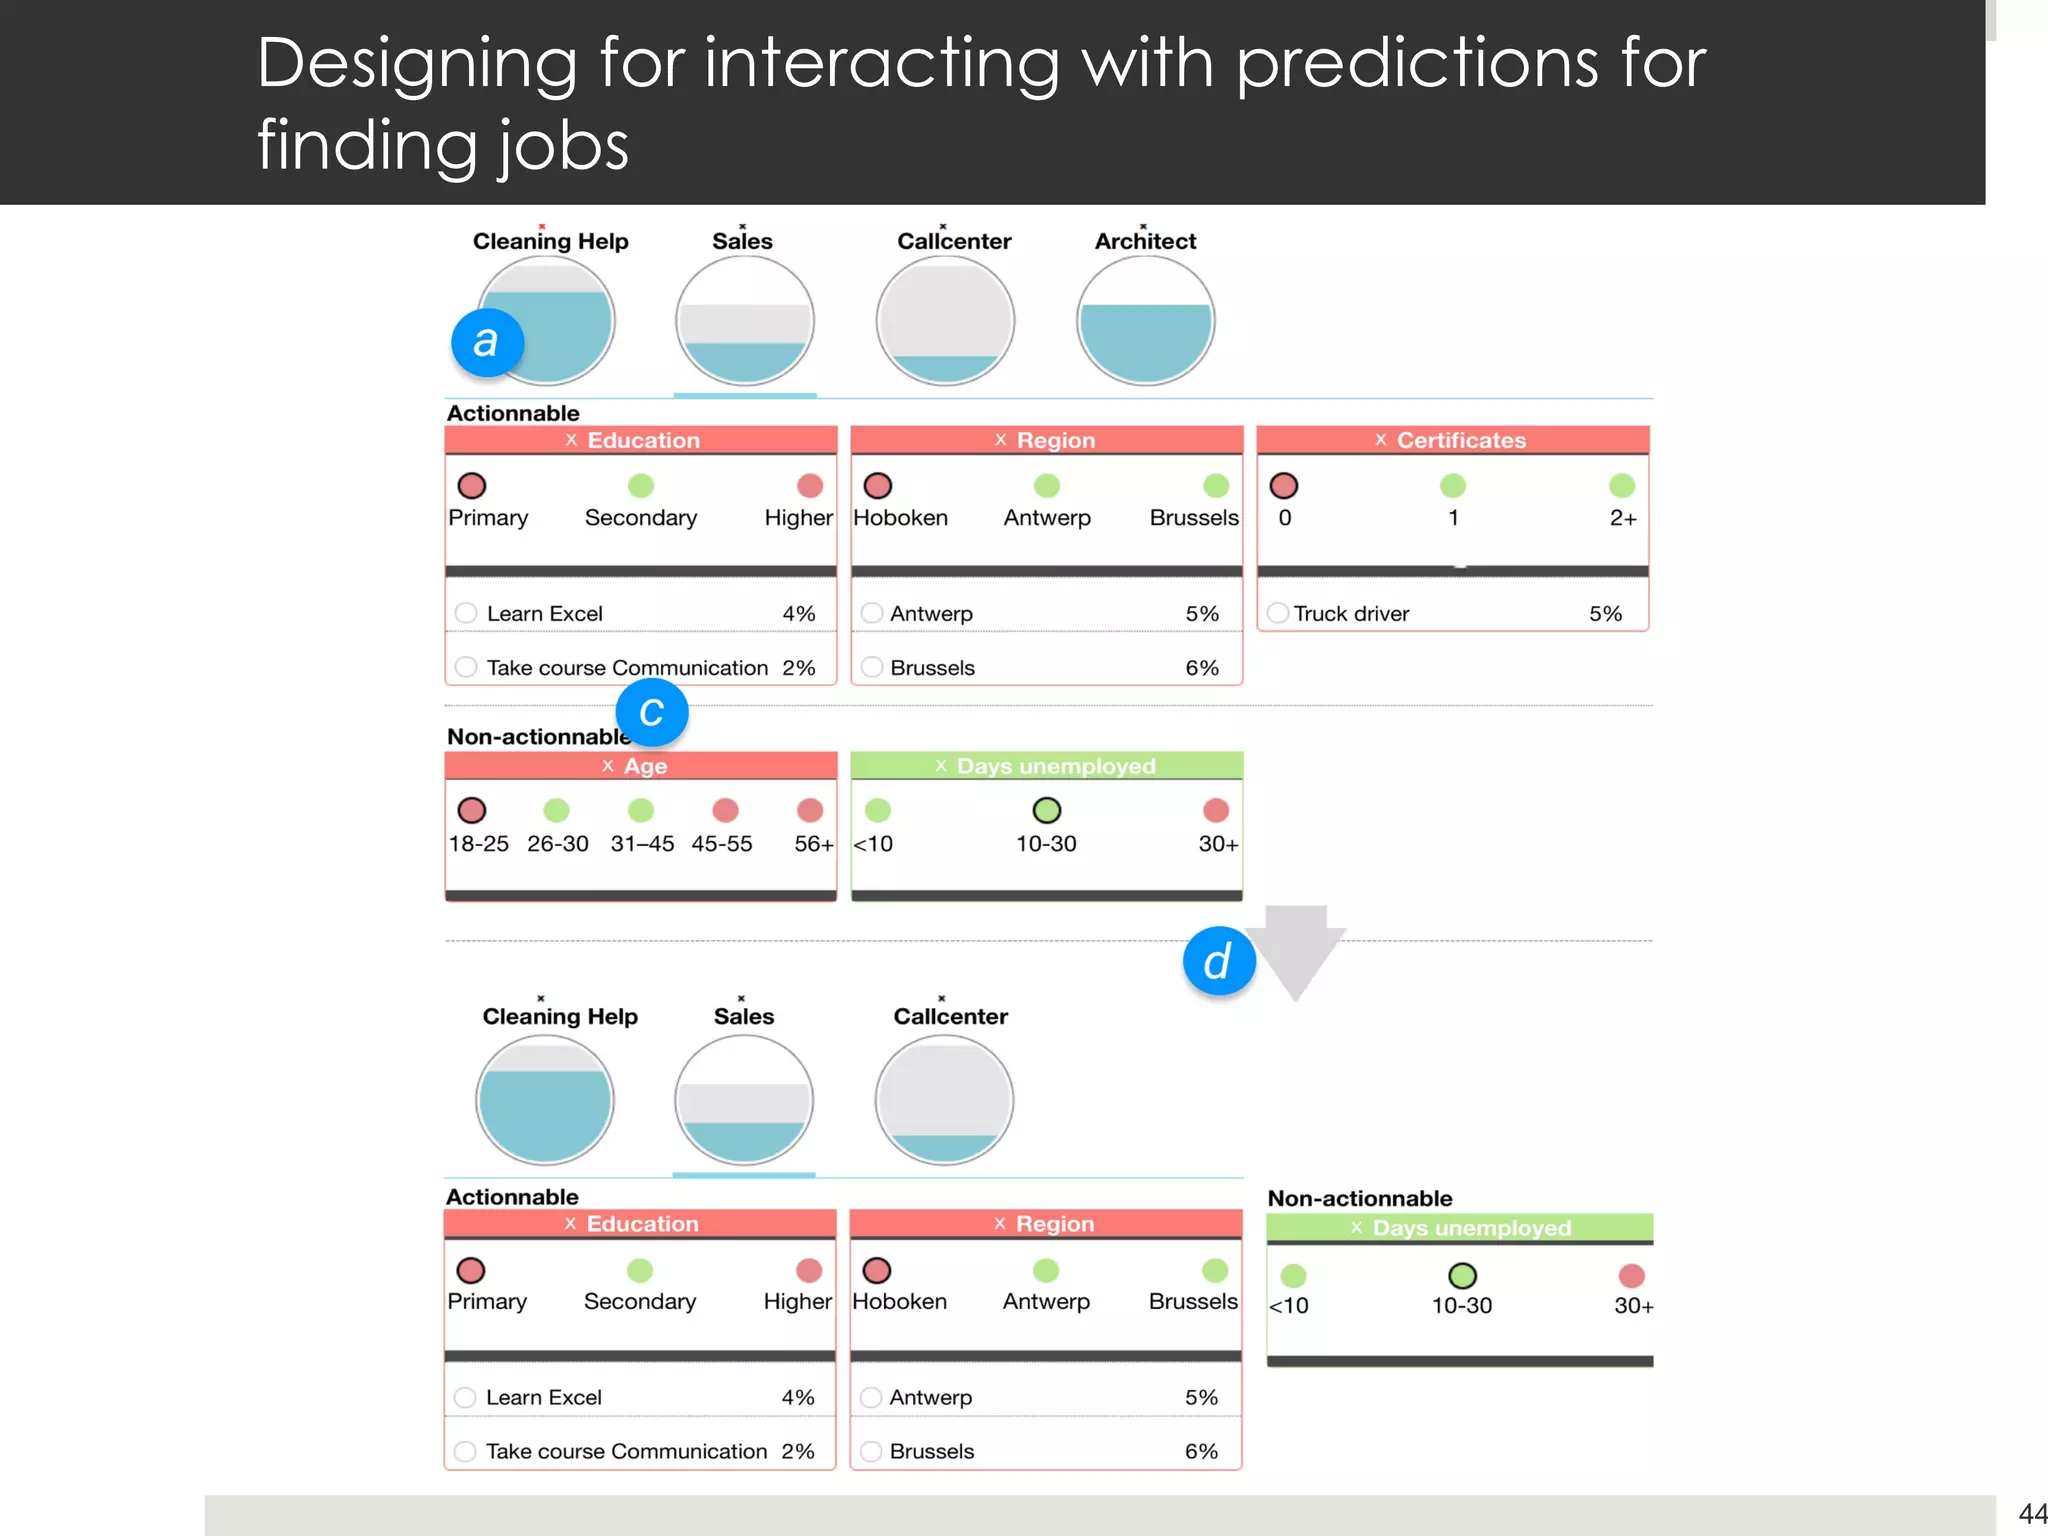
Designing for interacting with predictions for
finding jobs
44
Predicting duration to find a job
45
Key Issues: Missing data, prediction trust issues, job
seeker motivation, lack of control.
Methods
¤ A Customer Journey approach. (5 mediators).
¤ Hands-on time with the original dashboard (22 mediators).
¤ Observations of mediation sessions. (3 mediators, 6 job seekers).
¤ Questionnaire regarding perception of the dashboard and
prediction model (15 Mediators).
46
Charleer S., Gutiérrez Hernández F., Verbert K. (2018). Supporting job mediator and job seeker
through an actionable dashboard. In: Proceedings of the 24th IUI conference on Intelligent User
Interfaces Presented at the ACM IUI 2019, Los Angeles, USA.
47
Take away messages
¤ Key difference between actionable and non-actionable
parameters
¤ Need for customization and contextualization.
¤ The human expert plays a crucial role when interpreting
and relaying in the predicted or recommended output.
48
Charleer S., Gutiérrez Hernández F., Verbert K. (2019). Supporting job mediator and job
seeker through an actionable dashboard. In: Proceedings of the 24th IUI conference on
Intelligent User Interfaces Presented at the ACM IUI 2019, Los Angeles, USA. (Core: A)
Overview
49
Application domains
Algoritmic foundation
50
Healthcare
51
Ooge, J., Stiglic, G., & Verbert, K. (2021). Explaining artificial intelligence with
visual analytics in healthcare. Wiley Interdisciplinary Reviews: Data Mining
and Knowledge Discovery, e1427. https://doi.org/10.1002/widm.1427
https://www.jmir.org/2021/6/e18035
Nutrition
Nutrition advice (7)
Diets (7)
Recipes (7)
Menus (2)
Fruit (1)
Restaurants (1)
Doctors (4)
Hospital (5)
Thread / fora (3)
Self-Diagnosis (3)
Healthcare information (5)
Similar users (2)
Advise for children (2)
General
health
information
Routes (2)
Physical activity (10)
Leisure activity (2)
Wellbeing motivation (2)
Behaviour (7)
Wearable devices (1)
Tailored messages (2)
Routes (2)
Physical activity (10)
Leisure activity (2)
Behaviour (7)
Lifestyle
Specific
health
conditions
Health
Recommender
Systems
Recommender systems for food
53
54
https://augment.cs.kuleuven.be/demos
Design and evaluation
55
Gutiérrez F., Cardoso B., Verbert K. (2017). PHARA: a personal health augmented reality assistant to
support decision-making at grocery stores. In: Proceedings of the International Workshop on Health
Recommender Systems co-located with ACM RecSys 2017 (Paper No. 4) (10-13).
Results
¤ PHARA allows users to make informed decisions, and
resulted in selecting healthier food products.
¤ Stack layout performs better with HMD devices with a
limited field of view, like the HoloLens, at the cost of some
affordances.
¤ The grid and pie layouts performed better in handheld
devices, allowing to explore with more confidence,
enjoyability and less effort.
56
Gutiérrez Hernández F., Htun NN., Charleer S., De Croon R., Verbert K. (2018). Designing
augmented reality applications for personal health decision-making. In: Proceedings of the 2019
52nd Hawaii International Conference on System Sciences Presented at the HICSS, Hawaii, 07
Jan 2019-11 Jan 2019.
Biofortification info
Plants to cultivate
Ongoing work: PERNUG
¤ Increased access to more nutritious plants
¤ Improved iron and B12 intakes for vegan and vegetarian
subgroups
Consumer app with recipe
recommendations
Hydroponic system with
biofortified plants
https://www.eitfood.eu/projects/pernug
Ongoing work: PERSFO
59
https://www.imec-int.com/en/what-we-offer/research-portfolio/discrete
RECOMMENDER
ALGORITHMS
MACHINE
LEARNING
INTERACTIVE DASHBOARDS
SMART ALERTS
RICH CARE PLANS
OPEN IoT
ARCHITECTURE
User centered design approach
61
62
Gutiérrez Hernández, F.S., Htun, N.N., Vanden Abeele, V., De Croon, R., Verbert, K.
(2022). Explaining call recommendations in nursing homes: a user-centered design
approach for interacting with knowledge-based health decision support systems.
Proceedings of IUI 2022.
Evaluation
¤ 12 nurses used the app for three months
¤ Data collection
¤ Interaction logs
¤ Resque questions
¤ Semi-structured interviews
63
¤ 12 nurses during 3 months
64
Results
¤ Iterative design process identified several important features, such as the pending
list, overview and the feedback shortcut to encourage feedback.
¤ Explanations seem to contribute well to better support the healthcare
professionals.
¤ Results indicate a better understanding of the call notifications by being able to
see the reasons of the calls.
¤ More trust in the recommendations and increased perceptions of transparency
and control
¤ Interaction patterns indicate that users engaged well with the interface, although
some users did not use all features to interact with the system.
¤ Need for further simplification and personalization.
65
66
Motivation
Context
60% of Belgian employees has
pain complaints
33% of extended sick leave is
due to pain complaints
Solution
67
Explaining health
recommendations
¤ 6 different explanation designs
¤ Explain WHY users are given a
certain recommendation for
their (chronic) pain based on
their inputs
68
Maxwell Szymanski, Vero Vanden Abeele and Katrien Verbert Explaining
health recommendations to lay users: The dos and don’ts – Apex-IUI 2022
6 different designs
69
text inline reply tags
70
Word cloud Feature importance Feature importance+ %
6 different designs
User study
71
Results
Feature Importance Bars (+%) favoured by most users
72
Keywords / themes as to why users
(dis)like the explanation type
73
Results
“Insight vs. information overload”
¤ Most users prefer more information (holistic overview of inputs)
¤ However, some users experienced information overload
→ Future work - Do personal characteristics such as NFC
influence this?
74
Next steps: health dashboard
75
76
77
Petal-X
¤ Explaining cardiovascular disease (CVD) risk predictions
to patients.
Take-away messages
¤ Involvement of end-users has been key to come up with
interfaces tailored to the needs of non-expert users
¤ Actionable vs non-actionable parameters
¤ Domain expertise of users and need for cognition
important personal characteristics
¤ Need for personalisation and simplification
79
Peter Brusliovsky Nava Tintarev Cristina Conati
Denis Parra
Collaborations
Jurgen Ziegler
Gregor Stiglic
Questions?
katrien.verbert@cs.kuleuven.be
@katrien_v
Thank you!
https://augment.cs.kuleuven.be/

Human-centered AI: towards the next generation of interactive and adaptive explanation methods

  • 1.
    Human-centered AI: towardsthe next generation of interactive and adaptive explanation methods IHM 2022 – 8 April 2022 Katrien Verbert Augment/HCI – Department of Computer Science - KU Leuven @katrien_v
  • 2.
    Human-Computer Interaction group ExplainableAI - recommender systems – visualization – intelligent user interfaces Learning analytics & human resources Media consumption Precision agriculture Healthcare Augment Katrien Verbert ARIA Adalberto Simeone Computer Graphics Phil Dutré LIIR Sien Moens E-media Vero Vanden Abeele Luc Geurts Kathrin Gerling
  • 3.
    Augment/HCI team Robin DeCroon Postdoc researcher Katrien Verbert Associate Professor Francisco Gutiérrez Postdoc researcher Tom Broos PhD researcher Nyi Nyi Htun Postdoc researcher Houda Lamqaddam PhD researcher Oscar Alvarado Postdoc researcher https://augment.cs.kuleuven.be/ Diego Rojo Carcia PhD researcher Maxwell Szymanski PhD researcher Arno Vanneste PhD researcher Jeroen Ooge PhD researcher Aditya Bhattacharya PhD researcher Ivania Donoso Guzmán PhD researcher
  • 4.
    Explainable Artificial Intelligence(XAI) “Given an audience, an explainable artificial intelligence is one that produces details or reasons to make its functioning clear or easy to understand.” [Arr20] 4 [Arr20] Arrieta, A. B., Díaz-Rodríguez, N., Del Ser, J., Bennetot, A., Tabik, S., Barbado, A., ... & Herrera, F. (2020). Explainable Artificial Intelligence (XAI): Concepts, taxonomies, opportunities and challenges toward responsible AI. Information fusion, 58, 82-115.
  • 5.
    q Explaining modeloutcomes to increase user trust and acceptance q Enable users to interact with the explanation process to improve the model Research objectives Models
  • 6.
  • 7.
    Collaborative filtering –Content-based filtering Knowledge-based filtering - Hybrid Recommendation techniques
  • 8.
  • 9.
  • 10.
  • 11.
  • 12.
    Explanations 12 Millecamp, M., Htun,N. N., Conati, C., & Verbert, K. (2019, March). To explain or not to explain: the effects of personal characteristics when explaining music recommendations. In Proceedings of the 2019 Conference on Intelligent User Interface (pp. 397-407). ACM.
  • 13.
    Personal characteristics Need forcognition •Measurement of the tendency for an individual to engage in, and enjoy, effortful cognitive activities •Measured by test of Cacioppo et al. [1984] Visualisation literacy •Measurement of the ability to interpret and make meaning from information presented in the form of images and graphs •Measured by test of Boy et al. [2014] Locus of control (LOC) •Measurement of the extent to which people believe they have power over events in their lives •Measured by test of Rotter et al. [1966] Visual working memory •Measurement of the ability to recall visual patterns [Tintarev and Mastoff, 2016] •Measured by Corsi block-tapping test Musical experience •Measurement of the ability to engage with music in a flexible, effective and nuanced way [Müllensiefen et al., 2014] •Measured using the Goldsmiths Musical Sophistication Index (Gold-MSI) Tech savviness •Measured by confidence in trying out new technology 13
  • 14.
    User study ¤ Within-subjectsdesign: 105 participants recruited with Amazon Mechanical Turk ¤ Baseline version (without explanations) compared with explanation interface ¤ Pre-study questionnaire for all personal characteristics ¤ Task: Based on a chosen scenario for creating a play-list, explore songs and rate all songs in the final playlist ¤ Post-study questionnaire: ¤ Recommender effectiveness ¤ Trust ¤ Good understanding ¤ Use intentions ¤ Novelty ¤ Satisfaction ¤ Confidence
  • 15.
    Results 15 The interaction effectbetween NFC (divided into 4 quartiles Q1-Q4) and interfaces in terms of confidence
  • 16.
    Design implications ¤ Explanationsshould be personalised for different groups of end-users. ¤ Users should be able to choose whether or not they want to see explanations. ¤ Explanation components should be flexible enough to present varying levels of details depending on a user’s preference. 16
  • 17.
    User control Users tendto be more satisfied when they have control over how recommender systems produce suggestions for them Control recommendations Douban FM Control user profile Spotify Control algorithm parameters TasteWeights
  • 18.
    Controllability Cognitive load Additionalcontrols may increase cognitive load (Andjelkovic et al. 2016) Ivana Andjelkovic, Denis Parra, andJohn O’Donovan. 2016. Moodplay: Interactive mood-based music discovery and recommendation. In Proc. of UMAP’16. ACM, 275–279.
  • 19.
    Different levels ofuser control 19 Level Recommender components Controls low Recommendations (REC) Rating, removing, and sorting medium User profile (PRO) Select which user profile data will be considered by the recommender high Algorithm parameters (PAR) Modify the weight of different parameters Jin, Y., Tintarev, N., & Verbert, K. (2018, September). Effects of personal characteristics on music recommender systems with different levels of controllability. In Proceedings of the 12th ACM Conference on Recommender Systems (pp. 13-21). ACM.
  • 20.
    User profile (PRO)Algorithm parameters (PAR) Recommendations (REC) 8 control settings No control REC PAR PRO REC*PRO REC*PAR PRO*PAR REC*PRO*PAR
  • 21.
    Evaluation method ¤ Between-subjects– 240 participants recruited with AMT ¤ Independent variable: settings of user control ¤ 2x2x2 factorial design ¤ Dependent variables: ¤ Acceptance (ratings) ¤ Cognitive load (NASA-TLX), Musical Sophistication, Visual Memory ¤ Framework Knijnenburg et al. [2012]
  • 22.
    Results ¤ Main effects:from REC to PRO to PAR → higher cognitive load ¤ Two-way interaction: does not necessarily result in higher cognitive load. Adding an additional control component to PAR increases the acceptance. PRO*PAR has less cognitive load than PRO and PAR ¤ High musical sophistication leads to higher quality, and thereby result in higher acceptance 22 Jin, Y., Tintarev, N., & Verbert, K. (2018, September). Effects of personal characteristics on music recommender systems with different levels of controllability. In Proceedings of the 12th ACM Conference on Recommender Systems (pp. 13-21). ACM.
  • 23.
  • 24.
  • 26.
    Explaining exercise recommendations Howto automatically adapt the exercise recommending on Wiski to the level of students? How do (placebo) explanations affect initial trust in Wiski for recommending exercises? Goals and research questions Automatic adaptation Explanations & trust Young target audience Middle and high school students Ooge, J., Kato, S., Verbert, K. (2022) Explaining Recommendations in E-Learning: Effects on Adolescents' Initial Trust. Proceedings of the 27th IUI conference on Intelligent User Interfaces
  • 27.
    User-centred design ofexplanations: 3 iterations & think-alouds Tutorial for full transparency Single-screen explanation Final explanation interface
  • 28.
  • 29.
    Results: Real explanations… …did increase multidimensional initial trust … did not increase one-dimensional initial trust … led to accepting more recommended exercises compared to both placebo and no explanations
  • 30.
    Results: No explanations Canbe acceptable in low-stakes situations (e.g., drilling exercises): indications of difficulty level might suffice Personal level indication: Easy, Medium and Hard tags
  • 31.
  • 32.
    32 uncertainty Gutiérrez Hernández F.,Seipp K., Ochoa X., Chiluiza K., De Laet T., Verbert K. (2018). LADA: A learning analytics dashboard for academic advising. Computers in Human Behavior, pp 1-13. doi: 10.1016/j.chb.2018.12.004 LADA: a learning analytics dashboard for study advisors
  • 33.
    Evaluation method 33 Evaluation @KULeuven Monitoraat N = 12 6 Experts (4F, 2M) 6 Laymen (1F, 5M) Evaluation @ESPOL (Ecuador) N = 14 8 Experts (3F, 5M) 6 Laymen (6M)
  • 34.
    Results ¤ LADA wasperceived as a valuable tool for more accurate and efficient decision making. ¤ LADA enables expert advisers to evaluate significantly more scenarios. ¤ More transparency in the prediction model is required in order to increase trust. 34 Gutiérrez Hernández F., Seipp K., Ochoa X., Chiluiza K., De Laet T., Verbert K. (2018). LADA: A learning analytics dashboard for academic advising. Computers in Human Behavior, pp 1-13. doi: 10.1016/j.chb.2018.12.004
  • 35.
  • 36.
  • 37.
    AHMoSe Rojo, D., Htun,N. N., Parra, D., De Croon, R., & Verbert, K. (2021). AHMoSe: A knowledge-based visual support system for selecting regression machine learning models. Computers and Electronics in Agriculture, 187, 106183.
  • 38.
    AHMoSe Visual Encodings 38 ModelExplanations (SHAP) Model + Knowledge Summary
  • 39.
    Case Study –Grape Quality Prediction 39 ¤ Grape Quality Prediction Scenario [Tag14] ¤ Data ¤ Years 2010, 2011 (train) 2012 (test) ¤ 48 cells (Central Greece) ¤ Knowledge-based rules [Tag14] Tagarakis, A., et al. "A fuzzy inference system to model grape quality in vineyards." Precision Agriculture 15.5 (2014): 555-578. Source: [Tag14]
  • 40.
    Simulation Study ¤ AHMoSevs full AutoML approach to support model selection. 40 RMSE (AutoML) RMSE (AHMoSe) Difference % Scenario A Complete Knowledge 0.430 0.403 ▼ 6.3% Scenario B Incomplete Knowledge 0.458 0.385 ▼ 16.0%
  • 41.
    Qualitative Evaluation ¤ 10open ended questions ¤ 5 viticulture experts and 4 ML experts. ¤ Thematic Analysis: potential use cases, trust, usability, and understandability.
  • 42.
    Qualitative Evaluation -Trust 42 ¤ Showing the dis/agreement of model outputs with expert’s knowledge can promote trust. “The thing that makes us trust the models is the fact that most of the time, there is a good agreement between the values predicted by the model and the ones obtained for the knowledge of the experts.” – Viticulture Expert
  • 43.
  • 44.
    Designing for interactingwith predictions for finding jobs 44
  • 45.
    Predicting duration tofind a job 45 Key Issues: Missing data, prediction trust issues, job seeker motivation, lack of control.
  • 46.
    Methods ¤ A CustomerJourney approach. (5 mediators). ¤ Hands-on time with the original dashboard (22 mediators). ¤ Observations of mediation sessions. (3 mediators, 6 job seekers). ¤ Questionnaire regarding perception of the dashboard and prediction model (15 Mediators). 46 Charleer S., Gutiérrez Hernández F., Verbert K. (2018). Supporting job mediator and job seeker through an actionable dashboard. In: Proceedings of the 24th IUI conference on Intelligent User Interfaces Presented at the ACM IUI 2019, Los Angeles, USA.
  • 47.
  • 48.
    Take away messages ¤Key difference between actionable and non-actionable parameters ¤ Need for customization and contextualization. ¤ The human expert plays a crucial role when interpreting and relaying in the predicted or recommended output. 48 Charleer S., Gutiérrez Hernández F., Verbert K. (2019). Supporting job mediator and job seeker through an actionable dashboard. In: Proceedings of the 24th IUI conference on Intelligent User Interfaces Presented at the ACM IUI 2019, Los Angeles, USA. (Core: A)
  • 49.
  • 50.
  • 51.
    51 Ooge, J., Stiglic,G., & Verbert, K. (2021). Explaining artificial intelligence with visual analytics in healthcare. Wiley Interdisciplinary Reviews: Data Mining and Knowledge Discovery, e1427. https://doi.org/10.1002/widm.1427
  • 52.
    https://www.jmir.org/2021/6/e18035 Nutrition Nutrition advice (7) Diets(7) Recipes (7) Menus (2) Fruit (1) Restaurants (1) Doctors (4) Hospital (5) Thread / fora (3) Self-Diagnosis (3) Healthcare information (5) Similar users (2) Advise for children (2) General health information Routes (2) Physical activity (10) Leisure activity (2) Wellbeing motivation (2) Behaviour (7) Wearable devices (1) Tailored messages (2) Routes (2) Physical activity (10) Leisure activity (2) Behaviour (7) Lifestyle Specific health conditions Health Recommender Systems
  • 53.
  • 54.
  • 55.
    Design and evaluation 55 GutiérrezF., Cardoso B., Verbert K. (2017). PHARA: a personal health augmented reality assistant to support decision-making at grocery stores. In: Proceedings of the International Workshop on Health Recommender Systems co-located with ACM RecSys 2017 (Paper No. 4) (10-13).
  • 56.
    Results ¤ PHARA allowsusers to make informed decisions, and resulted in selecting healthier food products. ¤ Stack layout performs better with HMD devices with a limited field of view, like the HoloLens, at the cost of some affordances. ¤ The grid and pie layouts performed better in handheld devices, allowing to explore with more confidence, enjoyability and less effort. 56 Gutiérrez Hernández F., Htun NN., Charleer S., De Croon R., Verbert K. (2018). Designing augmented reality applications for personal health decision-making. In: Proceedings of the 2019 52nd Hawaii International Conference on System Sciences Presented at the HICSS, Hawaii, 07 Jan 2019-11 Jan 2019.
  • 57.
    Biofortification info Plants tocultivate Ongoing work: PERNUG ¤ Increased access to more nutritious plants ¤ Improved iron and B12 intakes for vegan and vegetarian subgroups Consumer app with recipe recommendations Hydroponic system with biofortified plants https://www.eitfood.eu/projects/pernug
  • 58.
  • 59.
  • 60.
  • 61.
  • 62.
    62 Gutiérrez Hernández, F.S.,Htun, N.N., Vanden Abeele, V., De Croon, R., Verbert, K. (2022). Explaining call recommendations in nursing homes: a user-centered design approach for interacting with knowledge-based health decision support systems. Proceedings of IUI 2022.
  • 63.
    Evaluation ¤ 12 nursesused the app for three months ¤ Data collection ¤ Interaction logs ¤ Resque questions ¤ Semi-structured interviews 63
  • 64.
    ¤ 12 nursesduring 3 months 64
  • 65.
    Results ¤ Iterative designprocess identified several important features, such as the pending list, overview and the feedback shortcut to encourage feedback. ¤ Explanations seem to contribute well to better support the healthcare professionals. ¤ Results indicate a better understanding of the call notifications by being able to see the reasons of the calls. ¤ More trust in the recommendations and increased perceptions of transparency and control ¤ Interaction patterns indicate that users engaged well with the interface, although some users did not use all features to interact with the system. ¤ Need for further simplification and personalization. 65
  • 66.
  • 67.
    Motivation Context 60% of Belgianemployees has pain complaints 33% of extended sick leave is due to pain complaints Solution 67
  • 68.
    Explaining health recommendations ¤ 6different explanation designs ¤ Explain WHY users are given a certain recommendation for their (chronic) pain based on their inputs 68 Maxwell Szymanski, Vero Vanden Abeele and Katrien Verbert Explaining health recommendations to lay users: The dos and don’ts – Apex-IUI 2022
  • 69.
    6 different designs 69 textinline reply tags
  • 70.
    70 Word cloud Featureimportance Feature importance+ % 6 different designs
  • 71.
  • 72.
    Results Feature Importance Bars(+%) favoured by most users 72
  • 73.
    Keywords / themesas to why users (dis)like the explanation type 73
  • 74.
    Results “Insight vs. informationoverload” ¤ Most users prefer more information (holistic overview of inputs) ¤ However, some users experienced information overload → Future work - Do personal characteristics such as NFC influence this? 74
  • 75.
    Next steps: healthdashboard 75
  • 76.
  • 77.
  • 78.
    Petal-X ¤ Explaining cardiovasculardisease (CVD) risk predictions to patients.
  • 79.
    Take-away messages ¤ Involvementof end-users has been key to come up with interfaces tailored to the needs of non-expert users ¤ Actionable vs non-actionable parameters ¤ Domain expertise of users and need for cognition important personal characteristics ¤ Need for personalisation and simplification 79
  • 80.
    Peter Brusliovsky NavaTintarev Cristina Conati Denis Parra Collaborations Jurgen Ziegler Gregor Stiglic
  • 81.