Download to read offline


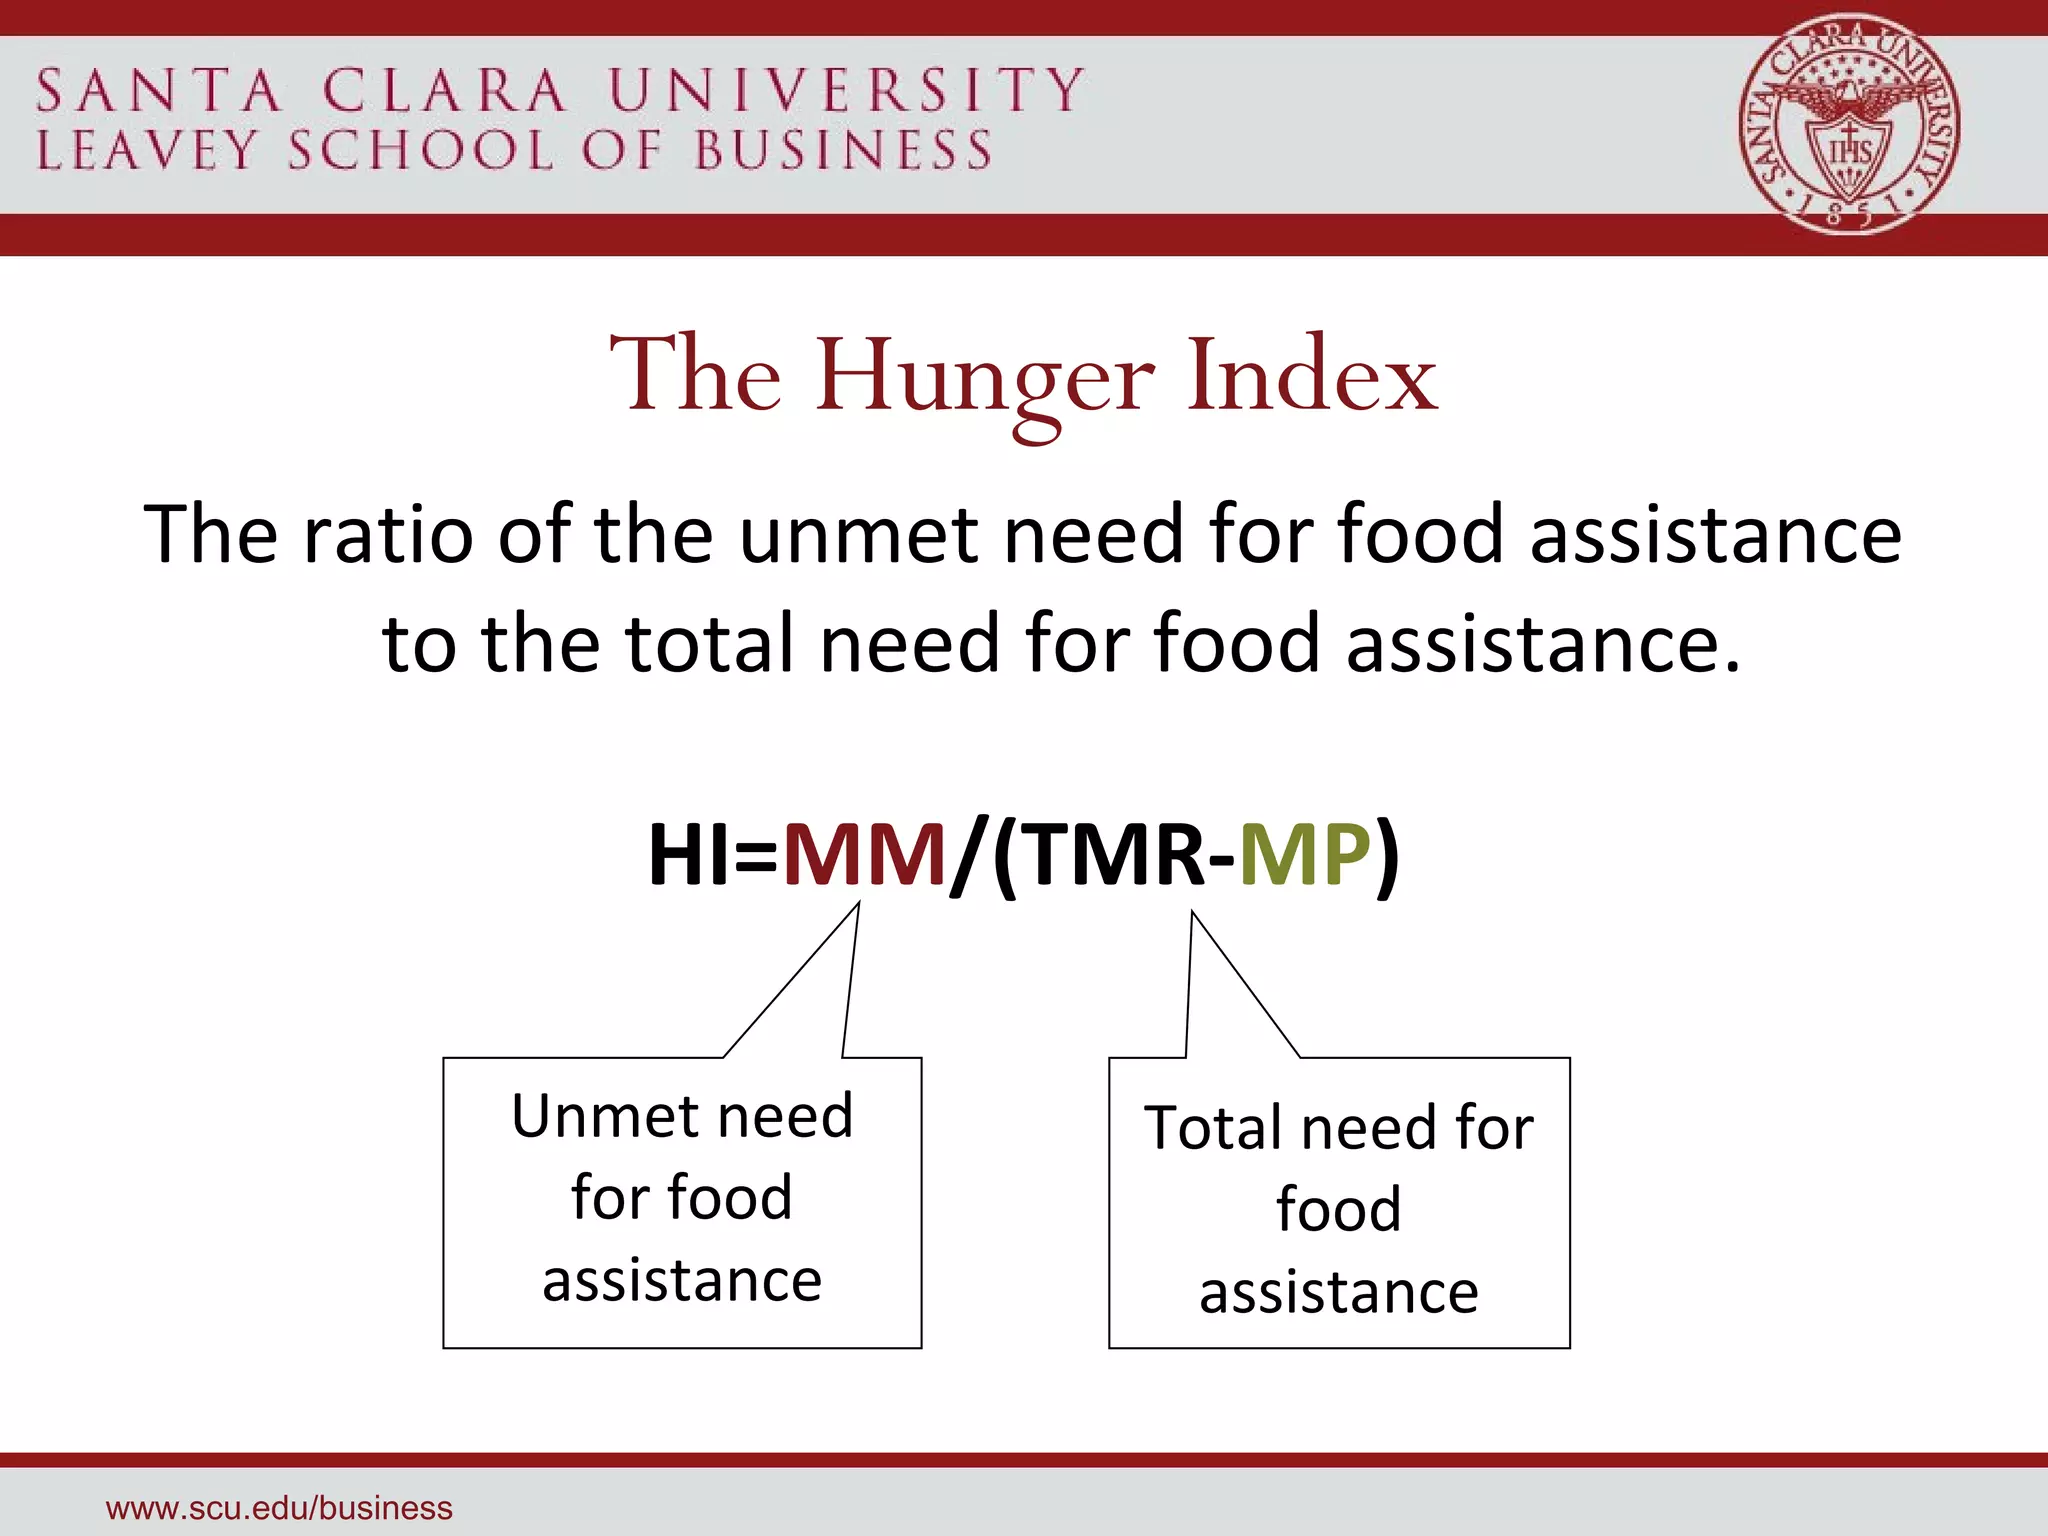


The document summarizes the Hunger Index for Santa Clara and San Mateo Counties in 2009. Some key findings are that the combined Hunger Index for both counties decreased 4% from the previous year, but the total need for food assistance increased by 8-9% due to population growth and declining purchasing power. Food assistance programs stepped up and provided 23% more meals. However, there were still 238 million "missing meals" across both counties. The document concludes that further collaboration across agencies and the community could help reduce hunger levels.


