A Visual Exploration Workflow as Enabler for the Exploitation of Linked Open Data
Download as PPTX, PDF1 like966 views

The document outlines a visual workflow designed for discovering, analyzing, and exploiting linked open data, particularly emphasizing its relevance in digital libraries and archives. It discusses user interaction with the dataset, methods for visualization, and evaluation results from case studies that emphasize the perceived goals of explorability and usefulness. The conclusion highlights the benefits of graph visualizations in enhancing user familiarity with linked data and fostering a higher demand for its utilization.


A Visual Exploration Workflow as Enabler for the Exploitation of Linked Open Data
- 1. A Visual Exploration Workflow as Enabler for the Exploitation of Linked Open Data Laurens De Vocht A.Dimou, J. Breuer, M. Van Compernolle, R. Verborgh, E. Mannens, P. Mechant, R. Van de Walle
- 2. Investigate demand How to discover, explore and analyze available published data reuse and exchange of resources Linked Open Data
- 3. Advantage a substantial role in contexts like e.g. digital libraries and archives ideal to reveal links between resources
- 4. Disadvantage lack of understanding of the semantic technology limits non-semantic Web experts to optimally interpret and query Linked Data
- 5. Agenda 1. Defining the Workflow 2. Visualization 3. Evaluation 4. Discussion and Conclusions
- 6. 1. Defining the Workflow
- 7. A visual workflow for resources represented as Linked Open Data for exploitation, discovery and analysis of the Web of Data using information exploration techniques
- 9. Narrowing The user gets familiar with the dataset no explicit assumption regarding the dataset the dataset itself reveals its underlying model and the relationships between its resources
- 10. Narrowing Initial overview the broader concepts are demonstrated Narrowing views narrow the broader concepts. each narrowing view relies on grouping and aggregating resources based on their types and properties
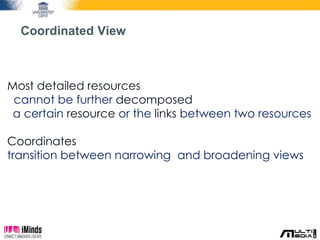
- 11. Coordinated View Most detailed resources cannot be further decomposed a certain resource or the links between two resources Coordinates transition between narrowing and broadening views
- 12. Broadening The user is familiar with the dataset Users explore the dataset on their own find novel relations between resources Views are not limited to the data of the dataset but relevant links to resources of other datasets are also revealed and visualized
- 13. 2. Visualization
- 15. 3. Evaluation
- 16. Results Case study: Academic Library Metadata User perceived goals Explorability and Usefulness Complexity and Learnability Overall results
- 20. Overall Results
- 21. 4. Discussion and Conclusions
- 22. Discussion
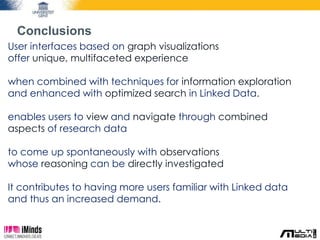
- 24. Conclusions User interfaces based on graph visualizations offer unique, multifaceted experience when combined with techniques for information exploration and enhanced with optimized search in Linked Data. enables users to view and navigate through combined aspects of research data to come up spontaneously with observations whose reasoning can be directly investigated It contributes to having more users familiar with Linked data and thus an increased demand.
- 25. Contact http://www.resxplorer.org http://ewi.mmlab.be/academic @laurens_d_v #mmlab [email protected] http://slideshare.net/laurensdv http://semweb.mmlab.be/
Editor's Notes
- #2: Look into how Linked Data impacts the demand for data.
- #20: To understand how the users perceive this visual workflow and its goals, we asked them to score possible purposes of use. As displayed in Figure 4, the respondents indeed perceived both the narrowing and broadening views as adequate tools to explore, discover and search. The broadening view is considered by the respondents as being a tool for exploration in the first place and discovery in the second place. The narrowing view is considered as a means to explore and to search.
- #21: Test users agree that the visualizations is useful in terms of what it exposes 22 out of 34 (65%) agree for the broadening views and 28 out of 34 (82%) for the narrowing views. 28 out of the 34 respondents (74%) agree or strongly agree that the displayed relations of the broadening view are presented as an optimized selection of all results. Although, respondents stay rather undecided when it comes to the limitations: 16 out of 34 respondents (47%) agree or strongly agree that it is useful that the number of visualized resources and relations are limited, whereas 11 out of 34 (32%) disagree or strongly disagree on this. Finally, the respondents strongly agree that both the broadening view and the narrowing views support them gaining insights into the published data, but they were less confident in the case of the narrowing view.
- #22: The majority of the respondents agreed that they can learn quickly to interpret the visualizations both for the narrowing views, 27 out of 34 (79%), and the broadening views, 23 out of 34 (68%). Most of them think they found relevant insights at the narrowing and coordinated views as well during the broadening views. Interesting is the fact that most of the respondents agree with the statement that once people get familiar with the visualizations in the narrowing view they can get benefit out of it 30 out of 34 (88%) and even more of them agree for the broadening exploration 31 out of 34 (91%).
- #23: shows that overall the views don’t seem to expose innovation. In terms of usefulness and complexity the users are very satisfied with the narrowing, they need some time to learn how the broadening Works and understand how it is beneficial for them.
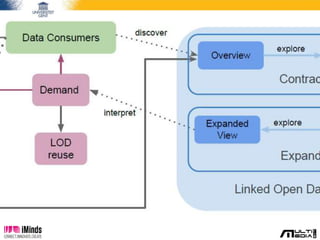
- #25: Consumers can discover published LOD and its meaning through the exploration workflow. As this adds value to their own activities, they are likely to increase the demand, and address data publishers to improve respective infrastructure. To assess the potential of LOD, the process of linking open data in a broader multi-stakeholder context needs also to be taken into account. In order to have users to be able to form demands, they need to be able to explore (based on the demand) but therefore they have to be able to discover and interpret the data that is already out there.
- #26: Consumers can discover published LOD and its meaning through the exploration workflow. As this adds value to their own activities, they are likely to increase the demand, and address data publishers to improve respective infrastructure. To assess the potential of LOD, the process of linking open data in a broader multi-stakeholder context needs also to be taken into account. In order to have users to be able to form demands, they need to be able to explore (based on the demand) but therefore they have to be able to discover and interpret the data that is already out there.