


![Unit 1: Number 15
1 Reviewing number concepts
8 Local time in Abu Dhabi is four hours ahead of Greenwich Mean Time. Local time in
Rio de Janeiro is three hours behind Greenwich Mean Time.
a If it is 4p.m. at Greenwich, what time is it in Abu Dhabi?
b If it is 3a.m. in Greenwich, what time is it in Rio de Janiero?
c If it is 3p.m. in Rio de Janeiro, what time is it in Abu Dhabi?
d If it is 8a.m. in Abu Dhabi, what time is it in Rio de Janeiro?
1.6 Order of operations
At this level of mathematics you are expected to do more complicated calculations involving
more than one operation (+, −, × and ÷). When you are carrying out more complicated
calculations you have to follow a sequence of rules so that there is no confusion about what
operations you should do first. The rules governing the order of operations are:
• complete operations in grouping symbols first
• do division and multiplication next, working from left to right
• do addition and subtractions last, working from left to right.
Many people use the letters BODMAS to remember the order of operations. The letters stand for:
Brackets
Of
Divide Multiply
Add Subtract
(Sometimes, ‘I’ for ‘indices’ is used instead of ‘O’ for ‘of’)
BODMAS indicates that indices (powers) are considered after brackets but before all other
operations.
Grouping symbols
The most common grouping symbols in mathematics are brackets. Here are some examples of
the different kinds of brackets used in mathematics:
(4 + 9) × (10 ÷ 2)
[2(4 + 9) − 4(3) − 12]
{2 − [4(2 − 7) − 4(3 + 8)] − 2 × 8}
When you have more than one set of brackets in a calculation, you work out the innermost set first.
Other symbols used to group operations are:
• fraction bars, e.g.
5 12
3 8
5 1
5 1
3 8
3 8
• root signs, such as square roots and cube roots, e.g. 9 16
9 1
9 1
• powers, e.g. 52
or 43
Worked example 10
Simplify:
a 7 × (3 + 4) b (10 − 4) × (4 + 9) c 45 − [20 × (4 − 3)]
a 7 × 7 = 49 b 6 × 13 = 78 c 45 − [20 × 1] = 45 − 20
= 25
e
s
s
-
R
e
v
i
e
w
C
o
p
y
-
C
a
m
b
r
i
d
g
e
U
n
i
v
e
r
s
i
t
y
P
r
e
s
s
-
R
e
v
i
e
w
C
o
p
y
R
e
v
i
e
w
C
o
p
y
-
C
a
m
b
r
i
d
g
e
U
n
i
v
e
r
s
i
t
y
P
r
e
s
s
-
R
e
v
i
e
w
C
o
p
y
R
e
v
i
e
w
C
o
p
y
-
C
a
m
b
r
i
d
g
e
U
n
i
v
e
r
s
i
t
y
P
r
e
s
s
-
R
e
v
i
e
w
C
o
p
y
R
e
v
i
e
w
C
o
p
y
-
C
a
m
b
r
i
d
g
e
U
n
i
v
e
r
s
i
t
y
Copyright Material - Review Only - Not for Redistribution](https://image.slidesharecdn.com/igcsemathematicstextbookfullversion-241104053313-f2eaac1e/85/IGCSE-Mathematics-Textbook-full-version-pdf-25-320.jpg)
![Unit 1: Number
Cambridge IGCSE Mathematics
16
Worked example 11
Worked example 11
Calculate:
a 3 + 82
b c 36 4 100 36
÷ +
4
÷ + −
a 3 8
3 64
67
3 8
+ ×
3 8
= +
3 6
= +
3 6
=
( )
3 8
( )
3 8 8
( )
+ ×
( )
3 8
+ ×
( )
3 8
+ × b ( ) ( )
( )
4 2
( )
8 1
( )
8 1
( ) ( )
8 1
( )
( )
7 9
( )
32 8
4
( )
+ ÷
( )
4 2
( )
+ ÷
( )
4 28 1
+ ÷
8 1
( )
8 1
( )
+ ÷
8 1
( )
7 9
( )
7 9
= ÷
32
= ÷
=
c 36 4 100 36
9 6
9 64
3 8
11
÷ +
4
÷ + −
= +
= +
9 6
= +
9 6
= +
3 8
= +
3 8
=
Exercise 1.14 1 Calculate. Show the steps in your working.
a (4 + 7) × 3 b (20 − 4) ÷ 4 c 50 ÷ (20 + 5) d 6 × (2 + 9)
e (4 + 7) × 4 f (100 − 40) × 3 g 16 + (25 ÷ 5) h 19 − (12 + 2)
i 40 ÷ (12 − 4) j 100 ÷ (4 + 16) k 121 ÷ (33 ÷ 3) l 15 × (15 − 15)
2 Calculate:
a (4 + 8) × (16 − 7) b (12 − 4) × (6 + 3) c (9 + 4) − (4 + 6)
d (33 + 17) ÷ (10 − 5) e (4 × 2) + (8 × 3) f (9 × 7) ÷ (27 − 20)
g (105 − 85) ÷ (16 ÷ 4) h (12 + 13) ÷ 52
i (56 − 62
) × (4 + 3)
3 Simplify. Remember to work from the innermost grouping symbols to the outermost.
a 4 + [12 − (8 − 5)] b 6 + [2 − (2 × 0)]
c 8 + [60 − (2 + 8)] d 200 − [(4 + 12) − (6 + 2)]
e 200 × {100 − [4 × (2 + 8)]} f {6 + [5 × (2 + 30)]} × 10
g [(30 + 12) − (7 + 9)] × 10 h 6 × [(20 ÷ 4) − (6 − 3) + 2]
i 1000 − [6 × (4 + 20) − 4 × (3 + 0)]
4 Calculate:
a 6 + 72 b 29 − 23 c 8 × 42
d 20 − 4 ÷ 2 e
31 10
14 7
−
−
f
100 40
5 4
−
5 4
5 4
g 100 36
− h 8 8
8 8
8 8 i 90 9
−
5 Insert brackets into the following calculations to make them true.
a 3 × 4 + 6 = 30 b 25 − 15 × 9 = 90 c 40 − 10 × 3 = 90
d 14 − 9 × 2 = 10 e 12 + 3 ÷ 5 = 3 f 19 − 9 × 15 = 150
g 10 + 10 ÷ 6 − 2 = 5 h 3 + 8 × 15 − 9 = 66 i 9 − 4 × 7 + 2 = 45
j 10 − 4 × 5 = 30 k 6 ÷ 3 + 3 × 5 = 5 l 15 − 6 ÷ 2 = 12
m 1 + 4 × 20 ÷ 5 = 20 n 8 + 5 − 3 × 2 = 20 o 36 ÷ 3 × 3 − 3 = 6
p 3 × 4 − 2 ÷ 6 = 1 q 40 ÷ 4 + 1 = 11 r 6 + 2 × 8 + 2 = 24
Working in the correct order
Now that you know what to do with grouping symbols, you are going to apply the rules for order
of operations to perform calculations with numbers.
Exercise 1.15 1 Simplify. Show the steps in your working.
a 5 × 10 + 3 b 5 × (10 + 3) c 2 + 10 × 3
d (2 + 10) × 3 e 23 + 7 × 2 f 6 × 2 ÷ (3 + 3)
A bracket ‘type’ is always twinned
with another bracket of the
same type/shape. This helps
mathematicians to understand
the order of calculations even
more easily.
You will apply the order of operation
rules to fractions, decimals and
algebraic expressions as you
progress through the course.
FAST FORWARD
4 28
17 9
4 2
4 2
−
e
s
s
-
R
e
v
i
e
w
C
o
p
y
-
C
a
m
b
r
i
d
g
e
U
n
i
v
e
r
s
i
t
y
P
r
e
s
s
-
R
e
v
i
e
w
C
o
p
y
R
e
v
i
e
w
C
o
p
y
-
C
a
m
b
r
i
d
g
e
U
n
i
v
e
r
s
i
t
y
P
r
e
s
s
-
R
e
v
i
e
w
C
o
p
y
R
e
v
i
e
w
C
o
p
y
-
C
a
m
b
r
i
d
g
e
U
n
i
v
e
r
s
i
t
y
P
r
e
s
s
-
R
e
v
i
e
w
C
o
p
y
R
e
v
i
e
w
C
o
p
y
-
C
a
m
b
r
i
d
g
e
U
n
i
v
e
r
s
i
t
y
Copyright Material - Review Only - Not for Redistribution
RM.DL.Books](https://image.slidesharecdn.com/igcsemathematicstextbookfullversion-241104053313-f2eaac1e/85/IGCSE-Mathematics-Textbook-full-version-pdf-26-320.jpg)
![Unit 1: Number 17
1 Reviewing number concepts
g
15 5
2 5
−
2 5
2 5
h (17 + 1 ) ÷ 9 + 2 i
16 4
4 1
−
4 1
4 1
j 17 + 3 × 21 k 48 − (2 + 3) × 2 l 12 × 4 − 4 × 8
m 15 + 30 ÷ 3 + 6 n 20 − 6 ÷ 3 + 3 o 10 − 4 × 2 ÷ 2
2 Simplify:
a 18 − 4 × 2 − 3 b 14 − (21 ÷ 3) c 24 ÷ 8 × (6 − 5)
d 42 ÷ 6 − 3 − 4 e 5 + 36 ÷ 6 − 8 f (8 + 3) × (30 ÷ 3) ÷ 11
3 State whether the following are true or false.
a (1 + 4) × 20 + 5 = 1 + (4 × 20) + 5 b 6 × (4 + 2) × 3 (6 × 4) ÷ 2 × 3
c 8 + (5 − 3) × 2 8 + 5 − (3 × 2) d 100 + 10 ÷ 10 (100 + 10) ÷ 10
4 Place the given numbers in the correct spaces to make a correct number sentence.
a 0, 2, 5, 10
− ÷
b 9, 11, 13, 18
− ÷
c 1, 3, 8, 14, 16
÷ −
− =
− =
( )
( )
( )
÷ −
( )
÷ −
( )
÷ −
d 4, 5, 6, 9, 12 ( ) ( )
( )
( )
( )
( )
+ −
( )
+ −
( )
( )
+ −
( )
− =
( )
− =
( )
( )
− =
( )
Using your calculator
A calculator with algebraic logic will apply the rules for order of operations automatically. So, if
you enter 2 + 3 × 4, your calculator will do the multiplication first and give you an answer of 14.
(Check that your calculator does this!).
When the calculation contains brackets you must enter these to make sure your calculator does
the grouped sections first.
Experiment with your calculator by
making several calculations with
and without brackets. For example:
3 × 2 + 6 and 3 × (2 + 6). Do you
understand why these are different?
Your calculator might only have one
type of bracket ( and ) .
If there are two different shaped
brackets in the calculation (such as
[4 × (2 – 3)], enter the calculator
bracket symbol for each type.
Worked example 12
Use a calculator to find:
a 3 + 2 × 9 b (3 + 8) × 4 c (3 × 8 − 4) − (2 × 5 + 1)
a 21 Enter 3 + 2 × 9 =
b 44 Enter ( 3 + 8 ) × 4 =
c 9 Enter ( 3 × 8 − 4 ) −
( 2 × 5 + 1 ) =
Exercise 1.16 1 Use a calculator to find the correct answer.
a 10 − 4 × 5 b 12 + 6 ÷ 7 − 4
c 3 + 4 × 5 − 10 d 18 ÷ 3 × 5 − 3 + 2
e 5 − 3 × 8 − 6 ÷ 2 f 7 + 3 ÷ 4 + 1
g (1 + 4) × 20 ÷ 5 h 36 ÷ 6 × (3 − 3)
i (8 + 8) − 6 × 2 j 100 − 30 × (4 − 3)
k 24 ÷ (7 + 5) × 6 l [(60 − 40) − (53 − 43)] × 2
m [(12 + 6) ÷ 9] × 4 n [100 ÷ (4 + 16)] × 3
o 4 × [25 ÷ (12 − 7)]
2 Use your calculator to check whether the following answers are correct.
If the answer is incorrect, work out the correct answer.
a 12 × 4 + 76 = 124 b 8 + 75 × 8 = 698
c 12 × 18 − 4 × 23 = 124 d (16 ÷ 4) × (7 + 3 × 4) = 76
e (82 − 36) × (2 + 6) = 16 f (3 × 7 − 4) − (4 + 6 ÷ 2) = 12
In this section you will use your
calculator to perform operations
in the correct order. However, you
will need to remember the order
of operations rules and apply them
throughout the book as you do
more complicated examples using
your calculator.
Some calculators have two ‘−’
buttons: − and (−) . The
first means ‘subtract’ and is used to
subtract one number from another.
The second means ‘make negative’.
Experiment with the buttons and
make sure that your calculator is
doing what you expect it to do!
e
s
s
-
R
e
v
i
e
w
C
o
p
y
-
C
a
m
b
r
i
d
g
e
U
n
i
v
e
r
s
i
t
y
P
r
e
s
s
-
R
e
v
i
e
w
C
o
p
y
R
e
v
i
e
w
C
o
p
y
-
C
a
m
b
r
i
d
g
e
U
n
i
v
e
r
s
i
t
y
P
r
e
s
s
-
R
e
v
i
e
w
C
o
p
y
R
e
v
i
e
w
C
o
p
y
-
C
a
m
b
r
i
d
g
e
U
n
i
v
e
r
s
i
t
y
P
r
e
s
s
-
R
e
v
i
e
w
C
o
p
y
R
e
v
i
e
w
C
o
p
y
-
C
a
m
b
r
i
d
g
e
U
n
i
v
e
r
s
i
t
y
Copyright Material - Review Only - Not for Redistribution](https://image.slidesharecdn.com/igcsemathematicstextbookfullversion-241104053313-f2eaac1e/85/IGCSE-Mathematics-Textbook-full-version-pdf-27-320.jpg)
![Unit 1: Number
Cambridge IGCSE Mathematics
18
3 Each * represents a missing operation. Work out what it is.
a 12 * (28 * 24) = 3 b 84 * 10 * 8 = 4 c 3 * 7(0.7 * 1.3) = 17
d 23 * 11 * 22 * 11 = 11 e 40 * 5 * (7 * 5) = 4 f 9 * 15 * (3 * 2) = 12
4 Calculate:
a
7 1
7 16
2 7 1
3 2
2 7
3 2
2 7
7 1
7 1
+ −
2 7
+ −
2 7
3 2
+ −
2 7
3 2
+ −
2 7
3 2
b
5 4
5 4
1 6 12
2
5 4
5 4
2
5 4
5 4
+ −
1 6
+ −
1 62
+ −
c
2 3
5 4 10 25
2
2
5 4
5 4
2 3
2 3
+ ×
5 4
+ ×
5 4 −
d
6 11
2 1
2
6 1
6 1
6 1
6 1
( )
2 1
( )
2 17 2 4
( )
7 2 4
+ ×
7 2 4
( )
+ ×
e
3 3
2 8
2 81
2
3 3
3 3
3 3
3 3
2 8
2 8
f
3 5 6
4 5
2
3 5
3 5
− +
3 5
− +
3 5
4 5
4 5
g
36 3 1
3 16
15 3 3
2
3 3
3 3
− ×
3 1
− ×
3 1
− ÷
3 3
− ÷
3 3
3 3
3 3
− ÷
h
−30 3 12 2
5 8 32
+ ÷ − +
3 1
− +
3 12 2
− +
− −
5 8
− −
5 8
[ (
18
[ (
+ ÷
[ (
+ ÷
18
+ ÷
[ (
+ ÷ ) ]
2 2
) ]
2 24
) ]
2 2
− +
2 2
) ]
2 2
− +
5 Use a calculator to find the answer.
a
0 345
1 34 4 2 7
.
. .
1 3
. .
1 34 4
. .
+ ×
4 4
+ ×
4 4 2 7
+ ×
2 7
. .
+ ×
4 4
. .
+ ×
4 4
. .
b
12 32 0 0378
16 8 05
. .
32
. .
0
. .
8 0
8 0
×
. .
. .
+
c
16 0 087
2 5 098
2
2 5
2 5
×
2 5
2 5
.
.
d
19 23 0 087
2 45 1 03
2 2
5 1
2 2
5 1 03
2 2
. .
23
. .
0
. .
. .
2 4
. .
2 45 1
. .
×
. .
. .
5 1
5 1
6 Use your calculator to evaluate.
a 64 125
× b 2 3 6
3 2
2 3
3 2
2 3
× ×
2 3
× ×
2 3
3 2
× ×
2 3
3 2
× ×
2 3
3 2
c 8 19
2 2
8 1
2 2
8 19
2 2
8 1
8 1
8 1
2 2
8 1
2 2
3
d 41 36
2 2
36
2 2
−
e 3.2 1.17
2 3
2 1
2 3
2 1.1
2 3
7
2 3
2 1
2 1 f 1.45 0.13
3 2
0.13
3 2
−
3
g
1
4
1
4
1
4
1
4
+ +
+ + h 2.752
− ×
− ×
1
− ×
− ×
2
− ×
− × 3
3
1 7
1 7
1 7
1.7 Rounding numbers
In many calculations, particularly with decimals, you will not need to find an exact answer.
Instead, you will be asked to give an answer to a stated level of accuracy. For example, you may be
asked to give an answer correct to 2 decimal places, or an answer correct to 3 significant figures.
To round a number to a given decimal place you look at the value of the digit to the right of the
specified place. If it is 5 or greater, you round up; if it less than 5, you round down.
Worked example 13
Round 64.839906 to:
a the nearest whole number b 1 decimal place c 3 decimal places
a 64.839906 4 is in the units place.
64.839906 The next digit is 8, so you will round up to get 5.
= 65 (to nearest whole number) To the nearest whole number.
b 64.839906 8 is in the first decimal place.
64.839906 The next digit is 3, so the 8 will remain unchanged.
= 64.8 (1dp) Correct to 1 decimal place.
c 64.839906 9 is in the third decimal place.
64.839906 The next digit is 9, so you need to round up.
When you round 9 up, you get 10, so carry one to the previous digit and write 0 in
the place of the 9.
= 64.840 (3dp) Correct to 3 decimal places.
The idea of ‘rounding’
runs through all subjects
where numerical data is
collected. Masses in physics,
temperatures in biology,
prices in economics: these
all need to be recorded
sensibly and will be rounded
to a degree of accuracy
appropriate for the situation.
LINK
When you work with indices and
standard form in chapter 5, you will
need to apply these skills and use
your calculator effectively to solve
problems involving any powers or
roots.
FAST FORWARD
The more effectively you are able to
use your calculator, the faster and
more accurate your calculations are
likely to be.
e
s
s
-
R
e
v
i
e
w
C
o
p
y
-
C
a
m
b
r
i
d
g
e
U
n
i
v
e
r
s
i
t
y
P
r
e
s
s
-
R
e
v
i
e
w
C
o
p
y
R
e
v
i
e
w
C
o
p
y
-
C
a
m
b
r
i
d
g
e
U
n
i
v
e
r
s
i
t
y
P
r
e
s
s
-
R
e
v
i
e
w
C
o
p
y
R
e
v
i
e
w
C
o
p
y
-
C
a
m
b
r
i
d
g
e
U
n
i
v
e
r
s
i
t
y
P
r
e
s
s
-
R
e
v
i
e
w
C
o
p
y
R
e
v
i
e
w
C
o
p
y
-
C
a
m
b
r
i
d
g
e
U
n
i
v
e
r
s
i
t
y
Copyright Material - Review Only - Not for Redistribution](https://image.slidesharecdn.com/igcsemathematicstextbookfullversion-241104053313-f2eaac1e/85/IGCSE-Mathematics-Textbook-full-version-pdf-28-320.jpg)


![21
Unit 1: Number
Examination practice
Exam-style questions
1 Here is a set of numbers: {−4, −1, 0, 3, 4, 6, 9, 15, 16, 19, 20}
Which of these numbers are:
a natural numbers? b square numbers? c negative integers?
d prime numbers? e multiples of two? f factors of 80?
2 a List all the factors of 12. b List all the factors of 24. c Find the HCF of 12 and 24.
3 Find the HCF of 64 and 144.
4 List the first five multiples of:
a 12 b 18 c 30 d 80
5 Find the LCM of 24 and 36.
6 List all the prime numbers from 0 to 40.
7 a Use a factor tree to express 400 as a product of prime factors.
b Use the division method to express 1080 as a product of prime factors.
c Use your answers to find:
i the LCM of 400 and 1080 ii the HCF of 400 and 1080
iii 400 iv whether 1080 is a cube number; how can you tell?
8 Calculate:
a 262
b 433
9 What is the smallest number greater than 100 that is:
a divisible by two? b divisible by ten? c divisible by four?
10 At noon one day the outside temperature is 4°C. By midnight the temperature is 8 degrees lower.
What temperature is it at midnight?
11 Simplify:
a 6 × 2 + 4 × 5 b 4 × (100 − 15) c (5 + 6) × 2 + (15 − 3 × 2) − 6
12 Add brackets to this statement to make it true.
7 + 14 ÷ 4 − 1 × 2 = 14
Past paper questions
1 Insert one pair of brackets only to make the following statement correct.
6 + 5 × 10 − 8 = 16 [1]
[Cambridge IGCSE Mathematics 0580 Paper 22 Q1 October/November 2014]
2 Calculate
8 24 2 56
1 26 0 72
. .
8 2
. .
8 24 2
. .
. .
1 2
. .
1 26 0
. .
4 2
4 2
4 2
. .
4 2
. .
6 0
6 0
[1]
[Cambridge IGCSE Mathematics 0580 Paper 22 Q2 October/November 2014]
e
s
s
-
R
e
v
i
e
w
C
o
p
y
-
C
a
m
b
r
i
d
g
e
U
n
i
v
e
r
s
i
t
y
P
r
e
s
s
-
R
e
v
i
e
w
C
o
p
y
R
e
v
i
e
w
C
o
p
y
-
C
a
m
b
r
i
d
g
e
U
n
i
v
e
r
s
i
t
y
P
r
e
s
s
-
R
e
v
i
e
w
C
o
p
y
R
e
v
i
e
w
C
o
p
y
-
C
a
m
b
r
i
d
g
e
U
n
i
v
e
r
s
i
t
y
P
r
e
s
s
-
R
e
v
i
e
w
C
o
p
y
R
e
v
i
e
w
C
o
p
y
-
C
a
m
b
r
i
d
g
e
U
n
i
v
e
r
s
i
t
y
Copyright Material - Review Only - Not for Redistribution](https://image.slidesharecdn.com/igcsemathematicstextbookfullversion-241104053313-f2eaac1e/85/IGCSE-Mathematics-Textbook-full-version-pdf-31-320.jpg)
![Unit 1: Number
22
3 Write 3.5897 correct to 4 significant figures. [1]
[Cambridge IGCSE Mathematics 0580 Paper 22 Q3 May/June 2016]
4 8 9 10 11 12 13 14 15 16
From the list of numbers, write down
a the square numbers, [1]
b a prime factor of 99. [1]
[Cambridge IGCSE Mathematics 0580 Paper 22 Q5 May/June 2016]
5 a Write 90 as a product of prime factors. [2]
b Find the lowest common multiple of 90 and 105. [2]
[Cambridge IGCSE Mathematics 0580 Paper 22 Q15 October/November 2014]
e
s
s
-
R
e
v
i
e
w
C
o
p
y
-
C
a
m
b
r
i
d
g
e
U
n
i
v
e
r
s
i
t
y
P
r
e
s
s
-
R
e
v
i
e
w
C
o
p
y
R
e
v
i
e
w
C
o
p
y
-
C
a
m
b
r
i
d
g
e
U
n
i
v
e
r
s
i
t
y
P
r
e
s
s
-
R
e
v
i
e
w
C
o
p
y
R
e
v
i
e
w
C
o
p
y
-
C
a
m
b
r
i
d
g
e
U
n
i
v
e
r
s
i
t
y
P
r
e
s
s
-
R
e
v
i
e
w
C
o
p
y
R
e
v
i
e
w
C
o
p
y
-
C
a
m
b
r
i
d
g
e
U
n
i
v
e
r
s
i
t
y
Copyright Material - Review Only - Not for Redistribution](https://image.slidesharecdn.com/igcsemathematicstextbookfullversion-241104053313-f2eaac1e/85/IGCSE-Mathematics-Textbook-full-version-pdf-32-320.jpg)


![Unit 1: Algebra 35
2 Making sense of algebra
g 6 3
+ −
6 3
+ −
6 3( )
2
( )
+ −
( )
+ −
( )
( )
+ −
( )
+ −
( ) h 4 2
x x
4 2
x x
4 2
+ +
4 2
+ +
4 2
x x
+ +
4 2
x x
+ +
4 2
x x
( )
2 3
( )
x x
( )
x x
2 3
x x
2 3
( )
x x
+ +
( )
+ +
2 3
+ +
2 3
( )
+ +
x x
+ +
( )
x x
+ +
2 3
x x
2 3
+ +
x x
( )
x x
2 3
+ +
x x i 2 3 2 2
x x
2 3
x x
2 3 2 2
x x
+ +
2 3
+ +
2 3
x x
+ +
x x
2 3
x x
+ +
2 3
x x
( )
2 2
( )
2 2 3
( )
x x
( )
x x
2 2
x x
( )
2 2
x x +
( )
j 3 2 2 3 4
( )
3 2
( )
3 2 2 3
( )
2 3
x x
2 3
x x
( )
x x
( )
2 3
( )
2 3
x x
( )
2 3
+ −
( )
+ −
( )
2 3
( )
2 3
+ −
( )
2 3
x x
+ −
2 3
x x
( )
x x
+ −
( )
x x
2 3
( )
2 3
x x
( )
+ −
( )
2 3
x x
( ) − k 6 2
x x
6 2
x x
6 2
+ +
6 2
+ +
6 2
x x
+ +
6 2
x x
+ +
6 2
x x
( )
3
( )
x x
( )
x x
+ +
( )
+ +
x x
+ +
( )
x x
+ + l 7 4 4
y y
7 4
y y
7 4
7 4
+ −
7 4
7 4
y y
7 4
+ −
7 4
y y −
( )
7 4
( )
7 4
7 4
7 4
( )
7 4
+ −
7 4
( )
7 4
+ −
7 4
7 4
+ −
( )
7 4
+ −
m 2 4 4
x x
2 4
x x
2 4
( )
2 4
( )
2 4
x x
( )
x x
2 4
x x
2 4
( )
2 4
x x + −
( )
+ −
2 4
( )
+ −
2 4
( ) n 2 2
y x
2 2
y x
2 2 y
( )
2 2
( )
2 2 2 4
( )
y x
( )
y x
2 2
y x
( )
2 2
y x y
( )
( )
− +
( )
2 4
( )
− +
2 4
( )
2 4
2 4
( )
− +
2 4
( ) o 2 5 4 4 2
y y
2 5
y y
2 5 y
( )
2 5
( )
2 5 4 4
( )
4 4
( )
4 4
( )
4 4
y y
( )
y y
2 5
y y
( )
2 5
y y
4 4
y y
4 4
( )
y y
4 4
− −
4 4
4 4
( )
4 4
− −
( )
y y
( )
− −
y y
( )
4 4
y y
4 4
( )
y y
− −
y y
4 4
( )
y y
p 3 2 4 9
3 2
x x
3 2
( )
3 2
( )
3 2 4 9
( )
4 9
x x
( )
3 2
x x
( )
3 2
x x 4 9
+ −
4 9
( )
+ −
( )
4 9
( )
4 9
+ −
( ) q 3 2 4 2
y y
3 2
y y
3 2 y
( )
3 2
( )
3 2
y y
( )
y y
3 2
y y
3 2
( )
3 2
y y + −
( )
+ −
3 2
( )
+ −
3 2
( ) r 2 1 4 4
( )
2 1
( )
2 1
x x
4 4
x x
4 4
( )
x x
( )
2 1
( )
x x
2 1
( )
− +
( )
− +
2 1
( )
− +
( )
x x
− +
x x
( )
x x
− +
x x
2 1
( )
x x
( )
− +
2 1
( )
2 1
x x
( ) 4 4
4 4
2 Simplify these expressions by removing brackets and collecting like terms.
a 4 40 2
( )
4 4
( )
4 40 2
( )
0 2( )
3
( )
x x
0 2
x x
( )
x x
( )
4 4
( )
x x
4 4
( )
0 2
( )
0 2
x x
( ) ( )
x x
( )
0 2
+ +
0 2
( )
+ +
4 4
( )
+ +
4 4
( )
0 2
( )
0 2
+ +
( )
0 2
x x
+ +
0 2
x x
( )
x x
+ +
x x
4 4
( )
x x
( )
+ +
4 4
( )
4 4
x x
( )
0 2
( )
0 2
x x
( )
+ +
( )
0 2
x x
( ) ( )
( ) b 2 2 2 3
( )
2 2
( )
2 2 ( )
2 3
( )
2 3
x x
2 3
x x
( )
x x
( )
2 2
( )
x x
2 2
( ) 2 3
( )
2 3
x x
2 3
( )
− +
( )
− +
2 2
( )
− +
( )
x x
− +
x x
( )
x x
− +
x x
2 2
( )
x x
( )
− +
2 2
( )
2 2
x x
( ) 2 3
( )
2 3
( ) c 3 2 4 5
( )
3 2
( )
3 2 ( )
4 5
( )
4 5
x x
4 5
x x
( )
x x
3 2
( )
x x
3 2
( ) 4 5
( )
4 5
x x
4 5
( )
+ +
( )
+ +
3 2
( )
+ +
3 2
( )
x x
+ +
x x
( )
x x
+ +
x x
3 2
( )
x x
( )
+ +
3 2
( )
3 2
x x
( ) 4 5
( )
4 5
( )
d 8 10 4
( )
8 1
( )
8 10 4
( )
0 4( )
3 2
( )
x x
0 4
x x
( )
x x
8 1
( )
x x
8 1
( )
0 4
( )
0 4
x x
( ) ( )
x x
( )
3 2
( )
x x
( )
0 4
+ +
0 4
( )
+ +
8 1
( )
+ +
8 1
( )
0 4
( )
0 4
+ +
( )
0 4
x x
+ +
0 4
x x
( )
x x
+ +
x x
8 1
( )
x x
( )
+ +
8 1
( )
8 1
x x
( )
0 4
( )
0 4
x x
( )
+ +
( )
0 4
x x
( ) 3 2
( )
x x
( )
3 2
( )
3 2
x x
( ) e 4 2 2 4
2 2
2 4
2 2
( )
4 2
( )
4 2
2 2
( )
2 2
4 2
2 2
4 2
( )
2 2
( )
2 4
( )
2 4
2 2
( )
2 2
2 4
2 2
( )
2 4
2 2
x x
2 4
x x
( )
x x
( )
4 2
( )
x x
4 2
( ) ( )
x x
( )
2 4
( )
2 4
x x
( )
+ +
2 2
+ +
2 2
( )
+ +
4 2
( )
+ +
4 2
( )
2 2
( )
2 2
+ +
( )
4 2
2 2
( )
2 2
+ +
4 2
2 2
4 2
( )
2 2
x x
+ +
x x
( )
x x
+ +
x x
4 2
( )
x x
( )
+ +
4 2
( )
4 2
x x
( ) ( )
x x
( )
x x f 4 1 2 3
x x
4 1
x x
4 1 2 3
x x
2 3
( )
4 1
( )
4 1
x x
( )
x x
4 1
x x
4 1
( )
4 1
x x ( )
2 3
( )
2 3
2 3
x x
2 3
( )
2 3
x x
+ +
( )
+ +
4 1
( )
+ +
4 1
( ) 2 3
( )
2 3
( )
g 3 4 4 4
x y
3 4
x y
3 4 xy
( )
3 4
( )
3 4 4 4
( )
4 4
x y
( )
x y
3 4
x y
( )
3 4
x y ( )
3 4
( )
xy
( )
3 4
xy
3 4
( )
xy x
( )
4 4
− +
4 4
( )
− +
( )
4 4
( )
4 4
− +
( ) 3 4
( )
3 4
( ) h 2 5 4 2
x y
2 5
x y
2 5 y
( )
2 5
( )
2 5 4 2
( )
4 2
x y
( )
x y
2 5
x y
( )
2 5
x y ( )
6 4
( )
x x
( )
6 4
x x
6 4
( )
x xy
( )
x x
( )
4 2
− +
4 2
( )
− +
( )
4 2
( )
4 2
− +
( ) 6 4
x x
( )
x x
6 4
x x
6 4
( )
x x i 3 4 8 3
x y
3 4
x y
3 4 xy
( )
3 4
( )
3 4 8 3
( )
8 3
x y
( )
x y
3 4
x y
( )
3 4
x y
8 3
x y
8 3
( )
x y ( )
2 5
( )
xy
( )
2 5
xy
2 5
( )
xy x
( )
8 3
− +
8 3
( )
− +
8 3
( )
8 3
− +
( )
x y
( )
− +
x y
( )
8 3
x y
8 3
( )
x y
− +
x y
8 3
( )
x y 2 5
( )
2 5
( )
j 3 6 4 3
( )
3 6
( )
3 6 4 3
( )
4 3
( )
4 3
( )
4 3 2
( )
x y
( )
x y
( )
4 3
( )
x y
4 3
( ) x y
4 3
x y
4 3
( )
x y
( )
4 3
( )
4 3
x y
( )
2
( )
x y
( )
4 3
− +
4 3
( )
− +
4 3
( )
4 3
− +
( )
( )
x y
− +
( )
x y
4 3
( )
x y
4 3
( )
− +
( )
4 3
x y
( ) ( )
x y
( )
x y k 3 4 2 5
2 2
3 4
2 2
3 4 2 5
2 2 3
3 4
x x
3 4
( )
3 4
( )
3 4
2 2
( )
2 2
3 4
2 2
( )
3 4
2 2
x x
( )
3 4
x x
( )
3 4
x x ( )
2 5
( )
2 5 2
( )
2 2
( )
2 2
2 5
2 2
( )
2 5
2 2 3
( )
x x
( )
2
x x
( )
x x
− +
2 2
− +
2 2
( )
− +
2 2
( )
2 2
− +
( )
x x
( )
− +
x x
( ) x x
( )
x x
( ) l x x y x y
( )
x x
( )
x x y x
( )
y x
( )
y x
( )
y x y
( )
− +
y x
− +
y x
( )
− +
( )
y x
( )
y x
− +
( ) ( )
( )
3 2
y x
3 2
y x
( )
3 2
( )
y x
( )
y x
3 2
y x
( )
m 4 2 3 4
( )
4 2
( )
4 2 ( )
3 4
( )
3 4
x x
3 4
x x
3 4
( )
x x
( )
4 2
( )
x x
4 2
( ) y
( )
( )
− +
( )
− +
4 2
( )
− +
( )
x x
− +
x x
( )
x x
− +
x x
4 2
( )
x x
( )
− +
4 2
( )
4 2
x x
( ) ( )
( ) n x x y x x y
( )
x x
( )
x x y x
( )
y x( )
x y
( )
+ +
y x
+ +
y x
( )
+ +
( )
y x
( )
y x
+ +
( ) x y
( )
x y
( ) o 2 2 2
x x
2 2
x x
2 2
y x
2 2
y x xy
( )
2 2
( )
2 2
x x
( )
x x
2 2
x x
2 2
( )
2 2
x x y x
( )
y x
( )
3
( )
2
( )
y x
( )
y x xy
( )
2 2
+ +
2 2
2 2
y x
+ +
2 2
y x
2 2
( )
2 2
+ +
2 2
( )
2 2
y x
2 2
( )
2 2
y x
+ +
y x
2 2
( )
y x
( )
( )
p x x
( )
x x
( )
x x ( )
x
( )
( )
2 3
( )
x x
( )
2 3
x x
( ) 3 5
( )
3 5
( )
( )
( )
+ +
( )
+ +
( )
2 3
( )
+ +
( )
2 3 ( )
( ) q 4 2 3 5
( )
4 2
( )
4 2 3 5
( )
3 5
( )
3 5
( )
3 5
3 5
x x
( )
x x
( )
3 5
( )
3 5
x x
( )
3 5
( )
3 5
x x
3 5
( )
3 5
− +
3 5
( )
− +
3 5
( )
3 5
− +
( )
3 5
x x
− +
3 5
x x
( )
x x
− +
( )
x x
3 5
( )
3 5
x x
( )
− +
( )
3 5
x x
( )
3 5
( )
3 5
( ) r 3 4 2 5
( )
3 4
( )
3 4 2 5
( )
2 5( )
3
( )
xy
( )
xy
( )
x x
2 5
x x
2 5
( )
2 5
x x
2 5
( ) ( )
x x
( )
3
( )
x x
( )
xy
( )
xy
( )
2 5
− +
2 5
( )
− +
( )
2 5
( )
2 5
− +
( )
2 5
x x
− +
2 5
x x
2 5
( )
2 5
x x
2 5
( )
− +
( )
2 5
x x
( ) ( )
( )
2.5 Indices
Revisiting index notation
You already know how to write powers of two and three using indices:
2 2 22
× =
2 2
× =
2 2 and y y y
× =
y y
× =
y y 2
2 2 2 23
× ×
2 2
× ×
2 2 2 2
2 2 and y y y y
× ×
y y y
× ×
y y y = 3
When you write a number using indices (powers) you have written it in index notation. Any
number can be used as an index including 0, negative integers and fractions. The index tells
you how many times the base has been multiplied by itself. So:
3 3 3 3 34
3 3 3 3
× × ×
3 3 3 3 = 3 is the base, 4 is the index
a a a a a a
× × × ×
a a a a a
× × × ×
a a a a a = 5
a is the base, 5 is the index
The plural of ‘index’ is ‘indices’.
Exponent is another word
sometimes used to mean ‘index’ or
‘power’. These words can be used
interchangeably but ‘index’ is more
commonly used for IGCSE.
When you write a power out in full
as a multiplication you are writing it
in expanded form.
Worked example 11
Write each expression using index notation.
a 2 × 2 × 2 × 2 × 2 × 2 b x × x × x × x c x × x × x × y × y × y × y
a 2 × 2 × 2 × 2 × 2 × 2 = 26
Count how many times 2 is multiplied by
itself to give you the index.
b x × x × x × x = x4
Count how many times x is multiplied by itself
to give you the index.
c x × x × x × y × y × y × y = x3
y4
Count how many times x is multiplied by itself
to get the index of x; then work out the index
of y in the same way.
When you evaluate a number
raised to a power, you are carrying
out the multiplication to obtain a
single value.
Worked example 12
Use your calculator to evaluate:
a 25
b 28
c 106
d 74
a 25
= 32 Enter 2 x[]
5 =
b 28
= 256 Enter 2 x[]
8 =
c 106
= 1000000 Enter 1 0 x[]
6 =
d 74
= 2401 Enter 7 x[]
4 =
e
s
s
-
R
e
v
i
e
w
C
o
p
y
-
C
a
m
b
r
i
d
g
e
U
n
i
v
e
r
s
i
t
y
P
r
e
s
s
-
R
e
v
i
e
w
C
o
p
y
R
e
v
i
e
w
C
o
p
y
-
C
a
m
b
r
i
d
g
e
U
n
i
v
e
r
s
i
t
y
P
r
e
s
s
-
R
e
v
i
e
w
C
o
p
y
R
e
v
i
e
w
C
o
p
y
-
C
a
m
b
r
i
d
g
e
U
n
i
v
e
r
s
i
t
y
P
r
e
s
s
-
R
e
v
i
e
w
C
o
p
y
R
e
v
i
e
w
C
o
p
y
-
C
a
m
b
r
i
d
g
e
U
n
i
v
e
r
s
i
t
y
Copyright Material - Review Only - Not for Redistribution](https://image.slidesharecdn.com/igcsemathematicstextbookfullversion-241104053313-f2eaac1e/85/IGCSE-Mathematics-Textbook-full-version-pdf-45-320.jpg)


![Unit 1: Algebra
44
Examination practice
Exam-style questions
1 Write an expression in terms of n for:
a the sum of a number and 12
b twice a number minus four
c a number multiplied by x and then squared
d the square of a number cubed.
2 Simplify:
a 9 3 6 2
xy
9 3
xy
9 3x x
6 2
x x
6 2
y x
6 2
y x
6 2
6 2
x x
6 2
y x
x x
+ +
9 3
+ +
9 3x x
+ +
x x
6 2
y x
6 2
y x b 6 3
xy
6 3
xy
6 3
xy
6 3
xy
6 3y
6 3
− +
6 3
6 3
xy
6 3
− +
xy
3 Simplify:
a a b
ab
3 4
a b
3 4
a b
3
b 2 3 2
( )
3 2
( )
3 2
( )
( ) c 3 2 3 2
x x
3 2
x x
3 2 y
3 2
3 2
3 2
3 2
3 2
x x
3 2
x x
d ( )
( )
( )
2 0
( )
2 0
( )
( )
ax
( ) e 4 2 3 2
x y
2 3
x y
2 3
x y
2 3
x y
2 3
×
2 3
2 3
4 What is the value of x, when:
a 2 32
x
2 3
2 3
2 3
2 3 b 3
1
27
x
=
5 Expand each expression and simplify if possible.
a 5 2 3 2
( )
5 2
( )
5 2 ( )
3 2
( )
3 2
x x
3 2
x x
( )
x x
5 2
( )
x x
5 2
( ) 3 2
( )
3 2
x x
3 2
( )
− +
( )
− +
5 2
( )
− +
( )
x x
− +
x x
( )
x x
− +
x x
5 2
( )
x x
( )
− +
5 2
( )
5 2
x x
( ) 3 2
( )
3 2
( ) b 5 7 2 2
5 7
x x
5 7y x
2 2
y x
2 2x y
( )
5 7
( )
5 7
5 7
x x
5 7
( )
5 7
x x y x
( )
y x( )
2 2
( )
2 2x y
( )
+ −
y x
+ −
y x
( )
+ −
5 7
( )
+ −
5 7
( )
y x
( )
y x
+ −
( ) x y
( )
x y
( )
6 Find the value of ( ) ( )
( )
x x
( )
( )
+ −
( )
( )
x x
+ −
( )
x x
5 5
( )
5 5
( ) ( )
5 5
( )
x x
5 5
( )
x x
5 5
( )
x x
( )
x x
( )
5 5
x x
+ −
5 5
( )
+ −
5 5
( )
+ −
x x
+ −
x x
5 5
+ −
( )
x x
+ −
x x
5 5
( )
x x
( )
+ −
x x
( )
( )
5 5 when:
a x = 1 b x = 0 c x = 5
7 Simplify and write the answers with positive indices only.
a x x
5 2
x x
5 2
x x
x x
x x
5 2
5 2
x x
5 2
x x
5 2
5 2
5 2
b
8
2
2
4
x
x
c ( )
( )
2 2
( ) 3
( )
( )
( )
2 2
( )
2 2
( )
2 2
( )
2 2 −
8 If x ≠ 0 and y ≠ 0 , simplify:
a 3 5
3 5
1
3 5
3 5
1
2
x x
3 5
x x
3 5
3 5
3 5
x x
3 5
3 5
3 5
x x
3 5
x x b ( )
( )
81
( )
6
( )
( )
1
2
y
( )
( ) c ( )
( )
64
( )
3
( )
( )
1
3
( )
( )
Past paper questions
1 Simplify.
1
2
2
3
3
x
[2]
[Cambridge IGCSE Mathematics 0580 Paper 22 Q6 May/June 2016]
2 a Simplify 3125 125
1
5
t
( ) . [2]
b Find the value of p when 3p
=
1
9
. [1]
c Find the value of w when x72
+ xw
= x8
. [1]
[Cambridge IGCSE Mathematics 0580 Paper 22 Q17 May/June 2014]
e
s
s
-
R
e
v
i
e
w
C
o
p
y
-
C
a
m
b
r
i
d
g
e
U
n
i
v
e
r
s
i
t
y
P
r
e
s
s
-
R
e
v
i
e
w
C
o
p
y
R
e
v
i
e
w
C
o
p
y
-
C
a
m
b
r
i
d
g
e
U
n
i
v
e
r
s
i
t
y
P
r
e
s
s
-
R
e
v
i
e
w
C
o
p
y
R
e
v
i
e
w
C
o
p
y
-
C
a
m
b
r
i
d
g
e
U
n
i
v
e
r
s
i
t
y
P
r
e
s
s
-
R
e
v
i
e
w
C
o
p
y
R
e
v
i
e
w
C
o
p
y
-
C
a
m
b
r
i
d
g
e
U
n
i
v
e
r
s
i
t
y
Copyright Material - Review Only - Not for Redistribution](https://image.slidesharecdn.com/igcsemathematicstextbookfullversion-241104053313-f2eaac1e/85/IGCSE-Mathematics-Textbook-full-version-pdf-54-320.jpg)


![Unit 1: Shape, space and measures
70
6 a Measure this line and construct AB the same length in your book using a ruler and compasses.
A B
b At point A, measure and draw angle BAC, a 75° angle.
c At point B, measure and draw angle ABD, an angle of 125°.
7 a Construct triangle PQR with sides PQ = 4.5cm, QR = 5cm and PR = 7cm.
Past paper questions
1 A regular polygon has an interior angle of 172°.
Find the number of sides of this polygon. [3]
[Cambridge IGCSE Mathematics 0580 Paper 22 Q9 May/June 2016]
2 a
x°
47°
NOT TO
SCALE
Find the value of x. [1]
b
115°
97° y°
85°
NOT TO
SCALE
Find the value of y. [1]
[Cambridge IGCSE Mathematics 0580 Paper 22 Q18 Parts a) and b) February/March 2016]
E
e
s
s
-
R
e
v
i
e
w
C
o
p
y
-
C
a
m
b
r
i
d
g
e
U
n
i
v
e
r
s
i
t
y
P
r
e
s
s
-
R
e
v
i
e
w
C
o
p
y
R
e
v
i
e
w
C
o
p
y
-
C
a
m
b
r
i
d
g
e
U
n
i
v
e
r
s
i
t
y
P
r
e
s
s
-
R
e
v
i
e
w
C
o
p
y
R
e
v
i
e
w
C
o
p
y
-
C
a
m
b
r
i
d
g
e
U
n
i
v
e
r
s
i
t
y
P
r
e
s
s
-
R
e
v
i
e
w
C
o
p
y
R
e
v
i
e
w
C
o
p
y
-
C
a
m
b
r
i
d
g
e
U
n
i
v
e
r
s
i
t
y
Copyright Material - Review Only - Not for Redistribution](https://image.slidesharecdn.com/igcsemathematicstextbookfullversion-241104053313-f2eaac1e/85/IGCSE-Mathematics-Textbook-full-version-pdf-80-320.jpg)


![100 Unit 1: Data handling
Draw a bar chart to show this information.
Complete the scale on the frequency axis. [3]
Frequency
0 1 2 3
Number of goals scored
4 5 6
[Cambridge IGCSE Mathematics 0580 Paper 33 Q1 d(i) October/November 2012]
2 Some children are asked what their favourite sport is.
The results are shown in the pie chart.
Running
Hockey
Tennis
Gymnastics
Swimming
80°
120°
45° 60°
i Complete the statements about the pie chart.
The sector angle for running is ............................ degrees.
The least popular sport is ............................
1
6
of the children chose ............................
Twice as many children chose ............................ as ............................ [4]
ii Five more children chose swimming than hockey.
Use this information to work out the number of children who chose gymnastics. [3]
[Cambridge IGCSE Mathematics 0580 Paper 32 Q5a) October/November 2015]
e
s
s
-
R
e
v
i
e
w
C
o
p
y
-
C
a
m
b
r
i
d
g
e
U
n
i
v
e
r
s
i
t
y
P
r
e
s
s
-
R
e
v
i
e
w
C
o
p
y
R
e
v
i
e
w
C
o
p
y
-
C
a
m
b
r
i
d
g
e
U
n
i
v
e
r
s
i
t
y
P
r
e
s
s
-
R
e
v
i
e
w
C
o
p
y
R
e
v
i
e
w
C
o
p
y
-
C
a
m
b
r
i
d
g
e
U
n
i
v
e
r
s
i
t
y
P
r
e
s
s
-
R
e
v
i
e
w
C
o
p
y
R
e
v
i
e
w
C
o
p
y
-
C
a
m
b
r
i
d
g
e
U
n
i
v
e
r
s
i
t
y
Copyright Material - Review Only - Not for Redistribution](https://image.slidesharecdn.com/igcsemathematicstextbookfullversion-241104053313-f2eaac1e/85/IGCSE-Mathematics-Textbook-full-version-pdf-110-320.jpg)


![121
Unit 2: Number
Examination practice
Exam-style questions
1 Calculate
5
6
1
4
1
8
+
giving your answer as a fraction in its lowest terms.
2 93800 students took an examination.
19% received grade A.
24% received grade B.
31% received grade C.
10% received grade D.
11% received grade E.
The rest received grade U.
a What percentage of the students received grade U?
b What fraction of the students received grade B? Give your answer in its lowest terms.
c How many students received grade A?
3 During one summer there were 27500 cases of Salmonella poisoning in Britain. The next summer there was an
increase of 9% in the number of cases. Calculate how many cases there were in the second year.
4 Abdul’s height was 160cm on his 15th birthday. It was 172cm on his 16th birthday. What was the percentage increase
in his height?
Past paper questions
1 Write 0.0000574 in standard form. [1]
[Cambridge IGCSE Mathematics 0580 Paper 22 Q1 May/June 2016]
2 Do not use a calculator in this question and show all the steps of your working.
Give each answer as a fraction in its lowest terms.
Work out
a
3
4
1
12
− [2]
b 2
1
2
4
25
× [2]
[Cambridge IGCSE Mathematics 0580 Paper 11 Q21 October/November 2013]
3 Calculate 17.5% of 44 kg. [2]
[Cambridge IGCSE Mathematics 0580 Paper 11 Q10 October/November 2013]
4 Without using your calculator, work out
5
3
8
2
1
5
− .
Give your answer as a fraction in its lowest terms.
You must show all your working. [3]
[Cambridge IGCSE Mathematics 0580 Paper 13 Q17 October/November 2012]
5 Samantha invests $600 at a rate of 2% per year simple interest.
Calculate the interest Samantha earns in 8 years. [2]
[Cambridge IGCSE Mathematics 0580 Paper 13 Q5 October/November 2012]
e
s
s
-
R
e
v
i
e
w
C
o
p
y
-
C
a
m
b
r
i
d
g
e
U
n
i
v
e
r
s
i
t
y
P
r
e
s
s
-
R
e
v
i
e
w
C
o
p
y
R
e
v
i
e
w
C
o
p
y
-
C
a
m
b
r
i
d
g
e
U
n
i
v
e
r
s
i
t
y
P
r
e
s
s
-
R
e
v
i
e
w
C
o
p
y
R
e
v
i
e
w
C
o
p
y
-
C
a
m
b
r
i
d
g
e
U
n
i
v
e
r
s
i
t
y
P
r
e
s
s
-
R
e
v
i
e
w
C
o
p
y
R
e
v
i
e
w
C
o
p
y
-
C
a
m
b
r
i
d
g
e
U
n
i
v
e
r
s
i
t
y
Copyright Material - Review Only - Not for Redistribution](https://image.slidesharecdn.com/igcsemathematicstextbookfullversion-241104053313-f2eaac1e/85/IGCSE-Mathematics-Textbook-full-version-pdf-131-320.jpg)
![122 Unit 2: Number
6 Show that
1
10
2
5
0 17
2 2
2
2 2
+
2 2
2 2
2 2
2 2
= 0 1
0 1
Write down all the steps in your working. [2]
[Cambridge IGCSE Mathematics 0580 Paper 13 Q6 October/November 2012]
7 Maria pays $84 rent.
The rent is increased by 5%. Calculate Maria’s new rent. [2]
[Cambridge IGCSE Mathematics 0580 Paper 13 Q10 October/November 2012]
8 Huy borrowed $4500 from a bank at a rate of 5% per year compound interest.
He paid back the money and interest at the end of 2 years.
How much interest did he pay? [3]
[Cambridge IGCSE Mathematics 0580 Paper 13 Q13 May/June 2013]
9 Jasijeet and her brother collect stamps.
When Jasjeet gives her brother 1% of her stamps, she has 2475 stamps left.
Calculate how many stamps Jasjeet had originally [3]
[Cambridge IGCSE Mathematics 0580 Paper 22 Q14 October/November 2014]
10 Without using a calculator, work out 2
5
8
3
7
× .
Show all your working and give your answer as a mixed number in its lowest terms. [3]
[Cambridge IGCSE Mathematics 0580 Paper 22 Q14 May/June 2016]
e
s
s
-
R
e
v
i
e
w
C
o
p
y
-
C
a
m
b
r
i
d
g
e
U
n
i
v
e
r
s
i
t
y
P
r
e
s
s
-
R
e
v
i
e
w
C
o
p
y
R
e
v
i
e
w
C
o
p
y
-
C
a
m
b
r
i
d
g
e
U
n
i
v
e
r
s
i
t
y
P
r
e
s
s
-
R
e
v
i
e
w
C
o
p
y
R
e
v
i
e
w
C
o
p
y
-
C
a
m
b
r
i
d
g
e
U
n
i
v
e
r
s
i
t
y
P
r
e
s
s
-
R
e
v
i
e
w
C
o
p
y
R
e
v
i
e
w
C
o
p
y
-
C
a
m
b
r
i
d
g
e
U
n
i
v
e
r
s
i
t
y
Copyright Material - Review Only - Not for Redistribution](https://image.slidesharecdn.com/igcsemathematicstextbookfullversion-241104053313-f2eaac1e/85/IGCSE-Mathematics-Textbook-full-version-pdf-132-320.jpg)


![Unit 2: Algebra 129
6 Equations and rearranging formulae
Exercise 6.3 1 Factorise.
a 3x + 6 b 15y − 12 c 8 − 16z d 35 + 25t
e 2x − 4 f 3x + 7 g 18k − 64 h 33p + 22
i 2x + 4y j 3p − 15q k 13r − 26s l 2p + 4q + 6r
2 Factorise as fully as possible.
a 21u − 49v + 35w b 3xy + 3x c 3x2
+ 3x d 15pq + 21p
e 9m2
− 33m f 90m3
− 80m2
g 36x3
+ 24x5
h 32p2
q − 4pq2
3 Factorise as fully as possible.
a 14m2
n2
+ 4m3
n3
b 17abc + 30ab2
c c m3
n2
+ 6m2
n2
(8m + n)
d
1
2
3
2
a b
a b
3
a b
a b
a b e
3
4
7
8
4
x x
x x
+
x x
x x f 3(x − 4) + 5(x − 4)
g 5(x + 1)2
− 4(x + 1)3
h 6x3
+ 2x4
+ 4x5
i 7x3
y – 14x2
y2
+ 21xy2
j x(3 + y) + 2(y + 3)
6.4 Rearrangement of a formula
Very often you will find that a formula is expressed with one variable written alone on one side
of the ‘=’ symbol (usually on the left but not always). The variable that is written alone is known
as the subject of the formula.
Consider each of the following formulae:
s ut at
= +
ut
= +
1
2
2
(s is the subject)
F = ma (F is the subject)
x
b b
b b ac
a
=
− ±
b b
− ±
b b −
2
4
2
(x is the subject)
Now that you can recognise the subject of a formula, you must look at how you change the
subject of a formula. If you take the formula v = u + at and note that v is currently the subject,
you can change the subject by rearranging the formula.
To make a the subject of this formula:
v = u + at Write down the starting formula.
v − u = at Subtract u from both sides (to isolate the term containing a).
Once you have taken a common
factor out, you may be left with
an expression that needs to be
simplified further.
You will look again at rearranging
formulae in chapter 22.
FAST FORWARD
Another word sometimes used
for changing the subject is
‘transposing’.
Make sure that you have taken
out all the common factors. If
you don’t, then your algebraic
expression is not fully factorised.
Take care to put in all the bracket
symbols.
c 36p2
q − 24pq2
The HCF of 36 and 24 = 12 and p2
q and pq2
have
common factor pq.
36p2
q − 24pq2
= 12pq(3p − 2q) Because 12pq × 3p = 36p2
q and
12pq × −2q = − 24pq2
.
Sometimes, the terms can have an expression in brackets that is common to
both terms.
d 15(x − 2) − 20(x − 2)3
The HCF of 15 and 20 is 5 and the HCF of
(x − 2) and (x − 2)3
is (x − 2).
15(x − 2) − 20(x − 2)3
=
5(x − 2)[3 − 4(x − 2)2
]
Because 5(x − 2) × 3 = 15(x − 2) and
5(x − 2) × 4(x − 2)2
= 20(x − 2)3
.
e
s
s
-
R
e
v
i
e
w
C
o
p
y
-
C
a
m
b
r
i
d
g
e
U
n
i
v
e
r
s
i
t
y
P
r
e
s
s
-
R
e
v
i
e
w
C
o
p
y
R
e
v
i
e
w
C
o
p
y
-
C
a
m
b
r
i
d
g
e
U
n
i
v
e
r
s
i
t
y
P
r
e
s
s
-
R
e
v
i
e
w
C
o
p
y
R
e
v
i
e
w
C
o
p
y
-
C
a
m
b
r
i
d
g
e
U
n
i
v
e
r
s
i
t
y
P
r
e
s
s
-
R
e
v
i
e
w
C
o
p
y
R
e
v
i
e
w
C
o
p
y
-
C
a
m
b
r
i
d
g
e
U
n
i
v
e
r
s
i
t
y
Copyright Material - Review Only - Not for Redistribution](https://image.slidesharecdn.com/igcsemathematicstextbookfullversion-241104053313-f2eaac1e/85/IGCSE-Mathematics-Textbook-full-version-pdf-139-320.jpg)


![Unit 2: Algebra
132
Examination practice
Exam-style questions
1 Given that T = 3p − 5, calculate T when p = 12.
2 In mountaineering, in general, the higher you go, the colder it gets. This formula shows how the height and
temperature are related.
Temperature drop ( C)
height increase (m)
° =
C)
° =
200
a If the temperature at a height of 500m is 23°C, what will it be when you climb to 1300m?
b How far would you need to climb to experience a temperature drop of 5°C?
3 The formula e = 3n can be used to relate the number of sides (n) in the base of a prism to the number of edges (e)
that the prism has.
a Make n the subject of the formula.
b Find the value of n for a prism with 21 edges.
Past paper questions
1 Factorise 2x − 4xy. [2]
[Cambridge IGCSE Mathematics 0580 Paper 22 Q2 Feb/March 2016]
2 Make r the subject of this formula.
v p r
= +
= +
p r
= +
p r
3
= +
= + [2]
[Cambridge IGCSE Mathematics 0580 Paper 22 Q5 October/November 2014]
3 Expand the brackets. y(3 − y3
) [2]
[Cambridge IGCSE Mathematics 0580 Paper 13 Q9 October/November 2012]
4 Factorise completely. 4xy + 12yz [2]
[Cambridge IGCSE Mathematics 0580 Paper 13 Q13 October/November 2012]
5 Solve the equation. 5(2y − 17) = 60 [3]
[Cambridge IGCSE Mathematics 0580 Paper 22 Q12 May/June 2013]
6 Solve the equation (3x − 5) = 16. [2]
[Cambridge IGCSE Mathematics 0580 Paper 13 Q5 May/June 2013]
7 Factorise completely. 6xy2
+ 8y [2]
[Cambridge IGCSE Mathematics 0580 Paper 13 Q9 May/June 2013]
E
e
s
s
-
R
e
v
i
e
w
C
o
p
y
-
C
a
m
b
r
i
d
g
e
U
n
i
v
e
r
s
i
t
y
P
r
e
s
s
-
R
e
v
i
e
w
C
o
p
y
R
e
v
i
e
w
C
o
p
y
-
C
a
m
b
r
i
d
g
e
U
n
i
v
e
r
s
i
t
y
P
r
e
s
s
-
R
e
v
i
e
w
C
o
p
y
R
e
v
i
e
w
C
o
p
y
-
C
a
m
b
r
i
d
g
e
U
n
i
v
e
r
s
i
t
y
P
r
e
s
s
-
R
e
v
i
e
w
C
o
p
y
R
e
v
i
e
w
C
o
p
y
-
C
a
m
b
r
i
d
g
e
U
n
i
v
e
r
s
i
t
y
Copyright Material - Review Only - Not for Redistribution](https://image.slidesharecdn.com/igcsemathematicstextbookfullversion-241104053313-f2eaac1e/85/IGCSE-Mathematics-Textbook-full-version-pdf-142-320.jpg)


![Unit 2: Shape, space and measures
158
Examination practice
Exam-style questions
1 A piece of rope is wound around a cylindrical pipe 18 times. If the diameter of the pipe is 600mm, how long is the rope?
2 Find the perimeter and area of this shape.
9 cm
1 cm
1 cm
NOT TO
SCALE
6 cm
3 A cylindrical rainwater tank is 1.5m tall with a diameter of 1.4m. What is the maximum volume of rainwater it can hold?
Past paper questions
1 This diagram shows the plan of a driveway to a house.
18 m
12 m
14 m
3 m
HOUSE
NOT TO
SCALE
a Work out the perimeter of the driveway. [2]
b The driveway is made from concrete. The concrete is 15 cm thick. Calculate the volume of concrete
used for the driveway. Give your answer in cubic metres. [4]
[Cambridge IGCSE Mathematics 0580 Paper 33 Q8 d, e October/November 2012]
2 12 cm
22 cm
10 cm
NOT TO
SCALE
Find the area of the trapezium. [2]
[Cambridge IGCSE Mathematics 0580 Paper 22 Q7 October/November 2013]
e
s
s
-
R
e
v
i
e
w
C
o
p
y
-
C
a
m
b
r
i
d
g
e
U
n
i
v
e
r
s
i
t
y
P
r
e
s
s
-
R
e
v
i
e
w
C
o
p
y
R
e
v
i
e
w
C
o
p
y
-
C
a
m
b
r
i
d
g
e
U
n
i
v
e
r
s
i
t
y
P
r
e
s
s
-
R
e
v
i
e
w
C
o
p
y
R
e
v
i
e
w
C
o
p
y
-
C
a
m
b
r
i
d
g
e
U
n
i
v
e
r
s
i
t
y
P
r
e
s
s
-
R
e
v
i
e
w
C
o
p
y
R
e
v
i
e
w
C
o
p
y
-
C
a
m
b
r
i
d
g
e
U
n
i
v
e
r
s
i
t
y
Copyright Material - Review Only - Not for Redistribution](https://image.slidesharecdn.com/igcsemathematicstextbookfullversion-241104053313-f2eaac1e/85/IGCSE-Mathematics-Textbook-full-version-pdf-168-320.jpg)
![159
Unit 2: Shape, space and measures
3 12 cm
A hemisphere has a radius of 12 cm.
Calculate its volume.
[The volume, V, of a sphere with radius r isV r
V r
V r
V r
4
V r
V r
3
3
π
V r
V r .] [2]
[Cambridge IGCSE Mathematics 0580 Paper 22 Q8 October/November 2013]
4 Calculate the volume of a hemisphere with radius 5 cm.
[The volume, V, of a sphere with radius r isV r
V r
V r
V r
4
V r
V r
3
3
π
V r
V r .] [2]
[Cambridge IGCSE Mathematics 0580 Paper 22 Q5 October/November 2015]
5
NOT TO
SCALE
15 cm
26°
The diagram shows a sector of a circle with radius 15 cm.
Calculate the perimeter of this sector. [3]
[Cambridge IGCSE Mathematics 0580 Paper 22 Q16 October/November 2015]
E
e
s
s
-
R
e
v
i
e
w
C
o
p
y
-
C
a
m
b
r
i
d
g
e
U
n
i
v
e
r
s
i
t
y
P
r
e
s
s
-
R
e
v
i
e
w
C
o
p
y
R
e
v
i
e
w
C
o
p
y
-
C
a
m
b
r
i
d
g
e
U
n
i
v
e
r
s
i
t
y
P
r
e
s
s
-
R
e
v
i
e
w
C
o
p
y
R
e
v
i
e
w
C
o
p
y
-
C
a
m
b
r
i
d
g
e
U
n
i
v
e
r
s
i
t
y
P
r
e
s
s
-
R
e
v
i
e
w
C
o
p
y
R
e
v
i
e
w
C
o
p
y
-
C
a
m
b
r
i
d
g
e
U
n
i
v
e
r
s
i
t
y
Copyright Material - Review Only - Not for Redistribution](https://image.slidesharecdn.com/igcsemathematicstextbookfullversion-241104053313-f2eaac1e/85/IGCSE-Mathematics-Textbook-full-version-pdf-169-320.jpg)


![171
Unit 2: Data handling
Past paper questions
1 A letter is chosen at random from the following word.
S T A T I S T I C S
Write down the probability that the letter is
a Aor I, [1]
b E. [1]
[Cambridge IGCSE Mathematics 0580 Paper 12 Q3 May/June 2011]
2 Omar rolls two fair dice, each numbered from 1 to 6, and adds the numbers shown.
He repeats the experiment 70 times and records the results in a frequency table.
The first 60 results are shown in the tally column of the table.
The last 10 results are 6, 8, 9, 2, 6, 4, 7, 9, 6, 10.
Frequency
Tally
Total
2
3
4
5
6
7
8
9
10
11
12
a i Complete the frequency table to show all his results. [2]
ii Write down the relative frequency of a total of 5. [3]
[Cambridge IGCSE Mathematics 0580 Paper 33 Q6 a May/June 2013]
3
S P A C E S
One of the 6 letters is taken at random.
a Write down the probability that the letter is S. [1]
b The letter is replaced and again a letter is taken at random. This is repeated 600 times.
How many times would you expect the letter to be S? [1]
[Cambridge IGCSE Mathematics 0580 Paper 11 Q14 October/November 2013]
e
s
s
-
R
e
v
i
e
w
C
o
p
y
-
C
a
m
b
r
i
d
g
e
U
n
i
v
e
r
s
i
t
y
P
r
e
s
s
-
R
e
v
i
e
w
C
o
p
y
R
e
v
i
e
w
C
o
p
y
-
C
a
m
b
r
i
d
g
e
U
n
i
v
e
r
s
i
t
y
P
r
e
s
s
-
R
e
v
i
e
w
C
o
p
y
R
e
v
i
e
w
C
o
p
y
-
C
a
m
b
r
i
d
g
e
U
n
i
v
e
r
s
i
t
y
P
r
e
s
s
-
R
e
v
i
e
w
C
o
p
y
R
e
v
i
e
w
C
o
p
y
-
C
a
m
b
r
i
d
g
e
U
n
i
v
e
r
s
i
t
y
Copyright Material - Review Only - Not for Redistribution](https://image.slidesharecdn.com/igcsemathematicstextbookfullversion-241104053313-f2eaac1e/85/IGCSE-Mathematics-Textbook-full-version-pdf-181-320.jpg)
![Unit 2: Data handling
172
4 Kiah plays a game.
The game involves throwing a coin onto a circular board.
Points are scored for where the coin lands on the board.
20
10
5
If the coin lands on part of a line or misses the board then 0 points are scored.
The table shows the probabilities of Kiah scoring points on the board with one throw.
Points scored 20 10 5 0
Probability x 0.2 0.3 0.45
a Find the value of x. [2]
b Kiah throws a coin fifty times.
Work out the expected number of times she scores 5 points. [1]
c Kiah throws a coin two times.
Calculate the probability that
i she scores either 5 or 0 with her first throw, [2]
ii she scores 0 with her first throw and 5 with her scond throw, [2]
iii she scores a total of 15 points with her two throws. [3]
d Kiah throws a coin three times.
Calculate the probability that she scores a total of 10 points with her three throws. [5]
[Cambridge IGCSE Mathematics 0580 Paper 42 Q5 May/June 2016]
5 Dan either walks or cycles to school.
The probability that he cycles to school is
1
3
.
a Write down the probability that Dan walks to school. [1]
b There are 198 days in a school year.
Work out the expected number of days that Dan cycles to school in a school year. [1]
[Cambridge IGCSE Mathematics 0580 Paper 12 Q9 February/March 2016]
e
s
s
-
R
e
v
i
e
w
C
o
p
y
-
C
a
m
b
r
i
d
g
e
U
n
i
v
e
r
s
i
t
y
P
r
e
s
s
-
R
e
v
i
e
w
C
o
p
y
R
e
v
i
e
w
C
o
p
y
-
C
a
m
b
r
i
d
g
e
U
n
i
v
e
r
s
i
t
y
P
r
e
s
s
-
R
e
v
i
e
w
C
o
p
y
R
e
v
i
e
w
C
o
p
y
-
C
a
m
b
r
i
d
g
e
U
n
i
v
e
r
s
i
t
y
P
r
e
s
s
-
R
e
v
i
e
w
C
o
p
y
R
e
v
i
e
w
C
o
p
y
-
C
a
m
b
r
i
d
g
e
U
n
i
v
e
r
s
i
t
y
Copyright Material - Review Only - Not for Redistribution](https://image.slidesharecdn.com/igcsemathematicstextbookfullversion-241104053313-f2eaac1e/85/IGCSE-Mathematics-Textbook-full-version-pdf-182-320.jpg)


![195
Unit 3: Number
Examination practice
Exam-style questions
1 Pattern 1 Pattern 2 Pattern 3
The first three patterns in a sequence are shown above.
a Copy and complete the table.
Pattern number (n) 1 2 3 4
Number of dots (d) 5
b Find a formula for the number of dots, d, in the nth
pattern.
c Find the number of dots in the 60th
pattern.
d Find the number of the pattern that has 89 dots.
2 The diagram below shows a sequence of patterns made from dots and lines.
1 dot 2 dots 3 dots
a Draw the next pattern in the sequence.
b Copy and complete the table for the numbers of dots and lines.
Dots 1 2 3 4 5 6
Lines 4 7 10
c How many lines are in the pattern with 99 dots?
d How many lines are in the pattern with n dots?
e Complete the following statement:
There are 85 lines in the pattern with . . . dots.
Past paper questions
1 a Here are the first four terms of a sequence:
27 23 19 15
i Write down the next term in the sequence. [1]
ii Explain how you worked out your answer to part (a)(i). [1]
b The nth term of a different sequence is 4n – 2.
Write down the first three terms of this sequence. [1]
c Here are the first four terms of another sequence:
–1 2 5 8
Write down the nth term of this sequence. [2]
[Cambridge IGCSE Mathematics 0580 Paper 11 Q23 October/November 2013]
e
s
s
-
R
e
v
i
e
w
C
o
p
y
-
C
a
m
b
r
i
d
g
e
U
n
i
v
e
r
s
i
t
y
P
r
e
s
s
-
R
e
v
i
e
w
C
o
p
y
R
e
v
i
e
w
C
o
p
y
-
C
a
m
b
r
i
d
g
e
U
n
i
v
e
r
s
i
t
y
P
r
e
s
s
-
R
e
v
i
e
w
C
o
p
y
R
e
v
i
e
w
C
o
p
y
-
C
a
m
b
r
i
d
g
e
U
n
i
v
e
r
s
i
t
y
P
r
e
s
s
-
R
e
v
i
e
w
C
o
p
y
R
e
v
i
e
w
C
o
p
y
-
C
a
m
b
r
i
d
g
e
U
n
i
v
e
r
s
i
t
y
Copyright Material - Review Only - Not for Redistribution](https://image.slidesharecdn.com/igcsemathematicstextbookfullversion-241104053313-f2eaac1e/85/IGCSE-Mathematics-Textbook-full-version-pdf-205-320.jpg)
![Unit 3: Number
196
2 Shade the required region on each Venn diagram. [2]
A B A B
A′ ∪ B A′ ∩ B′
[Cambridge IGCSE Mathematics 0580 Paper 22 Q1 May/June 2013]
3 The first five terms of a sequence are shown below.
13 9 5 1 –3
Find the nth term of this sequence. [2]
[Cambridge IGCSE Mathematics 0580 Paper 22 Q3 May/June 2013]
4 Shade the required region in each of the Venn diagrams. [2]
P Q
R
(P ∩ R) ∪ Q
A B
A′
[Cambridge IGCSE Mathematics 0580 Paper 23 Q9 October/November 2012]
5 Shade the region required in each Venn diagrams. [2]
A B A B
(A ∪ B)′ A′ ∩ B
[Cambridge IGCSE Mathematics 0580 Paper 22 Q4 October/November 2014]
6 The Venn diagram shows the number of students who study French (F), Spanish (S) and Arabic (A).
F S
A
7 4
1
2 3
5
8
0
a Find n(A ∪ (F ∩ S)). [1]
b On the Venn diagram, shade the region F' ∩ S. [1]
[Cambridge IGCSE Mathematics 0580 Paper 22 Q6 October/November 2015]
E
E
e
s
s
-
R
e
v
i
e
w
C
o
p
y
-
C
a
m
b
r
i
d
g
e
U
n
i
v
e
r
s
i
t
y
P
r
e
s
s
-
R
e
v
i
e
w
C
o
p
y
R
e
v
i
e
w
C
o
p
y
-
C
a
m
b
r
i
d
g
e
U
n
i
v
e
r
s
i
t
y
P
r
e
s
s
-
R
e
v
i
e
w
C
o
p
y
R
e
v
i
e
w
C
o
p
y
-
C
a
m
b
r
i
d
g
e
U
n
i
v
e
r
s
i
t
y
P
r
e
s
s
-
R
e
v
i
e
w
C
o
p
y
R
e
v
i
e
w
C
o
p
y
-
C
a
m
b
r
i
d
g
e
U
n
i
v
e
r
s
i
t
y
Copyright Material - Review Only - Not for Redistribution](https://image.slidesharecdn.com/igcsemathematicstextbookfullversion-241104053313-f2eaac1e/85/IGCSE-Mathematics-Textbook-full-version-pdf-206-320.jpg)
![197
Unit 3: Number
7 Layer 1
Layer 2
Layer 3
The diagrams show layers of white and grey cubes.
Khadega places these layers on top of each other to make a tower.
a Complete the table for towers with 5 and 6 layers.
Number of layers 1 2 3 4 5 6
Total number of white cubes 0 1 6 15
Total number of grey cubes 1 5 9 13
Total number of cubes 1 6 15 28 [4]
b i Find, in terms of n, the total number of grey cubes in a tower with n layers. [2]
ii Find the total number of grey cubes in a tower with 60 layers. [1]
iii Khadega has plenty of white cubes but only 200 grey cubes.
How many layers are there in the highest tower that she can build? [2]
[Cambridge IGCSE Mathematics 0580 Paper 42 Q9 (a) (b) October/November 2014]
8 Write the recurring decimal 0.36
.
as a fraction.
Give your answer in its simplest form.
[0.36
.
means 0.3666…] [3]
[Cambridge IGCSE Mathematics 0580 Paper 22 Q12 May/June 2016]
E
e
s
s
-
R
e
v
i
e
w
C
o
p
y
-
C
a
m
b
r
i
d
g
e
U
n
i
v
e
r
s
i
t
y
P
r
e
s
s
-
R
e
v
i
e
w
C
o
p
y
R
e
v
i
e
w
C
o
p
y
-
C
a
m
b
r
i
d
g
e
U
n
i
v
e
r
s
i
t
y
P
r
e
s
s
-
R
e
v
i
e
w
C
o
p
y
R
e
v
i
e
w
C
o
p
y
-
C
a
m
b
r
i
d
g
e
U
n
i
v
e
r
s
i
t
y
P
r
e
s
s
-
R
e
v
i
e
w
C
o
p
y
R
e
v
i
e
w
C
o
p
y
-
C
a
m
b
r
i
d
g
e
U
n
i
v
e
r
s
i
t
y
Copyright Material - Review Only - Not for Redistribution](https://image.slidesharecdn.com/igcsemathematicstextbookfullversion-241104053313-f2eaac1e/85/IGCSE-Mathematics-Textbook-full-version-pdf-207-320.jpg)


![Unit 3: Algebra 219
10 Straight lines and quadratic equations
Squaring a binomial
(x + y)2
means (x + y)(x + y)
To find the product, you can use the method you learned earlier.
(x + y)(x + y) = x2
+ xy + xy + y2
= x2
+ 2xy + y2
However, if you think about this, you should be able to solve these kinds of expansions by
inspection. Look at the answer. Can you see that:
• the first term is the square of the first term (x2
)
• the middle term is twice the product of the middle terms (2xy)
• the last term is the square of the last term (y2
)?
Exercise 10.9 1 Find the square of each binomial. Try to do this by inspection first and then check
your answers.
a (x − y)2
b a b
a b
a b
( )2
c 2 3
2
x y
2 3
x y
2 3
2 3
2 3
2 3
x y
2 3
x y
( ) d 3 2
2
x y
3 2
x y
3 2
3 2
x y
3 2
x y
( )
e x y
+
x y
x y
( )
2
x y
x y
2
f ( )
y x
( )
y x
y x
( )
( )
( )
y x
( )
y x
( )
( )
( )2
g
2
( )
x y
( )
2 2
( )
x y
x y
( ) h
2
( )
2
( )
3
( )
+
( )
( )
( )
i ( )
− −
( )
( )
2 4
( )
− −
( )
2 4
− −
( )
( )
( )2
( )
x y
( )
( )
2 4
( )
x y
( )
2 4
− −
( )
2 4
( )
x y
− −
( )
− −
2 4
( ) j
1
2
1
4
2
x y
4
x y
−
k
3
4 2
2
x y
−
l a b
a b
a b
a b
1
a b
a b
2
2
m ( )
− −
( )
( )
ab
( )
− −
( )
ab
− −
( )
( )
( )
( )
( )2
n
2
( )
3 1
( )
2
( )
3 1
3 1
( )
x y
( )
3 1
x y
3 1
( )
x y
3 1
3 1
( ) o
2
3
4
2
x
y
+
p [ ]
− −
[ ]
( )
[ ]
− −
( )
− −
[ ]
( )
( )
[ ]
( )
[ ]
− −
( )
[ ]
( )
− −
( )
− −
[ ]
( )
( )
[ ]
( )
[ ]2
2 Simplify.
a x x
( )
x x
( )
x x
x x
x x
( ) ( )
x x
( )
x x
2 4
x x
2 4
( )
2 4
( )
x x
( )
x x
2 4
x x
( )
x x
− −
x x
2 4
− −
( )
2 4
( )
x x
( )
x x
2 4
( )
− −
( )
2 4
( )
x x
− −
( )
x x
− −
2 4
− −
x x
( )
− −
2 2
( )
2 2
2 4
2 2
2 4
( )
2 4
( )
2 2
2 4 b (x + 2)(x − 2) − (3 − x)(5 + x)
c y x x y y x
+
y x
y x
( ) + −
x y
+ −
x y
( ) − +
y x
− +
y x
( )
2 2
+ −
2 2
+ −
2 2
y x
2 2
y x)
2 2
+ −
2 2
(
2 2
+ −
+ −
2 2 2
y x
y x
2
2 2
2 2 d
1
2 3
2
x
( )
3 2
( )
3 2
3 2
( )
3 2
3 2
( ) +
e 3(x + 2)(2x + 0.6) f ( )
( )( )
( )
2 2
( )
2 2
( )( )
2 2
( )
( )
2 2 4
2
x y
( )
x y
( )
( )
2 2
x y
( )
2 2x y
( )
x y
( ) x y
( )
− +
( )
2 2
− +
( )
2 2
− +
2 2
( )
2 2
( )
− +
2 2
( )
2 2
− +
2 2
( )
2 2
x y
( )
2 2
− +
( )
2 2
( )
x y
2 2
( )
x y
( )
− +
( )
x y − −
4
− −
x y
− −
x y
− −
(
− −
− − )
g ( )
x x
( )
x x
+
( )
x x
x x
( )( )− −
( )
x
( )
4 5
x x
4 5
( )
4 5
( )
x x
( )
x x
4 5
x x
( )( )
4 5
( )
x x
( )
x x
4 5
( )
−
( )
4 5
( ) 2 1
− −
2 1
− −
( )
2 1
( )
x
( )
2 1
( )
− −
( )
− −
2 1
( )
x
− −
( )
− −
2 1
− −
( )
− − 2
h 2 2 2 4
2 2
2 2
2 2
2 2 2 4
2 2
x y
2 2
x y
2 2
x y
2 2
x y
2 2 x y
2 4
x y
2 4
x y
2 4
x y
2 4
2 2
x y
2 2
x y
( )
2 2
2 2
2 2
+ −
2 2
2 2
x y
2 2
+ −
2 2
x y
(
2 2
2 2
2 2
2 2
2 2
2 2
2 2
2 2
2 2
+ −
2 2
+ − )
2 2
2 2
+
x y
x y
(
2 2
2 2
)
2 4
2 4
2 2
2 2
2 4
2 2
2 4
2 2
2 4
− +
2 4
2 4
x y
2 4
− +
2 4
x y
2 4
− +
2 4
2 4
2 4
2 2
2 2
2 4
2 2
2 4
2 2
(
2 4
− +
2 4
− + )
2 2
2 2
i − +
( ) − −
( )
− −
( )
− − ( )
2 1
− +
2 1
− +
( )
2 1
( )
− +
( )
− +
2 1
( ) 5 3
( )
5 3
( )( )
5 3
( )
2
x x
( )
x x
( )
− +
2 1
x x
− +
2 1
− +
( )
− +
2 1
( )
x x
− +
( )
− +
2 1
( ) ( )
x x
( )
( )
x x
( )
− −
( )
x x
− −
( )
5 3
x x
( )
5 3
( )
x x
5 3
( )
5 3
( )
x x
5 3
−
( )
5 3
( )
x x
( )
5 3
( ) j 5 5
2
( )
3 2
( )
3 2
3 2
( ) − +
5 5
− +
( )
5 5
( )
5 5 2
( )
− +
( )
5 5
− +
( )
5 5
− +
x x
5 5
x x
( )
x x
( ) − +
x x
5 5
− +
x x
− +
( )
x x
( )
5 5
( )
5 5
x x
( )
− +
( )
x x
− +
( )
5 5
− +
( )
5 5
− +
x x
− +
5 5
( )
− +
3 Evaluate each expression when x = 4.
a x
( )
x x
( )
x x
+
( )
x x
x x
( )( )−
7 7
x x
7 7
( )
7 7
( )
x x
( )
x x
7 7
x x
( )( )
7 7
( )
x x
( )
x x
7 7
( )
−
( )
7 7
( ) 2
b x x
2
3 3
x x
− −
x x
( )
x x
( )
x x 3 3
( )
3 3
− −
( )
x x
− −
( )
x x
− − ( )
3 3
( )
3 3
x
3 3
( )
3 3
3 3
3 3
( )
c 2
( )
3 2
( )
3 2
3 2
( ) − +
( )
2 3
( )
− +
( )
− +
2 3
− +
2 3
( )
− + ( )
2 3
( )
2 3
2 3
( )
x x
( )
x x
( ) − +
x x
( )
x x
2 3
( )
x x
2 3
( )
− +
( )
− +
x x
( )
2 3
− +
( )
− +
x x
2 3
− +
2 3
( )
− + 2 3
( )
2 3
( ) d ( )
x
( )
( )
+
( )
( )
( )2
e 3 4
x x
3 4
( )
x x
( )
x x
2
( )
3 4
( )
3 4
x x
3 4
x x
( )
x x
3 4
+
( )
x x
x x
( )( )
3 4
( )
3 4
x x
3 4
( )
x x
3 4
3 4
3 4
( ) f 4 1
2
x x
( )
2 3
( )
x x
( )
x x
2 3
x x
2 3
( )
x x
2 3
2 3
( )
2 3
x x
2 3
x x
( )
x x
2 3
x x
− +
4 1
− +
x x
− +
x x
4 1
x x
− +
x x
( )
4 1
( )
4 1
x x
( )
x x
4 1
− +
4 1
( )
4 1
− +
4 1
x x
4 1
− +
x x
( )
4 1
x x
4 1
− +
x x ( )
2 3
( )
x
( )
2 3
2 3
( )
Factorising quadratic expressions
Look again at the expansion of (x + 2)(x + 9), which gave x x
2
11 18
+ +
x x
+ +
x x
11
+ +
x x
11
x x
+ +
11 :
x x x x
+
( ) +
( ) = + +
2 9 11 18
2
2 × 9 = 18
2 + 9 = 11
Here the two numbers add to give the coefficient of x in the final expression and the two
numbers multiply to give the constant term.
E
e
s
s
-
R
e
v
i
e
w
C
o
p
y
-
C
a
m
b
r
i
d
g
e
U
n
i
v
e
r
s
i
t
y
P
r
e
s
s
-
R
e
v
i
e
w
C
o
p
y
R
e
v
i
e
w
C
o
p
y
-
C
a
m
b
r
i
d
g
e
U
n
i
v
e
r
s
i
t
y
P
r
e
s
s
-
R
e
v
i
e
w
C
o
p
y
R
e
v
i
e
w
C
o
p
y
-
C
a
m
b
r
i
d
g
e
U
n
i
v
e
r
s
i
t
y
P
r
e
s
s
-
R
e
v
i
e
w
C
o
p
y
R
e
v
i
e
w
C
o
p
y
-
C
a
m
b
r
i
d
g
e
U
n
i
v
e
r
s
i
t
y
Copyright Material - Review Only - Not for Redistribution](https://image.slidesharecdn.com/igcsemathematicstextbookfullversion-241104053313-f2eaac1e/85/IGCSE-Mathematics-Textbook-full-version-pdf-229-320.jpg)


![Unit 3: Algebra
224
Examination practice
Exam-style questions
1 Expand and simplify each of the following.
a (x + 2)(x + 18) b (2x + 3)(2x − 3) c ( )( )
( )
4 3
( )( )
3 1
( )
2 2
( )
2 2
( )( )
2 2
( )
( )
4 3
( )
2 2
( )
4 3 ( )
3 1
( )
2 2
( )
3 1
y y
( )
y y
( )( )
y y
( )
( )
4 3
( )
y y
( )
4 3 ( )
3 1
( )
y y
( )
3 1
− +
( )
− +
( )
− +
( )
4 3
( )
− +
4 3 ( )
3 1
( )
− +
( )
3 1
2 2
− +
( )
2 2
− +
2 2
( )
2 2
− +
2 2
( )
4 3
( )
2 2
4 3
− +
4 3
( )
2 2
4 3 ( )
3 1
( )
2 2
( )
3 1
− +
3 1
( )
2 2
3 1
y y
− +
( )
y y
− +
y y
( )
y y
− +
y y
( )
4 3
( )
y y
4 3
− +
( )
4 3
( )
y y
4 3 ( )
3 1
( )
y y
( )
3 1
− +
3 1
( )
y y
3 1
2 a Factorise each of the following.
i 12 6
2
x x
6
x x
x x
x x ii y y
2
13
y y
13
y y 42
− +
y y
− +
y y
13
− +
y y
13
y y
− +
13 iii d2
196
−
b Solve the following equations.
i 12 6 0
2
x x
6 0
x x
6 0
6 0
− =
6 0
x x
− =
x x
6 0
x x
6 0
− =
x x ii y y
2
13
y y
13
y y 30 12
− +
y y
− +
y y
13
− +
y y
13
y y
− +
13 = − iii d2
196 0
− =
196
− =
Past paper questions
1
x
y
5
0
4
3
2
1
B
L
2
1
–2
–3
–4
–5
–6 –1
–2
–3
–4
4
3 6
5
–1
a On the grid mark the point (5, 1). Label it A. [1]
b Write down the co-ordinates of the point B. [1]
c Find the gradient of the line L. [2]
[Cambridge IGCSE Mathematics 0580 Paper 13 Q19 October/November 2012]
e
s
s
-
R
e
v
i
e
w
C
o
p
y
-
C
a
m
b
r
i
d
g
e
U
n
i
v
e
r
s
i
t
y
P
r
e
s
s
-
R
e
v
i
e
w
C
o
p
y
R
e
v
i
e
w
C
o
p
y
-
C
a
m
b
r
i
d
g
e
U
n
i
v
e
r
s
i
t
y
P
r
e
s
s
-
R
e
v
i
e
w
C
o
p
y
R
e
v
i
e
w
C
o
p
y
-
C
a
m
b
r
i
d
g
e
U
n
i
v
e
r
s
i
t
y
P
r
e
s
s
-
R
e
v
i
e
w
C
o
p
y
R
e
v
i
e
w
C
o
p
y
-
C
a
m
b
r
i
d
g
e
U
n
i
v
e
r
s
i
t
y
Copyright Material - Review Only - Not for Redistribution](https://image.slidesharecdn.com/igcsemathematicstextbookfullversion-241104053313-f2eaac1e/85/IGCSE-Mathematics-Textbook-full-version-pdf-234-320.jpg)
![225
Unit 3: Algebra
2 y
x
l
P
0
NOT TO
SCALE
The equation of the line l in the diagram is y = 5 − x.
a The line cuts the y-axis at P.
Write down the co-ordinates of P. [1]
b Write down the gradient of the line l. [1]
[Cambridge IGCSE Mathematics 0580 Paper 22 Q5 May/June 2014]
3 Factorise
9w2
− 100,
[Cambridge IGCSE Mathematics 0580 Paper 22 Q15 (a) October/November 2015]
4 Factorise
mp + np − 6mq − 6nq. [2]
[Cambridge IGCSE Mathematics 0580 Paper 22 Q15(b) October/November 2015]
E
e
s
s
-
R
e
v
i
e
w
C
o
p
y
-
C
a
m
b
r
i
d
g
e
U
n
i
v
e
r
s
i
t
y
P
r
e
s
s
-
R
e
v
i
e
w
C
o
p
y
R
e
v
i
e
w
C
o
p
y
-
C
a
m
b
r
i
d
g
e
U
n
i
v
e
r
s
i
t
y
P
r
e
s
s
-
R
e
v
i
e
w
C
o
p
y
R
e
v
i
e
w
C
o
p
y
-
C
a
m
b
r
i
d
g
e
U
n
i
v
e
r
s
i
t
y
P
r
e
s
s
-
R
e
v
i
e
w
C
o
p
y
R
e
v
i
e
w
C
o
p
y
-
C
a
m
b
r
i
d
g
e
U
n
i
v
e
r
s
i
t
y
Copyright Material - Review Only - Not for Redistribution](https://image.slidesharecdn.com/igcsemathematicstextbookfullversion-241104053313-f2eaac1e/85/IGCSE-Mathematics-Textbook-full-version-pdf-235-320.jpg)


![Unit 3: Shape, space and measures
252
E
Past paper questions
1
5 cm
8 cm
x cm
NOT TO
SCALE
Calculate the value of x. [3]
[Cambridge IGCSE Mathematics 0580 Paper 22 Q11 October/November 2015]
2 NOT TO
SCALE
The two containers are mathematically similar in shape.
The larger container has a volume of 3456cm3
and a surface area of 1024cm2
.
The smaller container has a volume of 1458cm3
.
Calculate the surface area of the smaller container. [4]
[Cambridge IGCSE Mathematics 0580 Paper 22 Q18 May/June 2014]
3
25 cm
x cm
15 cm
7.2 cm
NOT TO
SCALE
The diagram shows two jugs that are mathematically similar.
Find the value of x. [2]
[Cambridge IGCSE Mathematics 0580 Paper 22 Q21 October/November 2015]
e
s
s
-
R
e
v
i
e
w
C
o
p
y
-
C
a
m
b
r
i
d
g
e
U
n
i
v
e
r
s
i
t
y
P
r
e
s
s
-
R
e
v
i
e
w
C
o
p
y
R
e
v
i
e
w
C
o
p
y
-
C
a
m
b
r
i
d
g
e
U
n
i
v
e
r
s
i
t
y
P
r
e
s
s
-
R
e
v
i
e
w
C
o
p
y
R
e
v
i
e
w
C
o
p
y
-
C
a
m
b
r
i
d
g
e
U
n
i
v
e
r
s
i
t
y
P
r
e
s
s
-
R
e
v
i
e
w
C
o
p
y
R
e
v
i
e
w
C
o
p
y
-
C
a
m
b
r
i
d
g
e
U
n
i
v
e
r
s
i
t
y
Copyright Material - Review Only - Not for Redistribution](https://image.slidesharecdn.com/igcsemathematicstextbookfullversion-241104053313-f2eaac1e/85/IGCSE-Mathematics-Textbook-full-version-pdf-262-320.jpg)


![275
Unit 3: Data handling
Examination practice
Past paper questions
1 The time, t seconds, taken for each of 50 chefs to cook an omelette is recorded.
Time (t seconds) 20 t 25 25 t 30 30 t 35 35 t 40 40 t 45 45 t 50
Frequency 2 6 7 19 9 7
a Write down the modal time interval [1]
b Calculate an estimate of the mean time. Show all your working [4]
[Cambridge IGCSE Mathematics 0580 Paper 42 Q3 (a) (b) October/November 2014]
2 Shahruk plays four games of golf
His four scores have a mean of 75, a mode of 78 and a median of 77
Work out his four scores [3]
[Cambridge IGCSE Mathematics 0580 Paper 22 Q11 May/June 2016]
3 a A farmer takes a sample of 158 potatoes from his crop.
He records the mass of each potato and the results are shown in the table.
Mass (m grams) Frequency
0 m 40 6
40 m 80 10
80 m 120 28
120 m 160 76
160 m 200 22
200 m 240 16
Calculate an estimate of the mean mass.
Show all your working. [4]
b A new frequency table is made from the results shown in the table in part a.
Mass (m grams) Frequency
0 m 80
80 m 200
200 m 240 16
i Complete the table above. [2]
ii On the grid, complete the histogram to show the information in this new table.
E
E
e
s
s
-
R
e
v
i
e
w
C
o
p
y
-
C
a
m
b
r
i
d
g
e
U
n
i
v
e
r
s
i
t
y
P
r
e
s
s
-
R
e
v
i
e
w
C
o
p
y
R
e
v
i
e
w
C
o
p
y
-
C
a
m
b
r
i
d
g
e
U
n
i
v
e
r
s
i
t
y
P
r
e
s
s
-
R
e
v
i
e
w
C
o
p
y
R
e
v
i
e
w
C
o
p
y
-
C
a
m
b
r
i
d
g
e
U
n
i
v
e
r
s
i
t
y
P
r
e
s
s
-
R
e
v
i
e
w
C
o
p
y
R
e
v
i
e
w
C
o
p
y
-
C
a
m
b
r
i
d
g
e
U
n
i
v
e
r
s
i
t
y
Copyright Material - Review Only - Not for Redistribution](https://image.slidesharecdn.com/igcsemathematicstextbookfullversion-241104053313-f2eaac1e/85/IGCSE-Mathematics-Textbook-full-version-pdf-285-320.jpg)
![Unit 3: Data handling
276
Frequency
density
Mass (grams)
m
40 80 120 160 200 240
0
0.2
0.6
0.4
0.8
1.0
1.2
[3]
c A bag contains 15 potatoes which have a mean mass of 136 g.
The farmer puts 3 potatoes which have a mean mass of 130 g into the bag.
Calculate the mean mass of all the potatoes in the bag. [3]
[Cambridge IGCSE Mathematics 0580 Paper 42 Q5 October/November 2012]
E
e
s
s
-
R
e
v
i
e
w
C
o
p
y
-
C
a
m
b
r
i
d
g
e
U
n
i
v
e
r
s
i
t
y
P
r
e
s
s
-
R
e
v
i
e
w
C
o
p
y
R
e
v
i
e
w
C
o
p
y
-
C
a
m
b
r
i
d
g
e
U
n
i
v
e
r
s
i
t
y
P
r
e
s
s
-
R
e
v
i
e
w
C
o
p
y
R
e
v
i
e
w
C
o
p
y
-
C
a
m
b
r
i
d
g
e
U
n
i
v
e
r
s
i
t
y
P
r
e
s
s
-
R
e
v
i
e
w
C
o
p
y
R
e
v
i
e
w
C
o
p
y
-
C
a
m
b
r
i
d
g
e
U
n
i
v
e
r
s
i
t
y
Copyright Material - Review Only - Not for Redistribution](https://image.slidesharecdn.com/igcsemathematicstextbookfullversion-241104053313-f2eaac1e/85/IGCSE-Mathematics-Textbook-full-version-pdf-286-320.jpg)


![Examination practice: structured questions for Units 1–3
280
Past paper questions
1
h
g
g
f i
j
k
m n
P Q
a Use the information in the Venn diagram to complete the following
i P ∩ Q = { ......................} [1]
ii P′∪Q = { ......................} [1]
iii n(P∪Q)′ = { ......................} [1]
b A letter is chosen at random from the set Q.
Find the probability that it is also in the set P. [1]
c On the Venn diagram shade the region P′∩ Q. [1]
d Use a set notation symbol to complete the statement.
{f, g, h}..............P [1]
[Cambridge IGCSE Mathematics 0580 Paper 22 Q22 May/June 2014]
2 Here is a sequence of patterns made using identical polygons.
Pattern 2 Pattern 3
Pattern 1
a Write down the mathematical name of the polygon in Pattern 1. [1]
b Complete the table for the number of vertices (corners) and the number of lines in Pattern 3,
Pattern 4 and Pattern 7. [5]
Pattern 1 2 3 4 7
Number of vertices 8 14
Number of lines 8 15
c i Find an expression for the number of vertices in Pattern n. [2]
ii Work out the number of vertices in Pattern 23. [1]
d Find an expression for the number of lines in Pattern n. [2]
e Work out an expression, in its simplest form, for
(number of lines in Pattern n) – (number of vertices in Pattern n). [2]
[Cambridge IGCSE Mathematics 0580 Paper 33 Q08 October/November 2013]
3 a Using only the integers from 1 to 50, find
i a multiple of both 4 and 7, [1]
ii a square number that is odd, [1]
iii an even prime number, [1]
iv a prime number which is one less than a multiple of 5. [1]
b Find the value of
i
2
( )
( )
5
( ) , [1]
ii 2−3
× 63
. [2]
[Cambridge IGCSE Mathematics 0580 Paper 33 Q03 October/November 2013]
E
e
s
s
-
R
e
v
i
e
w
C
o
p
y
-
C
a
m
b
r
i
d
g
e
U
n
i
v
e
r
s
i
t
y
P
r
e
s
s
-
R
e
v
i
e
w
C
o
p
y
R
e
v
i
e
w
C
o
p
y
-
C
a
m
b
r
i
d
g
e
U
n
i
v
e
r
s
i
t
y
P
r
e
s
s
-
R
e
v
i
e
w
C
o
p
y
R
e
v
i
e
w
C
o
p
y
-
C
a
m
b
r
i
d
g
e
U
n
i
v
e
r
s
i
t
y
P
r
e
s
s
-
R
e
v
i
e
w
C
o
p
y
R
e
v
i
e
w
C
o
p
y
-
C
a
m
b
r
i
d
g
e
U
n
i
v
e
r
s
i
t
y
Copyright Material - Review Only - Not for Redistribution](https://image.slidesharecdn.com/igcsemathematicstextbookfullversion-241104053313-f2eaac1e/85/IGCSE-Mathematics-Textbook-full-version-pdf-290-320.jpg)


![299
Unit 4: Number
Examination practice
Exam-style questions
1 A cuboid has dimensions 14.5cm, 13.2cm and 21.3cm. These dimensions are all given to 1 decimal place.
Calculate the upper and lower bounds for the volume of the cuboid in:
a cm3
b mm3
Give your answers in standard form.
2 The graph shows the relationship between speeds in mph and km/h.
20 40 60 80 100 120
0
20
40
60
80
mph
km/h
Conversion graph, km/h to mph
Use the graph to estimate:
a the speed, in km/h, of a car travelling at 65mph
b the speed, in mph, of a train travelling at 110km/h.
3 You are given that a = 6.54 (to 3 significant figures) and b = 123 (to 3 significant figures).
Calculate upper and lower bounds for each of the following, give your answers to 3 significant figures:
a a + b b ab c
a
b
d b
a
−
1
Past paper questions
1 A carton contains 250 ml of juice, correct to the nearest millilitre.
Complete the statement about the amount of juice, j ml, in the carton.
…… j ….. [2]
[Cambridge IGCSE Mathematics 0580 Paper 13 Q11 October/November 2012]
2 George and his friend Jane buy copies of the same book on the internet.
George pays $16.95 and Jane pays £11.99 on a day when the exchange rate is $1 = £0.626.
Calculate, in dollars, how much more Jane pays. [2]
[Cambridge IGCSE Mathematics 0580 Paper 22 Q6 May/June 2013]
3 Joe measures the side of a square correct to 1 decimal place.
He calculates the upper bound for the area of the square as 37.8225cm2
.
Work out Joe’s measurement for the side of the square. [2]
[Cambridge IGCSE Mathematics 0580 Paper 22 Q8 May/June 2013]
E
E
E
E
e
s
s
-
R
e
v
i
e
w
C
o
p
y
-
C
a
m
b
r
i
d
g
e
U
n
i
v
e
r
s
i
t
y
P
r
e
s
s
-
R
e
v
i
e
w
C
o
p
y
R
e
v
i
e
w
C
o
p
y
-
C
a
m
b
r
i
d
g
e
U
n
i
v
e
r
s
i
t
y
P
r
e
s
s
-
R
e
v
i
e
w
C
o
p
y
R
e
v
i
e
w
C
o
p
y
-
C
a
m
b
r
i
d
g
e
U
n
i
v
e
r
s
i
t
y
P
r
e
s
s
-
R
e
v
i
e
w
C
o
p
y
R
e
v
i
e
w
C
o
p
y
-
C
a
m
b
r
i
d
g
e
U
n
i
v
e
r
s
i
t
y
Copyright Material - Review Only - Not for Redistribution](https://image.slidesharecdn.com/igcsemathematicstextbookfullversion-241104053313-f2eaac1e/85/IGCSE-Mathematics-Textbook-full-version-pdf-309-320.jpg)
![Unit 4: Number
300
4 The length, l metres, of a football pitch is 96m, correct to the nearest metre.
Complete the statement about the length of this football pitch.
…… j ….. [2]
[Cambridge IGCSE Mathematics 0580 Paper 22 Q6 October/November 2014]
5 The base of a triangle is 9cm correct to the nearest cm.
The area of this triangle is 40cm2
correct to the nearest 5cm2
.
Calculate the upper bound for the perpendicular height of this triangle. [3]
[Cambridge IGCSE Mathematics 0580 Paper 22 Q13 May/June 2016]
E
e
s
s
-
R
e
v
i
e
w
C
o
p
y
-
C
a
m
b
r
i
d
g
e
U
n
i
v
e
r
s
i
t
y
P
r
e
s
s
-
R
e
v
i
e
w
C
o
p
y
R
e
v
i
e
w
C
o
p
y
-
C
a
m
b
r
i
d
g
e
U
n
i
v
e
r
s
i
t
y
P
r
e
s
s
-
R
e
v
i
e
w
C
o
p
y
R
e
v
i
e
w
C
o
p
y
-
C
a
m
b
r
i
d
g
e
U
n
i
v
e
r
s
i
t
y
P
r
e
s
s
-
R
e
v
i
e
w
C
o
p
y
R
e
v
i
e
w
C
o
p
y
-
C
a
m
b
r
i
d
g
e
U
n
i
v
e
r
s
i
t
y
Copyright Material - Review Only - Not for Redistribution](https://image.slidesharecdn.com/igcsemathematicstextbookfullversion-241104053313-f2eaac1e/85/IGCSE-Mathematics-Textbook-full-version-pdf-310-320.jpg)


![Unit 4: Algebra
332
Examination practice
Exam-style questions
1 The quadratic equation x2
– 5x – 3 = 0 has solutions a and b. Find the value of:
i a – b
ii a + b
Leave your answers in exact form.
2 a By shading the unwanted regions on a diagram, show the region that satisfies all
the inequalities y x
y x
y x
y x
1
y x
y x
2
y x
y x 1
+ , 5x + 6y 30 and y x.
b Given that x and y satisfy these three inequalities, find the greatest possible value of x + 2y.
Past paper questions
1 Solve the inequality
x
3
5 2
+
5 2
+
5 2. [2]
[Cambridge IGCSE Mathematics 0580 Paper 22 Q8 May/June 2016]
2 Find the co-ordinates of the point of intersection of the two lines.
2x − 7y = 2
4x + 5y = 42 [3]
[Cambridge IGCSE Mathematics 0580 Paper 22 Q15 October/November 2013]
3 x is a positive integer and 15x – 43 5x + 2.
Work out the possible values of x. [3]
[Cambridge IGCSE Mathematics 0580 Paper 22 Q6 May/June 2012]
4 Write the following as a single fraction in its simplest form. [3]
x x
+
x x
x x
− +
2
x x
x x
3
2 1
x x
2 1
x x −
2 1
4
1
[Cambridge IGCSE Mathematics 0580 Paper 23 Q13 October/November 2012]
5 Jay makes wooden boxes in two sizes. He makes x small boxes and y large boxes.
He makes at least 5 small boxes.
The greatest number of large boxes he can make is 8.
The greatest total number of boxes is 14.
The number of large boxes is at least half the number of small boxes.
a i Write down four inequalities in x and y to show this information. [4]
ii Draw four lines on the grid and write the letter R in the region which represents these inequalities.
E
E
E
e
s
s
-
R
e
v
i
e
w
C
o
p
y
-
C
a
m
b
r
i
d
g
e
U
n
i
v
e
r
s
i
t
y
P
r
e
s
s
-
R
e
v
i
e
w
C
o
p
y
R
e
v
i
e
w
C
o
p
y
-
C
a
m
b
r
i
d
g
e
U
n
i
v
e
r
s
i
t
y
P
r
e
s
s
-
R
e
v
i
e
w
C
o
p
y
R
e
v
i
e
w
C
o
p
y
-
C
a
m
b
r
i
d
g
e
U
n
i
v
e
r
s
i
t
y
P
r
e
s
s
-
R
e
v
i
e
w
C
o
p
y
R
e
v
i
e
w
C
o
p
y
-
C
a
m
b
r
i
d
g
e
U
n
i
v
e
r
s
i
t
y
Copyright Material - Review Only - Not for Redistribution](https://image.slidesharecdn.com/igcsemathematicstextbookfullversion-241104053313-f2eaac1e/85/IGCSE-Mathematics-Textbook-full-version-pdf-342-320.jpg)
![333
Unit 4: Algebra
x
y
2
1 3 4 5 6 7 8 9 10 11 12 13 14 15
0
1
2
3
4
5
6
7
8
9
10
11
12
13
14
15
[5]
b The price of the small box is $20 and the price of the large box is $45.
i What is the greatest amount of money he receives when he sells all the boxes he has made? [2]
ii For this amount of money, how many boxes of each size did he make? [1]
[Cambridge IGCSE Mathematics 0580 Paper 42 Q7 October/November 2012]
6 Simplify the following. h h
h
2
h h
h h
2
20
25
− −
h h
− −
h h
−
[4]
[Cambridge IGCSE Mathematics 0580 Paper 23 Q21 October/November 2012]
7 Simplify.
x x
2
6 7
x x
6 7
x x
3 2
x
3 21
+ −
x x
+ −
x x
6 7
+ −
6 7
x x
6 7
x x
+ −
6 7
3 2
3 2
[4]
[Cambridge IGCSE Mathematics 0580 Paper 22 Q19 May/June 2014]
8 a Write as a single fraction in its simplest form.
3
2 1
1
2
x x
2 1
x x
2 1
2 1
x x
2 1
x x
−
+
[3]
b Simplify.
4 16
2 6 56
2
4 1
4 1
2
2 6
2 6
x x
4 1
x x
4 16
x x
x x
2 6
x x
2 6
4 1
x x
4 1
x x
+ −
2 6
+ −
2 6
x x
+ −
2 6
x x
+ −
2 6
x x
[4]
[Cambridge IGCSE Mathematics 0580 Paper 22 Q21 October/Novermber 2014]
E
e
s
s
-
R
e
v
i
e
w
C
o
p
y
-
C
a
m
b
r
i
d
g
e
U
n
i
v
e
r
s
i
t
y
P
r
e
s
s
-
R
e
v
i
e
w
C
o
p
y
R
e
v
i
e
w
C
o
p
y
-
C
a
m
b
r
i
d
g
e
U
n
i
v
e
r
s
i
t
y
P
r
e
s
s
-
R
e
v
i
e
w
C
o
p
y
R
e
v
i
e
w
C
o
p
y
-
C
a
m
b
r
i
d
g
e
U
n
i
v
e
r
s
i
t
y
P
r
e
s
s
-
R
e
v
i
e
w
C
o
p
y
R
e
v
i
e
w
C
o
p
y
-
C
a
m
b
r
i
d
g
e
U
n
i
v
e
r
s
i
t
y
Copyright Material - Review Only - Not for Redistribution](https://image.slidesharecdn.com/igcsemathematicstextbookfullversion-241104053313-f2eaac1e/85/IGCSE-Mathematics-Textbook-full-version-pdf-343-320.jpg)
![Unit 4: Algebra
334
9 Solve the equation 5x2
− 6x − 3 = 0.
Show all your working and give your answers correct to 2 decimal places. [4]
[Cambridge IGCSE Mathematics 0580 Paper 22 Q19 October/November 2015]
10 y = x2
+ 7x − 5 can be written in the form y = (x + a)2
+ b.
Find the value of a and the value of b. [3]
[Cambridge IGCSE Mathematics 0580 Paper 22 Q15 May/June 2016]
11 Solve the simmultaneous equations.
Show all your working.
3x + 4y = 14
5x + 2y = 21 [3]
[Cambridge IGCSE Mathematics 0580 Paper 22 Q16 May/June 2016]
E
e
s
s
-
R
e
v
i
e
w
C
o
p
y
-
C
a
m
b
r
i
d
g
e
U
n
i
v
e
r
s
i
t
y
P
r
e
s
s
-
R
e
v
i
e
w
C
o
p
y
R
e
v
i
e
w
C
o
p
y
-
C
a
m
b
r
i
d
g
e
U
n
i
v
e
r
s
i
t
y
P
r
e
s
s
-
R
e
v
i
e
w
C
o
p
y
R
e
v
i
e
w
C
o
p
y
-
C
a
m
b
r
i
d
g
e
U
n
i
v
e
r
s
i
t
y
P
r
e
s
s
-
R
e
v
i
e
w
C
o
p
y
R
e
v
i
e
w
C
o
p
y
-
C
a
m
b
r
i
d
g
e
U
n
i
v
e
r
s
i
t
y
Copyright Material - Review Only - Not for Redistribution](https://image.slidesharecdn.com/igcsemathematicstextbookfullversion-241104053313-f2eaac1e/85/IGCSE-Mathematics-Textbook-full-version-pdf-344-320.jpg)


![381
Unit 4: Shape, space and measures
9 Two ships leave port P at the same time. One ship sails
60km on a bearing of 030° to position A. The other ship
sails 100km on a bearing of 110° to position B.
a Calculate:
i the distance AB
ii PÂB
iii the bearing of B from A.
b Both ships took the same time, t hours, to reach their
positions. The speed of the faster ship was 20km/h.
Write down:
i the value of t
ii the speed of the slower ship.
North North
P
B
A
30°
80°
100 km
60 km
Past paper questions
1 The diagram shows a ladder of length 8 m leaning against a vertical wall.
h 8 m
56°
NOT TO
SCALE
Use trigonometry to calculate h.
Give your answer correct to 2 significant figures. [3]
[Cambridge IGCSE Mathematics 0580 Paper 11 Q19 October/November 2013]
2
8 cm
28°
NOT TO
SCALE
B A
C
Calculate the length of AB.
[2]
[Cambridge IGCSE Mathematics 0580 Paper 22 Q4 May/June 2014]
E
e
s
s
-
R
e
v
i
e
w
C
o
p
y
-
C
a
m
b
r
i
d
g
e
U
n
i
v
e
r
s
i
t
y
P
r
e
s
s
-
R
e
v
i
e
w
C
o
p
y
R
e
v
i
e
w
C
o
p
y
-
C
a
m
b
r
i
d
g
e
U
n
i
v
e
r
s
i
t
y
P
r
e
s
s
-
R
e
v
i
e
w
C
o
p
y
R
e
v
i
e
w
C
o
p
y
-
C
a
m
b
r
i
d
g
e
U
n
i
v
e
r
s
i
t
y
P
r
e
s
s
-
R
e
v
i
e
w
C
o
p
y
R
e
v
i
e
w
C
o
p
y
-
C
a
m
b
r
i
d
g
e
U
n
i
v
e
r
s
i
t
y
Copyright Material - Review Only - Not for Redistribution](https://image.slidesharecdn.com/igcsemathematicstextbookfullversion-241104053313-f2eaac1e/85/IGCSE-Mathematics-Textbook-full-version-pdf-391-320.jpg)
![Unit 4: Shape, space and measures
382
3 In triangle ABC, AB = 6 cm, BC = 4 cm and angle
BCA = 65°.
Calculate
a angle CAB, [3]
b the area of triangle ABC. [3]
[Cambridge IGCSE Mathematics 0580 Paper 22 Q21 October/November 2013]
4 The diagram shows a triangular prism.
ABCD is a horizontal rectangle with DA = 10cm and
AB = 5cm.
BCQP is a vertical rectangle and BP = 6cm.
Calculate
a the length of DP, [3]
b the angle between DP and the horizontal
rectangle ABCD. [3]
[Cambridge IGCSE Mathematics 0580 Paper 23 Q24 October/November 2012]
5 The diagram shows the positions of three towns A, B and C. The scale is 1 cm represents 2 km.
North
A
North
C
North
B
Scale: 1cm = 2 km
a i Find the distance in kilometres from A to B. [2]
ii Town D is 9 km from A on a bearing of 135°. Mark the position of town D on the diagram. [2]
iii Measure the bearing of A from C. [1]
[Cambridge IGCSE Mathematics 0580 Paper 33 Q10 October/November 2012]
E
E
6
C
A
B
NOT TO
SCALE
110°
Triangle ABC is isosceles with AB = AC.
Angle BAC = 110° and the area of the triangle is 85 cm2
.
Calculate AC. [3]
[Cambridge IGCSE Mathematics 0580 Paper 22 Q13 October/November 2014]
4 cm 6 cm
65°
A
C
B
NOT TO
SCALE
10 cm
D A
C
Q P
B
NOT TO
SCALE
6 cm
5 cm
382 Unit 4: Shape, space and measures
e
s
s
-
R
e
v
i
e
w
C
o
p
y
-
C
a
m
b
r
i
d
g
e
U
n
i
v
e
r
s
i
t
y
P
r
e
s
s
-
R
e
v
i
e
w
C
o
p
y
R
e
v
i
e
w
C
o
p
y
-
C
a
m
b
r
i
d
g
e
U
n
i
v
e
r
s
i
t
y
P
r
e
s
s
-
R
e
v
i
e
w
C
o
p
y
R
e
v
i
e
w
C
o
p
y
-
C
a
m
b
r
i
d
g
e
U
n
i
v
e
r
s
i
t
y
P
r
e
s
s
-
R
e
v
i
e
w
C
o
p
y
R
e
v
i
e
w
C
o
p
y
-
C
a
m
b
r
i
d
g
e
U
n
i
v
e
r
s
i
t
y
Copyright Material - Review Only - Not for Redistribution](https://image.slidesharecdn.com/igcsemathematicstextbookfullversion-241104053313-f2eaac1e/85/IGCSE-Mathematics-Textbook-full-version-pdf-392-320.jpg)


![392 Unit 4: Data handling
Past paper questions
1 On the first day of each month, a café owner records the midday temperature (°C) and the number of hot meals sold.
Month J F M A M J J A S O N D
Temperature (°C) 2 4 9 15 21 24 28 27 23 18 10 5
Number of hot meals 38 35 36 24 15 10 4 5 12 20 18 32
a Complete the scatter diagram.
The results for January to June have been plotted for you.
0
5
10
15
20
Number of
hot meals
Temperature (°C)
25
30
35
40
5 10 15 20 25 30
[2]
b On the grid, draw the line of best fit. [1]
c What type of correlation does this scatter diagram show? [1]
[Cambridge IGCSE Mathematics 0580 Paper 13 Q18 May/June 2013]
e
s
s
-
R
e
v
i
e
w
C
o
p
y
-
C
a
m
b
r
i
d
g
e
U
n
i
v
e
r
s
i
t
y
P
r
e
s
s
-
R
e
v
i
e
w
C
o
p
y
R
e
v
i
e
w
C
o
p
y
-
C
a
m
b
r
i
d
g
e
U
n
i
v
e
r
s
i
t
y
P
r
e
s
s
-
R
e
v
i
e
w
C
o
p
y
R
e
v
i
e
w
C
o
p
y
-
C
a
m
b
r
i
d
g
e
U
n
i
v
e
r
s
i
t
y
P
r
e
s
s
-
R
e
v
i
e
w
C
o
p
y
R
e
v
i
e
w
C
o
p
y
-
C
a
m
b
r
i
d
g
e
U
n
i
v
e
r
s
i
t
y
Copyright Material - Review Only - Not for Redistribution](https://image.slidesharecdn.com/igcsemathematicstextbookfullversion-241104053313-f2eaac1e/85/IGCSE-Mathematics-Textbook-full-version-pdf-402-320.jpg)
![393
Unit 4: Data handling
2 The scatter diagram shows the results of height plotted against shoe size for 8 people.
136
128
120
144
152
160
168
176
184
192
200
Height
(cm)
Shoe size
26 28 30 32 34 36 38 40 42 44
a Four more results are recorded.
Shoe size 28 31 38 43
Height (cm) 132 156 168 198
Plot these 4 results on the scatter diagram. [2]
b Draw a line of best fit on the scatter diagram. [1]
c What type of correlation is shown by the scatter diagram? [1]
[Cambridge IGCSE Mathematics 0580 Paper 12 Q17 October/November 2014]
e
s
s
-
R
e
v
i
e
w
C
o
p
y
-
C
a
m
b
r
i
d
g
e
U
n
i
v
e
r
s
i
t
y
P
r
e
s
s
-
R
e
v
i
e
w
C
o
p
y
R
e
v
i
e
w
C
o
p
y
-
C
a
m
b
r
i
d
g
e
U
n
i
v
e
r
s
i
t
y
P
r
e
s
s
-
R
e
v
i
e
w
C
o
p
y
R
e
v
i
e
w
C
o
p
y
-
C
a
m
b
r
i
d
g
e
U
n
i
v
e
r
s
i
t
y
P
r
e
s
s
-
R
e
v
i
e
w
C
o
p
y
R
e
v
i
e
w
C
o
p
y
-
C
a
m
b
r
i
d
g
e
U
n
i
v
e
r
s
i
t
y
Copyright Material - Review Only - Not for Redistribution](https://image.slidesharecdn.com/igcsemathematicstextbookfullversion-241104053313-f2eaac1e/85/IGCSE-Mathematics-Textbook-full-version-pdf-403-320.jpg)


![Unit 5: Number
414
Examination practice
Exam-style questions
1 Sayed is paid $8.50 per hour for a standard 36-hour week. He is paid ‘time-and-a-half’ for all overtime worked. Calculate:
a his gross weekly earnings if he works 4 3
4 hours overtime
b the hours overtime worked if he earns $420.75 for the week.
2 Ahmed bought a DVD for $15. He sold it to Barbara, making a 20% loss.
a How much did Barbara pay for it?
b Barbara later sold the DVD to Luvuyo. She made a 20% profit.
How much did Luvuyo pay for it?
3 Last year, Jane’s wages were $80 per week. Her wages are now $86 per week. Calculate the percentage increase.
4 What is the simple interest on $160 invested at 7% per year for three years?
5 Senor Vasquez invests $500 in a Government Bond, at 9% simple interest per year. How much will the Bond be
worth after three years?
6 Simon’s salary has increased by 6% p.a. over the past three years. It is now $35730.40 p.a.
a What did he earn per year three years ago?
b What is his gross monthly salary at the present rate?
c His deductions each month amount to 22.5% of his gross salary. What is his net pay per month?
7 A new car cost $14875. Three years later, the insurance company valued it at $10700. Calculate the percentage
reduction in value over the three years.
8 Exercise equipment advertised at $2200 is sold on sale for $1950. What percentage discount is this?
Past paper questions
1 Robert buys a car for $8000.
At the end of each year the value of the car has decreased by 10% of its value at the beginning of that year.
Calculate the value of the car at the end of 7 years. [2]
[Cambridge IGCSE Mathematics 0580 Paper 22 Q8 October/November 2015]
2 Anita buys a computer for $391 in a sale.
The sale price is 15% less than the original price.
Calculate the original price of the computer. [3]
[Cambridge IGCSE Mathematics 0580 Paper 22 Q11 May/June 2014]
E
e
s
s
-
R
e
v
i
e
w
C
o
p
y
-
C
a
m
b
r
i
d
g
e
U
n
i
v
e
r
s
i
t
y
P
r
e
s
s
-
R
e
v
i
e
w
C
o
p
y
R
e
v
i
e
w
C
o
p
y
-
C
a
m
b
r
i
d
g
e
U
n
i
v
e
r
s
i
t
y
P
r
e
s
s
-
R
e
v
i
e
w
C
o
p
y
R
e
v
i
e
w
C
o
p
y
-
C
a
m
b
r
i
d
g
e
U
n
i
v
e
r
s
i
t
y
P
r
e
s
s
-
R
e
v
i
e
w
C
o
p
y
R
e
v
i
e
w
C
o
p
y
-
C
a
m
b
r
i
d
g
e
U
n
i
v
e
r
s
i
t
y
Copyright Material - Review Only - Not for Redistribution](https://image.slidesharecdn.com/igcsemathematicstextbookfullversion-241104053313-f2eaac1e/85/IGCSE-Mathematics-Textbook-full-version-pdf-424-320.jpg)


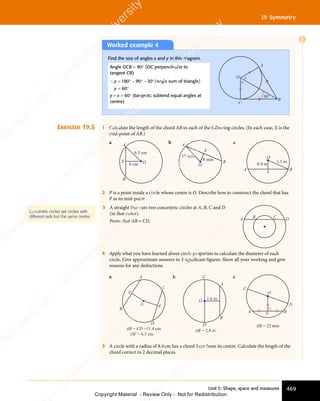


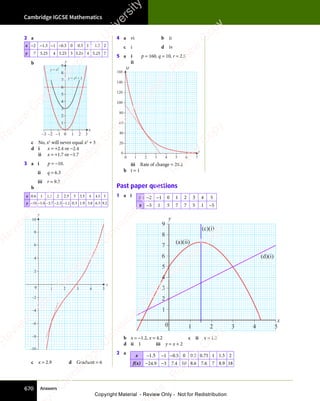


IGCSE Mathematics Textbook full version .pdf
- 1. Karen Morrison and Nick Hamshaw Cambridge IGCSE® Mathematics Core and Extended Coursebook Second edition ✓ ✓ ✓ ✓ Copyright Material - Review Only - Not for Redistribution
- 2. Copyright Material - Review Only - Not for Redistribution
- 3. Karen Morrison and Nick Hamshaw Second edition Cambridge IGCSE® Mathematics Core and Extended Coursebook e s s - R e v i e w C o p y - C a m b r i d g e U n i v e r s i t y P r e s s - R e v i e w C o p y R e v i e w C o p y - C a m b r i d g e U n i v e r s i t y P r e s s - R e v i e w C o p y R e v i e w C o p y - C a m b r i d g e U n i v e r s i t y P r e s s - R e v i e w C o p y R e v i e w C o p y - C a m b r i d g e U n i v e r s i t y Copyright Material - Review Only - Not for Redistribution
- 4. University Printing House, Cambridge CB2 8BS, United Kingdom One Liberty Plaza, 20th Floor, New York, NY 10006, USA 477 Williamstown Road, Port Melbourne, VIC 3207, Australia 314–321, 3rd Floor, Plot 3, Splendor Forum, Jasola District Centre, New Delhi – 110025, India 79 Anson Road, 06–04/06, Singapore 079906 Cambridge University Press is part of the University of Cambridge. It furthers the University’s mission by disseminating knowledge in the pursuit of education, learning and research at the highest international levels of excellence. www.cambridge.org Information on this title: education.cambridge.org/9781108437189 © Cambridge University Press 2018 This publication is in copyright. Subject to statutory exception and to the provisions of relevant collective licensing agreements, no reproduction of any part may take place without the written permission of Cambridge University Press. First published 2012 Revised Edition First Published 2015 Printed in the United Kingdom by Latimer Trend A catalogue record for this publication is available from the British Library ISBN 978-1-108-43718-9 Paperback Cambridge University Press has no responsibility for the persistence or accuracy of URLs for external or third-party internet websites referred to in this publication, and does not guarantee that any content on such websites is, or will remain, accurate or appropriate. Information regarding prices, travel timetables, and other factual information given in this work is correct at the time of first printing but Cambridge University Press does not guarantee the accuracy of such information thereafter. notice to teachers in the uk It is illegal to reproduce any part of this work in material form (including photocopying and electronic storage) except under the following circumstances: (i) where you are abiding by a licence granted to your school or institution by the Copyright Licensing Agency; (ii) where no such licence exists, or where you wish to exceed the terms of a licence, and you have gained the written permission of Cambridge University Press; (iii) where you are allowed to reproduce without permission under the provisions of Chapter 3 of the Copyright, Designs and Patents Act 1988, which covers, for example, the reproduction of short passages within certain types of educational anthology and reproduction for the purposes of setting examination questions. IGCSE® is a registered trademark. Past exam paper questions throughout are reproduced by permission of Cambridge Assessment International Education. Cambridge Assessment International Education bears no responsibility for the example answers to questions taken from its past question papers which are contained in this publication. All exam-style questions and sample answers in this title were written by the authors. In examinations, the way marks are awarded may be different. 20 19 18 17 16 15 14 13 12 11 10 9 8 7 6 5 4 3 2 1 e s s - R e v i e w C o p y - C a m b r i d g e U n i v e r s i t y P r e s s - R e v i e w C o p y R e v i e w C o p y - C a m b r i d g e U n i v e r s i t y P r e s s - R e v i e w C o p y R e v i e w C o p y - C a m b r i d g e U n i v e r s i t y P r e s s - R e v i e w C o p y R e v i e w C o p y - C a m b r i d g e U n i v e r s i t y Copyright Material - Review Only - Not for Redistribution
- 5. Contents iii Chapter 3: Lines, angles and shapes 45 3.1 Lines and angles 46 3.2 Triangles 55 3.3 Quadrilaterals 59 3.4 Polygons 61 3.5 Circles 64 3.6 Construction 65 Chapter 4: Collecting, organising and displaying data 71 4.1 Collecting and classifying data 74 4.2 Organising data 76 4.3 Using charts to display data 86 Unit 2 Unit 3 Chapter 7: Perimeter, area and volume 133 7.1 Perimeter and area in two dimensions 135 7.2 Three-dimensional objects 148 7.3 Surface areas and volumes of solids 150 Chapter 8: Introduction to probability 160 8.1 Basic probability 161 8.2 Theoretical probability 162 8.3 The probability that an event does not happen 164 8.4 Possibility diagrams 165 8.5 Combining independent and mutually exclusive events 167 11.3 Understanding similar shapes 236 11.4 Understanding congruence 244 Chapter 12: Averages and measures of spread 253 12.1 Different types of average 254 12.2 Making comparisons using averages and ranges 257 12.3 Calculating averages and ranges for frequency data 258 12.4 Calculating averages and ranges for grouped continuous data 262 12.5 Percentiles and quartiles 265 12.6 Box-and-whisker plots 269 Chapter 1: Reviewing number concepts 1 1.1 Different types of numbers 2 1.2 Multiples and factors 3 1.3 Prime numbers 6 1.4 Powers and roots 10 1.5 Working with directed numbers 13 1.6 Order of operations 15 1.7 Rounding numbers 18 Chapter 2: Making sense of algebra 23 2.1 Using letters to represent unknown values 24 2.2 Substitution 26 2.3 Simplifying expressions 29 2.4 Working with brackets 33 2.5 Indices 35 Chapter 5: Fractions and standard form 101 5.1 Equivalent fractions 103 5.2 Operations on fractions 104 5.3 Percentages 109 5.4 Standard form 114 5.5 Your calculator and standard form 118 5.6 Estimation 119 Chapter 6: Equations and rearranging formulae 123 6.1 Further expansions of brackets 124 6.2 Solving linear equations 125 6.3 Factorising algebraic expressions 128 6.4 Rearrangement of a formula 129 Chapter 9: Sequences and sets 173 9.1 Sequences 174 9.2 Rational and irrational numbers 182 9.3 Sets 185 Chapter 10: Straight lines and quadratic equations 198 10.1 Straight lines 200 10.2 Quadratic (and other) expressions 216 Chapter 11: Pythagoras’ theorem and similar shapes 226 11.1 Pythagoras’ theorem 227 11.2 Understanding similar triangles 231 Examination practice: structured questions for Units 1–3 277 Contents Introduction v Acknowledgements vii Unit 1 e s s - R e v i e w C o p y - C a m b r i d g e U n i v e r s i t y P r e s s - R e v i e w C o p y R e v i e w C o p y - C a m b r i d g e U n i v e r s i t y P r e s s - R e v i e w C o p y R e v i e w C o p y - C a m b r i d g e U n i v e r s i t y P r e s s - R e v i e w C o p y R e v i e w C o p y - C a m b r i d g e U n i v e r s i t y Copyright Material - Review Only - Not for Redistribution
- 6. Contents Cambridge IGCSE Mathematics iv Chapter 13: Understanding measurement 281 13.1 Understanding units 283 13.2 Time 285 13.3 Upper and lower bounds 289 13.4 Conversion graphs 294 13.5 More money 297 Chapter 14: Further solving of equations and inequalities 301 14.1 Simultaneous linear equations 303 14.2 Linear inequalities 310 14.3 Regions in a plane 314 14.4 Linear programming 319 14.5 Completing the square 321 14.6 Quadratic formula 322 14.7 Factorising quadratics where the coefficient of x2 is not 1 324 14.8 Algebraic fractions 326 Chapter 15: Scale drawings, bearings and trigonometry 335 15.1 Scale drawings 336 15.2 Bearings 339 15.3 Understanding the tangent, cosine and sine ratios 340 15.4 Solving problems using trigonometry 355 15.5 Sines, cosines and tangents of angles more than 90° 360 15.6 The sine and cosine rules 364 15.7 Area of a triangle 372 15.8 Trigonometry in three dimensions 375 Chapter 16: Scatter diagrams and correlation 383 16.1 Introduction to bivariate data 384 Unit 4 Unit 5 Chapter 17: Managing money 394 17.1 Earning money 395 17.2 Borrowing and investing money 401 17.3 Buying and selling 409 Chapter 18: Curved graphs 415 18.1 Drawing quadratic graphs (the parabola) 416 18.2 Drawing reciprocal graphs (the hyperbola) 424 18.3 Using graphs to solve quadratic equations 428 18.4 Using graphs to solve simultaneous linear and non-linear equations 429 18.5 Other non-linear graphs 431 18.6 Finding the gradient of a curve 441 18.7 Derived functions 443 Chapter 19: Symmetry 459 19.1 Symmetry in two dimensions 461 19.2 Symmetry in three dimensions 464 19.3 Symmetry properties of circles 467 19.4 Angle relationships in circles 470 Chapter 20: Histograms and frequency distribution diagrams 483 20.1 Histograms 485 20.2 Cumulative frequency 492 Unit 6 Chapter 21: Ratio, rate and proportion 506 21.1 Working with ratio 507 21.2 Ratio and scale 512 21.3 Rates 515 21.4 Kinematic graphs 517 21.5 Proportion 525 21.6 Direct and inverse proportion in algebraic terms 528 21.7 Increasing and decreasing amounts by a given ratio 532 Chapter 22: More equations, formulae and functions 536 22.1 Setting up equations to solve problems 537 22.2 Using and transforming formulae 543 22.3 Functions and function notation 546 Chapter 23: Vectors and transformations 556 23.1 Simple plane transformations 557 23.2 Vectors 570 23.3 Further transformations 582 Chapter 24: Probability using tree diagrams and Venn diagrams 595 24.1 Using tree diagrams to show outcomes 597 24.2 Calculating probability from tree diagrams 598 24.3 Calculating probability from Venn diagrams 600 24.4 Conditional probability 604 Examination practice: structured questions for Units 4–6 611 Answers 617 Glossary 688 Index 694 e s s - R e v i e w C o p y - C a m b r i d g e U n i v e r s i t y P r e s s - R e v i e w C o p y R e v i e w C o p y - C a m b r i d g e U n i v e r s i t y P r e s s - R e v i e w C o p y R e v i e w C o p y - C a m b r i d g e U n i v e r s i t y P r e s s - R e v i e w C o p y R e v i e w C o p y - C a m b r i d g e U n i v e r s i t y Copyright Material - Review Only - Not for Redistribution
- 7. Introduction v Introduction This popular and successful coursebook has been completely revised and updated to cover the latest Cambridge IGCSE Mathematics (0580/0980) syllabus. Core and Extended material is combined in one book, offering a one-stop-shop for all students and teachers. The material required for the Extended course is clearly marked using colour panels; Extended students are given access to the parts of the Core syllabus they need without having to use an additional book. Core students can see the Extended topics, should they find them of interest. The book has been written so that you can work through it from start to finish (although your teacher may decide to work differently). All chapters build on the knowledge and skills you will have learned in previous years and some later chapters build on knowledge developed earlier in the book. The recap, fast forward and rewind features will help you link the content of the chapters to what you have already learnt and highlight where you will use the knowledge again later in the course. The suggested progression through the coursebook is for Units 1–3 to be covered in the first year of both courses, and Units 4–6 to be covered in the second year of both courses. On this basis, there is an additional Exam practice with structured questions both at the end of Unit 3 and the end of Unit 6. These sections offer a sample of longer answer ‘structured’ examination questions that require you to use a combination of knowledge and methods from across all relevant chapters. As with the questions at the end of the chapter, these are a mixture of ‘Exam-style’ and ‘Past paper’ questions. The answers to these questions are provided in the Teacher’s resource only, so that teachers can set these as classroom tests or homework. Key features Each chapter opens with a list of learning objectives and an introduction which gives an overview of how the mathematics is used in real life. A recap section summarises the key skills and prior knowledge that you will build on in the chapter. There is also a list of key mathematical words. These words are indicated in a bold colour where they are used and explained. If you need additional explanation, please refer to the glossary located after Unit 6, which defines key terms. The chapters are divided into sections, each covering a particular topic. The concepts in each topic are introduced and explained and worked examples are given to present different methods of working in a practical and easy-to-follow way. The exercises for each topic offer progressive questions that allow the student to practise methods that have just been introduced. These range from simple recall and drill activities to applications and problem-solving tasks. There is a summary for each chapter which lists the knowledge and skills you should have once you’ve completed the work. You can use these as a checklist when you revise to make sure you’ve covered everything you need to know. At the end of each chapter there are ‘Exam-style’ questions and ‘Past paper’ questions. The ‘Exam-style’ questions have been written by the authors in the style of examination questions and expose you to the kinds of short answer and more structured questions that you may face in examinations. The ‘Past paper’ questions are real questions taken from past exam papers. The answers to all exercises and exam practice questions can be found in the answers sections at the end of the book. You can use these to assess your progress as you go along, and do more or less practice as required. You learned how to plot lines from equations in chapter 10. REWIND You will learn more about cancelling and equivalent fractions in chapter 5. FAST FORWARD e s s - R e v i e w C o p y - C a m b r i d g e U n i v e r s i t y P r e s s - R e v i e w C o p y R e v i e w C o p y - C a m b r i d g e U n i v e r s i t y P r e s s - R e v i e w C o p y R e v i e w C o p y - C a m b r i d g e U n i v e r s i t y P r e s s - R e v i e w C o p y R e v i e w C o p y - C a m b r i d g e U n i v e r s i t y Copyright Material - Review Only - Not for Redistribution
- 8. Introduction Cambridge IGCSE Mathematics vi Margin features Helpful guides in the margin of the book include: Clues: these are general comments to remind you of important or key information that is useful to tackle an exercise, or simply useful to know. They often provide extra information or support in potentially tricky topics. Tip: these cover common pitfalls based on the authors’ experiences of their students, and give you things to be wary of or to remember. Problem-solving hints: as you work through the course, you will develop your own ‘toolbox’ of problem-solving skills and strategies. These hint boxes will remind you of the problem-solving framework and suggest ways of tackling different types of problems. Links to other subjects: mathematics is not learned in isolation and you will use and apply what you learn in mathematics in many of your other school subjects as well. These boxes indicate where a particular concept may be of use in another subject. Some further supporting resources are available for download from the Cambridge University Press website. These include: • A ‘Calculator support’ document, which covers the main uses of calculators that students seem to struggle with, and includes some worksheets to provide practice in using your calculator in these situations. • A Problem-solving ‘toolbox’ with planning sheets to help you develop a range of strategies for tackling structured questions and become better at solving different types of problems. • Printable revision worksheets for Core and Extended course: – Core revision worksheets (and answers) provide extra exercises for each chapter of the book. These worksheets contain only content from the Core syllabus. – Extended revision worksheets (and answers) provide extra exercises for each chapter of the book. These worksheets repeat the Core worksheets, but also contain more challenging questions, as well as questions to cover content unique to the Extended syllabus. Additional resources IGCSE Mathematics Online is a supplementary online course with lesson notes, interactive worked examples (walkthroughs) and further practice questions. Practice Books one for Core and one for Extended. These follow the chapters and topics of the coursebook and offer additional targeted exercises for those who want more practice. They offer a summary of key concepts as well as ‘Clues’ and ‘Tips’ to help with tricky topics. A Revision Guide provides a resource for students to prepare and practise skills for examination, with clear explanations of mathematical skills. There is also an online Teacher’s resource to offer teaching support and advice Cambridge IGCSE Mathematics Remember ‘coefficient’ is the number in the term. Drawing a clear, labelled sketch can help you work out what mathematics you need to do to solve the problem. Watch out for negative numbers in front of brackets because they always require extra care. Tip e s s - R e v i e w C o p y - C a m b r i d g e U n i v e r s i t y P r e s s - R e v i e w C o p y R e v i e w C o p y - C a m b r i d g e U n i v e r s i t y P r e s s - R e v i e w C o p y R e v i e w C o p y - C a m b r i d g e U n i v e r s i t y P r e s s - R e v i e w C o p y R e v i e w C o p y - C a m b r i d g e U n i v e r s i t y Copyright Material - Review Only - Not for Redistribution
- 9. vii Acknowledgements Acknowledgements The authors and publishers acknowledge the following sources of copyright material and are grateful for the permissions granted. While every effort has been made, it has not always been possible to identify the sources of all the material used, or to trace all copyright holders. If any omissions are brought to our notice, we will be happy to include the appropriate acknowledgements on reprinting. Past paper exam questions throughout are reproduced by permission of Cambridge Assessment International Education Thanks to the following for permission to reproduce images: Cover image: eugenesergeev/Getty images; Internal images in order of appearance: Sander de Wilde; Littlebloke/iStock/ Getty Images; Axel Heizmann/EyeEm/Getty Images; KTSDESIGN/ Science Photo Library/Getty Images; Laborer/iStock/Getty Images; akiyoko/Shutterstock; Insagostudio/ Getty Images; DEA PICTURE LIBRARY/De Agostini/Getty Images; Fine Art Images/Heritage Images/Getty Images; Stefan Cioata/Moment/Getty Images; Traveler1116/ iStock/ Getty Images; Nick Brundle Photography/Moment/Getty Images; De Agostini Picture Library/Getty Images; Iropa/iStock/ Getty Images; Juan Camilo Bernal/Getty Images; Natalia Ganelin/Moment Open/Getty Images; Photos.com/ Getty Images; Dorling Kindersley/Getty Images; Stocktrek Images/Getty Images; Panoramic Images/Getty Images; Lisa Romerein/ The Image Bank/Getty Images; Paul Tillinghast/Moment/Getty Images; DEA/M. FANTIN/De Agostini/Getty Images; Scott Winer/Oxford Scientific/Getty Images; Urbanbuzz/iStock/Getty Images; StephanieFrey/iStock/Getty Images; VitalyEdush/iStock/ Getty Images; John Harper/ Photolibrary/Getty Images; David Caudery/Digital Camera magazine via Getty Images; Karen Morrison; PHILIPPE WOJAZER/AFP/Getty Images; Mircea_pavel/iStock/ Getty Images; ErikdeGraaf/iStock/ Getty Images; joeygil/iStock/Getty Images e s s - R e v i e w C o p y - C a m b r i d g e U n i v e r s i t y P r e s s - R e v i e w C o p y R e v i e w C o p y - C a m b r i d g e U n i v e r s i t y P r e s s - R e v i e w C o p y R e v i e w C o p y - C a m b r i d g e U n i v e r s i t y P r e s s - R e v i e w C o p y R e v i e w C o p y - C a m b r i d g e U n i v e r s i t y Copyright Material - Review Only - Not for Redistribution RM.DL.Books
- 10. e s s - R e v i e w C o p y - C a m b r i d g e U n i v e r s i t y P r e s s - R e v i e w C o p y R e v i e w C o p y - C a m b r i d g e U n i v e r s i t y P r e s s - R e v i e w C o p y R e v i e w C o p y - C a m b r i d g e U n i v e r s i t y P r e s s - R e v i e w C o p y R e v i e w C o p y - C a m b r i d g e U n i v e r s i t y Copyright Material - Review Only - Not for Redistribution
- 11. Unit 1: Number 1 Chapter 1: Reviewing number concepts In this chapter you will learn how to: • identify and classify different types of numbers • find common factors and common multiples of numbers • write numbers as products of their prime factors • calculate squares, square roots, cubes and cube roots of numbers • work with integers used in real-life situations • revise the basic rules for operating with numbers • perform basic calculations using mental methods and with a calculator. • Natural number • Integer • Prime number • Symbol • Multiple • Factor • Composite numbers • Prime factor • Square • Square root • Cube • Directed numbers • BODMAS Key words Our modern number system is called the Hindu-Arabic system because it was developed by Hindus and spread by Arab traders who brought it with them when they moved to different places in the world. The Hindu-Arabic system is decimal. This means it uses place value based on powers of ten. Any number at all, including decimals and fractions, can be written using place value and the digits from 0 to 9. This statue is a replica of a 22000-year-old bone found in the Congo. The real bone is only 10cm long and it is carved with groups of notches that represent numbers. One column lists the prime numbers from 10 to 20. It is one of the earliest examples of a number system using tallies. e s s - R e v i e w C o p y - C a m b r i d g e U n i v e r s i t y P r e s s - R e v i e w C o p y R e v i e w C o p y - C a m b r i d g e U n i v e r s i t y P r e s s - R e v i e w C o p y R e v i e w C o p y - C a m b r i d g e U n i v e r s i t y P r e s s - R e v i e w C o p y R e v i e w C o p y - C a m b r i d g e U n i v e r s i t y Copyright Material - Review Only - Not for Redistribution
- 12. Unit 1: Number Cambridge IGCSE Mathematics 2 1.1 Different types of numbers Make sure you know the correct mathematical words for the types of numbers in the table. Number Definition Example Natural number Any whole number from 1 to infinity, sometimes called ‘counting numbers’. 0 is not included. 1, 2, 3, 4, 5, . . . Odd number A whole number that cannot be divided exactly by 2. 1, 3, 5, 7, . . . Even number A whole number that can be divided exactly by 2. 2, 4, 6, 8, . . . Integer Any of the negative and positive whole numbers, including zero. . . . −3, −2, −1, 0, 1, 2, 3, . . . Prime number A whole number greater than 1 which has only two factors: the number itself and 1. 2, 3, 5, 7, 11, . . . Square number The product obtained when an integer is multiplied by itself. 1, 4, 9, 16, . . . Fraction A number representing parts of a whole number, can be written as a common (vulgar) fraction in the form of a b or as a decimal using the decimal point. 1 2 1 4 1 3 1 8 13 3 1 2 2 , , 4 , , , , 8 , , , 0.5, 0.2, 0.08, 1.7 Exercise 1.1 1 Here is a set of numbers: {−4, −1, 0, 1 2, 0.75, 3, 4, 6, 11, 16, 19, 25} List the numbers from this set that are: a natural numbers b even numbers c odd numbers d integers e negative integers f fractions g square numbers h prime numbers i neither square nor prime. 2 List: a the next four odd numbers after 107 b four consecutive even numbers between 2008 and 2030 c all odd numbers between 993 and 1007 d the first five square numbers e four decimal fractions that are smaller than 0.5 f four vulgar fractions that are greater than 1 2 but smaller than 3 4. 3 State whether the following will be odd or even: a the sum of two odd numbers b the sum of two even numbers c the sum of an odd and an even number d the square of an odd number e the square of an even number f an odd number multiplied by an even number. You will learn much more about sets in chapter 9. For now, just think of a set as a list of numbers or other items that are often placed inside curly brackets. FAST FORWARD Remember that a 'sum' is the result of an addition. The term is often used for any calculation in early mathematics but its meaning is very specific at this level. You will learn about the difference between rational and irrational numbers in chapter 9. FAST FORWARD Find the ‘product’ means ‘multiply’. So, the product of 3 and 4 is 12, i.e. 3 × 4 = 12. RECAP You should already be familiar with most of the concepts in this chapter. This chapter will help you to revise the concepts and check that you remember them. e s s - R e v i e w C o p y - C a m b r i d g e U n i v e r s i t y P r e s s - R e v i e w C o p y R e v i e w C o p y - C a m b r i d g e U n i v e r s i t y P r e s s - R e v i e w C o p y R e v i e w C o p y - C a m b r i d g e U n i v e r s i t y P r e s s - R e v i e w C o p y R e v i e w C o p y - C a m b r i d g e U n i v e r s i t y Copyright Material - Review Only - Not for Redistribution
- 13. Unit 1: Number 3 1 Reviewing number concepts Applying your skills 4 There are many other types of numbers. Find out what these numbers are and give an example of each. a Perfect numbers. b Palindromic numbers. c Narcissistic numbers. (In other words, numbers that love themselves!) Using symbols to link numbers Mathematicians use numbers and symbols to write mathematical information in the shortest, clearest way possible. You have used the operation symbols +, −, × and ÷ since you started school. Now you will also use the symbols given in the margin below to write mathematical statements. Exercise 1.2 1 Rewrite each of these statements using mathematical symbols. a 19 is less than 45 b 12 plus 18 is equal to 30 c 0.5 is equal to 1 2 d 0.8 is not equal to 8.0 e −34 is less than 2 times −16 f therefore the number x equals the square root of 72 g a number (x) is less than or equal to negative 45 h π is approximately equal to 3.14 i 5.1 is greater than 5.01 j the sum of 3 and 4 is not equal to the product of 3 and 4 k the difference between 12 and −12 is greater than 12 l the sum of −12 and −24 is less than 0 m the product of 12 and a number (x) is approximately −40 2 Say whether these mathematical statements are true or false. a 0.599 > 6.0 b 5 × 1999 ≈ 10000 c 8 1 8 1 10 8 1 8 1= d 6.2 + 4.3 = 4.3 + 6.2 e 20 × 9 21 × 8 f 6.0 = 6 g −12 > −4 h 19.9 20 i 1000 > 199 × 5 j 16 4 = k 35 × 5 × 2 ≠ 350 l 20 ÷ 4 = 5 ÷ 20 m 20 − 4 ≠ 4 − 20 n 20 × 4 ≠ 4 × 20 3 Work with a partner. a Look at the symbols used on the keys of your calculator. Say what each one means in words. b List any symbols that you do not know. Try to find out what each one means. 1.2 Multiples and factors You can think of the multiples of a number as the ‘times table’ for that number. For example, the multiples of 3 are 3 × 1 = 3, 3 × 2 = 6, 3 × 3 = 9 and so on. Multiples A multiple of a number is found when you multiply that number by a positive integer. The first multiple of any number is the number itself (the number multiplied by 1). Being able to communicate information accurately is a key skill for problem solving. Think about what you are being asked to do in this task and how best to present your answers. = is equal to ≠ is not equal to ≈ is approximately equal to < is less than is less than or equal to > is greater than is greater than or equal to ∴ therefore the square root of Remember that the 'difference' between two numbers is the result of a subtraction. The order of the subtraction matters. e s s - R e v i e w C o p y - C a m b r i d g e U n i v e r s i t y P r e s s - R e v i e w C o p y R e v i e w C o p y - C a m b r i d g e U n i v e r s i t y P r e s s - R e v i e w C o p y R e v i e w C o p y - C a m b r i d g e U n i v e r s i t y P r e s s - R e v i e w C o p y R e v i e w C o p y - C a m b r i d g e U n i v e r s i t y Copyright Material - Review Only - Not for Redistribution
- 14. Unit 1: Number Cambridge IGCSE Mathematics 4 Worked example 1 a What are the first three multiples of 12? b Is 300 a multiple of 12? a 12, 24, 36 To find these multiply 12 by 1, 2 and then 3. 12 × 1 = 12 12 × 2 = 24 12 × 3 = 36 b Yes, 300 is a multiple of 12. To find out, divide 300 by 12. If it goes exactly, then 300 is a multiple of 12. 300 ÷ 12 = 25 Exercise 1.3 1 List the first five multiples of: a 2 b 3 c 5 d 8 e 9 f 10 g 12 h 100 2 Use a calculator to find and list the first ten multiples of: a 29 b 44 c 75 d 114 e 299 f 350 g 1012 h 9123 3 List: a the multiples of 4 between 29 and 53 b the multiples of 50 less than 400 c the multiples of 100 between 4000 and 5000. 4 Here are five numbers: 576, 396, 354, 792, 1164. Which of these are multiples of 12? 5 Which of the following numbers are not multiples of 27? a 324 b 783 c 816 d 837 e 1116 The lowest common multiple (LCM) The lowest common multiple of two or more numbers is the smallest number that is a multiple of all the given numbers. Worked example 2 Find the lowest common multiple of 4 and 7. M4 = 4, 8, 12, 16, 20, 24, 28, 32 M7 = 7, 14, 21, 28, 35, 42 LCM = 28 List several multiples of 4. (Note: M4 means multiples of 4.) List several multiples of 7. Find the lowest number that appears in both sets. This is the LCM. Exercise 1.4 1 Find the LCM of: Later in this chapter you will see how prime factors can be used to find LCMs. FAST FORWARD a 2 and 5 b 8 and 10 c 6 and 4 d 3 and 9 e 35 and 55 f 6 and 11 g 2, 4 and 8 h 4, 5 and 6 i 6, 8 and 9 j 1, 3 and 7 k 4, 5 and 8 l 3, 4 and 18 e s s - R e v i e w C o p y - C a m b r i d g e U n i v e r s i t y P r e s s - R e v i e w C o p y R e v i e w C o p y - C a m b r i d g e U n i v e r s i t y P r e s s - R e v i e w C o p y R e v i e w C o p y - C a m b r i d g e U n i v e r s i t y P r e s s - R e v i e w C o p y R e v i e w C o p y - C a m b r i d g e U n i v e r s i t y Copyright Material - Review Only - Not for Redistribution RM.DL.Books
- 15. Unit 1: Number 5 1 Reviewing number concepts 2 Is it possible to find the highest common multiple of two or more numbers? Give a reason for your answer. Factors A factor is a number that divides exactly into another number with no remainder. For example, 2 is a factor of 16 because it goes into 16 exactly 8 times. 1 is a factor of every number. The largest factor of any number is the number itself. To list the factors in numerical order go down the left side and then up the right side of the factor pairs. Remember not to repeat factors. Worked example 3 Find the factors of: a 12 b 25 c 110 a F12 = 1, 2, 3, 4, 6, 12 Find pairs of numbers that multiply to give 12: 1 × 12 2 × 6 3 × 4 Write the factors in numerical order. b F25 = 1, 5, 25 1 × 25 5 × 5 Do not repeat the 5. c F110 = 1, 2, 5, 10, 11, 22, 55, 110 1 × 110 2 × 55 5 × 22 10 × 11 F12 means the factors of 12. Exercise 1.5 1 List all the factors of: a 4 b 5 c 8 d 11 e 18 f 12 g 35 h 40 i 57 j 90 k 100 l 132 m 160 n 153 o 360 2 Which number in each set is not a factor of the given number? a 14 {1, 2, 4, 7, 14} b 15 {1, 3, 5, 15, 45} c 21 {1, 3, 7, 14, 21} d 33 {1, 3, 11, 22, 33} e 42 {3, 6, 7, 8, 14} Later in this chapter you will learn more about divisibility tests and how to use these to decide whether or not one number is a factor of another. FAST FORWARD 3 State true or false in each case. a 3 is a factor of 313 b 9 is a factor of 99 c 3 is a factor of 300 d 2 is a factor of 300 e 2 is a factor of 122488 f 12 is a factor of 60 g 210 is a factor of 210 h 8 is a factor of 420 4 What is the smallest factor and the largest factor of any number? e s s - R e v i e w C o p y - C a m b r i d g e U n i v e r s i t y P r e s s - R e v i e w C o p y R e v i e w C o p y - C a m b r i d g e U n i v e r s i t y P r e s s - R e v i e w C o p y R e v i e w C o p y - C a m b r i d g e U n i v e r s i t y P r e s s - R e v i e w C o p y R e v i e w C o p y - C a m b r i d g e U n i v e r s i t y Copyright Material - Review Only - Not for Redistribution
- 16. Unit 1: Number Cambridge IGCSE Mathematics 6 The highest common factor (HCF) The highest common factor of two or more numbers is the highest number that is a factor of all the given numbers. Worked example 4 Find the HCF of 8 and 24. F8 = 1, 2, 4, 8 F24 = 1, 2, 3, 4, 6, 8, 12, 24 HCF = 8 List the factors of each number. Underline factors that appear in both sets. Pick out the highest underlined factor (HCF). Exercise 1.6 1 Find the HCF of each pair of numbers. a 3 and 6 b 24 and 16 c 15 and 40 d 42 and 70 e 32 and 36 f 26 and 36 g 22 and 44 h 42 and 48 2 Find the HCF of each group of numbers. a 3, 9 and 15 b 36, 63 and 84 c 22, 33 and 121 3 Not including the factor provided, find two numbers less than 20 that have: a an HCF of 2 b an HCF of 6 4 What is the HCF of two different prime numbers? Give a reason for your answer. Applying your skills 5 Simeon has two lengths of rope. One piece is 72 metres long and the other is 90 metres long. He wants to cut both lengths of rope into the longest pieces of equal length possible. How long should the pieces be? 6 Ms Sanchez has 40 canvases and 100 tubes of paint to give to the students in her art group. What is the largest number of students she can have if she gives each student an equal number of canvasses and an equal number of tubes of paint? 7 Indira has 300 blue beads, 750 red beads and 900 silver beads. She threads these beads to make wire bracelets. Each bracelet must have the same number and colour of beads. What is the maximum number of bracelets she can make with these beads? 1.3 Prime numbers Prime numbers have exactly two factors: one and the number itself. Composite numbers have more than two factors. The number 1 has only one factor so it is not prime and it is not composite. Finding prime numbers Over 2000 years ago, a Greek mathematician called Eratosthenes made a simple tool for sorting out prime numbers. This tool is called the ‘Sieve of Eratosthenes’ and the figure on page 7 shows how it works for prime numbers up to 100. You will learn how to find HCFs by using prime factors later in the chapter. FAST FORWARD Recognising the type of problem helps you to choose the correct mathematical techniques for solving it. Word problems involving HCF usually involve splitting things into smaller pieces or arranging things in equal groups or rows. e s s - R e v i e w C o p y - C a m b r i d g e U n i v e r s i t y P r e s s - R e v i e w C o p y R e v i e w C o p y - C a m b r i d g e U n i v e r s i t y P r e s s - R e v i e w C o p y R e v i e w C o p y - C a m b r i d g e U n i v e r s i t y P r e s s - R e v i e w C o p y R e v i e w C o p y - C a m b r i d g e U n i v e r s i t y Copyright Material - Review Only - Not for Redistribution
- 17. Unit 1: Number 7 1 Reviewing number concepts 11 12 21 31 41 51 61 71 81 91 3 13 23 33 43 53 63 73 83 93 4 14 24 34 44 54 64 74 84 94 5 15 25 35 45 55 65 75 85 95 6 16 26 36 46 56 66 76 86 96 2 22 32 42 52 62 72 82 92 7 17 27 37 47 57 67 77 87 97 1 8 18 28 38 48 58 68 78 88 98 9 19 29 39 49 59 69 79 89 99 10 20 30 40 50 60 70 80 90 100 Cross out 1, it is not prime. Circle 2, then cross out other multiples of 2. Circle 3, then cross out other multiples of 3. Circle the next available number then cross out all its multiples. Repeat until all the numbers in the table are either circled or crossed out. The circled numbers are the primes. You should try to memorise which numbers between 1 and 100 are prime. Other mathematicians over the years have developed ways of finding larger and larger prime numbers. Until 1955, the largest known prime number had less than 1000 digits. Since the 1970s and the invention of more and more powerful computers, more and more prime numbers have been found. The graph below shows the number of digits in the largest known primes since 1996. 60 000 000 50 000 000 40 000 000 30 000 000 20 000 000 10 000 000 Number of digits 0 1996 1998 2000 2002 2004 2006 Year 2008 2010 2012 2014 Number of digits in largest known prime number against year found 80 000 000 70 000 000 2016 Source: https://www.mersenne.org/primes/ Today anyone can join the Great Internet Mersenne Prime Search. This project links thousands of home computers to search continuously for larger and larger prime numbers while the computer processors have spare capacity. Exercise 1.7 1 Which is the only even prime number? 2 How many odd prime numbers are there less than 50? 3 a List the composite numbers greater than four, but less than 30. b Try to write each composite number on your list as the sum of two prime numbers. For example: 6 = 3 + 3 and 8 = 3 + 5. A good knowledge of primes can help when factorising quadratics in chapter 10. FAST FORWARD e s s - R e v i e w C o p y - C a m b r i d g e U n i v e r s i t y P r e s s - R e v i e w C o p y R e v i e w C o p y - C a m b r i d g e U n i v e r s i t y P r e s s - R e v i e w C o p y R e v i e w C o p y - C a m b r i d g e U n i v e r s i t y P r e s s - R e v i e w C o p y R e v i e w C o p y - C a m b r i d g e U n i v e r s i t y Copyright Material - Review Only - Not for Redistribution
- 18. Unit 1: Number Cambridge IGCSE Mathematics 8 4 Twin primes are pairs of prime numbers that differ by two. List the twin prime pairs up to 100. 5 Is 149 a prime number? Explain how you decided. 6 Super-prime numbers are prime numbers that stay prime each time you remove a digit (starting with the units). So, 59 is a super-prime because when you remove 9 you are left with 5, which is also prime. 239 is also a super-prime because when you remove 9 you are left with 23 which is prime, and when you remove 3 you are left with 2 which is prime. a Find two three-digit super-prime numbers less than 400. b Can you find a four-digit super-prime number less than 3000? c Sondra’s telephone number is the prime number 987-6413. Is her phone number a super-prime? Prime factors Prime factors are the factors of a number that are also prime numbers. Every composite whole number can be broken down and written as the product of its prime factors. You can do this using tree diagrams or using division. Both methods are shown in worked example 5. Prime numbers only have two factors: 1 and the number itself. As 1 is not a prime number, do not include it when expressing a number as a product of prime factors. Choose the method that works best for you and stick to it. Always show your method when using prime factors. Worked example 5 Write the following numbers as the product of prime factors. a 36 b 48 Using a factor tree 36 12 3 3 2 2 4 36 = 2 × 2 × 3 × 3 48 12 4 3 2 2 2 2 4 48 = 2 × 2 × 2 × 2 × 3 Write the number as two factors. If a factor is a prime number, circle it. If a factor is a composite number, split it into two factors. Keep splitting until you end up with two primes. Write the primes in ascending order with × signs. Using division 36 18 9 3 1 2 2 3 3 36 = 2 × 2 × 3 × 3 48 24 12 6 3 1 2 2 2 2 3 48 = 2 × 2 × 2 × 2 × 3 Divide by the smallest prime number that will go into the number exactly. Continue dividing, using the smallest prime number that will go into your new answer each time. Stop when you reach 1. Write the prime factors in ascending order with × signs. Whilst super-prime numbers are interesting, they are not on the syllabus. Tip Remember a product is the answer to a multiplication. So if you write a number as the product of its prime factors you are writing it using multiplication signs like this: 12 = 2 × 2 × 3. e s s - R e v i e w C o p y - C a m b r i d g e U n i v e r s i t y P r e s s - R e v i e w C o p y R e v i e w C o p y - C a m b r i d g e U n i v e r s i t y P r e s s - R e v i e w C o p y R e v i e w C o p y - C a m b r i d g e U n i v e r s i t y P r e s s - R e v i e w C o p y R e v i e w C o p y - C a m b r i d g e U n i v e r s i t y Copyright Material - Review Only - Not for Redistribution
- 19. Unit 1: Number 9 1 Reviewing number concepts Exercise 1.8 1 Express the following numbers as the product of prime factors. a 30 b 24 c 100 d 225 e 360 f 504 g 650 h 1125 i 756 j 9240 Using prime factors to find the HCF and LCM When you are working with larger numbers you can determine the HCF or LCM by expressing each number as a product of its prime factors. Worked example 6 Find the HCF of 168 and 180. 168 = 2 × 2 × 2 × 3 × 7 180 = 2 × 2 × 3 × 3 × 5 2 × 2 × 3 = 12 HCF = 12 First express each number as a product of prime factors. Use tree diagrams or division to do this. Underline the factors common to both numbers. Multiply these out to find the HCF. Worked example 7 Find the LCM of 72 and 120. 72 = 2 × 2 × 2 × 3 × 3 120 = 2 × 2 × 2 × 3 × 5 2 × 2 × 2 × 3 × 3 × 5 = 360 LCM = 360 First express each number as a product of prime factors. Use tree diagrams or division to do this. Underline the largest set of multiples of each factor. List these and multiply them out to find the LCM. Exercise 1.9 1 Find the HCF of these numbers by means of prime factors. a 48 and 108 b 120 and 216 c 72 and 90 d 52 and 78 e 100 and 125 f 154 and 88 g 546 and 624 h 95 and 120 2 Use prime factorisation to determine the LCM of: a 54 and 60 b 54 and 72 c 60 and 72 d 48 and 60 e 120 and 180 f 95 and 150 g 54 and 90 h 90 and 120 3 Determine both the HCF and LCM of the following numbers. a 72 and 108 b 25 and 200 c 95 and 120 d 84 and 60 You won’t be told to use the HCF or LCM to solve a problem, you will need to recognise that word problems involving LCM usually include repeating events. You may be asked how many items you need to ‘have enough’ or when something will happen again at the same time. Applying your skills 4 A radio station runs a phone-in competition for listeners. Every 30th caller gets a free airtime voucher and every 120th caller gets a free mobile phone. How many listeners must phone in before one receives both an airtime voucher and a free phone? 5 Lee runs round a track in 12 minutes. James runs round the same track in 18 minutes. If they start in the same place, at the same time, how many minutes will pass before they both cross the start line together again? Divisibility tests to find factors easily Sometimes you want to know if a smaller number will divide into a larger one with no remainder. In other words, is the larger number divisible by the smaller one? When you write your number as a product of primes, group all occurrences of the same prime number together. You can also use prime factors to find the square and cube roots of numbers if you don’t have a calculator. You will deal with this in more detail later in this chapter. FAST FORWARD e s s - R e v i e w C o p y - C a m b r i d g e U n i v e r s i t y P r e s s - R e v i e w C o p y R e v i e w C o p y - C a m b r i d g e U n i v e r s i t y P r e s s - R e v i e w C o p y R e v i e w C o p y - C a m b r i d g e U n i v e r s i t y P r e s s - R e v i e w C o p y R e v i e w C o p y - C a m b r i d g e U n i v e r s i t y Copyright Material - Review Only - Not for Redistribution
- 20. Unit 1: Number Cambridge IGCSE Mathematics 10 These simple divisibility tests are useful for working this out: A number is exactly divisible by: 2 if it ends with 0, 2, 4, 6 or 8 (in other words is even) 3 if the sum of its digits is a multiple of 3 (can be divided by 3) 4 if the last two digits can be divided by 4 5 if it ends with 0 or 5 6 if it is divisible by both 2 and 3 8 if the last three digits are divisible by 8 9 if the sum of the digits is a multiple of 9 (can be divided by 9) 10 if the number ends in 0. There is no simple test for divisibility by 7, although multiples of 7 do have some interesting properties that you can investigate on the internet. Exercise 1.10 23 65 92 10 104 70 500 21 64 798 1223 1 Look at the box of numbers above. Which of these numbers are: a divisible by 5? b divisible by 8? c divisible by 3? 2 Say whether the following are true or false. a 625 is divisible by 5 b 88 is divisible by 3 c 640 is divisible by 6 d 346 is divisible by 4 e 476 is divisible by 8 f 2340 is divisible by 9 g 2890 is divisible by 6 h 4562 is divisible by 3 i 40090 is divisible by 5 j 123456 is divisible by 9 3 Can $34.07 be divided equally among: a two people? b three people? c nine people? 4 A stadium has 202008 seats. Can these be divided equally into: a five blocks? b six blocks? c nine blocks? 5 a If a number is divisible by 12, what other numbers must it be divisible by? b If a number is divisible by 36, what other numbers must it be divisible by? c How could you test if a number is divisible by 12, 15 or 24? 6 Jacqueline and Sophia stand facing one another. At exactly the same moment both girls start to turn steadily on the spot. It takes Jacqueline 3 seconds to complete one full turn, whilst Sophia takes 4 seconds to make on full turn. How many times will Jacqueline have turned when the girls are next facing each other? 1.4 Powers and roots Square numbers and square roots A number is squared when it is multiplied by itself. For example, the square of 5 is 5 × 5 = 25. The symbol for squared is 2 . So, 5 × 5 can also be written as 52 . The square root of a number is the number that was multiplied by itself to get the square number. The symbol for square root is . You know that 25 = 52 , so 25 = 5. Cube numbers and cube roots A number is cubed when it is multiplied by itself and then multiplied by itself again. For example, the cube of 2 is 2 × 2 × 2 = 8. The symbol for cubed is 3 . So 2 × 2 × 2 can also be written as 23 . Divisibility tests are not part of the syllabus. They are just useful to know when you work with factors and prime numbers. Tip In section 1.1 you learned that the product obtained when an integer is multiplied by itself is a square number. REWIND E e s s - R e v i e w C o p y - C a m b r i d g e U n i v e r s i t y P r e s s - R e v i e w C o p y R e v i e w C o p y - C a m b r i d g e U n i v e r s i t y P r e s s - R e v i e w C o p y R e v i e w C o p y - C a m b r i d g e U n i v e r s i t y P r e s s - R e v i e w C o p y R e v i e w C o p y - C a m b r i d g e U n i v e r s i t y Copyright Material - Review Only - Not for Redistribution
- 21. Unit 1: Number 11 1 Reviewing number concepts The cube root of a number is the number that was multiplied by itself to get the cube number. The symbol for cube root is 3 . You know that 8 = 23 , so 8 3 = 2. 2 2 a) Square numbers can be arranged to form a square shape. This is 22 . 2 2 2 b) Cube numbers can be arranged to form a solid cube shape. This is 23 . Finding powers and roots You can use your calculator to square or cube numbers quickly using the x2 and x3 keys or the x◻ key. Use the or keys to find the roots. If you don’t have a calculator, you can use the product of prime factors method to find square and cube roots of numbers. Both methods are shown in the worked examples below. Worked example 8 Use your calculator to find: a 132 b 53 c 324 d 512 3 a 132 = 169 Enter 1 3 x2 = b 53 = 125 Enter 5 x3 = . If you do not have a x3 button then enter 5 x◻ 3 = ; for this key you have to enter the power. c 324 18 = Enter 3 2 4 = d 512 8 3 = Enter 5 1 2 = Worked example 9 If you do not have a calculator, you can write the integer as a product of primes and group the prime factors into pairs or threes. Look again at parts (c) and (d) of worked example 8: c 324 d 512 3 c 324 2 2 2 3 3 3 3 3 3 = 2 2 2 2 × 3 3 3 3 × 3 3 3 3 × 2 × 3 × 3 = 18 324 18 = Group the factors into pairs, and write down the square root of each pair. Multiply the roots together to give you the square root of 324. d 512 2 2 2 2 2 2 2 2 2 2 2 2 = 2 2 2 × × 2 2 2 × 2 2 2 × × 2 2 2 × 2 2 2 × × 2 2 2 × × 2 × 2 × 2 = 8 512 8 3 = Group the factors into threes, and write the cube root of each threesome. Multiply together to get the cube root of 512. Not all calculators have exactly the same buttons. x◻ xy and ∧ all mean the same thing on different calculators. Fractional powers and roots are used in many different financial calculations involving investments, insurance policies and economic decisions. LINK e s s - R e v i e w C o p y - C a m b r i d g e U n i v e r s i t y P r e s s - R e v i e w C o p y R e v i e w C o p y - C a m b r i d g e U n i v e r s i t y P r e s s - R e v i e w C o p y R e v i e w C o p y - C a m b r i d g e U n i v e r s i t y P r e s s - R e v i e w C o p y R e v i e w C o p y - C a m b r i d g e U n i v e r s i t y Copyright Material - Review Only - Not for Redistribution
- 22. Unit 1: Number Cambridge IGCSE Mathematics 12 Other powers and roots You’ve seen that square numbers are all raised to the power of 2 (5 squared = 5 × 5 = 52 ) and that cube numbers are all raised to the power of 3 (5 cubed = 5 × 5 × 5 = 53 ). You can raise a number to any power. For example, 5 × 5 × 5 × 5 = 54 . This is read as 5 to the power of 4. The same principle applies to finding roots of numbers. 52 = 25 25 = 5 53 = 125 125 3 = 5 54 = 625 625 4 = 5 You can use your calculator to perform operations using any roots or squares. The yx key calculates any power. So, to find 75 , you would enter 7 yx 5 and get a result of 16 807. The x key calculates any root. So, to find 4 81, you would enter 4 x 81 and get a result of 3. Exercise 1.11 1 Calculate: a 32 b 72 c 112 d 122 e 212 f 192 g 322 h 1002 i 142 j 682 2 Calculate: a 13 b 33 c 43 d 63 e 93 f 103 g 1003 h 183 i 303 j 2003 Learn the squares of all integers between 1 and 20 inclusive. You will need to recognise these quickly. Spotting a pattern of square numbers can help you solve problems in different contexts. 3 Find a value of x to make each of these statements true. a x × x = 25 b x × x × x = 8 c x × x = 121 d x × x × x = 729 e x × x = 324 f x × x = 400 g x × x × x = 8000 h x × x = 225 i x × x × x = 1 j x = 9 k 1 = x l x = 81 m x 3 2 = n x 3 1 = o 64 3 = x 4 Use a calculator to find the following roots. a 9 b 64 c 1 d 4 e 100 f 0 g 81 h 400 i 1296 j 1764 k 8 3 l 1 3 m 27 3 n 64 3 o 1000 3 p 216 3 q 512 3 r 729 3 s 1728 3 t 5832 3 5 Use the product of prime factors given below to find the square root of each number. Show your working. a 324 = 2 × 2 × 3 × 3 × 3 × 3 b 225 = 3 × 3 × 5 × 5 c 784 = 2 × 2 × 2 × 2 × 7 × 7 d 2025 = 3 × 3 × 3 × 3 × 5 × 5 e 19600 = 2 × 2 × 2 × 2 × 5 × 5 × 7 × 7 f 250000 = 2 × 2 × 2 × 2 × 5 × 5 × 5 × 5 × 5 × 5 6 Use the product of prime factors to find the cube root of each number. Show your working. a 27 = 3 × 3 × 3 b 729 = 3 × 3 × 3 × 3 × 3 × 3 c 2197 = 13 × 13 × 13 d 1000 = 2 × 2 × 2 × 5 × 5 × 5 e 15625 = 5 × 5 × 5 × 5 × 5 × 5 f 32768 = 2 × 2 × 2 × 2 × 2 × 2 × 2 × 2 × 2 × 2 × 2 × 2 × 2 × 2 × 2 Make sure that you know which key is used for each function on your calculator and that you know how to use it. On some calculators these keys might be second functions. You will work with higher powers and roots again when you deal with indices in chapter 2, standard form in chapter 5 and rates of growth and decay in chapters 17 and 18. FAST FORWARD e s s - R e v i e w C o p y - C a m b r i d g e U n i v e r s i t y P r e s s - R e v i e w C o p y R e v i e w C o p y - C a m b r i d g e U n i v e r s i t y P r e s s - R e v i e w C o p y R e v i e w C o p y - C a m b r i d g e U n i v e r s i t y P r e s s - R e v i e w C o p y R e v i e w C o p y - C a m b r i d g e U n i v e r s i t y Copyright Material - Review Only - Not for Redistribution
- 23. Unit 1: Number 13 1 Reviewing number concepts 7 Calculate: a ( ) ( ) ( ) 25 ( )2 b ( ) ( ) ( ) 49 ( )2 c ( ) ( ) ( ) 64 ( ) 3 ( ) ( )3 d ( ) ( ) ( ) 32 ( ) 3 ( ) ( )3 e 9 1 9 16 9 1 9 1 f 9 16 9 1 9 1 g 36 64 + h 36 64 + i 100 36 − j 100 36 − k 25 4 × l 25 4 × m 9 4 9 4 9 4 n 9 4 9 4 9 4 9 4 o 36 4 p 36 4 8 Find the length of the edge of a cube with a volume of: a 1000cm3 b 19683cm3 c 68921mm3 d 64000cm3 9 If the symbol * means ‘add the square of the first number to the cube of the second number’, calculate: a 2 * 3 b 3 * 2 c 1 * 4 d 4 * 1 e 2 * 4 f 4 * 2 g 1 * 9 h 9 * 1 i 5 * 2 j 2 * 5 10 Evaluate. a 24 × 23 b 35 × 64 6 c 34 + 256 4 d 24 × 7776 5 e 625 4 × 26 f 84 ÷ ( 32 5 )3 11 Which is greater and by how much? a 80 × 44 or 24 × 34 b 625 4 × 36 or 729 6 × 44 1.5 Working with directed numbers A negative sign is used to indicate that values are less than zero. For example, on a thermometer, on a bank statement or in an elevator. When you use numbers to represent real-life situations like temperatures, altitude, depth below sea level, profit or loss and directions (on a grid), you sometimes need to use the negative sign to indicate the direction of the number. For example, a temperature of three degrees below zero can be shown as −3°C. Numbers like these, which have direction, are called directed numbers. So if a point 25m above sea level is at +25m, then a point 25m below sea level is at −25m. Exercise 1.12 1 Express each of these situations using a directed number. a a profit of $100 b 25km below sea level c a drop of 10 marks d a gain of 2kg e a loss of 1.5kg f 8000m above sea level g a temperature of 10°C below zero h a fall of 24m i a debt of $2000 j an increase of $250 k a time two hours behind GMT l a height of 400m m a bank balance of $450.00 Brackets act as grouping symbols. Work out any calculations inside brackets before doing the calculations outside the brackets. Root signs work in the same way as a bracket. If you have 25 9 + , you must add 25 and 9 before finding the root. Once a direction is chosen to be positive, the opposite direction is taken to be negative. So: • if up is positive, down is negative • if right is positive, left is negative • if north is positive, south is negative • if above 0 is positive, below 0 is negative. e s s - R e v i e w C o p y - C a m b r i d g e U n i v e r s i t y P r e s s - R e v i e w C o p y R e v i e w C o p y - C a m b r i d g e U n i v e r s i t y P r e s s - R e v i e w C o p y R e v i e w C o p y - C a m b r i d g e U n i v e r s i t y P r e s s - R e v i e w C o p y R e v i e w C o p y - C a m b r i d g e U n i v e r s i t y Copyright Material - Review Only - Not for Redistribution
- 24. Unit 1: Number Cambridge IGCSE Mathematics 14 Comparing and ordering directed numbers In mathematics, directed numbers are also known as integers. You can represent the set of integers on a number line like this: –5 –9 –7 –8 –10 –3 –2 –1 0 1 2 3 4 5 6 7 8 9 10 –4 –6 The further to the right a number is on the number line, the greater its value. Exercise 1.13 1 Copy the numbers and fill in or to make a true statement. a 2 8 2 8 2 8 b 4 9 4 9 4 9 c 12 3 d 6 4 6 4 6 4 6 4 6 4 e −7 4 7 4 7 4 f −2 4 2 4 2 4 g − − 2 1 − − 2 1 − − 1 2 1 2 1 − − 2 1 − − 2 1 h − − 12 − − 12 − −20 − − − − i −8 0 8 0 8 0 j −2 2 2 2 2 2 k − − 12 − − 12 − −4 − − − − l − − 32 − − 32 − −3 − − − − m 0 3 0 3 0 3 0 3 0 3 n −3 11 3 1 3 1 o 12 89 − 2 Arrange each set of numbers in ascending order. a −8, 7, 10, −1, −12 b 4, −3, −4, −10, 9, −8 c −11, −5, −7, 7, 0, −12 d −94, −50, −83, −90, 0 Applying your skills 3 Study the temperature graph carefully. –4 –2 0 2 4 6 8 10 Sunday 14 Sunday 21 M T W T F S M T W T F S Sunday 28 Day of the week Temperature (°C) a What was the temperature on Sunday 14 January? b By how much did the temperature drop from Sunday 14 to Monday 15? c What was the lowest temperature recorded? d What is the difference between the highest and lowest temperatures? e On Monday 29 January the temperature changed by −12 degrees. What was the temperature on that day? 4 Matt has a bank balance of $45.50. He deposits $15.00 and then withdraws $32.00. What is his new balance? 5 Mr Singh’s bank account is $420 overdrawn. a Express this as a directed number. b How much money will he need to deposit to get his account to have a balance of $500? c He deposits $200. What will his new balance be? 6 A diver 27m below the surface of the water rises 16m. At what depth is she then? 7 On a cold day in New York, the temperature at 6a.m. was −5°C. By noon, the temperature had risen to 8°C. By 7p.m. the temperature had dropped by 11°C from its value at noon. What was the temperature at 7p.m.? You will use similar number lines when solving linear inequalities in chapter 14. FAST FORWARD It is important that you understand how to work with directed numbers early in your IGCSE course. Many topics depend upon them! The difference between the highest and lowest temperature is also called the range of temperatures. e s s - R e v i e w C o p y - C a m b r i d g e U n i v e r s i t y P r e s s - R e v i e w C o p y R e v i e w C o p y - C a m b r i d g e U n i v e r s i t y P r e s s - R e v i e w C o p y R e v i e w C o p y - C a m b r i d g e U n i v e r s i t y P r e s s - R e v i e w C o p y R e v i e w C o p y - C a m b r i d g e U n i v e r s i t y Copyright Material - Review Only - Not for Redistribution
- 25. Unit 1: Number 15 1 Reviewing number concepts 8 Local time in Abu Dhabi is four hours ahead of Greenwich Mean Time. Local time in Rio de Janeiro is three hours behind Greenwich Mean Time. a If it is 4p.m. at Greenwich, what time is it in Abu Dhabi? b If it is 3a.m. in Greenwich, what time is it in Rio de Janiero? c If it is 3p.m. in Rio de Janeiro, what time is it in Abu Dhabi? d If it is 8a.m. in Abu Dhabi, what time is it in Rio de Janeiro? 1.6 Order of operations At this level of mathematics you are expected to do more complicated calculations involving more than one operation (+, −, × and ÷). When you are carrying out more complicated calculations you have to follow a sequence of rules so that there is no confusion about what operations you should do first. The rules governing the order of operations are: • complete operations in grouping symbols first • do division and multiplication next, working from left to right • do addition and subtractions last, working from left to right. Many people use the letters BODMAS to remember the order of operations. The letters stand for: Brackets Of Divide Multiply Add Subtract (Sometimes, ‘I’ for ‘indices’ is used instead of ‘O’ for ‘of’) BODMAS indicates that indices (powers) are considered after brackets but before all other operations. Grouping symbols The most common grouping symbols in mathematics are brackets. Here are some examples of the different kinds of brackets used in mathematics: (4 + 9) × (10 ÷ 2) [2(4 + 9) − 4(3) − 12] {2 − [4(2 − 7) − 4(3 + 8)] − 2 × 8} When you have more than one set of brackets in a calculation, you work out the innermost set first. Other symbols used to group operations are: • fraction bars, e.g. 5 12 3 8 5 1 5 1 3 8 3 8 • root signs, such as square roots and cube roots, e.g. 9 16 9 1 9 1 • powers, e.g. 52 or 43 Worked example 10 Simplify: a 7 × (3 + 4) b (10 − 4) × (4 + 9) c 45 − [20 × (4 − 3)] a 7 × 7 = 49 b 6 × 13 = 78 c 45 − [20 × 1] = 45 − 20 = 25 e s s - R e v i e w C o p y - C a m b r i d g e U n i v e r s i t y P r e s s - R e v i e w C o p y R e v i e w C o p y - C a m b r i d g e U n i v e r s i t y P r e s s - R e v i e w C o p y R e v i e w C o p y - C a m b r i d g e U n i v e r s i t y P r e s s - R e v i e w C o p y R e v i e w C o p y - C a m b r i d g e U n i v e r s i t y Copyright Material - Review Only - Not for Redistribution
- 26. Unit 1: Number Cambridge IGCSE Mathematics 16 Worked example 11 Worked example 11 Calculate: a 3 + 82 b c 36 4 100 36 ÷ + 4 ÷ + − a 3 8 3 64 67 3 8 + × 3 8 = + 3 6 = + 3 6 = ( ) 3 8 ( ) 3 8 8 ( ) + × ( ) 3 8 + × ( ) 3 8 + × b ( ) ( ) ( ) 4 2 ( ) 8 1 ( ) 8 1 ( ) ( ) 8 1 ( ) ( ) 7 9 ( ) 32 8 4 ( ) + ÷ ( ) 4 2 ( ) + ÷ ( ) 4 28 1 + ÷ 8 1 ( ) 8 1 ( ) + ÷ 8 1 ( ) 7 9 ( ) 7 9 = ÷ 32 = ÷ = c 36 4 100 36 9 6 9 64 3 8 11 ÷ + 4 ÷ + − = + = + 9 6 = + 9 6 = + 3 8 = + 3 8 = Exercise 1.14 1 Calculate. Show the steps in your working. a (4 + 7) × 3 b (20 − 4) ÷ 4 c 50 ÷ (20 + 5) d 6 × (2 + 9) e (4 + 7) × 4 f (100 − 40) × 3 g 16 + (25 ÷ 5) h 19 − (12 + 2) i 40 ÷ (12 − 4) j 100 ÷ (4 + 16) k 121 ÷ (33 ÷ 3) l 15 × (15 − 15) 2 Calculate: a (4 + 8) × (16 − 7) b (12 − 4) × (6 + 3) c (9 + 4) − (4 + 6) d (33 + 17) ÷ (10 − 5) e (4 × 2) + (8 × 3) f (9 × 7) ÷ (27 − 20) g (105 − 85) ÷ (16 ÷ 4) h (12 + 13) ÷ 52 i (56 − 62 ) × (4 + 3) 3 Simplify. Remember to work from the innermost grouping symbols to the outermost. a 4 + [12 − (8 − 5)] b 6 + [2 − (2 × 0)] c 8 + [60 − (2 + 8)] d 200 − [(4 + 12) − (6 + 2)] e 200 × {100 − [4 × (2 + 8)]} f {6 + [5 × (2 + 30)]} × 10 g [(30 + 12) − (7 + 9)] × 10 h 6 × [(20 ÷ 4) − (6 − 3) + 2] i 1000 − [6 × (4 + 20) − 4 × (3 + 0)] 4 Calculate: a 6 + 72 b 29 − 23 c 8 × 42 d 20 − 4 ÷ 2 e 31 10 14 7 − − f 100 40 5 4 − 5 4 5 4 g 100 36 − h 8 8 8 8 8 8 i 90 9 − 5 Insert brackets into the following calculations to make them true. a 3 × 4 + 6 = 30 b 25 − 15 × 9 = 90 c 40 − 10 × 3 = 90 d 14 − 9 × 2 = 10 e 12 + 3 ÷ 5 = 3 f 19 − 9 × 15 = 150 g 10 + 10 ÷ 6 − 2 = 5 h 3 + 8 × 15 − 9 = 66 i 9 − 4 × 7 + 2 = 45 j 10 − 4 × 5 = 30 k 6 ÷ 3 + 3 × 5 = 5 l 15 − 6 ÷ 2 = 12 m 1 + 4 × 20 ÷ 5 = 20 n 8 + 5 − 3 × 2 = 20 o 36 ÷ 3 × 3 − 3 = 6 p 3 × 4 − 2 ÷ 6 = 1 q 40 ÷ 4 + 1 = 11 r 6 + 2 × 8 + 2 = 24 Working in the correct order Now that you know what to do with grouping symbols, you are going to apply the rules for order of operations to perform calculations with numbers. Exercise 1.15 1 Simplify. Show the steps in your working. a 5 × 10 + 3 b 5 × (10 + 3) c 2 + 10 × 3 d (2 + 10) × 3 e 23 + 7 × 2 f 6 × 2 ÷ (3 + 3) A bracket ‘type’ is always twinned with another bracket of the same type/shape. This helps mathematicians to understand the order of calculations even more easily. You will apply the order of operation rules to fractions, decimals and algebraic expressions as you progress through the course. FAST FORWARD 4 28 17 9 4 2 4 2 − e s s - R e v i e w C o p y - C a m b r i d g e U n i v e r s i t y P r e s s - R e v i e w C o p y R e v i e w C o p y - C a m b r i d g e U n i v e r s i t y P r e s s - R e v i e w C o p y R e v i e w C o p y - C a m b r i d g e U n i v e r s i t y P r e s s - R e v i e w C o p y R e v i e w C o p y - C a m b r i d g e U n i v e r s i t y Copyright Material - Review Only - Not for Redistribution RM.DL.Books
- 27. Unit 1: Number 17 1 Reviewing number concepts g 15 5 2 5 − 2 5 2 5 h (17 + 1 ) ÷ 9 + 2 i 16 4 4 1 − 4 1 4 1 j 17 + 3 × 21 k 48 − (2 + 3) × 2 l 12 × 4 − 4 × 8 m 15 + 30 ÷ 3 + 6 n 20 − 6 ÷ 3 + 3 o 10 − 4 × 2 ÷ 2 2 Simplify: a 18 − 4 × 2 − 3 b 14 − (21 ÷ 3) c 24 ÷ 8 × (6 − 5) d 42 ÷ 6 − 3 − 4 e 5 + 36 ÷ 6 − 8 f (8 + 3) × (30 ÷ 3) ÷ 11 3 State whether the following are true or false. a (1 + 4) × 20 + 5 = 1 + (4 × 20) + 5 b 6 × (4 + 2) × 3 (6 × 4) ÷ 2 × 3 c 8 + (5 − 3) × 2 8 + 5 − (3 × 2) d 100 + 10 ÷ 10 (100 + 10) ÷ 10 4 Place the given numbers in the correct spaces to make a correct number sentence. a 0, 2, 5, 10 − ÷ b 9, 11, 13, 18 − ÷ c 1, 3, 8, 14, 16 ÷ − − = − = ( ) ( ) ( ) ÷ − ( ) ÷ − ( ) ÷ − d 4, 5, 6, 9, 12 ( ) ( ) ( ) ( ) ( ) ( ) + − ( ) + − ( ) ( ) + − ( ) − = ( ) − = ( ) ( ) − = ( ) Using your calculator A calculator with algebraic logic will apply the rules for order of operations automatically. So, if you enter 2 + 3 × 4, your calculator will do the multiplication first and give you an answer of 14. (Check that your calculator does this!). When the calculation contains brackets you must enter these to make sure your calculator does the grouped sections first. Experiment with your calculator by making several calculations with and without brackets. For example: 3 × 2 + 6 and 3 × (2 + 6). Do you understand why these are different? Your calculator might only have one type of bracket ( and ) . If there are two different shaped brackets in the calculation (such as [4 × (2 – 3)], enter the calculator bracket symbol for each type. Worked example 12 Use a calculator to find: a 3 + 2 × 9 b (3 + 8) × 4 c (3 × 8 − 4) − (2 × 5 + 1) a 21 Enter 3 + 2 × 9 = b 44 Enter ( 3 + 8 ) × 4 = c 9 Enter ( 3 × 8 − 4 ) − ( 2 × 5 + 1 ) = Exercise 1.16 1 Use a calculator to find the correct answer. a 10 − 4 × 5 b 12 + 6 ÷ 7 − 4 c 3 + 4 × 5 − 10 d 18 ÷ 3 × 5 − 3 + 2 e 5 − 3 × 8 − 6 ÷ 2 f 7 + 3 ÷ 4 + 1 g (1 + 4) × 20 ÷ 5 h 36 ÷ 6 × (3 − 3) i (8 + 8) − 6 × 2 j 100 − 30 × (4 − 3) k 24 ÷ (7 + 5) × 6 l [(60 − 40) − (53 − 43)] × 2 m [(12 + 6) ÷ 9] × 4 n [100 ÷ (4 + 16)] × 3 o 4 × [25 ÷ (12 − 7)] 2 Use your calculator to check whether the following answers are correct. If the answer is incorrect, work out the correct answer. a 12 × 4 + 76 = 124 b 8 + 75 × 8 = 698 c 12 × 18 − 4 × 23 = 124 d (16 ÷ 4) × (7 + 3 × 4) = 76 e (82 − 36) × (2 + 6) = 16 f (3 × 7 − 4) − (4 + 6 ÷ 2) = 12 In this section you will use your calculator to perform operations in the correct order. However, you will need to remember the order of operations rules and apply them throughout the book as you do more complicated examples using your calculator. Some calculators have two ‘−’ buttons: − and (−) . The first means ‘subtract’ and is used to subtract one number from another. The second means ‘make negative’. Experiment with the buttons and make sure that your calculator is doing what you expect it to do! e s s - R e v i e w C o p y - C a m b r i d g e U n i v e r s i t y P r e s s - R e v i e w C o p y R e v i e w C o p y - C a m b r i d g e U n i v e r s i t y P r e s s - R e v i e w C o p y R e v i e w C o p y - C a m b r i d g e U n i v e r s i t y P r e s s - R e v i e w C o p y R e v i e w C o p y - C a m b r i d g e U n i v e r s i t y Copyright Material - Review Only - Not for Redistribution
- 28. Unit 1: Number Cambridge IGCSE Mathematics 18 3 Each * represents a missing operation. Work out what it is. a 12 * (28 * 24) = 3 b 84 * 10 * 8 = 4 c 3 * 7(0.7 * 1.3) = 17 d 23 * 11 * 22 * 11 = 11 e 40 * 5 * (7 * 5) = 4 f 9 * 15 * (3 * 2) = 12 4 Calculate: a 7 1 7 16 2 7 1 3 2 2 7 3 2 2 7 7 1 7 1 + − 2 7 + − 2 7 3 2 + − 2 7 3 2 + − 2 7 3 2 b 5 4 5 4 1 6 12 2 5 4 5 4 2 5 4 5 4 + − 1 6 + − 1 62 + − c 2 3 5 4 10 25 2 2 5 4 5 4 2 3 2 3 + × 5 4 + × 5 4 − d 6 11 2 1 2 6 1 6 1 6 1 6 1 ( ) 2 1 ( ) 2 17 2 4 ( ) 7 2 4 + × 7 2 4 ( ) + × e 3 3 2 8 2 81 2 3 3 3 3 3 3 3 3 2 8 2 8 f 3 5 6 4 5 2 3 5 3 5 − + 3 5 − + 3 5 4 5 4 5 g 36 3 1 3 16 15 3 3 2 3 3 3 3 − × 3 1 − × 3 1 − ÷ 3 3 − ÷ 3 3 3 3 3 3 − ÷ h −30 3 12 2 5 8 32 + ÷ − + 3 1 − + 3 12 2 − + − − 5 8 − − 5 8 [ ( 18 [ ( + ÷ [ ( + ÷ 18 + ÷ [ ( + ÷ ) ] 2 2 ) ] 2 24 ) ] 2 2 − + 2 2 ) ] 2 2 − + 5 Use a calculator to find the answer. a 0 345 1 34 4 2 7 . . . 1 3 . . 1 34 4 . . + × 4 4 + × 4 4 2 7 + × 2 7 . . + × 4 4 . . + × 4 4 . . b 12 32 0 0378 16 8 05 . . 32 . . 0 . . 8 0 8 0 × . . . . + c 16 0 087 2 5 098 2 2 5 2 5 × 2 5 2 5 . . d 19 23 0 087 2 45 1 03 2 2 5 1 2 2 5 1 03 2 2 . . 23 . . 0 . . . . 2 4 . . 2 45 1 . . × . . . . 5 1 5 1 6 Use your calculator to evaluate. a 64 125 × b 2 3 6 3 2 2 3 3 2 2 3 × × 2 3 × × 2 3 3 2 × × 2 3 3 2 × × 2 3 3 2 c 8 19 2 2 8 1 2 2 8 19 2 2 8 1 8 1 8 1 2 2 8 1 2 2 3 d 41 36 2 2 36 2 2 − e 3.2 1.17 2 3 2 1 2 3 2 1.1 2 3 7 2 3 2 1 2 1 f 1.45 0.13 3 2 0.13 3 2 − 3 g 1 4 1 4 1 4 1 4 + + + + h 2.752 − × − × 1 − × − × 2 − × − × 3 3 1 7 1 7 1 7 1.7 Rounding numbers In many calculations, particularly with decimals, you will not need to find an exact answer. Instead, you will be asked to give an answer to a stated level of accuracy. For example, you may be asked to give an answer correct to 2 decimal places, or an answer correct to 3 significant figures. To round a number to a given decimal place you look at the value of the digit to the right of the specified place. If it is 5 or greater, you round up; if it less than 5, you round down. Worked example 13 Round 64.839906 to: a the nearest whole number b 1 decimal place c 3 decimal places a 64.839906 4 is in the units place. 64.839906 The next digit is 8, so you will round up to get 5. = 65 (to nearest whole number) To the nearest whole number. b 64.839906 8 is in the first decimal place. 64.839906 The next digit is 3, so the 8 will remain unchanged. = 64.8 (1dp) Correct to 1 decimal place. c 64.839906 9 is in the third decimal place. 64.839906 The next digit is 9, so you need to round up. When you round 9 up, you get 10, so carry one to the previous digit and write 0 in the place of the 9. = 64.840 (3dp) Correct to 3 decimal places. The idea of ‘rounding’ runs through all subjects where numerical data is collected. Masses in physics, temperatures in biology, prices in economics: these all need to be recorded sensibly and will be rounded to a degree of accuracy appropriate for the situation. LINK When you work with indices and standard form in chapter 5, you will need to apply these skills and use your calculator effectively to solve problems involving any powers or roots. FAST FORWARD The more effectively you are able to use your calculator, the faster and more accurate your calculations are likely to be. e s s - R e v i e w C o p y - C a m b r i d g e U n i v e r s i t y P r e s s - R e v i e w C o p y R e v i e w C o p y - C a m b r i d g e U n i v e r s i t y P r e s s - R e v i e w C o p y R e v i e w C o p y - C a m b r i d g e U n i v e r s i t y P r e s s - R e v i e w C o p y R e v i e w C o p y - C a m b r i d g e U n i v e r s i t y Copyright Material - Review Only - Not for Redistribution
- 29. Unit 1: Number 19 1 Reviewing number concepts To round to 3 significant figures, find the third significant digit and look at the value of the digit to the right of it. If it is 5 or greater, add one to the third significant digit and lose all of the other digits to the right. If it is less than 5, leave the third significant digit unchanged and lose all the other digits to the right as before. To round to a different number of significant figures, use the same method but find the appropriate significant digit to start with: the fourth for 4sf, the seventh for 7sf etc. If you are rounding to a whole number, write the appropriate number of zeros after the last significant digit as place holders to keep the number the same size. Worked example 14 Round: a 1.076 to 3 significant figures b 0.00736 to 1 significant figure a 1.076 The third significant figure is the 7. The next digit is 6, so round 7 up to get 8. = 1.08 (3sf) Correct to 3 significant figures. b 0.00736 The first significant figure is the 7. The next digit is 3, so 7 will not change. = 0.007 (1sf) Correct to 1 significant figure. Exercise 1.17 1 Round each number to 2 decimal places. a 3.185 b 0.064 c 38.3456 d 2.149 e 0.999 f 0.0456 g 0.005 h 41.567 i 8.299 j 0.4236 k 0.062 l 0.009 m 3.016 n 12.0164 o 15.11579 2 Express each number correct to: i 4 significant figures ii 3 significant figures iii 1 significant figure a 4512 b 12 305 c 65 238 d 320.55 e 25.716 f 0.000765 g 1.0087 h 7.34876 i 0.00998 j 0.02814 k 31.0077 l 0.0064735 3 Change 2 5 9 to a decimal using your calculator. Express the answer correct to: a 3 decimal places b 2 decimal places c 1 decimal place d 3 significant figures e 2 significant figures f 1 significant figure The first significant digit of a number is the first non-zero digit, when reading from left to right. The next digit is the second significant digit, the next the third significant and so on. All zeros after the first significant digit are considered significant. Remember, the first significant digit in a number is the first non- zero digit, reading from left to right. Once you have read past the first non-zero digit, all zeros then become significant. You will use rounding to a given number of decimal places and significant figures in almost all of your work this year. You will also apply these skills to estimate answers. This is dealt with in more detail in chapter 5. FAST FORWARD e s s - R e v i e w C o p y - C a m b r i d g e U n i v e r s i t y P r e s s - R e v i e w C o p y R e v i e w C o p y - C a m b r i d g e U n i v e r s i t y P r e s s - R e v i e w C o p y R e v i e w C o p y - C a m b r i d g e U n i v e r s i t y P r e s s - R e v i e w C o p y R e v i e w C o p y - C a m b r i d g e U n i v e r s i t y Copyright Material - Review Only - Not for Redistribution
- 30. Unit 1: Number Cambridge IGCSE Mathematics 20 Summary Do you know the following? • Numbers can be classified as natural numbers, integers, prime numbers and square numbers. • When you multiply an integer by itself you get a square number (x2 ). If you multiply it by itself again you get a cube number (x3 ). • The number you multiply to get a square is called the square root and the number you multiply to get a cube is called the cube root. The symbol for square root is . The symbol for cube root is 3 . • A multiple is obtained by multiplying a number by a natural number. The LCM of two or more numbers is the lowest multiple found in all the sets of multiples. • A factor of a number divides into it exactly. The HCF of two or more numbers is the highest factor found in all the sets of factors. • Prime numbers have only two factors, 1 and the number itself. The number 1 is not a prime number. • A prime factor is a number that is both a factor and a prime number. • All natural numbers that are not prime can be expressed as a product of prime factors. • Integers are also called directed numbers. The sign of an integer (− or +) indicates whether its value is above or below 0. • Mathematicians apply a standard set of rules to decide the order in which operations must be carried out. Operations in grouping symbols are worked out first, then division and multiplication, then addition and subtraction. Are you able to . . . ? • identify natural numbers, integers, square numbers and prime numbers • find multiples and factors of numbers and identify the LCM and HCF • write numbers as products of their prime factors using division and factor trees • calculate squares, square roots, cubes and cube roots of numbers • work with integers used in real-life situations • apply the basic rules for operating with numbers • perform basic calculations using mental methods and with a calculator. e s s - R e v i e w C o p y - C a m b r i d g e U n i v e r s i t y P r e s s - R e v i e w C o p y R e v i e w C o p y - C a m b r i d g e U n i v e r s i t y P r e s s - R e v i e w C o p y R e v i e w C o p y - C a m b r i d g e U n i v e r s i t y P r e s s - R e v i e w C o p y R e v i e w C o p y - C a m b r i d g e U n i v e r s i t y Copyright Material - Review Only - Not for Redistribution
- 31. 21 Unit 1: Number Examination practice Exam-style questions 1 Here is a set of numbers: {−4, −1, 0, 3, 4, 6, 9, 15, 16, 19, 20} Which of these numbers are: a natural numbers? b square numbers? c negative integers? d prime numbers? e multiples of two? f factors of 80? 2 a List all the factors of 12. b List all the factors of 24. c Find the HCF of 12 and 24. 3 Find the HCF of 64 and 144. 4 List the first five multiples of: a 12 b 18 c 30 d 80 5 Find the LCM of 24 and 36. 6 List all the prime numbers from 0 to 40. 7 a Use a factor tree to express 400 as a product of prime factors. b Use the division method to express 1080 as a product of prime factors. c Use your answers to find: i the LCM of 400 and 1080 ii the HCF of 400 and 1080 iii 400 iv whether 1080 is a cube number; how can you tell? 8 Calculate: a 262 b 433 9 What is the smallest number greater than 100 that is: a divisible by two? b divisible by ten? c divisible by four? 10 At noon one day the outside temperature is 4°C. By midnight the temperature is 8 degrees lower. What temperature is it at midnight? 11 Simplify: a 6 × 2 + 4 × 5 b 4 × (100 − 15) c (5 + 6) × 2 + (15 − 3 × 2) − 6 12 Add brackets to this statement to make it true. 7 + 14 ÷ 4 − 1 × 2 = 14 Past paper questions 1 Insert one pair of brackets only to make the following statement correct. 6 + 5 × 10 − 8 = 16 [1] [Cambridge IGCSE Mathematics 0580 Paper 22 Q1 October/November 2014] 2 Calculate 8 24 2 56 1 26 0 72 . . 8 2 . . 8 24 2 . . . . 1 2 . . 1 26 0 . . 4 2 4 2 4 2 . . 4 2 . . 6 0 6 0 [1] [Cambridge IGCSE Mathematics 0580 Paper 22 Q2 October/November 2014] e s s - R e v i e w C o p y - C a m b r i d g e U n i v e r s i t y P r e s s - R e v i e w C o p y R e v i e w C o p y - C a m b r i d g e U n i v e r s i t y P r e s s - R e v i e w C o p y R e v i e w C o p y - C a m b r i d g e U n i v e r s i t y P r e s s - R e v i e w C o p y R e v i e w C o p y - C a m b r i d g e U n i v e r s i t y Copyright Material - Review Only - Not for Redistribution
- 32. Unit 1: Number 22 3 Write 3.5897 correct to 4 significant figures. [1] [Cambridge IGCSE Mathematics 0580 Paper 22 Q3 May/June 2016] 4 8 9 10 11 12 13 14 15 16 From the list of numbers, write down a the square numbers, [1] b a prime factor of 99. [1] [Cambridge IGCSE Mathematics 0580 Paper 22 Q5 May/June 2016] 5 a Write 90 as a product of prime factors. [2] b Find the lowest common multiple of 90 and 105. [2] [Cambridge IGCSE Mathematics 0580 Paper 22 Q15 October/November 2014] e s s - R e v i e w C o p y - C a m b r i d g e U n i v e r s i t y P r e s s - R e v i e w C o p y R e v i e w C o p y - C a m b r i d g e U n i v e r s i t y P r e s s - R e v i e w C o p y R e v i e w C o p y - C a m b r i d g e U n i v e r s i t y P r e s s - R e v i e w C o p y R e v i e w C o p y - C a m b r i d g e U n i v e r s i t y Copyright Material - Review Only - Not for Redistribution
- 33. 23 Unit 1: Algebra In this chapter you will learn how to: • use letters to represent numbers • write expressions to represent mathematical information • substitute letters with numbers to find the value of an expression • add and subtract like terms to simplify expressions • multiply and divide to simplify expressions • expand expressions by removing grouping symbols • use index notation in algebra • learn and apply the laws of indices to simplify expressions. • work with fractional indices. • Algebra • Variable • Equation • Formula • Substitution • Expression • Term • Power • Index • Coefficient • Exponent • Base • Reciprocal Key words You can think of algebra as the language of mathematics. Algebra uses letters and other symbols to write mathematical information in shorter ways. When you learn a language, you have to learn the rules and structures of the language. The language of algebra also has rules and structures. Once you know these, you can ‘speak’ the language of algebra and mathematics students all over the world will understand you. At school, and in the real world, you will use algebra in many ways. For example, you will use it to make sense of formulae and spreadsheets and you may use algebra to solve problems to do with money, building, science, agriculture, engineering, construction, economics and more. Once you know the basic rules, algebra is very easy and very useful. Chapter 2: Making sense of algebra e s s - R e v i e w C o p y - C a m b r i d g e U n i v e r s i t y P r e s s - R e v i e w C o p y R e v i e w C o p y - C a m b r i d g e U n i v e r s i t y P r e s s - R e v i e w C o p y R e v i e w C o p y - C a m b r i d g e U n i v e r s i t y P r e s s - R e v i e w C o p y R e v i e w C o p y - C a m b r i d g e U n i v e r s i t y Copyright Material - Review Only - Not for Redistribution
- 34. Unit 1: Algebra Cambridge IGCSE Mathematics 24 2.1 Using letters to represent unknown values In primary school you used empty shapes to represent unknown numbers. For example, 2 + = 8 and + = 10. If 2 + = 8, the can only represent 6. But if + = 10, then the and the can represent many different values. In algebra, you use letters to represent unknown numbers. So you could write the number sentences above as: 2 + x = 8 and a + b = 10. Number sentences like these are called equations. You can solve an equation by finding the values that make the equation true. When you worked with area of rectangles and triangles in the past, you used algebra to make a general rule, or formula, for working out the area, A: Area of a rectangle = length × breadth, so A = lb Area of a triangle = 1 2 base × height, so A = 1 2 bh or A = bh 2 Notice that when two letters are multiplied together, we write them next to each other e.g. lb, rather than l × b. To use a formula you have to replace some or all of the letters with numbers. This is called substitution. Writing algebraic expressions An algebraic expression is a group of letter and numbers linked by operation signs. Each part of the expression is called a term. Suppose the average height (in centimetres) of students in your class is an unknown number, h. A student who is 10cm taller than the average would have a height of h + 10. A student who is 3cm shorter than the average would have a height of h − 3. h + 10 and h − 3 are algebraic expressions. Because the unknown value is represented by h, we say these are expressions in terms of h. In algebra the letters can represent many different values so they are called variables. If a problem introduces algebra, you must not change the ‘case’ of the letters used. For example, ‘n’ and ‘N‘ can represent different numbers in the same formula! RECAP You should already be familiar with the following algebra work: Basic conventions in algebra We use letters in place of unknown values in algebra. An expression can contain numbers, variables and operation symbols, including brackets. Expressions don’t have equals signs. These are all algebraic expressions: x + 4 3(x + y) 3m n (4 + a)(2 – a) Substitution of values for letters If you are given the value of the letters, you can substitute these and work out the value of the expression. Given that x = 2 and y = 5: x + y becomes 2 + 5 x y becomes 2 ÷ 5 xy becomes 2 × 5 4x becomes 4 × 2 and 3y becomes 3 × 5 Index notation and the laws of indices for multiplication and division 2 × 2 × 2 × 2 = 24 2 is the base and 4 is the index. a × a × a = a3 a is the base and 3 is the index. Algebraappearsacross allsciencesubjects,in particular.Mostsituations inphysicsrequiremotionor otherphysicalchangesto bedescribedasanalgebraic formula.AnexampleisF=ma, whichdescribestheconnection betweentheforce,massand accelerationofanobject. LINK e s s - R e v i e w C o p y - C a m b r i d g e U n i v e r s i t y P r e s s - R e v i e w C o p y R e v i e w C o p y - C a m b r i d g e U n i v e r s i t y P r e s s - R e v i e w C o p y R e v i e w C o p y - C a m b r i d g e U n i v e r s i t y P r e s s - R e v i e w C o p y R e v i e w C o p y - C a m b r i d g e U n i v e r s i t y Copyright Material - Review Only - Not for Redistribution
- 35. Unit 1: Algebra 25 2 Making sense of algebra Worked example 1 Use algebra to write an expression in terms of h for: a a height 12cm shorter than average b a height 2x taller than average c a height twice the average height d a height half the average height. a h − 12 Shorter than means less than, so you subtract. b h + 2x Taller than means more than, so you add. 2x is unknown, but it can still be used in the expression. c 2 × h Twice means two times, so you multiply by two. d h ÷ 2 Half means divided by two. Applying the rules Algebraic expressions should be written in the shortest, simplest possible way. • 2 × h is written as 2h and x × y is written as xy • h means 1 × h, but you do not write the 1 • h ÷ 2 is written as h 2 and x ÷ y is written as x y • when you have the product of a number and a variable, the number is written first, so 2h and not h2. Also, variables are normally written in alphabetical order, so xy and 2ab rather than yx and 2ba • h × h is written as h2 (h squared) and h × h × h is written as h3 (h cubed). The 2 and the 3 are examples of a power or index. • The power only applies to the number or variable directly before it, so 5a2 means 5 × a × a • When a power is outside a bracket, it applies to everything inside the bracket. So, (xy)3 means xy × xy × xy Worked example 2 Write expressions in terms of x to represent: a a number times four b the sum of the number and five c six times the number minus two d half the number. a x times 4 = 4 × x = 4x Let x represent ‘the number’. Replace ‘four times’ with 4 ×. Leave out the × sign, write the number before the variable. b Sum of x and five = x + 5 Let x represent ‘the number’. Sum of means +, replace five with 5. c Six times x minus two = 6 × x − 2 = 6x − 2 Let x represent the number. Times means × and minus means − , insert numerals. Leave out the × sign. d Half x = x ÷ 2 = x 2 Let x represent ‘the number’. Half means × 1 2 or ÷ 2. Write the division as a fraction. Mathematicians write the product of a number and a variable with the number first to avoid confusion with powers. For example, x × 5 is written as 5x rather than x5, which may be confused with x5 . e s s - R e v i e w C o p y - C a m b r i d g e U n i v e r s i t y P r e s s - R e v i e w C o p y R e v i e w C o p y - C a m b r i d g e U n i v e r s i t y P r e s s - R e v i e w C o p y R e v i e w C o p y - C a m b r i d g e U n i v e r s i t y P r e s s - R e v i e w C o p y R e v i e w C o p y - C a m b r i d g e U n i v e r s i t y Copyright Material - Review Only - Not for Redistribution
- 36. Unit 1: Algebra Cambridge IGCSE Mathematics 26 Exercise 2.1 1 Rewrite each expression in its simplest form. a 6 × x × y b 7 × a × b c x × y × z d 2 × y × y e a × 4 × b f x × y × 12 g 5 × b × a h y × z × z i 6 ÷ x j 4x ÷ 2y k (x + 3) ÷ 4 l m × m × m ÷ m × m m 4 × x + 5 × y n a × 7 − 2 × b o 2 × x × (x − 4) p 3 × (x + 1) ÷ 2 × x q 2 × (x + 4) ÷ 3 r (4 × x) ÷ (2 × x + 4 × x) 2 Let the unknown number be m. Write expressions for: a the sum of the unknown number and 13 b a number that will exceed the unknown number by five c the difference between 25 and the unknown number d the unknown number cubed e a third of the unknown number plus three f four times the unknown number less twice the number. 3 Let the unknown number be x. Write expressions for: a three more than x b six less than x c ten times x d the sum of −8 and x e the sum of the unknown number and its square f a number which is twice x more than x g the fraction obtained when double the unknown number is divided by the sum of the unknown number and four. 4 A CD and a DVD cost x dollars. a If the CD costs $10 what does the DVD cost? b If the DVD costs three times the CD, what does the CD cost? c If the CD costs $(x − 15), what does the DVD cost? 5 A woman is m years old. a How old will she be in ten years’ time? b How old was she ten years ago? c Her son is half her age. How old is the son? 6 Three people win a prize of $p. a If they share the prize equally, how much will each receive? b If one of the people wins three times as much money as the other two, how much will each receive? 2.2 Substitution Expressions have different values depending on what numbers you substitute for the variables. For example, let’s say casual waiters get paid $5 per hour. You can write an expression to represent everyone’s wages like this: 5h, where h is the number of hours worked. If you work 1 hour, then you get paid 5 × 1 = $5. So the expression 5h has a value of $5 in this case. If you work 6 hours, you get paid 5 × 6 = $30. The expression 5h has a value of $30 in this case. Remember BODMAS in Chapter 1. Work out the bit in brackets first. REWIND Remember from Chapter 1 that a ‘sum’ is the result of an addition. Also remember that the ‘difference’ between two numbers is the result of a subtraction. The order of the subtraction matters. REWIND Algebra allows you to translate information given in words to a clear and short mathematical form. This is a useful strategy for solving many types of problems. When you substitute values you need to write in the operation signs. 5h means 5 × h, so if h = 1, or h = 6, you cannot write this in numbers as 51 or 56. e s s - R e v i e w C o p y - C a m b r i d g e U n i v e r s i t y P r e s s - R e v i e w C o p y R e v i e w C o p y - C a m b r i d g e U n i v e r s i t y P r e s s - R e v i e w C o p y R e v i e w C o p y - C a m b r i d g e U n i v e r s i t y P r e s s - R e v i e w C o p y R e v i e w C o p y - C a m b r i d g e U n i v e r s i t y Copyright Material - Review Only - Not for Redistribution
- 37. Unit 1: Algebra 27 2 Making sense of algebra Worked example 3 Given that a = 2 and b = 8, evaluate: a ab b 3b − 2a c 2a3 d 2a(a + b) a ab a b = × a b = × a b = × = 2 8 = × 2 8 = × 16 Put back the multiplication sign. Substitute the values for a and b. Calculate the answer. b 3 2 3 2 3 8 2 2 24 4 20 b a 3 2 b a 3 2 b a 3 2 b a 3 2 − = b a − = 3 2 b a − = 3 2 b a 3 2 × − 3 2 3 2 b a 3 2 × − 3 2 b a b a b a = × 3 8 = × 3 8 − × 2 2 − × 2 2 = − 24 = − = Put back the multiplication signs. Substitute the values for a and b. Use the order of operations rules (× before −). Calculate the answer. c 2 2 2 2 2 8 16 3 3 2 2 3 3 2 2 3 a a 2 2 a a 2 2 3 3 a a 3 3 2 2 3 3 2 2 a a 3 3 3 3 = × 3 3 2 2 3 3 = × 3 3 a a = × a a 2 2 a a = × 2 2 a a 3 3 a a = × 3 3 a a 2 2 3 3 a a 3 3 = × 3 3 2 2 a a 3 3 = × 2 2 = × 2 2 = × 2 8 = × 2 8 = Put back the multiplication signs. Substitute the value for a. Work out 23 first (grouping symbols first). Calculate the answer. d 2 2 2 2 4 10 40 a a 2 2 a a 2 2 b a 2 2 b a a b ( ) 2 2 ( ) 2 2 a a ( ) a a 2 2 a a 2 2 ( ) 2 2 a a b a ( ) b a 2 2 b a 2 2 ( ) 2 2 b a b a ( ) b a 2 2 b a 2 2 ( ) 2 2 b a ( ) a b ( ) ( ) 2 8 ( ) 2 2 b a + = 2 2 b a 2 2 ( ) + = 2 2 ( ) 2 2 b a 2 2 ( ) 2 2 b a + = b a 2 2 ( ) b a × × b a × × b a a b ( ) a b ( ) = × 2 2 = × 2 2 × + ( ) × + 2 8 ( ) × + 2 8 ( ) = × 4 1 = × 4 1 = Put back the multiplication signs. Substitute the values for a and b. In this case you can carry out two steps at the same time: multiplication outside the bracket, and the addition inside. Calculate the answer. You will need to keep reminding yourself about the order (BODMAS) of operations from chapter 1. REWIND ‘Evaluate’ means to find the value of. Worked example 4 For each of the shapes in the diagram below: i Write an expression for the perimeter of each shape. ii Find the perimeter in cm if x = 4. a b c x x x x 3x x2 + 1 x + 3 2x x + 4 a i x + x + x + x = 4x Add the four lengths together. Substitute 4 into the expression. ii 4 4 4 16 4 4 × = 4 4 × = 4 4 4 4 4 4 × = 4 4 × = cm You probably don’t think about algebra when you watch animated cartoons, insert emojis in messages or play games on your phone or computer but animators use complex algebra to programme all these items and to make objects move on screen. LINK e s s - R e v i e w C o p y - C a m b r i d g e U n i v e r s i t y P r e s s - R e v i e w C o p y R e v i e w C o p y - C a m b r i d g e U n i v e r s i t y P r e s s - R e v i e w C o p y R e v i e w C o p y - C a m b r i d g e U n i v e r s i t y P r e s s - R e v i e w C o p y R e v i e w C o p y - C a m b r i d g e U n i v e r s i t y Copyright Material - Review Only - Not for Redistribution
- 38. Unit 1: Algebra Cambridge IGCSE Mathematics 28 Worked example 5 Complete this table of values for the formula b = 3a − 3 Substitute in the values of a to work out b. a 0 2 4 6 3 × 0 − 3 = 0 − 3 = −3 3 × 2 −3 = 6 − 3 = 3 3 × 4 − 3 = 12 − 3 = 9 3 × 6 − 3 = 18 −3 = 15 b a 0 2 4 6 b −3 3 9 15 Exercise 2.2 1 Evaluate the following expressions for x = 3. a 3x b 10x c 4x − 2 d x3 e 2x2 f 10 − x g x2 + 7 h x3 + x2 i 2(x − 1) j 4 2 x k 6 3 x l 90 x m 10 6 x n ( ) ( ) 4 2 ( ) 7 ( ) ( ) ( ) 4 2 ( ) 4 2 ( ) 4 2 ( ) 4 2 2 What is the value of each expression when a = 3 and b = 5 and c = 2? a abc b a2 b c 4a + 2c d 3b − 2(a + c) e a2 + c2 f 4b − 2a + c g ab + bc + ac h 2(ab)2 i 3(a + b) j (b − c) + (a + c) k (a + b)(b − c) l 3bc ac m 4b a c + n 4 2 b bc o 2 2 ( ) a b ( ) a b ( ) c ( ) a b ( ) a b You will learn more about algebraic fractions in chapter 14. FAST FORWARD Always show your substitution clearly. Write the formula or expression in its algebraic form but with the letters replaced by the appropriate numbers. This makes it clear to your teacher, or an examiner, that you have put the correct numbers in the right places. b i 3x + (x2 + 1) + 3x + (x2 + 1) = 2(3x) + 2(x2 + 1) Add the four lengths together and write in its simplest form. Substitute 4 into the expression. ii 2 3 2 1 2 3 4 2 2 12 2 24 2 17 24 2 2 2 3 2 2 4 2 2 2 2 3 × × 2 3 + × 2 1 + × 2 1 + = 2 2 + = 2 3 × × 2 3 2 3 2 2 × × 2 3 2 2 + × 4 2 + × 4 2 2 2 + × 2 2 4 2 2 2 + × 4 2 2 2 = × 2 1 = × 2 1 + × 2 2 + × 2 2 = + 24 = + 2 1 2 1 = ( ) 2 3 ( ) 2 3 × × ( ) 2 3 × × ( ) 2 3 × × ( ) 2 1 ( ) 2 1 2 2 ( ) 2 2 2 1 2 2 2 1 ( ) 2 2 + = ( ) + = 2 1 + = 2 1 ( ) + = 2 2 + = ( ) 2 2 + = 2 1 2 2 + = 2 1 2 2 ( ) 2 2 2 1 + = 2 2 ( ) 2 3 ( ) 2 3 4 2 ( ) 4 2 2 2 ( ) 2 2 2 3 2 2 ( ) 2 3 2 2 4 2 2 2 ( ) 4 2 2 2 × × ( ) 2 3 × × ( ) 2 3 × × 2 2 × × 2 2 ( ) × × 2 3 2 2 × × 2 2 ( ) 2 3 2 2 2 3 × × 2 2 ( ) 4 1 ( ) 2 2 ( ) 2 2 4 1 2 2 4 1 ( ) 2 2 4 1 4 1 ( ) ( ) 16 ( ) 1 ( ) + ( ) x x 2 1 x x + × x x 2 1 + × 2 1 x x + × ( ) x x ( ) 2 1 ( ) 2 1 x x 2 1 ( ) + + = 34 58cm c i x + 3 + x + 4 + 2x Add the three lengths together. Substitute 4 into the expression. ii x x x + + x x + + x x + + × = x × = + + + × = + + + + = 3 4 x x 3 4 x x + + 3 4 + + x x + + x x 3 4 x x + + + + 3 4 + + 2 4 3 + 4 3 4 4 2 + + + 4 4 2 + + + 4 4 3 4 = + 4 3 4 = + + + + 4 3 4 + + + 4 8 + + + 4 8 + + + 23cm e s s - R e v i e w C o p y - C a m b r i d g e U n i v e r s i t y P r e s s - R e v i e w C o p y R e v i e w C o p y - C a m b r i d g e U n i v e r s i t y P r e s s - R e v i e w C o p y R e v i e w C o p y - C a m b r i d g e U n i v e r s i t y P r e s s - R e v i e w C o p y R e v i e w C o p y - C a m b r i d g e U n i v e r s i t y Copyright Material - Review Only - Not for Redistribution
- 39. Unit 1: Algebra 29 2 Making sense of algebra p 3 10 abc a q 6 2 2 b ( ) a c ( ) ( ) ( ) a c ( ) a c ( ) r ( ) ( ) 1 ( ) ( ) 2 ( ) ( )2 ab ( ) ab ( ) ( ) ( ) s 8 3 a a b a b a b t 6 2 2 ab a bc − 3 Work out the value of y in each formula when: i x = 0 i x = 3 iii x = 4 iv x = 10 v x = 50 a y = 4x b y = 3x + 1 c y = 100 − x d y x = 2 e y = x2 f y x = 100 g y = 2(x + 2) h y = 2(x + 2) − 10 i y = 3x3 4 A sandwich costs $3 and a drink costs $2. a Write an expression to show the total cost of buying x sandwiches and y drinks. b Find the total cost of: i four sandwiches and three drinks ii 20 sandwiches and 20 drinks iii 100 sandwiches and 25 drinks. 5 The formula for finding the perimeter of a rectangle is P = 2(l + b), where l represents the length and b represents the breadth of the rectangle. Find the perimeter of a rectangle if: a the length is 12cm and the breadth is 9cm b the length is 2.5m and the breadth is 1.5m c the length is 20cm and the breadth is half as long d the breadth is 2cm and the length is the cube of the breadth. 6 a Find the value of the expression n n 2 41 + + n + + when: i n = 1 ii n = 3 iii n = 5 iv n = 10 b What do you notice about all of your answers? c Why is this different when n = 41 ? 2.3 Simplifying expressions The parts of an algebraic expression are called terms. Terms are separated from each other by + or − signs. So a + b is an expression with two terms, but ab is an expression with only one term and 2 3 + − + − a b ab c is an expression with three terms. Adding and subtracting like terms Terms with exactly the same variables are called like terms. 2a and 4a are like terms; 3xy2 and − xy2 are like terms. The variables and any indices attached to them have to be identical for terms to be like terms. Don’t forget that variables in a different order mean the same thing, so xy and yx are like terms (x × y = y × x). Like terms can be added or subtracted to simplify algebraic expressions. You may need to discuss part (f)(i) with your teacher. Think back to chapter 1 and the different types of number that you have already studied REWIND In fact the outcome is the same for n = 1 to 39, but then breaks down for the first time at n = 40 Remember, terms are not separated by × or ÷ signs. A fraction line means divide, so the parts of a fraction are all counted as one term, even if there is a + or – sign in the numerator or denominator. So, a b c a b a b is one term. Remember, the number in a term is called a coefficient. In the term 2a, the coefficient is 2; in the term −3ab, the coefficient is −3. A term with only numbers is called a constant. So in 2a + 4, the constant is 4. E e s s - R e v i e w C o p y - C a m b r i d g e U n i v e r s i t y P r e s s - R e v i e w C o p y R e v i e w C o p y - C a m b r i d g e U n i v e r s i t y P r e s s - R e v i e w C o p y R e v i e w C o p y - C a m b r i d g e U n i v e r s i t y P r e s s - R e v i e w C o p y R e v i e w C o p y - C a m b r i d g e U n i v e r s i t y Copyright Material - Review Only - Not for Redistribution
- 40. Unit 1: Algebra Cambridge IGCSE Mathematics 30 Exercise 2.3 1 Identify the like terms in each set. a 6x, −2y, 4x, x b x, −3y, 3 4 y y, −5y c ab, 4b, −4ba, 6a d 2, −2x, 3xy, 3x, −2y e 5a, 5ab, ab, 6a, 5 f −1xy, −yx, −2y, 3, 3x 2 Simplify by adding or subtracting like terms. a 2y + 6y b 9x − 2x c 10x + 3x d 21x + x e 7x − 2x f 4y − 4y g 9x − 10x h y − 4y i 5x − x j 9xy − 2xy k 6pq − 2qp l 14xyz − xyz m 4x2 − 2x2 n 9y2 − 4y2 o y2 − 2y2 p 14ab2 − 2ab2 q 9x2 y − 4x2 y r 10xy2 − 8xy2 3 Simplify: a 2x + y + 3x b 4y − 2y + 4x c 6x − 4x + 5x d 10 + 4x − 6 e 4xy − 2y + 2xy f 5x2 − 6x2 + 2x g 5x + 4y − 6x h 3y + 4x − x i 4x + 6y + 4x j 9x − 2y − x k 12x2 − 4x + 2x2 l 12x2 − 4x2 + 2x2 m 5xy − 2x + 7xy n xy − 2xz + 7xy o 3x2 − 2y2 − 4x2 p 5x2 y + 3x2 y − 2xy q 4xy − x + 2yx r 5xy − 2 + xy 4 Simplify as far as possible: a 8y − 4 − 6y − 4 b x2 − 4x + 3x2 − x c 5x + y + 2x + 3y d y2 + 2y + 3y − 7 e x2 − 4x − x + 3 f x2 + 3x − 7 + 2x g 4xyz − 3xy + 2xz − xyz h 5xy − 4 + 3yx − 6 i 8x − 4 − 2x − 3x2 You will need to be very comfortable with the simplification of algebraic expressions when solving equations, inequalities and simplifying expansions throughout the course. FAST FORWARD Note that a ‘+’ or a ‘−’ that appears within an algebraic expression, is attached to the term that sits to its right. For example: 3x − 4y contains two terms, 3x and −4y. If a term has no symbol written before it then it is taken to mean that it is ‘+’. Notice that you can rearrange the terms provided that you remember to take the ‘−’ and ‘+’ signs with the terms to their right. For example: 3 2 5 3 5 2 5 3 2 2 3 5 x y 3 2 x y 3 2 z x z 3 5 x z y z x 5 3 z x 5 3 y y x 2 3 y x 2 3 z − + 3 2 − + x y − + 3 2 x y − + 3 2 x y = + 3 5 = + 3 5 3 5 x z 3 5 = + 3 5 x z − = + 5 3 = + 5 3 5 3 z x 5 3 = + 5 3 z x − = − + + 2 3 + + 2 3 y x + + 2 3 y x + + 2 3 y x Worked example 6 Simplify: a 4a + 2a + 3a b 4a + 6b + 3a c 5x + 2y − 7x d 2p + 5q + 3q − 7p e 2ab + 3a2 b − ab + 3ab2 a 4 2 3 9 a a 4 2 a a 4 2 a a + + 4 2 + + 4 2 a a + + 4 2 a a + + 4 2 a a = Terms are all like. Add the coefficients, write the term. b 4 6 3 7 6 a b 4 6 a b 4 6 a a b 7 6 a b 7 6 + + a b + + 4 6 a b + + 4 6 a b = + 7 6 = + 7 6 a b 7 6 = + 7 6 a b Identify the like terms (4a and 3a). Add the coefficients of like terms. Write terms in alphabetical order. c 5 2 7 2 2 x y 5 2 x y 5 2 x x y 2 2 x y 2 2 + − 5 2 + − 5 2 x y + − 5 2 x y + − 5 2 x y = −2 2 2 2 2 2 x y 2 2 x y Identify the like terms (5x and −7x). Subtract the coefficients, remember the rules. Write the terms. (This could also be written as 2y − 2x.) d 2 5 3 7 5 8 p q 2 5 p q 2 5 q p 3 7 q p 3 7 p q 5 8 p q 5 8 + + 2 5 + + 2 5 p q + + 2 5 p q + + 2 5 p q 3 7 q p 3 7 q p = + 5 8 = + 5 8 5 8 p q 5 8 = + 5 8 p q = + = + Identify the like terms (2p and −7p; 5q and 3q). Add and subtract the coefficients. Write the terms. e 2 3 3 3 3 2 2 3 2 2 2 2 3 3 2 2 ab 2 3 ab 2 3a b 2 2 a b 2 2 ab 2 2 ab 2 2 ab 2 2 ab 2 2 ab a b 3 3 a b 3 3 2 2 a b 2 2 3 3 2 2 3 3 a b 3 3 2 2 ab 2 2 ab 2 2 + − 2 3 + − 2 3 2 2 + − a b + − 2 2 a b 2 2 + − a b + 2 2 2 2 = + ab = + 3 3 3 3 3 3 2 2 3 3 2 2 Identify like terms; pay attention to terms that are squared because a and a2 are not like terms. Remember that ab means 1ab. e s s - R e v i e w C o p y - C a m b r i d g e U n i v e r s i t y P r e s s - R e v i e w C o p y R e v i e w C o p y - C a m b r i d g e U n i v e r s i t y P r e s s - R e v i e w C o p y R e v i e w C o p y - C a m b r i d g e U n i v e r s i t y P r e s s - R e v i e w C o p y R e v i e w C o p y - C a m b r i d g e U n i v e r s i t y Copyright Material - Review Only - Not for Redistribution
- 41. Unit 1: Algebra 31 2 Making sense of algebra Worked example 7 Simplify: a 4 × 3x b 4x × 3y c 4ab × 2bc d 7x × 4yz × 3 a 4 3 4 3 12 12 × = 4 3 × = 4 3 × × 4 3 × × = × 12 = × = x x 4 3 x x × = x x × = × × x x 4 3 × × 4 3 x x × × x x Insert the missing × signs. Multiply the numbers first. Write in simplest form. b 4 3 4 3 12 12 x y 4 3 x y 4 3 x y 4 3 x y 4 3 x y xy × = x y × = 4 3 x y × = 4 3 x y 4 3 × × 4 3 4 3 x y 4 3 × × 4 3 x y x y x y = × 12 = × x y x y = Insert the missing × signs. Multiply the numbers. Write in simplest form. c 4 2 4 2 8 8 2 ab 4 2 ab 4 2bc a b 4 2 a b 4 2 b c a b b c ab c × = 4 2 × = 4 2bc × = 4 2 × × 4 2 4 2 a b 4 2 × × 4 2 a b × × 4 2 × × 4 2 b c b c = × 8 = × × × × a b × × × a b b c × × × b c = Insert the missing × signs. Multiply the numbers, then the variables. Write in simplest form. d 7 4 3 7 4 3 84 84 x y 7 4 x y 7 4 z x 3 7 z x x yz x x y y z 4 3 y z 4 3 x y z xyz xy xy × × x y × × 7 4 x y × × 7 4 x yz x × × z x x yz x x y × × z x = × 3 7 = × z x = × z x 3 7 z x = × 3 7 z x × × 4 3 × × 4 3 4 3 × × 4 3 4 3 y z 4 3 × × 4 3 y z = × × × x y × × × x y = Insert the missing × signs. Multiply the numbers. Write in simplest form. Multiplying and dividing in expressions Although terms are not separated by × or ÷ they still need to be written in the simplest possible way to make them easier to work with. In section 2.1 you learned how to write expressions in simpler terms when multiplying and dividing them. Make sure you understand and remember these important rules: • 3x means 3 × x and 3xy means 3 × x × y • xy means x × y • x2 means x × x and x2 y means x × x × y (only the x is squared) • 2 4 a means 2a ÷ 4 5 Write an expression for the perimeter (P) of each of the following shapes and then simplify it to give P in the simplest possible terms. 2x a x x + 7 b 2x + 1 c x 2x + 4 2x d 2y – 1 e 4 2 y y + 7 f 4y – 2 2y g 3x – 2 2x + 1 9x 4x h You can multiply numbers first and variables second because the order of any multiplication can be reversed without changing the answer. e s s - R e v i e w C o p y - C a m b r i d g e U n i v e r s i t y P r e s s - R e v i e w C o p y R e v i e w C o p y - C a m b r i d g e U n i v e r s i t y P r e s s - R e v i e w C o p y R e v i e w C o p y - C a m b r i d g e U n i v e r s i t y P r e s s - R e v i e w C o p y R e v i e w C o p y - C a m b r i d g e U n i v e r s i t y Copyright Material - Review Only - Not for Redistribution
- 42. Unit 1: Algebra Cambridge IGCSE Mathematics 32 Exercise 2.4 1 Multiply: a 2 × 6x b 4y × 2 c 3m × 4 d 2x × 3y e 4x × 2y f 9x × 3y g 8y × 3z h 2x × 3y × 2 i 4xy × 2xy j 4xy × 2x k 9y × 3xy l 4y × 2x × 3y m 2a × 4ab n 3ab × 4bc o 6abc × 2a p 8abc × 2ab q 4 × 2ab × 3c r 12x2 × 2 × 3y2 2 Simplify: a 3 × 2x × 4 b 5x × 2x × 3y c 2x × 3y × 2xy d xy × xz × x e 2 × 2 × 3x × 4 f 4 × 2x × 3x2 y g x × y2 × 4x h 2a × 3ab × 2c i 10x × 2y × 3 j 4 × x × 2 × y k 9 × x2 × xy l 4xy2 × 2x2 y m 7xy × 2xz × 3yz n 4xy × 2x2 y × 7 o 9 × xyz × 4xy p 3x2 y × 2xy2 × 3xy q 9x × 2xy × 3x2 r 2x × xy2 × 3xy 3 Simplify: a 15 3 x b 40 10 x c 21 7 x d 12 2 xy x e 14 2 xy y f 18 9 2 2 x y x g 10 40 xy x h 15 60 x xy i 7 14 xyz xy j 6xy x k x x 4 l x x 9 Worked example 8 Simplify: a 12 3 x b 12 3 xy x c 7 70 xy y d 2 3 4 2 x x 4 x x × a 12 3 12 3 4 1 4 x x x x = = = 4 1 Divide both top and bottom by 3 (making the numerator and denominator smaller so that the fraction is in its simplest form is called cancelling). b 12 3 12 3 4 1 4 xy x xy x y y = = × = 4 1 Cancel and then multiply. c 1 7 70 7 70 10 10 xy y xy y x = = Cancel. d 2 3 4 2 2 3 2 8 6 4 3 2 2 x x x x × = × × × × = = 4 3 x x 4 or 1 1 2 3 4 2 1 3 4 1 4 3 2 x x x x x × = × = Insert signs and multiply. Cancel. Cancel first, then multiply. You will learn more about cancelling and equivalent fractions in chapter 5. FAST FORWARD e s s - R e v i e w C o p y - C a m b r i d g e U n i v e r s i t y P r e s s - R e v i e w C o p y R e v i e w C o p y - C a m b r i d g e U n i v e r s i t y P r e s s - R e v i e w C o p y R e v i e w C o p y - C a m b r i d g e U n i v e r s i t y P r e s s - R e v i e w C o p y R e v i e w C o p y - C a m b r i d g e U n i v e r s i t y Copyright Material - Review Only - Not for Redistribution
- 43. Unit 1: Algebra 33 2 Making sense of algebra 4 Simplify: a 8x ÷ 2 b 12xy ÷ 2x c 16x2 ÷ 4xy d 24xy ÷ 3xy e 14x2 ÷ 2y2 f 24xy ÷ 8y g 8xy ÷ 24y h 9x ÷ 36xy i 77 11 xyz xz j 45 20 xy x k 60 15 2 2 x y xy l 100 25 2 xy x 5 Simplify these as far as possible. a x y 2 3 × b x x 3 4 × c xy x 2 5 3 × d 2 3 5 x y × e 2 4 3 4 x y × f 5 2 5 2 x x 5 x x × g x y y x × 2 h xy x y 3 × i 5 2 5 y x × j 4 2 3 × x k x x 6 3 2 × l 5 2 4 10 x x 4 x x × 2.4 Working with brackets When an expression has brackets, you normally have to remove the brackets before you can simplify the expression. Removing the brackets is called expanding the expression. To remove brackets you multiply each term inside the bracket by the number (and/or variables) outside the bracket. When you do this you need to pay attention to the positive and negative signs in front of the terms: x (y + z) = xy + xz x (y − z) = xy − xz Worked example 9 Remove the brackets to simplify the following expressions. a 2(2x + 6) b 4(7 − 2x) c 2x(x + 3y) d xy(2 − 3x) a 2 2 6 2 6 4 12 x + ( )= × + × = + x x i i ii ii 2 2 For parts (a) to (d) write the expression out, or do the multiplication mentally. Follow these steps when multiplying by a term outside a bracket: • Multiply the term on the left-hand inside of the bracket first - shown by the red arrow labelled i. • Then multiply the term on the right- hand side – shown by the blue arrow labelled ii. • Then add the answers together. b i i x 4 7 2 2 28 8 − ( )= × − × x = − x ii ii 4 7 4 c 2 3 3 2 6 2 x x x y x x y x xy + ( )= × + × = + 2 2 i i ii ii d xy x xy x xy x y 2 3 2 3 2 − ( ) = × − × = − 2 3 y x i i ii ii Removing brackets is really just multiplying, so the same rules you used for multiplication apply in these examples. In this section you will focus on simple examples. You will learn more about removing brackets and working with negative terms in chapters 6 and 10. You will also learn a little more about why this method works. FAST FORWARD e s s - R e v i e w C o p y - C a m b r i d g e U n i v e r s i t y P r e s s - R e v i e w C o p y R e v i e w C o p y - C a m b r i d g e U n i v e r s i t y P r e s s - R e v i e w C o p y R e v i e w C o p y - C a m b r i d g e U n i v e r s i t y P r e s s - R e v i e w C o p y R e v i e w C o p y - C a m b r i d g e U n i v e r s i t y Copyright Material - Review Only - Not for Redistribution
- 44. Unit 1: Algebra Cambridge IGCSE Mathematics 34 Exercise 2.6 1 Expand and simplify: a 2 5 3 ( ) 2 5 ( ) 2 5 + + ( ) + + ( ) x x 3 x x ( ) x x ( ) + + x x ( ) + + x x ( ) + + b 3 2 4 ( ) 3 2 ( ) 3 2 y y 4 y y ( ) y y ( ) 3 2 ( ) y y 3 2 ( ) − + ( ) − + 3 2 ( ) − + ( ) y y − + y y ( ) y y − + y y 3 2 ( ) y y ( ) − + 3 2 ( ) 3 2 y y ( ) c 2 2 x x 2 2 x x 2 2 + − 2 2 + − 2 2 x x + − 2 2 x x + − 2 2 x x ( ) 4 ( ) x x ( ) x x + − ( ) + − x x + − ( ) x x + − d 4 2 x x 4 2 x x 4 2 + − 4 2 + − 4 2 x x + − 4 2 x x + − 4 2 x x ( ) 3 ( ) x x ( ) x x + − ( ) + − x x + − ( ) x x + − e 2 4 5 x x 2 4 x x 2 4 ( ) 2 4 ( ) 2 4 x x ( ) x x 2 4 x x ( ) 2 4 x x + − ( ) + − ( ) x x ( ) + − x x ( ) f 4 2 7 ( ) 4 2 ( ) 4 2 ( ) ( ) 4 2 ( ) 4 2 ( ) + − ( ) + − 4 2 ( ) + − 4 2 ( ) Exercise 2.5 1 Expand: a 2(x + 6) b 3(x + 2) c 4(2x + 3) d 10(x − 6) e 4(x − 2) f 3(2x − 3) g 5(y + 4) h 6(4 + y) i 9(y + 2) j 7(2x − 2y) k 2(3x − 2y) l 4(x + 4y) m 5(2x − 2y) n 6(3x − 2y) o 3(4y − 2x) p 4(y − 4x2 ) q 9(x2 − y) r 7(4x + x2 ) 2 Remove the brackets to expand these expressions. a 2x(x + y) b 3y(x − y) c 2x(x + 2y) d 4x(3x − 2y) e xy(x − y) f 3y(4x + 2) g 2xy(9 − 4y) h 2x2 (3 − 2y) i 3x2 (4 − 4x) j 4x(9 − 2y) k 5y(2 − x) l 3x(4 − y) m 2x2 y(y − 2x) n 4xy2 (3 − 2x) o 3xy2 (x + y) p x2 y(2x + y) q 9x2 (9 − 2x) r 4xy2 (3 − x) 3 Given the formula for area, A = length × breadth, write an expression for A in terms of x for each of the following rectangles. Expand the expression to give A in simplest terms. Worked example 10 Expand and simplify where possible. a 6(x + 3) + 4 b 2(6x + 1) − 2x + 4 c 2x(x + 3) + x(x − 4) a 6 3 4 6 18 4 6 22 ( ) 6 3 ( ) 6 3 x x 4 6 x x ( ) x x 6 3 ( ) x x 6 3 ( ) 6 2 + + ( ) + + 6 3 ( ) + + 6 3 ( ) x x + + x x ( ) x x + + x x 6 3 ( ) x x ( ) + + 6 3 ( ) 6 3 x x ( ) = + 4 6 = + x x = + 4 6 x x = + 4 6 x x + = + 6 2 = + 6 2 6 2 6 2 = + Remove the brackets. Add like terms. b 2 6 1 2 4 12 2 2 4 10 6 ( ) 2 6 ( ) 2 6 1 2 ( ) 1 2 x x 1 2 x x ( ) x x ( ) 1 2 ( ) 1 2 x x ( ) x x 2 2 x x 2 2 2 4 x x 2 4 x 1 2 + − ( ) + − ( ) 1 2 ( ) 1 2 + − ( ) 1 2 x x + − 1 2 x x ( ) x x + − ( ) x x 1 2 ( ) 1 2 x x ( ) + − ( ) 1 2 x x ( ) + = 4 1 + = 4 1 + − 2 2 + − 2 2 x x + − x x 2 2 x x + − 2 2 x x 2 4 2 4 = + 10 = + x = + Remove the brackets. Add or subtract like terms. c 2 3 4 2 6 4 3 2 2 2 6 4 2 2 6 4 2 3 2 3 2 2 3 x x 2 3 x x x x 6 4 x x 6 4 2 2 x x x x 6 4 x x 6 4 6 4 2 2 6 4 x x 6 4 2 2 x x 3 2 x x ( ) 2 3 ( ) 2 3 2 3 x x 2 3 ( ) 2 3 x x ( ) 4 2 ( ) 4 2 x x ( ) x x + + ( ) + + 2 3 ( ) + + 2 3 ( ) 4 2 − = 4 2 ( ) − = ( ) 4 2 ( ) 4 2 − = ( ) 6 4 + + 6 4 2 2 + + 2 2 6 4 2 2 + + 6 4 2 2 x x + + x x 6 4 x x 6 4 + + x x 2 2 x x + + 2 2 x x 6 4 2 2 x x 6 4 2 2 + + 2 2 6 4 x x 2 2 6 4 x x 6 4 x x = + 3 2 = + 3 2 3 2 3 2 = + 3 2 x x 3 2 = + 3 2 x x 3 2 3 2 x x = + 3 2 x x Remove the brackets. Add or subtract like terms. a b c x x + 7 2x x2 1 − x – 1 4x Expanding and collecting like terms When you remove brackets and expand an expression you may end up with some like terms. When this happens, you collect the like terms together and add or subtract them to write the expression in its simplest terms. e s s - R e v i e w C o p y - C a m b r i d g e U n i v e r s i t y P r e s s - R e v i e w C o p y R e v i e w C o p y - C a m b r i d g e U n i v e r s i t y P r e s s - R e v i e w C o p y R e v i e w C o p y - C a m b r i d g e U n i v e r s i t y P r e s s - R e v i e w C o p y R e v i e w C o p y - C a m b r i d g e U n i v e r s i t y Copyright Material - Review Only - Not for Redistribution
- 45. Unit 1: Algebra 35 2 Making sense of algebra g 6 3 + − 6 3 + − 6 3( ) 2 ( ) + − ( ) + − ( ) ( ) + − ( ) + − ( ) h 4 2 x x 4 2 x x 4 2 + + 4 2 + + 4 2 x x + + 4 2 x x + + 4 2 x x ( ) 2 3 ( ) x x ( ) x x 2 3 x x 2 3 ( ) x x + + ( ) + + 2 3 + + 2 3 ( ) + + x x + + ( ) x x + + 2 3 x x 2 3 + + x x ( ) x x 2 3 + + x x i 2 3 2 2 x x 2 3 x x 2 3 2 2 x x + + 2 3 + + 2 3 x x + + x x 2 3 x x + + 2 3 x x ( ) 2 2 ( ) 2 2 3 ( ) x x ( ) x x 2 2 x x ( ) 2 2 x x + ( ) j 3 2 2 3 4 ( ) 3 2 ( ) 3 2 2 3 ( ) 2 3 x x 2 3 x x ( ) x x ( ) 2 3 ( ) 2 3 x x ( ) 2 3 + − ( ) + − ( ) 2 3 ( ) 2 3 + − ( ) 2 3 x x + − 2 3 x x ( ) x x + − ( ) x x 2 3 ( ) 2 3 x x ( ) + − ( ) 2 3 x x ( ) − k 6 2 x x 6 2 x x 6 2 + + 6 2 + + 6 2 x x + + 6 2 x x + + 6 2 x x ( ) 3 ( ) x x ( ) x x + + ( ) + + x x + + ( ) x x + + l 7 4 4 y y 7 4 y y 7 4 7 4 + − 7 4 7 4 y y 7 4 + − 7 4 y y − ( ) 7 4 ( ) 7 4 7 4 7 4 ( ) 7 4 + − 7 4 ( ) 7 4 + − 7 4 7 4 + − ( ) 7 4 + − m 2 4 4 x x 2 4 x x 2 4 ( ) 2 4 ( ) 2 4 x x ( ) x x 2 4 x x 2 4 ( ) 2 4 x x + − ( ) + − 2 4 ( ) + − 2 4 ( ) n 2 2 y x 2 2 y x 2 2 y ( ) 2 2 ( ) 2 2 2 4 ( ) y x ( ) y x 2 2 y x ( ) 2 2 y x y ( ) ( ) − + ( ) 2 4 ( ) − + 2 4 ( ) 2 4 2 4 ( ) − + 2 4 ( ) o 2 5 4 4 2 y y 2 5 y y 2 5 y ( ) 2 5 ( ) 2 5 4 4 ( ) 4 4 ( ) 4 4 ( ) 4 4 y y ( ) y y 2 5 y y ( ) 2 5 y y 4 4 y y 4 4 ( ) y y 4 4 − − 4 4 4 4 ( ) 4 4 − − ( ) y y ( ) − − y y ( ) 4 4 y y 4 4 ( ) y y − − y y 4 4 ( ) y y p 3 2 4 9 3 2 x x 3 2 ( ) 3 2 ( ) 3 2 4 9 ( ) 4 9 x x ( ) 3 2 x x ( ) 3 2 x x 4 9 + − 4 9 ( ) + − ( ) 4 9 ( ) 4 9 + − ( ) q 3 2 4 2 y y 3 2 y y 3 2 y ( ) 3 2 ( ) 3 2 y y ( ) y y 3 2 y y 3 2 ( ) 3 2 y y + − ( ) + − 3 2 ( ) + − 3 2 ( ) r 2 1 4 4 ( ) 2 1 ( ) 2 1 x x 4 4 x x 4 4 ( ) x x ( ) 2 1 ( ) x x 2 1 ( ) − + ( ) − + 2 1 ( ) − + ( ) x x − + x x ( ) x x − + x x 2 1 ( ) x x ( ) − + 2 1 ( ) 2 1 x x ( ) 4 4 4 4 2 Simplify these expressions by removing brackets and collecting like terms. a 4 40 2 ( ) 4 4 ( ) 4 40 2 ( ) 0 2( ) 3 ( ) x x 0 2 x x ( ) x x ( ) 4 4 ( ) x x 4 4 ( ) 0 2 ( ) 0 2 x x ( ) ( ) x x ( ) 0 2 + + 0 2 ( ) + + 4 4 ( ) + + 4 4 ( ) 0 2 ( ) 0 2 + + ( ) 0 2 x x + + 0 2 x x ( ) x x + + x x 4 4 ( ) x x ( ) + + 4 4 ( ) 4 4 x x ( ) 0 2 ( ) 0 2 x x ( ) + + ( ) 0 2 x x ( ) ( ) ( ) b 2 2 2 3 ( ) 2 2 ( ) 2 2 ( ) 2 3 ( ) 2 3 x x 2 3 x x ( ) x x ( ) 2 2 ( ) x x 2 2 ( ) 2 3 ( ) 2 3 x x 2 3 ( ) − + ( ) − + 2 2 ( ) − + ( ) x x − + x x ( ) x x − + x x 2 2 ( ) x x ( ) − + 2 2 ( ) 2 2 x x ( ) 2 3 ( ) 2 3 ( ) c 3 2 4 5 ( ) 3 2 ( ) 3 2 ( ) 4 5 ( ) 4 5 x x 4 5 x x ( ) x x 3 2 ( ) x x 3 2 ( ) 4 5 ( ) 4 5 x x 4 5 ( ) + + ( ) + + 3 2 ( ) + + 3 2 ( ) x x + + x x ( ) x x + + x x 3 2 ( ) x x ( ) + + 3 2 ( ) 3 2 x x ( ) 4 5 ( ) 4 5 ( ) d 8 10 4 ( ) 8 1 ( ) 8 10 4 ( ) 0 4( ) 3 2 ( ) x x 0 4 x x ( ) x x 8 1 ( ) x x 8 1 ( ) 0 4 ( ) 0 4 x x ( ) ( ) x x ( ) 3 2 ( ) x x ( ) 0 4 + + 0 4 ( ) + + 8 1 ( ) + + 8 1 ( ) 0 4 ( ) 0 4 + + ( ) 0 4 x x + + 0 4 x x ( ) x x + + x x 8 1 ( ) x x ( ) + + 8 1 ( ) 8 1 x x ( ) 0 4 ( ) 0 4 x x ( ) + + ( ) 0 4 x x ( ) 3 2 ( ) x x ( ) 3 2 ( ) 3 2 x x ( ) e 4 2 2 4 2 2 2 4 2 2 ( ) 4 2 ( ) 4 2 2 2 ( ) 2 2 4 2 2 2 4 2 ( ) 2 2 ( ) 2 4 ( ) 2 4 2 2 ( ) 2 2 2 4 2 2 ( ) 2 4 2 2 x x 2 4 x x ( ) x x ( ) 4 2 ( ) x x 4 2 ( ) ( ) x x ( ) 2 4 ( ) 2 4 x x ( ) + + 2 2 + + 2 2 ( ) + + 4 2 ( ) + + 4 2 ( ) 2 2 ( ) 2 2 + + ( ) 4 2 2 2 ( ) 2 2 + + 4 2 2 2 4 2 ( ) 2 2 x x + + x x ( ) x x + + x x 4 2 ( ) x x ( ) + + 4 2 ( ) 4 2 x x ( ) ( ) x x ( ) x x f 4 1 2 3 x x 4 1 x x 4 1 2 3 x x 2 3 ( ) 4 1 ( ) 4 1 x x ( ) x x 4 1 x x 4 1 ( ) 4 1 x x ( ) 2 3 ( ) 2 3 2 3 x x 2 3 ( ) 2 3 x x + + ( ) + + 4 1 ( ) + + 4 1 ( ) 2 3 ( ) 2 3 ( ) g 3 4 4 4 x y 3 4 x y 3 4 xy ( ) 3 4 ( ) 3 4 4 4 ( ) 4 4 x y ( ) x y 3 4 x y ( ) 3 4 x y ( ) 3 4 ( ) xy ( ) 3 4 xy 3 4 ( ) xy x ( ) 4 4 − + 4 4 ( ) − + ( ) 4 4 ( ) 4 4 − + ( ) 3 4 ( ) 3 4 ( ) h 2 5 4 2 x y 2 5 x y 2 5 y ( ) 2 5 ( ) 2 5 4 2 ( ) 4 2 x y ( ) x y 2 5 x y ( ) 2 5 x y ( ) 6 4 ( ) x x ( ) 6 4 x x 6 4 ( ) x xy ( ) x x ( ) 4 2 − + 4 2 ( ) − + ( ) 4 2 ( ) 4 2 − + ( ) 6 4 x x ( ) x x 6 4 x x 6 4 ( ) x x i 3 4 8 3 x y 3 4 x y 3 4 xy ( ) 3 4 ( ) 3 4 8 3 ( ) 8 3 x y ( ) x y 3 4 x y ( ) 3 4 x y 8 3 x y 8 3 ( ) x y ( ) 2 5 ( ) xy ( ) 2 5 xy 2 5 ( ) xy x ( ) 8 3 − + 8 3 ( ) − + 8 3 ( ) 8 3 − + ( ) x y ( ) − + x y ( ) 8 3 x y 8 3 ( ) x y − + x y 8 3 ( ) x y 2 5 ( ) 2 5 ( ) j 3 6 4 3 ( ) 3 6 ( ) 3 6 4 3 ( ) 4 3 ( ) 4 3 ( ) 4 3 2 ( ) x y ( ) x y ( ) 4 3 ( ) x y 4 3 ( ) x y 4 3 x y 4 3 ( ) x y ( ) 4 3 ( ) 4 3 x y ( ) 2 ( ) x y ( ) 4 3 − + 4 3 ( ) − + 4 3 ( ) 4 3 − + ( ) ( ) x y − + ( ) x y 4 3 ( ) x y 4 3 ( ) − + ( ) 4 3 x y ( ) ( ) x y ( ) x y k 3 4 2 5 2 2 3 4 2 2 3 4 2 5 2 2 3 3 4 x x 3 4 ( ) 3 4 ( ) 3 4 2 2 ( ) 2 2 3 4 2 2 ( ) 3 4 2 2 x x ( ) 3 4 x x ( ) 3 4 x x ( ) 2 5 ( ) 2 5 2 ( ) 2 2 ( ) 2 2 2 5 2 2 ( ) 2 5 2 2 3 ( ) x x ( ) 2 x x ( ) x x − + 2 2 − + 2 2 ( ) − + 2 2 ( ) 2 2 − + ( ) x x ( ) − + x x ( ) x x ( ) x x ( ) l x x y x y ( ) x x ( ) x x y x ( ) y x ( ) y x ( ) y x y ( ) − + y x − + y x ( ) − + ( ) y x ( ) y x − + ( ) ( ) ( ) 3 2 y x 3 2 y x ( ) 3 2 ( ) y x ( ) y x 3 2 y x ( ) m 4 2 3 4 ( ) 4 2 ( ) 4 2 ( ) 3 4 ( ) 3 4 x x 3 4 x x 3 4 ( ) x x ( ) 4 2 ( ) x x 4 2 ( ) y ( ) ( ) − + ( ) − + 4 2 ( ) − + ( ) x x − + x x ( ) x x − + x x 4 2 ( ) x x ( ) − + 4 2 ( ) 4 2 x x ( ) ( ) ( ) n x x y x x y ( ) x x ( ) x x y x ( ) y x( ) x y ( ) + + y x + + y x ( ) + + ( ) y x ( ) y x + + ( ) x y ( ) x y ( ) o 2 2 2 x x 2 2 x x 2 2 y x 2 2 y x xy ( ) 2 2 ( ) 2 2 x x ( ) x x 2 2 x x 2 2 ( ) 2 2 x x y x ( ) y x ( ) 3 ( ) 2 ( ) y x ( ) y x xy ( ) 2 2 + + 2 2 2 2 y x + + 2 2 y x 2 2 ( ) 2 2 + + 2 2 ( ) 2 2 y x 2 2 ( ) 2 2 y x + + y x 2 2 ( ) y x ( ) ( ) p x x ( ) x x ( ) x x ( ) x ( ) ( ) 2 3 ( ) x x ( ) 2 3 x x ( ) 3 5 ( ) 3 5 ( ) ( ) ( ) + + ( ) + + ( ) 2 3 ( ) + + ( ) 2 3 ( ) ( ) q 4 2 3 5 ( ) 4 2 ( ) 4 2 3 5 ( ) 3 5 ( ) 3 5 ( ) 3 5 3 5 x x ( ) x x ( ) 3 5 ( ) 3 5 x x ( ) 3 5 ( ) 3 5 x x 3 5 ( ) 3 5 − + 3 5 ( ) − + 3 5 ( ) 3 5 − + ( ) 3 5 x x − + 3 5 x x ( ) x x − + ( ) x x 3 5 ( ) 3 5 x x ( ) − + ( ) 3 5 x x ( ) 3 5 ( ) 3 5 ( ) r 3 4 2 5 ( ) 3 4 ( ) 3 4 2 5 ( ) 2 5( ) 3 ( ) xy ( ) xy ( ) x x 2 5 x x 2 5 ( ) 2 5 x x 2 5 ( ) ( ) x x ( ) 3 ( ) x x ( ) xy ( ) xy ( ) 2 5 − + 2 5 ( ) − + ( ) 2 5 ( ) 2 5 − + ( ) 2 5 x x − + 2 5 x x 2 5 ( ) 2 5 x x 2 5 ( ) − + ( ) 2 5 x x ( ) ( ) ( ) 2.5 Indices Revisiting index notation You already know how to write powers of two and three using indices: 2 2 22 × = 2 2 × = 2 2 and y y y × = y y × = y y 2 2 2 2 23 × × 2 2 × × 2 2 2 2 2 2 and y y y y × × y y y × × y y y = 3 When you write a number using indices (powers) you have written it in index notation. Any number can be used as an index including 0, negative integers and fractions. The index tells you how many times the base has been multiplied by itself. So: 3 3 3 3 34 3 3 3 3 × × × 3 3 3 3 = 3 is the base, 4 is the index a a a a a a × × × × a a a a a × × × × a a a a a = 5 a is the base, 5 is the index The plural of ‘index’ is ‘indices’. Exponent is another word sometimes used to mean ‘index’ or ‘power’. These words can be used interchangeably but ‘index’ is more commonly used for IGCSE. When you write a power out in full as a multiplication you are writing it in expanded form. Worked example 11 Write each expression using index notation. a 2 × 2 × 2 × 2 × 2 × 2 b x × x × x × x c x × x × x × y × y × y × y a 2 × 2 × 2 × 2 × 2 × 2 = 26 Count how many times 2 is multiplied by itself to give you the index. b x × x × x × x = x4 Count how many times x is multiplied by itself to give you the index. c x × x × x × y × y × y × y = x3 y4 Count how many times x is multiplied by itself to get the index of x; then work out the index of y in the same way. When you evaluate a number raised to a power, you are carrying out the multiplication to obtain a single value. Worked example 12 Use your calculator to evaluate: a 25 b 28 c 106 d 74 a 25 = 32 Enter 2 x[] 5 = b 28 = 256 Enter 2 x[] 8 = c 106 = 1000000 Enter 1 0 x[] 6 = d 74 = 2401 Enter 7 x[] 4 = e s s - R e v i e w C o p y - C a m b r i d g e U n i v e r s i t y P r e s s - R e v i e w C o p y R e v i e w C o p y - C a m b r i d g e U n i v e r s i t y P r e s s - R e v i e w C o p y R e v i e w C o p y - C a m b r i d g e U n i v e r s i t y P r e s s - R e v i e w C o p y R e v i e w C o p y - C a m b r i d g e U n i v e r s i t y Copyright Material - Review Only - Not for Redistribution
- 46. Unit 1: Algebra Cambridge IGCSE Mathematics 36 Exercise 2.7 1 Write each expression using index notation. a 2 2 2 2 2 2 2 2 2 2 2 2 2 2 2 2 2 2 2 2 × × × 2 2 2 2 2 b 3 3 3 3 3 3 3 3 × × × 3 3 3 3 c 7 7 7 7 7 7 d 11 11 11 × × 11 × × e 10 10 10 10 10 × × × × 10 × × × × 10 × × × × 10 × × × × f 8 8 8 8 8 8 8 8 8 8 8 8 8 8 8 8 8 8 8 8 × × × 8 8 8 8 8 g a a a a × × × a a a a × × × a a a a h x x x x x × × × × x x x x x × × × × x x x x x i y y y y y y × y y y y y y y y y y y y × × × y y y y y y × × × y y y y y y × y y y y y y y y y y y y j a a a b b × × × a a a × × × a a a b b b b k x x y y y y × × x x × × x x × × × y y y y × × × y y y y l p p p q q × × p p × × p p × × p q × × p q m x x x x y y y × × × x x x x × × × x x x x × × × y y × × × y y n x y x y y x y × × x y × × x y × × × x y × × × x y y x × × × y x × o a b a b a b c a b a b a b × × a b a b a b a b a b a b × × a b a b a b × × a b a b a b × × a b a b a b 2 Evaluate: a 104 b 73 c 67 d 49 e 105 f 112 g 210 h 94 i 26 j 2 3 3 4 2 3 3 4 2 3 2 3 2 3 2 3 3 4 2 3 3 4 k 5 3 2 8 5 3 2 8 5 3 5 3 5 3 5 3 2 8 5 3 2 8 l 4 2 5 6 4 2 5 6 4 2 4 2 4 2 4 2 5 6 4 2 5 6 m 2 3 6 4 2 3 6 4 2 3 2 3 2 3 2 3 6 4 2 3 6 4 n 2 3 8 2 2 3 8 2 2 3 2 3 2 3 2 3 8 2 2 3 8 2 o 5 3 3 5 5 3 3 5 5 3 5 3 5 3 5 3 3 5 5 3 3 5 3 Express the following as products of prime factors, in index notation. a 64 b 243 c 400 d 1600 e 16384 f 20736 g 59049 h 390625 4 Write several square numbers as products of prime factors, using index notation. What is true about the index needed for each prime? Index notation and products of prime factors Index notation is very useful when you have to express a number as a product of its prime factors because it allows you to write the factors in a short form. Quickly remind yourself, from chapter 1, how a composite number can be written as a product of primes. REWIND Worked example 13 Express these numbers as products of their prime factors in index form. a 200 b 19683 The diagrams below are a reminder of the factor tree and division methods for finding the prime factors. a 50 2 25 5 2 5 2 100 2 200 b 19 683 6561 2187 729 243 81 27 9 3 1 3 3 3 3 3 3 3 3 3 = 2 × 2 × 2 × 5 × 5 = 3 × 3 × 3 × 3 × 3 × 3 × 3 × 3 × 3 a 200 2 5 3 2 2 5 3 2 2 5 = × 2 5 = × 2 5 2 5 3 2 2 5 = × 2 5 3 2 b 19683 39 = e s s - R e v i e w C o p y - C a m b r i d g e U n i v e r s i t y P r e s s - R e v i e w C o p y R e v i e w C o p y - C a m b r i d g e U n i v e r s i t y P r e s s - R e v i e w C o p y R e v i e w C o p y - C a m b r i d g e U n i v e r s i t y P r e s s - R e v i e w C o p y R e v i e w C o p y - C a m b r i d g e U n i v e r s i t y Copyright Material - Review Only - Not for Redistribution RM.DL.Books
- 47. Unit 1: Algebra 37 2 Making sense of algebra Dividing the same base number with different indices Look at these two divisions: 3 3 4 2 3 3 4 2 3 3 3 3 3 3 3 3 4 2 4 2 and x x 6 2 x x 6 2 x x x x x x 6 2 6 2 x x 6 2 x x 6 2 You already know you can simplify these by writing them in expanded form and cancelling like this: 3 3 3 3 3 3 3 3 3 3 3 3 3 3 3 3 32 × × 3 3 × × 3 3 3 3 3 3 3 3 3 3 = × 3 3 = × 3 3 = x x x x x x x x x x x x x x x x x x x x x × × × × x x x x × × × × x x x x × x x x x × x x x x = × × × x x x x × × × x x x x = 4 In other words: 3 3 3 4 2 3 3 4 2 3 3 4 2 ÷ = 3 3 ÷ = 3 3 4 2 ÷ = 3 3 4 2 ÷ = 3 3 4 2 4 2 4 2 and x x x 6 2 x x 6 2 x x 6 2 ÷ = x x ÷ = x x 6 2 ÷ = 6 2 x x 6 2 ÷ = x x 6 2 6 2 6 2 This gives you the law of indices for division: When you divide index expressions with the same base you can subtract the indices: x x x m n x x m n x x m n ÷ = x x ÷ = x x m n ÷ = x x m n ÷ = x x m n m n m n The multiplication and division rules will be used more when you study standard form in chapter 5. FAST FORWARD The laws of indices The laws of indices are very important in algebra because they give you quick ways of simplifying expressions. You will use these laws over and over again as you learn more and more algebra, so it is important that you understand them and that you can apply them in different situations. Multiplying the same base number with different indices Look at these two multiplications: 3 3 2 4 3 3 2 4 3 3 3 3 3 3 3 3 2 4 3 3 2 4 x x 3 4 x x 3 4 x x x x x x 3 4 3 4 x x 3 4 x x 3 4 In the first multiplication, 3 is the ‘base’ number and in the second, x is the ‘base’ number. You already know you can simplify these by expanding them like this: 3 3 3 3 3 3 36 3 3 3 3 3 3 × × × × × 3 3 3 3 3 3 = x x x x x x x x × × × × × × x x x x x x x × × × × × × x x x x x x x = 7 In other words: 3 3 3 2 4 3 3 2 4 3 3 2 4 × = 3 3 × = 3 3 2 4 × = 3 3 2 4 × = 3 3 2 4 2 4 2 4 and x x x 3 4 x x 3 4 x x 3 4 × = x x × = x x 3 4 × = 3 4 x x 3 4 × = x x 3 4 3 4 3 4 This gives you the law of indices for multiplication: When you multiply index expressions with the same base you can add the indices: x x x m n x x m n x x m n × = x x × = x x m n × = m n x x m n × = x x m n + m n m n Worked example 14 Simplify: a 4 4 3 6 4 4 3 6 4 4 4 4 4 4 4 4 3 6 4 4 3 6 b x x 2 3 x x 2 3 x x x x x x 2 3 2 3 x x 2 3 x x 2 3 c 2 3 2 4 2 3 2 4 2 3 x y 2 3 x y 2 3 2 3 2 4 2 3 x y 2 3 2 4 xy 2 4 xy 2 4 2 3 2 3 2 3 2 4 2 3 2 4 a 4 4 4 4 3 6 4 4 3 6 4 4 3 6 4 4 3 6 4 49 × = 4 4 × = 4 4 3 6 × = 4 4 3 6 × = 4 4 3 6 4 4 4 4 3 6 3 6 4 4 3 6 4 4 3 6 Add the indices. b x x x x 2 3 x x 2 3 x x 2 3 x x 2 3 x x5 × = x x × = x x 2 3 × = 2 3 x x 2 3 × = x x 2 3 x x x x 2 3 2 3 x x 2 3 x x 2 3 Add the indices. c 2 3 2 3 6 2 4 2 3 2 4 2 3 2 1 1 4 3 5 x y 2 3 x y 2 3 2 3 2 4 2 3 x y 2 3 2 4 xy x y 2 1 x y x y 3 5 x y 3 5 × = 2 3 × = 2 3 2 4 × = 2 3 2 4 × = 2 3 2 4 xy × = 2 4 xy 2 4 × = xy × × 2 3 × × 2 3 × = 1 4 × = x y × = x y + + 2 1 + + 2 1 1 4 + + 1 4 x y + + 2 1 x y + + 2 1 x y × = + + 1 4 × = + + 1 4 × = x y × = x y + + × = Multiply the numbers first, then add the indices of like variables. Remember every letter or number has a power of 1 (usually unwritten). So x means x1 and y means y1 . e s s - R e v i e w C o p y - C a m b r i d g e U n i v e r s i t y P r e s s - R e v i e w C o p y R e v i e w C o p y - C a m b r i d g e U n i v e r s i t y P r e s s - R e v i e w C o p y R e v i e w C o p y - C a m b r i d g e U n i v e r s i t y P r e s s - R e v i e w C o p y R e v i e w C o p y - C a m b r i d g e U n i v e r s i t y Copyright Material - Review Only - Not for Redistribution
- 48. Unit 1: Algebra Cambridge IGCSE Mathematics 38 The power 0 You should remember that any value divided by itself gives 1. So, 3 3 1 ÷ = 3 3 ÷ = 3 3 and x x ÷ = x x ÷ = x x 1 and x x 4 4 1 = . If we use the law of indices for division we can see that: x x x x 4 4 4 4 0 = = x x = = x x 4 4 4 4 This gives us the law of indices for the power 0. Any value to the power 0 is equal to 1. So x0 1 = . Raising a power Look at these two examples: ( ) x x ( ) x x ( ) x x x 3 2 ( ) 3 2 ( ) x x 3 2 ( ) x x 3 2 ( ) x x3 3 x x 3 3 x x3 3 6 = × x x = × x x3 3 = × 3 3 = = x x = = x x3 3 3 3 ( ) ( ) ( ) 2 2 2 2 2 16 3 4 ( ) 3 4 ( ) 3 3 3 3 2 2 2 2 3 3 3 3 2 2 2 2 4 2 1 2 1 3 3 3 3 2 1 3 3 3 3 2 1 12 ( ) ( ) x x x x 2 2 2 2 x x x x 2 2 2 2 3 3 3 3 x x x x 2 2 2 2 3 3 3 3 2 2 2 2 x x x x 3 3 3 3 x x 2 1 x x 2 16 x x 2 1 3 3 3 3 2 1 x x 3 3 3 3 = 2 2 2 2 3 3 3 3 2 2 2 2 × × × 2 2 2 2 3 3 3 3 2 2 2 2 x x x x 2 2 2 2 × × × 2 2 2 2 x x x x 2 2 2 2 3 3 3 3 2 2 2 2 x x x x 3 3 3 3 × × × 2 2 2 2 3 3 3 3 2 2 2 2 x x x x 3 3 3 3 = × 2 1 = × 2 1 2 1 2 1 = × 2 1 x x 2 1 x x 3 3 3 3 + + + 3 3 3 3 2 1 3 3 3 3 2 1 + + + 2 1 3 3 3 3 If we write the examples in expanded form we can see that ( ) x x ( ) x x ( ) 3 2 ( ) 3 2 ( ) x x 3 2 x x ( ) x x 3 2 ( ) x x6 x x x x and ( ) 2 1 ( ) 2 1 ( ) 6 3 4 ( ) 3 4 ( ) 2 1 3 4 2 1 ( ) 2 1 3 4 ( ) 2 1 12 x x ( ) x x ( ) 2 1 x x ( ) 2 1 x x ( ) 2 16 x x 2 1 3 4 x x 3 4 ( ) 2 1 3 4 ( ) 2 1 x x 2 1 ( ) 3 4 2 1 2 1 x x 2 1 x x This gives us the law of indices for raising a power to another power: When you have to raise a power to another power you multiply the indices: ( ) x x ( ) x x ( ) m n ( ) m n ( ) x x m n x x ( ) x x m n ( ) x xmn x x x x Technically, there is an awkward exception to this rule when x = 0. 00 is usually defined to be 1! Worked example 16 Simplify: a ( ) ( ) ( ) 3 6 ( ) 3 6 ( ) b ( ) ( ) ( ) 4 3 ( ) 4 3 ( )2 x y ( ) x y ( ) ( ) 4 3 ( ) x y ( ) 4 3 c ( ) ( ) x x ( ) x x ( ) ( ) x x ( ) 3 4 ( ) 3 4 ( ) x x 3 4 x x ( ) x x 3 4 ( ) x x6 2 ( ) 6 2 ( ) x x x x a ( ) x x ( ) x x ( ) x 3 6 ( ) 3 6 ( ) x x 3 6 x x ( ) x x 3 6 ( ) x x3 6 18 x x x x = 3 6 3 6 Multiply the indices. Worked example 15 Simplify: a x x 6 2 b 6 3 5 2 x x c 10 5 3 2 x y 3 2 x y 3 2 xy a x x x x 6 2 6 2 x x 6 2 x x4 = = x x = = x x 6 2 6 2 Subtract the indices. b 6 3 6 3 2 1 2 5 2 5 2 5 2 3 x x x x x x 2 x x 5 2 x x = × = × = × = × x x x x 5 2 5 2 Divide (cancel) the coefficients. Subtract the indices. c 10 5 10 5 2 1 2 3 2 3 2 3 1 2 1 2 x y 3 2 x y 3 2 xy x x y 3 2 3 2 y x y 3 1 x y x y 2 x y = × = × × = × = × x y x y = − − 3 1 − − 3 1 2 1 − − 2 1 Divide the coefficients. Subtract the indices. Remember ‘coefficient’ is the number in the term. e s s - R e v i e w C o p y - C a m b r i d g e U n i v e r s i t y P r e s s - R e v i e w C o p y R e v i e w C o p y - C a m b r i d g e U n i v e r s i t y P r e s s - R e v i e w C o p y R e v i e w C o p y - C a m b r i d g e U n i v e r s i t y P r e s s - R e v i e w C o p y R e v i e w C o p y - C a m b r i d g e U n i v e r s i t y Copyright Material - Review Only - Not for Redistribution
- 49. Unit 1: Algebra 39 2 Making sense of algebra A common error is to forget to take powers of the numerical terms. For example in part (b), the ‘3’ needs to be squared to give ‘9’. Exercise 2.8 1 Simplify: a 3 3 2 6 3 3 2 6 3 3 3 3 3 3 3 3 2 6 3 3 2 6 b 4 4 2 9 4 4 2 9 4 4 4 4 4 4 4 4 2 9 4 4 2 9 c 8 8 2 0 8 8 2 0 8 8 8 8 8 8 8 8 2 0 8 8 2 0 d x x 9 4 x x 9 4 x x x x x x 9 4 9 4 x x 9 4 x x 9 4 e y y 2 7 y y 2 7 y y y y 2 7 2 7 y y 2 7 y y 2 7 f y y 3 4 y y 3 4 y y y y y y 3 4 3 4 y y 3 4 y y 3 4 g y y × y y y y5 h x x × x x x x4 i 3 2 4 3 3 2 4 3 3 2 x x 3 2 x x 3 2 4 3 x x 4 3 3 2 4 3 3 2 x x 4 3 3 2 4 3 3 2 4 3 3 2 x x 3 2 x x 3 2 4 3 x x 4 3 3 2 4 3 3 2 x x 4 3 j 3 3 2 4 3 3 2 4 3 3 y y 3 3 y y 3 3 3 3 3 3 3 3 2 4 3 3 2 4 3 3 y y 3 3 y y k 2 3 x x × x x x x l 3 2 3 4 3 2 3 4 3 2 x x 3 2 x x 3 2 3 4 x x 3 4 3 2 3 4 3 2 x x 3 4 3 2 3 4 3 2 3 4 3 2 x x 3 2 x x 3 2 3 4 x x 3 4 3 2 3 4 3 2 x x 3 4 m 5 3 3 5 3 5 3 5 3 5 3 5 3 5 3 n 8 4 3 x x 4 3 x x 4 3 4 3 4 3 x x x x 4 3 x x 4 3 x x o 4 2 6 4 2 4 2 x x 4 2 x x 4 2 4 2 4 2 x x 4 2 4 2 4 2 x x 4 2 x x p x3 × 4x5 2 Simplify: a x x 6 4 x x 6 4 x x x x x x 6 4 6 4 x x 6 4 x x 6 4 b x x 12 3 ÷ x x x x c y y 4 3 y y 4 3 y y y y y y 4 3 4 3 y y 4 3 y y 4 3 d x x 3 x x x x ÷ x x x x e x x 5 f x x 6 4 g 6 2 5 3 x x h 9 3 7 4 x x i 12 3 2 y y j 3 6 4 3 x x k 15 5 3 3 x x l 9 3 4 3 x x m 3 9 3 4 x x n 16 4 2 2 x y xy o 12 12 2 2 xy xy 3 Simplify: a ( ) ( ) ( ) 2 2 ( ) 2 2 ( ) b ( ) ( ) ( ) 2 3 ( ) 2 3 ( ) c ( ) ( ) ( ) 2 6 ( ) 2 6 ( ) d ( ) y ( ) ( ) 3 2 ( ) 3 2 ( ) e ( ) ( ) ( ) 2 5 ( ) 2 5 ( ) ( ) ( ) f ( ) ( ) ( ) 2 2 ( ) 2 2 ( )2 x y ( ) x y ( ) g ( ) ( ) ( ) 4 0 ( ) 4 0 ( ) h ( ) ( ) ( ) 2 3 ( ) 2 3 ( ) ( ) ( ) i ( ) x y ( ) x y ( ) 2 2 ( ) 2 2 ( )3 j ( ) x y ( ) x y ( ) 2 4 ( ) 2 4 ( )5 k ( ) xy ( ) xy ( ) 4 3 ( ) 4 3 ( ) l ( ) ( ) ( ) 2 2 ( ) 2 2 ( ) xy ( ) xy ( ) m ( ) ( ) ( ) 2 4 ( ) 2 4 ( ) ( ) ( ) n ( ) xy ( ) xy ( ) 6 4 ( ) 6 4 ( ) o x y 2 0 4 Use the appropriate laws of indices to simplify these expressions. a 2 3 2 2 3 2 3 2 3 2 3 x x 2 3 x x 2 3 2 3 2 3 x x 2 3 x × × 2 3 × × 2 3 2 3 × × 2 3 2 3 x x × × 2 3 x x × × 2 3 x x 2 3 x x 2 3 × × x x 2 3 2 3 x x 2 3 × × 2 3 2 3 2 3 x x 2 3 b 4 2 3 2 × × 4 2 × × 4 2x x 3 x x × × x x × × y c 4 2 x x x × × x x x × × x x x d ( ) x x ( ) x x ( ) 2 2 ( ) 2 2 ( ) 2 4 x x x x ÷ x x x x e 11 3 2 4 3 2 2 x a 4 x a 3 2 x a 4 3 2 x a 3 2 b 3 2 3 2 x a x a 3 2 x a 3 2 x a ( ) 3 2 ( ) 3 2 x a ( ) x a 3 2 x a 3 2 ( ) 3 2 x a b ( ) f 4 7 2 4 7 x x 4 7 ( ) 4 7 ( ) 4 7 2 ( ) 4 7 4 7 ( ) 4 7 x x 4 7 ( ) 4 7 x x 4 7 ( ) 4 7 ( ) g x x 2 3 x x 2 3 ( ) x x ( ) x x x ( ) 2 3 ( ) 2 3 x x 2 3 ( ) x x 2 3 x 2 3 ( ) 2 3 x x x x ( ) 2 3 2 3 ( ) x x 2 3 x x 2 3 ( ) 2 3 x x 2 3 ( ) ( ) h x x 8 3 x x 8 3 x x 2 x x x x 8 3 8 3 x x 8 3 x x 8 3 ( ) x x ( ) x x 8 3 ( ) 8 3 x x 8 3 ( ) x x 8 3 i 7 2 2 3 2 x y x y ÷( ) 3 2 ( ) 3 2 x y ( ) 3 2 x y 3 2 ( ) x y j ( ) ( ) 4 3 ( ) 6 2 4 ( ) 2 4 ( ) ( ) 4 3 ( ) 2 4 ( ) 4 3 4 ( ) x x ( ) ( ) 4 3 ( ) x x ( ) 4 3 x ( ) 4 3 ( ) 4 3 ( ) 4 3 2 4 4 3 ( ) 4 3 ( ) 2 4 4 3 ( ) 4 3 x x 4 3 ( ) 4 3 ( ) x x 4 3 k x y 4 2 3 l x xy 8 2 x x 8 2 x x 4 2 4 x x x x 8 2 8 2 x x 8 2 x x 8 2 ( ) x x ( ) x xy ( ) x x ( ) 8 2 ( ) 8 2 x x 8 2 ( ) x x 8 2 y 8 2 ( ) 8 2 x x 8 2 ( ) x x 8 2 ( ) x ( ) 2 4 ( ) 2 4 2 ( ) m ( ) ( ) ( ) 2 0 ( ) 2 0 ( ) ( ) ( ) n 4 2 2 3 4 2 2 3 4 2 0 x x 4 2 x x 4 2 4 2 2 3 x x 2 3 × ÷ 2 3 × ÷ 4 2 2 3 × ÷ 4 2 2 3 x x × ÷ 4 2 x x × ÷ 4 2 x x 2 3 x x 2 3 × ÷ x x 4 2 2 3 x x 2 3 × ÷ 4 2 2 3 4 2 x x 2 3 ( ) 2 ( ) x ( ) o ( ) ( ) ( ) ( ) ( ) ( ) 2 3 ( ) 2 3 ( )2 3 x y ( ) x y ( ) ( ) 2 3 x y ( ) 2 3 xy ( ) xy ( ) Negative indices At the beginning of this unit you read that negative numbers can also be used as indices. But what does it mean if an index is negative? When there is a mixture of numbers and letters, deal with the numbers first and then apply the laws of indices to the letters in alphabetical order. b ( ) ( ) ( ) 3 9 4 3 ( ) 4 3 ( )2 2 4 2 3 2 8 6 x y ( ) x y ( ) ( ) 4 3 ( ) x y ( ) 4 3 x y 2 4 x y 2 4 2 3 x y 2 3 x y 8 6 x y 8 6 = × 3 = × 2 4 = × 2 4 x y x y 2 3 x y 2 3 x y = × × 2 3 × × x y × × x y 2 3 x y 2 3 × × x y 2 3 x y 2 3 x y × × x y 2 3 x y Square each of the terms to remove the brackets and multiply the indices. c ( ) ( ) x x ( ) x x ( ) ( ) x x ( ) x x x x x x 3 4 ( ) 3 4 ( ) x x 3 4 x x ( ) x x 3 4 ( ) x x6 2 ( ) 6 2 ( ) 3 4 x x 3 4 x x6 2 12 x x 12 x x12 12 12 0 1 x x x x = ÷ x x = ÷ x x x x 3 4 x x = ÷ 3 4 = ÷ x x = ÷ x x x x 12 x x = ÷ 12 = = = × × x x × × 3 4 × × 3 4 x x 3 4 x x × × x x 3 4 6 2 × × 6 2 x x = ÷ x x × × = ÷ x x 3 4 x x = ÷ 3 4 × × x x 3 4 x x = ÷ 3 4 − Expand the brackets first by multiplying the indices. Divide by subtracting the indices. e s s - R e v i e w C o p y - C a m b r i d g e U n i v e r s i t y P r e s s - R e v i e w C o p y R e v i e w C o p y - C a m b r i d g e U n i v e r s i t y P r e s s - R e v i e w C o p y R e v i e w C o p y - C a m b r i d g e U n i v e r s i t y P r e s s - R e v i e w C o p y R e v i e w C o p y - C a m b r i d g e U n i v e r s i t y Copyright Material - Review Only - Not for Redistribution
- 50. Unit 1: Algebra Cambridge IGCSE Mathematics 40 Look at the two methods of working out x x 3 5 x x 3 5 x x x x x x 3 5 3 5 x x 3 5 x x 3 5 below. Using expanded notation: Using the law of indices for division: x x x x x x x x x x x x x 3 5 x x 3 5 x x 2 1 1 ÷ = x x ÷ = x x 3 5 ÷ = 3 5 x x 3 5 ÷ = x x 3 5 × × x x x × × x x x × × × × x x x x x × × × × x x x x x = × x x x x = x x x x 3 5 x x 3 5 x x 3 5 2 ÷ = x x ÷ = x x 3 5 ÷ = 3 5 x x 3 5 ÷ = x x 3 5 = 3 5 3 5 − This shows that 1 2 2 x x = − . And this gives you a rule for working with negative indices: x xm −m = 1 (when x ≠ 0 ) When an expression contains negative indices you apply the same laws as for other indices to simplify it. In plain language you can say that when a number is written with a negative power, it is equal to 1 over the number to the same positive power. Another way of saying ‘1 over’ is reciprocal, so a−2 can be written as the reciprocal of a2 , i.e. 1 2 a . Worked example 17 1 Find the value of: a 4−2 b 5−1 a 4 1 4 1 16 2 2 − = = = = b 5 1 5 1 5 1 −1 = = = = 2 Write these with a positive index. a x−4 b y−3 a x x −4 = 1 4 b y y −3 = 1 3 3 Simplify. Give your answers with positive indices. a 4 2 2 4 x x b 2 3 2 4 2 3 2 4 2 3 x x 2 3 x x 2 3 2 4 x x 2 4 2 3 2 4 2 3 x x 2 4 2 3 − − 2 3 2 4 − − 2 4 2 3 2 4 2 3 − − 2 4 2 3 2 4 2 4 2 3 x x 2 3 x x 2 3 2 4 x x 2 4 2 3 2 4 2 3 x x 2 4 c ( ) ( ) ( ) 2 3 ( ) 2 3 ( ) y ( ) ( ) 2 3 2 3 a 4 2 4 2 2 2 2 4 2 4 2 2 x x x x x = × = × = = 2 4 2 4 − b 2 3 2 3 6 6 2 4 2 3 2 4 2 3 2 4 2 4 6 x x 2 3 x x 2 3 2 3 2 4 2 3 x x 2 4 x x 2 4 x x 2 4 x x 2 3 − − 2 3 2 4 − − 2 4 2 3 2 4 2 3 − − 2 4 2 4 2 4 × = 2 4 × = 2 3 2 4 × = 2 4 x x × = 2 3 x x × = 2 3 x x 2 4 x x 2 4 × = x x 2 3 2 4 x x 2 4 × = 2 3 2 4 2 3 x x 2 4 × 2 4 2 4 = = c ( ) ( ) ( ) ( ) 1 ( ) ( ) 1 3 1 27 2 3 ( ) 2 3 ( ) 2 3 ( ) 2 3 ( ) 3 2 3 6 y ( ) ( ) y ( ) ( ) y 3 2 3 2 y 2 3 2 3 × = = × 3 2 3 2 = These are simple examples. Once you have learned more about working with directed numbers in algebra in chapter 6, you will apply what you have learned to simplify more complicated expressions. FAST FORWARD Exercise 2.9 1 Evaluate: a 4−1 b 3−1 c 8−1 d 5−3 e 6−4 f 2−5 2 State whether the following are true or false. a 4 1 16 −2 = b 8 1 16 −2 = c x x −3 = 1 3 d 2 1 x x −2 = 3 Write each expression so it has only positive indices. a x−2 b y−3 c (xy)−2 d 2x−2 e 12x−3 f 7y−3 g 8xy−3 h 12x−3 y−4 e s s - R e v i e w C o p y - C a m b r i d g e U n i v e r s i t y P r e s s - R e v i e w C o p y R e v i e w C o p y - C a m b r i d g e U n i v e r s i t y P r e s s - R e v i e w C o p y R e v i e w C o p y - C a m b r i d g e U n i v e r s i t y P r e s s - R e v i e w C o p y R e v i e w C o p y - C a m b r i d g e U n i v e r s i t y Copyright Material - Review Only - Not for Redistribution
- 51. Unit 1: Algebra 41 2 Making sense of algebra 4 Simplify. Write your answer using only positive indices. a x x −3 x x x x × x x x x4 b 2 3 x x 2 3 x x 2 3 2 3 − − 2 3 3 3 2 3 3 3 2 3 x x 3 3 2 3 x x 3 3 2 3 x x − − 3 3 2 3 − − 3 3 2 3 − − 2 3 x x 2 3 x x 2 3 3 3 2 3 3 3 2 3 x x 3 3 x x 2 3 x x 2 3 3 3 x x c 4 1 3 7 4 1 3 7 4 12 3 7 x x 4 1 x x 4 12 x x 3 7 x x 3 7 4 1 3 7 4 1 x x 3 7 2 3 7 x x 3 7 4 1 3 7 4 1 3 7 4 1 x x 4 1 x x 4 1 3 7 x x 3 7 4 1 3 7 4 1 x x 3 7 d x x −7 4 e ( ) ( ) ( ) 2 ( ) ( ) ( ) ( )−3 f ( ) ( ) ( ) ( ) ( ) 2 3 ( ) 2 3 ( ) g x x − − 3 4 h x x −2 3 Summary of index laws x x x m n x x m n x x m n × = x x × = x x m n × = m n x x m n × = x x m n + m n m n When multiplying terms, add the indices. x x x m n x x m n x x m n ÷ = x x ÷ = x x m n ÷ = m n x x m n ÷ = x x m n m n m n When dividing, subtract the indices. ( ) x x ( ) x x ( ) m n ( ) m n ( ) x x m n x x ( ) x x m n ( ) x xmn x x x x When finding the power of a power, multiply the indices. x0 1 = Any value to the power 0 is equal to 1 x xm − = m 1 (when x ≠ 0). Fractional indices The laws of indices also apply when the index is a fraction. Look at these examples carefully to see what fractional indices mean in algebra: • x x x x x 1 2 x x x x 1 2 1 2 1 2 1 × x x x x = = = + Use the law of indices and add the powers. In order to understand what x 1 2 means, ask yourself: what number multiplied by itself will give x? x x x x x × = × = x x × = x x x x × = So, x x x x 1 2 x x x x x x x x • y y y y y y 1 3 y y y y y y 1 3 1 3 1 3 1 3 1 3 1 × × y y y × × y y y 3 × × y y y y y y × × = = = + + + + 1 + + 3 + + Use the law of indices and add the powers. What number multiplied by itself and then by itself again will give y? y y y y y y y y y y 3 3 3 3 3 3 3 3 3 y y y 3 3 3 y y y y y y × × y y y y y y × × 3 3 3 × × 3 3 3 3 3 3 × × y y y 3 3 3 y y y × × y y y 3 3 3 y y y 3 3 3 × × 3 3 3 = So y y y y 1 3 y y y y 3 y y y y y y y y This shows that any root of a number can be written using fractional indices. So, x x x x m x x x x m x x x x 1 x x x x. Worked example 18 Worked example 18 1 Rewrite using root signs. a y 1 2 b x 1 5 c xy 1 a y y y y 1 2 y y y y y y y y b x x x x 1 5 x x x x 5 x x x x x x x x c x x x x y x x x x y x x x x 1 x x x x 2 Write in index notation. a 90 b 64 3 c x 4 d ( ) ( ) ( ) ( ) ( ) ( ) ( ) 5 a 90 90 1 2 = b 64 64 3 1 3 = c x x 4 1 4 x x x x d ( ) ( ) ( ) x x ( ) ( ) x x − = ( ) x x 2 2 ( ) 2 2 ( ) ( ) 2 2 ( ) x x 2 2 ( ) x x 2 2 ( ) x x ( ) x x ( ) 2 2 x x x x − = x x 2 2 − = ( ) x x − = x x 2 2 ( ) x x ( ) − = x x ( ) ( ) 2 2 5 1 5 e s s - R e v i e w C o p y - C a m b r i d g e U n i v e r s i t y P r e s s - R e v i e w C o p y R e v i e w C o p y - C a m b r i d g e U n i v e r s i t y P r e s s - R e v i e w C o p y R e v i e w C o p y - C a m b r i d g e U n i v e r s i t y P r e s s - R e v i e w C o p y R e v i e w C o p y - C a m b r i d g e U n i v e r s i t y Copyright Material - Review Only - Not for Redistribution
- 52. Unit 1: Algebra Cambridge IGCSE Mathematics 42 Dealing with non-unit fractions Sometimes you may have to work with indices that are non-unit fractions. For example x 2 3 or y 3 4 . To find the rule for working with these, you have to think back to the law of indices for raising a power to another power. Look at these examples carefully to see how this works: x x 2 3 x x x x 1 2 x x x x ( ) ( ) x x ( ) x x 1 ( ) 3 ( ) 1 3 2 × is 2 3 y y 3 4 y y y y 1 3 y y y y ( ) ( ) y y ( ) y y 1 ( ) 4 ( ) 1 4 3 4 3 × = 3 × = You already know that a unit-fraction gives a root. So we can rewrite these expressions using root signs like this: ( ) ( ) ( ) ( ) x x ( ) x x ( ) ( ) x x ( ) ( ) x x 1 ( ) ( ) ( ) ( ) ( ) x x ( ) x x 2 3 ( ) ( ) ( ) x x ( ) x x 2 x x x x and ( ) ( ) ( ) ( ) y y y y ( ) y y ( ) ( ) y y ( ) ( ) y y 1 ( ) ( ) ( ) ( ) ( ) y y ( ) y y 3 y y y y ( ) ( ) ( ) y y ( ) y y 3 y y y y So, ( ) ( ) ( ) ( ) x x ( ) x x ( ) ( ) x x ( ) ( ) x x 2 ( ) ( ) ( ) ( ) ( ) x x ( ) x x 3 ( ) ( ) ( ) x x ( ) x x 2 x x x x and ( ) ( ) ( ) ( ) y y y y ( ) y y ( ) ( ) y y ( ) ( ) y y 3 ( ) ( ) ( ) ( ) ( ) y y ( ) y y ( ) ( ) ( ) y y ( ) y y 3 y y y y . In general terms: x x x x m n n x x n n x xm n n n n m x x x x m = = x x = = x x n n = = x x n n = = x x n n x x x x × n n n n 1 1 ( ) ( ) x x ( ) x x n ( ) x x x x ( ) 1 1 ( ) 1 1 ( ) ( ) x x ( ) x x x x ( ) n ( ) x x x x ( ) Worked example 19 Work out the value of: a 27 2 3 b 25 1 5 1 5 1 5 a 27 9 2 3 3 2 2 = = = ( ) ( ) 27 ( ) 3 ( ) ( ) 3 ( ) 2 3 2 1 3 = × 2 = × so you square the cube root of 27. b 25 25 125 1 5 3 2 3 3 1 5 1 5 ( ) ( ) 25 ( ) ( ) 5 ( ) = = = = Change the decimal to a vulgar fraction. 3 2 3 1 2 = × 3 = × , so you need to cube the square root of 25. Sometimes you are asked to find the value of the power that produces a given result. You have already learned that another word for power is exponent. An equation that requires you to find the exponent is called an exponential equation. Worked example 20 If 2x = 128 find the value of x. 2 128 2 128 7 7 x x = = ∴ = x ∴ = Remember this means 2 128 = x . Find the value of x by trial and improvement. A non-unit fraction has a numerator (the number on top) that is not 1. For example, 2 3 and 5 7 are non-unit fractions. It is possible that you would want to reverse the order of calculations here and the result will be the same. x x x m n x x x x m m m m x m m n m m m m = = x x = = x x ( ) ( ) x x ( ) x x x x ( ) ( ) ( ) x x ( ) x x x x ( ) n ( ) x x x x ( ) = = ( ) = = x x = = ( ) x x = = x x = = ( ) = = , but the former tends to work best. You saw in chapter 1 that a ‘vulgar’ fraction is in the form a ou saw in chapter 1 that a ‘vulgar’ ou saw in chapter 1 that a ‘vulgar’ b . REWIND E e s s - R e v i e w C o p y - C a m b r i d g e U n i v e r s i t y P r e s s - R e v i e w C o p y R e v i e w C o p y - C a m b r i d g e U n i v e r s i t y P r e s s - R e v i e w C o p y R e v i e w C o p y - C a m b r i d g e U n i v e r s i t y P r e s s - R e v i e w C o p y R e v i e w C o p y - C a m b r i d g e U n i v e r s i t y Copyright Material - Review Only - Not for Redistribution
- 53. Unit 1: Algebra 43 2 Making sense of algebra Exercise 2.10 1 Evaluate: a 8 1 3 b 32 1 5 c 8 4 3 d 216 2 3 e 2560 75 0 7 0 7 2 Simplify: a x x 1 3 x x x x 1 3 × x x x x b x x 1 2 x x x x 2 3 × x x x x c x x 4 10 1 2 d x y 6 2 1 2 e x x 6 7 2 7 f 7 8 1 2 1 2 3 2 x x x x 2 x x ÷ x x x x− g 2 2 3 8 3 x x h 9 12 1 3 4 3 x x i 1 2 1 2 2 2 x x 2 x x 2 x x ÷ x x x x j − − − − 1 2 3 4 1 4 2 x x − − x x − − 4 x x 2 x x ÷ x x x x − − x x − − x x− k 3 4 1 2 1 2 1 4 x x x x 2 x x ÷ x x x x− l − ÷ − ÷ − 1 4 3 4 − ÷ − ÷ 1 4 2 x x − ÷ x x − ÷ − x x − ÷ − ÷ x x 2 x x 3 Find the value of x in each of these equations. a 2 64 x 2 6 2 6 2 6 2 6 b 196 14 x = c x 1 5 7 = d ( ) ( ) ( ) ( ) − = ( ) 1 6 1 6 ( ) 1 6 ( ) − = 1 6 ( ) − = 1 6 ( ) − = 4 3 1 6 1 6 − = 1 6 − = 1 6 e 3 81 x 3 8 3 8 3 8 3 8 f 4 256 x = g 2 1 64 − = x h 3 81 1 3 8 3 8 x 3 8 3 8 3 8 3 8 3 8 3 8 i 9 1 81 − = x j 3 81 3 8 3 8 3 8 3 8 x 3 8 3 8 k 64 2 x = l 16 8 x = m 4 1 64 − = x Remembers, simplify means to write in its simplest form. So if you were to simplify x x 1 5 x x x x 1 2 × x x x x − you would write: = = = = − − − x x x x 1 5 1 2 2 10 5 10 3 10 3 10 1 Summary Do you know the following? • Algebra has special conventions (rules) that allow us to write mathematical information is short ways. • Letters in algebra are called variables, the number before a letter is called a coefficient and numbers on their own are called constants. • A group of numbers and variables is called a term. Terms are separated by + and − signs, but not by × or ÷ signs. • Like terms have exactly the same combination of variables and powers. You can add and subtract like terms. You can multiply and divide like and unlike terms. • The order of operations rules for numbers (BODMAS) apply in algebra as well. • Removing brackets (multiplying out) is called expanding the expression. Collecting like terms is called simplifying the expression. • Powers are also called indices. The index tells you how many times a number or variable is multiplied by itself. Indices only apply to the number or variable immediately before them. • The laws of indices are a set of rules for simplifying expressions with indices. These laws apply to positive, negative, zero and fractional indices. Are you able to . . . ? • use letters to represent numbers • write expressions to represent mathematical information • substitute letters with numbers to find the value of an expression • add and subtract like terms to simplify expressions • multiply and divide to simplify expressions • expand expressions by removing brackets and getting rid of other grouping symbols • use and make sense of positive, negative and zero indices • apply the laws of indices to simplify expressions • work with fractional indices • solve exponential equations using fractional indices. E E e s s - R e v i e w C o p y - C a m b r i d g e U n i v e r s i t y P r e s s - R e v i e w C o p y R e v i e w C o p y - C a m b r i d g e U n i v e r s i t y P r e s s - R e v i e w C o p y R e v i e w C o p y - C a m b r i d g e U n i v e r s i t y P r e s s - R e v i e w C o p y R e v i e w C o p y - C a m b r i d g e U n i v e r s i t y Copyright Material - Review Only - Not for Redistribution
- 54. Unit 1: Algebra 44 Examination practice Exam-style questions 1 Write an expression in terms of n for: a the sum of a number and 12 b twice a number minus four c a number multiplied by x and then squared d the square of a number cubed. 2 Simplify: a 9 3 6 2 xy 9 3 xy 9 3x x 6 2 x x 6 2 y x 6 2 y x 6 2 6 2 x x 6 2 y x x x + + 9 3 + + 9 3x x + + x x 6 2 y x 6 2 y x b 6 3 xy 6 3 xy 6 3 xy 6 3 xy 6 3y 6 3 − + 6 3 6 3 xy 6 3 − + xy 3 Simplify: a a b ab 3 4 a b 3 4 a b 3 b 2 3 2 ( ) 3 2 ( ) 3 2 ( ) ( ) c 3 2 3 2 x x 3 2 x x 3 2 y 3 2 3 2 3 2 3 2 3 2 x x 3 2 x x d ( ) ( ) ( ) 2 0 ( ) 2 0 ( ) ( ) ax ( ) e 4 2 3 2 x y 2 3 x y 2 3 x y 2 3 x y 2 3 × 2 3 2 3 4 What is the value of x, when: a 2 32 x 2 3 2 3 2 3 2 3 b 3 1 27 x = 5 Expand each expression and simplify if possible. a 5 2 3 2 ( ) 5 2 ( ) 5 2 ( ) 3 2 ( ) 3 2 x x 3 2 x x ( ) x x 5 2 ( ) x x 5 2 ( ) 3 2 ( ) 3 2 x x 3 2 ( ) − + ( ) − + 5 2 ( ) − + ( ) x x − + x x ( ) x x − + x x 5 2 ( ) x x ( ) − + 5 2 ( ) 5 2 x x ( ) 3 2 ( ) 3 2 ( ) b 5 7 2 2 5 7 x x 5 7y x 2 2 y x 2 2x y ( ) 5 7 ( ) 5 7 5 7 x x 5 7 ( ) 5 7 x x y x ( ) y x( ) 2 2 ( ) 2 2x y ( ) + − y x + − y x ( ) + − 5 7 ( ) + − 5 7 ( ) y x ( ) y x + − ( ) x y ( ) x y ( ) 6 Find the value of ( ) ( ) ( ) x x ( ) ( ) + − ( ) ( ) x x + − ( ) x x 5 5 ( ) 5 5 ( ) ( ) 5 5 ( ) x x 5 5 ( ) x x 5 5 ( ) x x ( ) x x ( ) 5 5 x x + − 5 5 ( ) + − 5 5 ( ) + − x x + − x x 5 5 + − ( ) x x + − x x 5 5 ( ) x x ( ) + − x x ( ) ( ) 5 5 when: a x = 1 b x = 0 c x = 5 7 Simplify and write the answers with positive indices only. a x x 5 2 x x 5 2 x x x x x x 5 2 5 2 x x 5 2 x x 5 2 5 2 5 2 b 8 2 2 4 x x c ( ) ( ) 2 2 ( ) 3 ( ) ( ) ( ) 2 2 ( ) 2 2 ( ) 2 2 ( ) 2 2 − 8 If x ≠ 0 and y ≠ 0 , simplify: a 3 5 3 5 1 3 5 3 5 1 2 x x 3 5 x x 3 5 3 5 3 5 x x 3 5 3 5 3 5 x x 3 5 x x b ( ) ( ) 81 ( ) 6 ( ) ( ) 1 2 y ( ) ( ) c ( ) ( ) 64 ( ) 3 ( ) ( ) 1 3 ( ) ( ) Past paper questions 1 Simplify. 1 2 2 3 3 x [2] [Cambridge IGCSE Mathematics 0580 Paper 22 Q6 May/June 2016] 2 a Simplify 3125 125 1 5 t ( ) . [2] b Find the value of p when 3p = 1 9 . [1] c Find the value of w when x72 + xw = x8 . [1] [Cambridge IGCSE Mathematics 0580 Paper 22 Q17 May/June 2014] e s s - R e v i e w C o p y - C a m b r i d g e U n i v e r s i t y P r e s s - R e v i e w C o p y R e v i e w C o p y - C a m b r i d g e U n i v e r s i t y P r e s s - R e v i e w C o p y R e v i e w C o p y - C a m b r i d g e U n i v e r s i t y P r e s s - R e v i e w C o p y R e v i e w C o p y - C a m b r i d g e U n i v e r s i t y Copyright Material - Review Only - Not for Redistribution
- 55. Unit 1: Shape, space and measures 45 Chapter 3: Lines, angles and shapes Geometry is one of the oldest known areas of mathematics. Farmers in Ancient Egypt knew about lines and angles and they used them to mark out fields after floods. Builders in Egypt and Mesopotamia used knowledge of angles and shapes to build huge temples and pyramids. Today geometry is used in construction, surveying and architecture to plan and build roads, bridges, houses and office blocks. We also use lines and angles to find our way on maps and in the software of GPS devices. Artists use them to get the correct perspective in drawings, opticians use them to make spectacle lenses and even snooker players use them to work out how to hit the ball. • Line • Parallel • Angle • Perpendicular • Acute • Right • Obtuse • Reflex • Vertically opposite • Corresponding • Alternate • Co-interior • Triangle • Quadrilateral • Polygon • Circle Key words In this photo white light is bent by a prism and separated into the different colours of the spectrum. When scientists study the properties of light they use the mathematics of lines and angles. EXTENDED In this chapter you will learn how to: • use the correct terms to talk about points, lines, angles and shapes • classify, measure and construct angles • calculate unknown angles using angle relationships • talk about the properties of triangles, quadrilaterals, circles and polygons. • use instruments to construct triangles. • calculate unknown angles in irregular polygons e s s - R e v i e w C o p y - C a m b r i d g e U n i v e r s i t y P r e s s - R e v i e w C o p y R e v i e w C o p y - C a m b r i d g e U n i v e r s i t y P r e s s - R e v i e w C o p y R e v i e w C o p y - C a m b r i d g e U n i v e r s i t y P r e s s - R e v i e w C o p y R e v i e w C o p y - C a m b r i d g e U n i v e r s i t y Copyright Material - Review Only - Not for Redistribution
- 56. Unit 1: Shape, space and measures Cambridge IGCSE Mathematics 46 3.1 Lines and angles Mathematicians use specific terms and definitions to talk about geometrical figures. You are expected to know what the terms mean and you should be able to use them correctly in your own work. Terms used to talk about lines and angles Term What it means Examples Point A point is shown on paper using a dot (.) or a cross (×). Most often you will use the word ‘point’ to talk about where two lines meet. You will also talk about points on a grid (positions) and name these using ordered pairs of co-ordinates (x, y). Points are normally named using capital letters. A B(2, 3) x y O Line A line is a straight (one-dimensional) figure that extends to infinity in both directions. Normally though, the word ‘line’ is used to talk about the shortest distance between two points. Lines are named using starting point and end point letters. A B line AB Parallel A pair of lines that are the same distance apart all along their length are parallel. The symbol || (or ⃫ ) is used for parallel lines, e.g. AB||CD. Lines that are parallel are marked on diagrams with arrows. C D A B AB CD Angle When two lines meet at a point, they form an angle. The meeting point is called the vertex of the angle and the two lines are called the arms of the angle. Angles are named using three letters: the letter at the end of one arm, the letter at the vertex and the letter at the end of the other arm. The letter in the middle of an angle name always indicates the vertex. A B C vertex angle arm Angle ABC You will use these terms throughout the course but especially in chapter 14, where you learn how to solve simultaneous linear equations graphically. FAST FORWARD RECAP You should already be familiar with the following geometry work: Basic angle facts and relationships Angles on a line Angles round a point Vertically opposite angles Parallel lines and associated angles x y x + y = 180° w + x + y + z = 360° x y w z 2x + 2y = 360° x = x and y = y x x y y x = x alternate y = y corresponding x + y = 180° co-interior x x y y Polygons and circles appear almost everywhere, including sport and music. Think about the symbols drawn on a football pitch or the shapes of musical instruments, for example. LINK e s s - R e v i e w C o p y - C a m b r i d g e U n i v e r s i t y P r e s s - R e v i e w C o p y R e v i e w C o p y - C a m b r i d g e U n i v e r s i t y P r e s s - R e v i e w C o p y R e v i e w C o p y - C a m b r i d g e U n i v e r s i t y P r e s s - R e v i e w C o p y R e v i e w C o p y - C a m b r i d g e U n i v e r s i t y Copyright Material - Review Only - Not for Redistribution
- 57. Unit 1: Shape, space and measures 47 3 Lines, angles and shapes Term What it means Examples Perpendicular When two lines meet at right angles they are perpendicular to each other. The symbol ⊥ is used to show that lines are perpendicular, e.g. MN⊥PQ. 90° angle M P N Q MN PQ Acute angle An acute angle is 0° but 90°. A B C D E F M P N MNP 90° ABC 90° DEF 90° Right angle A right angle is an angle of exactly 90°. A square in the corner is usually used to represent 90°. A right angle is formed between perpendicular lines. X Y Z XY YZ XYZ ; = ° 90 Obtuse angle An obtuse angle is 90° but 180°. A P Q B C R ABC 90° PQR 90° Straight angle A straight angle is an angle of 180°. A line is considered to be a straight angle. M N O MNO MO = straight line =180° Reflex angle A reflex angle is an angle that is 180° but 360°. ABC ° 180 F ° 180 A B C D E F DE Revolution A revolution is a complete turn; an angle of exactly 360°. 360° O Measuring and drawing angles The size of an angle is the amount of turn from one arm of the angle to the other. Angle sizes are measured in degrees (°) from 0 to 360 using a protractor. A 180° protractor has two scales. You need to choose the correct one when you measure an angle. 80 70 60 50 4 0 3 0 2 0 1 0 0 100 110 120 130 1 4 0 1 5 0 1 6 0 1 7 0 180 90 80 70 60 50 4 0 3 0 2 0 1 0 0 100 110 120 130 1 4 0 1 5 0 1 6 0 1 7 0 180 clockwise scale anti-clockwise scale baseline centre Always take time to measure angles carefully. If you need to make calculations using your measured angles, a careless error can lead to several wrong answers. Builders, designers, architects, engineers, artists and even jewellers use shape, space and measure as they work and many of these careers use computer packages to plan and design various items. Most design work starts in 2-D on paper or on screen and moves to 3-D for the final representation. You need a good understanding of lines, angles, shape and space to use Computer-Aided Design (CAD) packages. LINK e s s - R e v i e w C o p y - C a m b r i d g e U n i v e r s i t y P r e s s - R e v i e w C o p y R e v i e w C o p y - C a m b r i d g e U n i v e r s i t y P r e s s - R e v i e w C o p y R e v i e w C o p y - C a m b r i d g e U n i v e r s i t y P r e s s - R e v i e w C o p y R e v i e w C o p y - C a m b r i d g e U n i v e r s i t y Copyright Material - Review Only - Not for Redistribution
- 58. Unit 1: Shape, space and measures Cambridge IGCSE Mathematics 48 Measuring angles 180° Put the centre of the protractor on the vertex of the angle. Align the baseline so it lies on top of one arm of the angle. Using the scale that starts with 0° to read off the size of the angle, move round the scale to the point where it crosses the other arm of the angle. Worked example 1 Measure angles AB̂C and PQ̂R. A B C R Q P A Angle ABC =50° Start at 0° 80 70 60 50 4 0 3 0 2 0 1 0 0 100 110 120 130 130 130 1 4 0 1 5 0 1 6 0 1 7 0 180 180 90 80 70 60 50 50 50 50 4 0 3 0 2 0 1 0 0 0 0 0 100 110 120 130 1 4 0 1 5 0 1 6 0 1 7 0 180 B C read size on inner scale extend arm BA Angle PQR PQ PQ = ° 105 = ° = ° Start at 0° 80 70 60 50 4 0 3 0 2 0 1 0 0 0 100 110 120 130 1 4 0 1 5 0 1 6 0 1 7 0 180 90 90 80 70 60 50 4 0 3 0 2 0 1 0 0 100 110 120 130 1 4 0 1 5 0 1 6 0 1 7 0 180 read size on outer scale R Q P 0 0 180 Place the centre of the protractor at B and align the baseline so it sits on arm BC. Extend arm BA so that it reaches past the scale. Read the inner scale. Angle ABC = 50° Put the centre of the protractor at Q and the baseline along QP. Start at 0° and read the outer scale. Angle PQR = 105° Measuring angles 180° Here are two different methods for measuring a reflex angle with a 180° protractor. You should use the method that you find easier to use. Suppose you had to measure the angle ABC: Method 1: Extend one arm of the angle to form a straight line (180° angle) and then measure the ‘extra bit’. Add the ‘extra bit’ to 180° to get the total size. Extend AB to point D. You know the angle of a straight line is 180°. So ABD = 180°. C A D B 180° B C A Angle ABC is 180°. If the arm of the angle does not extend up to the scale, lengthen the arm past the scale. The length of the arms of the angle does not affect the size of the angle. e s s - R e v i e w C o p y - C a m b r i d g e U n i v e r s i t y P r e s s - R e v i e w C o p y R e v i e w C o p y - C a m b r i d g e U n i v e r s i t y P r e s s - R e v i e w C o p y R e v i e w C o p y - C a m b r i d g e U n i v e r s i t y P r e s s - R e v i e w C o p y R e v i e w C o p y - C a m b r i d g e U n i v e r s i t y Copyright Material - Review Only - Not for Redistribution
- 59. Unit 1: Shape, space and measures 49 3 Lines, angles and shapes Method 2: Measure the inner (non-reflex) angle and subtract it from 360° to get the size of the reflex angle. 50° C A 80 70 60 5 0 4 0 3 0 20 10 0 100 110 120 130 140 1 5 0 1 6 0 1 7 0 1 8 0 90 80 70 60 50 40 3 0 2 0 1 0 0 100 110 120 1 3 0 1 4 0 1 5 0 160 170 1 8 0 B Measure the size of the angle that is 180° (non-reflex) and subtract from 360°. 360° − 50° = 310° ∴ ABC = 310° B C A You can see that the angle ABC is almost 360°. Exercise 3.1 1 For each angle listed: i BAC ii BAD iii BAE iv CAD v CAF vi CAE vii DAB viii DAE ix DAF a state what type of angle it is (acute, right or obtuse) b estimate its size in degrees c use a protractor to measure the actual size of each angle to the nearest degree. d What is the size of reflex angle DAB? Applying your skills 2 Some protractors, like the one shown on the left, are circular. a How is this different from the 180° protractor? b Write instructions to teach someone how to use a circular protractor to measure the size of an obtuse angle. c How would you measure a reflex angle with a circular protractor? C D E F A B 130° C A D 80 70 60 5 0 4 0 3 0 20 10 0 100 110 120 130 140 1 5 0 1 6 0 1 7 0 1 8 0 90 80 70 60 50 40 3 0 2 0 1 0 0 100 110 120 1 3 0 1 4 0 1 5 0 160 170 1 8 0 B x Use the protractor to measure the other piece of the angle DBC (marked x). Add this to 180° to find angle ABC. 180° + 130° = 310° ∴ ABC = 310° e s s - R e v i e w C o p y - C a m b r i d g e U n i v e r s i t y P r e s s - R e v i e w C o p y R e v i e w C o p y - C a m b r i d g e U n i v e r s i t y P r e s s - R e v i e w C o p y R e v i e w C o p y - C a m b r i d g e U n i v e r s i t y P r e s s - R e v i e w C o p y R e v i e w C o p y - C a m b r i d g e U n i v e r s i t y Copyright Material - Review Only - Not for Redistribution
- 60. Unit 1: Shape, space and measures Cambridge IGCSE Mathematics 50 To draw a reflex angle, you could also work out the size of the inner angle and simply draw that. 360° − 195° = 165°. If you do this, remember to mark the reflex angle on your sketch and not the inner angle! Worked example 2 Draw a angle ABC = 76° and b angle XYZ = 195°. a B Use a ruler to draw a line to represent one arm of the angle, make sure the line extends beyond the protractor. Mark the vertex (B). B 180 1 7 0 1 6 0 1 5 0 1 4 0 130 120 110 100 90 80 70 60 50 4 0 3 0 2 0 1 0 1 7 0 1 6 0 1 5 0 1 4 0 130120110100 80 70 60 50 4 0 3 0 2 0 1 0 0 0 76° 180 Place your protractor on the line with the centre at the vertex. Measure the size of the angle you wish to draw and mark a small point. B C A 76° Remove the protractor and use a ruler to draw a line from the vertex through the point. Label the angle correctly. b X Y For a reflex angle, draw a line as in (a) but mark one arm (X) as well as the vertex (Y). The arm should extend beyond the vertex to create a 180° angle. X Y 8 0 7 0 6 0 5 0 4 0 3 0 2 0 1 0 0 1 0 0 1 1 0 1 2 0 1 3 0 1 4 0 1 5 0 1 6 0 1 7 0 180 90 8 0 7 0 6 0 5 0 4 0 3 0 2 0 1 0 0 1 0 0 1 1 0 1 2 0 1 3 0 1 4 0 1 5 0 1 6 0 1 7 0 180 Calculate the size of the rest the angle: 195° − 180° = 15°. Measure and mark the 15° angle (on either side of the 180° line). X Y 195° Z Remove the protractor and use a ruler to draw a line from the vertex through the third point. Label the angle correctly. Exercise 3.2 Use a ruler and a protractor to accurately draw the following angles: a ABC = 80° b PQR = 30° c XYZ = 135° d EFG = 90° e KLM = 210° f JKL = 355° Drawing angles It is fairly easy to draw an angle of a given size if you have a ruler, a protractor and a sharp pencil. Work through this example to remind yourself how to draw angles 180° and 180°. e s s - R e v i e w C o p y - C a m b r i d g e U n i v e r s i t y P r e s s - R e v i e w C o p y R e v i e w C o p y - C a m b r i d g e U n i v e r s i t y P r e s s - R e v i e w C o p y R e v i e w C o p y - C a m b r i d g e U n i v e r s i t y P r e s s - R e v i e w C o p y R e v i e w C o p y - C a m b r i d g e U n i v e r s i t y Copyright Material - Review Only - Not for Redistribution
- 61. Unit 1: Shape, space and measures 51 3 Lines, angles and shapes Angle relationships Make sure you know the following angle facts: Complementary angles Angles in a right angle add up to 90°. When the sum of two angles is 90° those two angles are complementary angles. a + b = 90° x + y = 90° a b x y Supplementary angles Angles on a straight line add up to 180°. When the sum of two angles is 180° those two angles are supplementary angles. a a + b = 180° b x + (180° – x) = 180° 180° – x x Angles round a point Angles at a point make a complete revolution. The sum of the angles at a point is 360°. 360° O a b c a + b + c = 360° a b c a + b + c + d + e = 360° d e Vertically opposite angles When two lines intersect, two pairs of vertically opposite angles are formed. Vertically opposite angles are equal in size. Two pairs of vertically opposite angles. x x y y x x y y The angles marked x are equal to each other. The angles marked y are also equal to each other. x + y = 180° Tip In general terms: for complementary angles, if one angle is x°, the other must be 90° − x° and vice versa. For supplementary angles, if one angle is x°, the other must be 180° − x° and vice versa. The adjacent angle pairs in vertically opposite angles form pairs of supplementary angles because they are also angles on a straight line. e s s - R e v i e w C o p y - C a m b r i d g e U n i v e r s i t y P r e s s - R e v i e w C o p y R e v i e w C o p y - C a m b r i d g e U n i v e r s i t y P r e s s - R e v i e w C o p y R e v i e w C o p y - C a m b r i d g e U n i v e r s i t y P r e s s - R e v i e w C o p y R e v i e w C o p y - C a m b r i d g e U n i v e r s i t y Copyright Material - Review Only - Not for Redistribution
- 62. Unit 1: Shape, space and measures Cambridge IGCSE Mathematics 52 Using angle relationships to find unknown angles The relationships between angles can be used to work out the size of unknown angles. Follow these easy steps: • identify the relationship • make an equation • give reasons for statements • solve the equation to find the unknown value. Worked example 3 Find the size of the angle marked x in each of these figures. Give reasons. a 72° x A B C D a 72° + x = 90° (angle ABC = 90°, comp angles) x = 90° − 72° x = 18° You are told that angle ABC is a right angle, so you know that 72° and x are complementary angles. This means that 72° + x = 90°, so you can rearrange to make x the subject. b x E J K G F 48° b 48° + 90° + x = 180° (angles on line) x = 180° − 90° − 48° x = 42° You can see that 48°, the right angle and x are angles on a straight line. Angles on a straight line add up to 180°. So you can rearrange to make x the subject. c 60° x A B C O D 30° c x = 30° (vertically opposite angles) You know that when two lines intersect, the resulting vertically opposite angles are equal. x and 30° are vertically opposite, so x =30°. Exercise 3.3 1 In the following diagram, name: a a pair of complementary angles b a pair of equal angles c a pair of supplementary angles d the angles on line DG e the complement of angle EBF f the supplement of angle EBC. A D E F C G B In geometry problems you need to present your reasoning in a logical and structured way. You will usually be expected to give reasons when you are finding the size of an unknown angle. To do this, state the relationship that you used to find the unknown angle after your statements. You can use these abbreviations to give reasons: • comp angles • supp angles • angles on line • angles round point e s s - R e v i e w C o p y - C a m b r i d g e U n i v e r s i t y P r e s s - R e v i e w C o p y R e v i e w C o p y - C a m b r i d g e U n i v e r s i t y P r e s s - R e v i e w C o p y R e v i e w C o p y - C a m b r i d g e U n i v e r s i t y P r e s s - R e v i e w C o p y R e v i e w C o p y - C a m b r i d g e U n i v e r s i t y Copyright Material - Review Only - Not for Redistribution
- 63. Unit 1: Shape, space and measures 53 3 Lines, angles and shapes 2 In each diagram, find the value of the angles marked with a letter. a 112° x b 50° x c x 115° y d 57° 121° x y e x y 82° 82° z f 47° x z y g x 72° 51° h x 19° i 27° 142° x 3 Find the value of x in each of the following figures. a 5x x b 2x x 45° c 2x 4x x 150° 4 Two angles are supplementary. The first angle is twice the size of the second. What are their sizes? 5 One of the angles formed when two lines intersect is 127°. What are the sizes of the other three angles? Angles and parallel lines When two parallel lines are cut by a third line (the transversal) eight angles are formed. These angles form pairs which are related to each other in specific ways. Corresponding angles (‘F’-shape) When two parallel lines are cut by a transversal four pairs of corresponding angles are formed. Corresponding angles are equal to each other. g = h g h a b a = b d c = d c e = f e f Tip Although ‘F’, ‘Z’ and ‘C’ shapes help you to remember these properties, you must use the terms ‘corresponding’, ‘alternate’ and ‘co-interior’ to describe them when you answer a question. e s s - R e v i e w C o p y - C a m b r i d g e U n i v e r s i t y P r e s s - R e v i e w C o p y R e v i e w C o p y - C a m b r i d g e U n i v e r s i t y P r e s s - R e v i e w C o p y R e v i e w C o p y - C a m b r i d g e U n i v e r s i t y P r e s s - R e v i e w C o p y R e v i e w C o p y - C a m b r i d g e U n i v e r s i t y Copyright Material - Review Only - Not for Redistribution
- 64. Unit 1: Shape, space and measures Cambridge IGCSE Mathematics 54 Alternate angles (‘Z’-shape) When two parallel lines are cut by a transversal two pairs of alternate angles are formed. Alternate angles are equal to each other. l i j i = j k = l k Co-interior angles (‘C’-shape) When two parallel lines are cut by a transversal two pairs of co-interior angles are formed. Co-interior angles are supplementary (together they add up to 180°). n m + n = 180° p o + p = 180° o m These angle relationships around parallel lines, combined with the other angle relationships from earlier in the chapter, are very useful for solving unknown angles in geometry. Worked example 4 Find the size of angles a, b and c in this figure. 47° 62° a c b S T B A C a = 47°(CAB alt SBA) c = 62° (ACB alt CBT) a + b + c = 180° (s on line) ∴ b = 180° − 47° − 62° b = 71° CAB and SBA are alternate angles and therefore are equal in size. ACB and CBT are alternate angles and so equal in size. Angles on a straight line = 180°. You know the values of a and c, so can use these to find b. Co-interior angles will only be equal if the transversal is perpendicular to the parallel lines (when they will both be 90°). ‘Co-’ means together. Co-interior angles are found together on the same side of the transversal. You will use the angle relationships in this section again when you deal with triangles, quadrilaterals, polygons and circles. FAST FORWARD e s s - R e v i e w C o p y - C a m b r i d g e U n i v e r s i t y P r e s s - R e v i e w C o p y R e v i e w C o p y - C a m b r i d g e U n i v e r s i t y P r e s s - R e v i e w C o p y R e v i e w C o p y - C a m b r i d g e U n i v e r s i t y P r e s s - R e v i e w C o p y R e v i e w C o p y - C a m b r i d g e U n i v e r s i t y Copyright Material - Review Only - Not for Redistribution
- 65. Unit 1: Shape, space and measures 55 3 Lines, angles and shapes Exercise 3.4 1 Calculate the size of all angles marked with variables in the following diagrams. Give reasons. a 112° a b b 45° 105° x y z c 40° 72° e a b c d d 39° 39° a b e 110° 95° x y z f 60° 45° x y g x y z 60° 98° h x z y 65° 42° i 105° 40° d c e a b 2 Decide whether AB||DC in each of these examples. Give a reason for your answer. a 60° 60° A B D C b 108° 82° A B C D c 105° 75° A B C D 3.2 Triangles A triangle is a plane shape with three sides and three angles. Triangles are classified according to the lengths of their sides and the sizes of their angles (or both). Plane means flat. Plane shapes are flat or two-dimensional shapes. You will need these properties in chapter 11 on Pythagoras’ theorem and similar triangles, and in chapter 15 for trigonometry. FAST FORWARD Scalene triangle x y z Scalene triangles have no sides of equal length and no angles that are of equal sizes. Isosceles triangle x x Isosceles triangles have two sides of equal length. The angles at the bases of the equal sides are equal in size. e s s - R e v i e w C o p y - C a m b r i d g e U n i v e r s i t y P r e s s - R e v i e w C o p y R e v i e w C o p y - C a m b r i d g e U n i v e r s i t y P r e s s - R e v i e w C o p y R e v i e w C o p y - C a m b r i d g e U n i v e r s i t y P r e s s - R e v i e w C o p y R e v i e w C o p y - C a m b r i d g e U n i v e r s i t y Copyright Material - Review Only - Not for Redistribution
- 66. Unit 1: Shape, space and measures Cambridge IGCSE Mathematics 56 Angle properties of triangles Look at the diagram below carefully to see two important angle properties of triangles. a b c a b c a b c a + b = exterior straight line The diagram shows two things: • The three interior angles of a triangle add up to 180°. • Two interior angles of a triangle are equal to the opposite exterior angle. If you try this yourself with any triangle you will get the same results. But why is this so? Mathematicians cannot just show things to be true, they have to prove them using mathematical principles. Read through the following two simple proofs that use the properties of angles you already know, to show that angles in a triangle will always add up to 180° and that the exterior angle will always equal the sum of the opposite interior angles. Angles in a triangle add up to 180° To prove this you have to draw a line parallel to one side of the triangle. a b c a b c x y x + a + y = 180° (angles on a line) but: b = x and c = y (alternate angles are equal) so a + b + c = 180° The three angles inside a triangle are called interior angles. If you extend a side of a triangle you make another angle outside the triangle. Angles outside the triangle are called exterior angles. You don’t need to know these proofs, but you do need to remember the rules associated with them. Equilateral triangle 60° 60° 60° Equilateral triangles have three equal sides and three equal angles (each being 60°). Other triangles a b c A C B 90° A C B angle ABC 90° A B C Acute-angled triangles have three angles each 90°. Right-angled triangles have one angle = 90°. Obtuse-angled triangles have one angle 90°. e s s - R e v i e w C o p y - C a m b r i d g e U n i v e r s i t y P r e s s - R e v i e w C o p y R e v i e w C o p y - C a m b r i d g e U n i v e r s i t y P r e s s - R e v i e w C o p y R e v i e w C o p y - C a m b r i d g e U n i v e r s i t y P r e s s - R e v i e w C o p y R e v i e w C o p y - C a m b r i d g e U n i v e r s i t y Copyright Material - Review Only - Not for Redistribution
- 67. Unit 1: Shape, space and measures 57 3 Lines, angles and shapes The exterior angle is equal to the sum of the opposite interior angles a b c x c + x = 180° (angles on a line) so, c = 180° − x a + b + c = 180° (angle sum of triangle) c = 180° − (a + b) so, 180° − (a + b) = 180° − x hence, a + b = x These two properties allow us to find the missing angles in triangles and other diagrams involving triangles. Worked example 5 Worked example 5 Find the value of the unknown angles in each triangle. Give reasons for your answers. a 30° 82° x a 82° + 30° + x = 180° x x = ° − ° − ° = ° 180 = ° 180 = ° 82 − ° 82 − ° 30 − ° 30 − ° 68 = ° 68 = ° (angle sum of triangle) b x x b 2x + 90° = 180° 180 90 2 90 45 x 2 9 2 9 x = ° 180 = ° − ° 90 − ° = ° 2 9 = ° 2 90 = ° = ° 45 = ° (angle sum of triangle) c 70° 35° x y z c 70° + 35° + x = 180° x = ° − ° − ° = ° 180 = ° 180 = ° 70 − ° 70 − ° 35 − ° 35 − ° 75 = ° 75 = ° (angle sum of triangle) y = 75° (corresponding angles) 70° + y + z = 180° 70° + 75° + z = 180° z z = ° − ° − ° = ° 180 = ° 180 = ° 75 − ° 75 − ° 70 − ° 70 − ° 35 = ° 35 = ° (angle sum of triangle) or z = 35° (corresponding angles) Some of the algebraic processes used here are examples of the solutions to linear equations. You’ve done this before, but it is covered in more detail in chapter 14. FAST FORWARD Many questions on trigonometry require you to make calculations like these before you can move on to solve the problem. FAST FORWARD e s s - R e v i e w C o p y - C a m b r i d g e U n i v e r s i t y P r e s s - R e v i e w C o p y R e v i e w C o p y - C a m b r i d g e U n i v e r s i t y P r e s s - R e v i e w C o p y R e v i e w C o p y - C a m b r i d g e U n i v e r s i t y P r e s s - R e v i e w C o p y R e v i e w C o p y - C a m b r i d g e U n i v e r s i t y Copyright Material - Review Only - Not for Redistribution
- 68. Unit 1: Shape, space and measures Cambridge IGCSE Mathematics 58 The examples above are fairly simple so you can see which rule applies. In most cases, you will be expected to apply these rules to find angles in more complicated diagrams. You will need to work out what the angle relationships are and combine them to find the solution. The exterior angle of one triangle may be inside another triangle as in worked example 6, part (c). Worked example 7 Find the size of angle x. x 50° A B D C E Angle ACB = 50° (base angles isos triangle ABC) ∴ CAB = 180° − 50° − 50° CAB = 80° (angle sum triangle ABC) Angle ACD = 50° (alt angles) ∴ ADC = 80° ∴ x = 180° − 80° − 80° x = 20° (base angles isos triangle ADC) (angle sum triangle ADC) An isosceles triangle has two sides and two angles equal, so if you know that the triangle is isosceles you can mark the two angles at the bases of the equal sides as equal. REWIND Worked example 6 Find the size of angles x, y and z. a 60° 80° x a x = 60° + 80° x = 140° (exterior angle of triangle) b y 70° 125° b y + 70° = 125° y y = ° − ° = ° 125 = ° 125 = ° 70 − ° 70 − ° 55 = ° 55 = ° (exterior angle of triangle) c 40° 40° 110° z A D C B c 40° + z = 110° z z = ° − ° = ° 110 = ° 110 = ° 40 − ° 40 − ° 70 = ° 70 = ° (exterior angle triangle ABC) e s s - R e v i e w C o p y - C a m b r i d g e U n i v e r s i t y P r e s s - R e v i e w C o p y R e v i e w C o p y - C a m b r i d g e U n i v e r s i t y P r e s s - R e v i e w C o p y R e v i e w C o p y - C a m b r i d g e U n i v e r s i t y P r e s s - R e v i e w C o p y R e v i e w C o p y - C a m b r i d g e U n i v e r s i t y Copyright Material - Review Only - Not for Redistribution
- 69. Unit 1: Shape, space and measures 59 3 Lines, angles and shapes Exercise 3.5 1 Find the size of the marked angles. Give reasons. a A B C x 57° 69° b 48° x M N O c 40° 25° A C B D x y z 2 Calculate the value of x in each case. Give reasons. a x x 120° A B C D b 2x 4x 86° 3 What is the size of the angle marked x in these figures? Show all steps and give reasons. a X A B C Y 105° 95° x b A C B D E 56° 68° x c 68° 59° A C B D E x d A B D C 58° x e A B N C M 60° 35° x f A B C 295° x 3.3 Quadrilaterals Quadrilaterals are plane shapes with four sides and four interior angles. Quadrilaterals are given special names according to their properties. Type of quadrilateral Examples Summary of properties Parallelogram a a = c b = d b d c Opposite sides parallel and equal. Opposite angles are equal. Diagonals bisect each other. Rectangle Opposite sides parallel and equal. All angles = 90°. Diagonals are equal. Diagonals bisect each other. Square All sides equal. All angles = 90°. Diagonals equal. Diagonals bisect each other at 90°. Diagonals bisect angles. Some of these shapes are actually ‘special cases’ of others. For example, a square is also a rectangle because opposite sides are equal and parallel and all angles are 90°. Similarly, any rhombus is also a parallelogram. In both of these examples the converse is not true! A rectangle is not also a square. Which other special cases can you think of? e s s - R e v i e w C o p y - C a m b r i d g e U n i v e r s i t y P r e s s - R e v i e w C o p y R e v i e w C o p y - C a m b r i d g e U n i v e r s i t y P r e s s - R e v i e w C o p y R e v i e w C o p y - C a m b r i d g e U n i v e r s i t y P r e s s - R e v i e w C o p y R e v i e w C o p y - C a m b r i d g e U n i v e r s i t y Copyright Material - Review Only - Not for Redistribution
- 70. Unit 1: Shape, space and measures Cambridge IGCSE Mathematics 60 Type of quadrilateral Examples Summary of properties Rhombus a b c d a = c b = d All sides equal in length. Opposite sides parallel. Opposite angles equal. Diagonals bisect each other at 90°. Diagonals bisect angles. Trapezium One pair of sides parallel. Kite a = b a b c d c = d Two pairs of adjacent sides equal. One pair of opposite angles is equal. Diagonals intersect at 90°. Diagonals bisect angles. The angle sum of a quadrilateral All quadrilaterals can be divided into two triangles by drawing one diagonal. You already know that the angle sum of a triangle is 180°. Therefore, the angle sum of a quadrilateral is 180° + 180° = 360°. This is an important property and we can use it together with the other properties of quadrilaterals to find the size of unknown angles. 180° 180° 180° 180° 180° 180° Worked example 8 Find the size of the marked angles in each of these figures. a Parallelogram x y z 70° A B D C a x = 110° y = 70° z = 110° (co-interior angles) (opposite angles of || gram) (opposite angles of || gram) b Rectangle x y P Q R S 65° b x + 65° = 90° ∴ = ° − ° = ° x x 90 = ° 90 = ° 65 − ° 65 − ° 25 = ° 25 = ° y = 65° (right angle of rectangle) (alt angles) c Quadrilateral x 80° 70° 145° K X L M N Y c LKN LK LK LKN LK LK = ° − ° − ° − ° = ° 36 = ° 36 = ° 145 − ° 145 − ° 8 − ° − ° 65 = ° 65 = ° 0 0 = ° 0 0 = ° − ° 0 0 − ° 7 0 0 − ° − ° 0 0 0 − ° − ° ∴ = ° KXY 65 = ° 65 = ° ∴ = ° − ° − ° = ° x ∴ = ∴ = x 180 65 65 50 = ° 50 = ° (angle sum of quad) (base angles isos triangle) (angle sum triangle KXY) e s s - R e v i e w C o p y - C a m b r i d g e U n i v e r s i t y P r e s s - R e v i e w C o p y R e v i e w C o p y - C a m b r i d g e U n i v e r s i t y P r e s s - R e v i e w C o p y R e v i e w C o p y - C a m b r i d g e U n i v e r s i t y P r e s s - R e v i e w C o p y R e v i e w C o p y - C a m b r i d g e U n i v e r s i t y Copyright Material - Review Only - Not for Redistribution
- 71. Unit 1: Shape, space and measures 61 3 Lines, angles and shapes Exercise 3.6 1 A quadrilateral has two diagonals that intersect at right angles. a What quadrilaterals could it be? b The diagonals are not equal in length. What quadrilaterals could it NOT be? 2 Find the value of x in each of these figures. Give reasons. a P Q R S x 112° b ABCD is a rectangle A B C D 62° x c 110° 110° x x P Q R S d 110° 92° 98° x L M N Q e x 3x 4x 2x D E F G f 110° 50° x A B C D 3 Find the value of x in each of these figures. Give reasons. a 70° 55° M P Q R S x b P Q M R N QP = RN 98° x c P Q R S 70° x 3.4 Polygons A polygon is a plane shape with three or more straight sides. Triangles are polygons with three sides and quadrilaterals are polygons with four sides. Other polygons can also be named according to the number of sides they have. Make sure you know the names of these polygons: heptagon pentagon hexagon octagon nonagon decagon A polygon with all its sides and all its angles equal is called a regular polygon. You may need to find some other unknown angles before you can find x. If you do this, write down the size of the angle that you have found and give a reason. If a polygon has any reflex angles, it is called a concave polygon. All other polygons are convex polygons. e s s - R e v i e w C o p y - C a m b r i d g e U n i v e r s i t y P r e s s - R e v i e w C o p y R e v i e w C o p y - C a m b r i d g e U n i v e r s i t y P r e s s - R e v i e w C o p y R e v i e w C o p y - C a m b r i d g e U n i v e r s i t y P r e s s - R e v i e w C o p y R e v i e w C o p y - C a m b r i d g e U n i v e r s i t y Copyright Material - Review Only - Not for Redistribution
- 72. Unit 1: Shape, space and measures Cambridge IGCSE Mathematics 62 Angle sum of a polygon By dividing polygons into triangles, we can work out the sum of their interior angles. Can you see the pattern that is forming here? The number of triangles you can divide the polygon into is always two less than the number of sides. If the number of sides is n, then the number of triangles in the polygon is (n − 2). The angle sum of the polygon is 180° × the number of triangles. So for any polygon, the angle sum can be worked out using the formula: sum of interior angles = (n − 2) × 180° Worked example 9 Find the angle sum of a decagon and state the size of each interior angle if the decagon is regular. sum of interior angles = (n − 2) × 180° Sum of angles = − × ° = ° ( ) = − ( ) = − ( ) 10 ( ) = − ( ) 10 = − ( ) ( ) ( ) 180 × ° 180 × ° 1440 = ° 1440 = ° A decagon has 10 sides, so n = 10. = 1440 10 A regular decagon has 10 equal angles. = 144° Size of one angle The sum of exterior angles of a convex polygon The sum of the exterior angles of a convex polygon is always 360°, no matter how many sides it has. Read carefully through the information about a hexagon that follows, to understand why this is true for every polygon. Worked example 10 A polygon has an angle sum of 2340°. How many sides does it have? 2340° = (n − 2) × 180° Put values into angle sum formula. 2340 180 2 13 2 13 2 15 = − = − + = 2 + = ∴ = 15 ∴ = n = − = − n = − = − n n Rearrange the formula to get n. So the polygon has 15 sides. e s s - R e v i e w C o p y - C a m b r i d g e U n i v e r s i t y P r e s s - R e v i e w C o p y R e v i e w C o p y - C a m b r i d g e U n i v e r s i t y P r e s s - R e v i e w C o p y R e v i e w C o p y - C a m b r i d g e U n i v e r s i t y P r e s s - R e v i e w C o p y R e v i e w C o p y - C a m b r i d g e U n i v e r s i t y Copyright Material - Review Only - Not for Redistribution
- 73. Unit 1: Shape, space and measures 63 3 Lines, angles and shapes A hexagon has six interior angles. The angle sum of the interior angles = − × ° = × ° = ° ( ) = − ( ) = − ( ) ( ) = − ( ) = − ( ) ( ) ( ) 180 × ° 180 × ° 4 = × = ×180 720 = ° 720 = ° If you extend each side you make six exterior angles; one next to each interior angle. Each pair of interior and exterior angles adds up to 180° (angles on line). There are six vertices, so there are six pairs of interior and exterior angles that add up to 180°. ∴ sum of (interior + exterior angles) = 180 × 6 = 1080° But, sum of interior angles = (n − 2) × 180 = 4 × 180 = 720° So, 720° + sum of exterior angles = 1080 sum of exterior angles = 1080 − 720 sum of exterior angles = 360° This can be expressed as a general rule like this: If I = sum of the interior angles, E = sum of the exterior angles and n = number of sides of the polygon I E n E n I I n E n E n + = I E + = I E = − E n = − E n I n = − I n × = − E n = − E n − × = − E n = − E n 180 E n 180 E n E n = − 180 E n = − 180 E n 180 E n E n = − 180 E n = − 180 E n 180 E n E n = − 180 E n = −18 but so ( ) I n ( ) I n = − ( ) I n = − ( ) I n = −2 ( ) ( ) n ( ) − × ( ) − × 2 ( ) − × − × ( ) 0 0 360 360 n E + = ° 360 = ° Exercise 3.7 1 Copy and complete this table. Number of sides in the polygon 5 6 7 8 9 10 12 20 Angle sum of interior angles 2 Find the size of one interior angle for each of the following regular polygons. a pentagon b hexagon c octagon d decagon e dodecagon (12 sides) f a 25-sided polygon You do not have to remember this proof, but you must remember that the sum of the exterior angles of any convex polygon is 360°. Tip A regular polygon has all sides equal and all angles equal. An irregular polygon does not have all equal sides and angles. e s s - R e v i e w C o p y - C a m b r i d g e U n i v e r s i t y P r e s s - R e v i e w C o p y R e v i e w C o p y - C a m b r i d g e U n i v e r s i t y P r e s s - R e v i e w C o p y R e v i e w C o p y - C a m b r i d g e U n i v e r s i t y P r e s s - R e v i e w C o p y R e v i e w C o p y - C a m b r i d g e U n i v e r s i t y Copyright Material - Review Only - Not for Redistribution
- 74. Unit 1: Shape, space and measures Cambridge IGCSE Mathematics 64 3 A regular polygon has 15 sides. Find: a the sum of the interior angles b the sum of the exterior angles c the size of each interior angle d the size of each exterior angle. 4 A regular polygon has n exterior angles of 15°. How many sides does it have? 5 Find the value of x in each of these irregular polygons. a x x b 140° 170° 130° 130° 120° 100° x c 2x 2x 72° 3.5 Circles In mathematics, a circle is defined as a set of points which are all the same distance from a given fixed point. In other words, every point on the outside curved line around a circle is the same distance from the centre of the circle. There are many mathematical terms used to talk about circles. Study the following diagrams carefully and then work through exercise 3.8 to make sure you know and can use the terms correctly. Parts of a circle circumference O is the centre r a d i u s diameter O major sector minor sector radius minor arc m ajor arc major segment minor segment chord semi-circle semi-circle O x angle at the circumference A B AB is a minor arc and angle x is subtended by arc AB The angle x is subtended at the circumference. This means that it is the angle formed by two chords passing through the end points of the arc and meeting again at the edge of the circle. The rule for the sum of interior angles, and for the sum of exterior angles is true for both regular and irregular polygons. But with irregular polygons, you can’t simply divide the sum of the interior angles by the number of sides to find the size of an interior angle: all interior angles may be different. E e s s - R e v i e w C o p y - C a m b r i d g e U n i v e r s i t y P r e s s - R e v i e w C o p y R e v i e w C o p y - C a m b r i d g e U n i v e r s i t y P r e s s - R e v i e w C o p y R e v i e w C o p y - C a m b r i d g e U n i v e r s i t y P r e s s - R e v i e w C o p y R e v i e w C o p y - C a m b r i d g e U n i v e r s i t y Copyright Material - Review Only - Not for Redistribution
- 75. Unit 1: Shape, space and measures 65 3 Lines, angles and shapes Exercise 3.8 1 Name the features shown in blue on these circles. a b c d e f 2 Draw four small circles. Use shading to show: a a semi-circle b a minor segment c a tangent to the circle d angle y subtended by a minor arc MN. 3 Circle 1 and circle 2 have the same centre (O). Use the correct terms or letters to copy and complete each statement. A B D O E C F circle 1 circle 2 a OB is a __ of circle 2. b DE is the __ of circle 1. c AC is a __ of circle 2. d __ is a radius of circle 1. e CAB is a __ of circle 2. f Angle FOD is the vertex of a __ of circle 1 and circle 2. 3.6 Construction In geometry, constructions are accurate geometrical drawings. You use mathematical instruments to construct geometrical drawings. Using a ruler and a pair of compasses Your ruler (sometimes called a straight-edge) and a pair of compasses are probably your most useful construction tools. You use the ruler to draw straight lines and the pair of compasses to measure and mark lengths, draw circles and bisect angles and lines. You will learn more about circles and the angle properties in circles when you deal with circle symmetry and circle theorems in chapter 19. FAST FORWARD It is important that you use a sharp pencil and that your pair of compasses are not loose. The photograph shows you the basic equipment that you are expected to use. e s s - R e v i e w C o p y - C a m b r i d g e U n i v e r s i t y P r e s s - R e v i e w C o p y R e v i e w C o p y - C a m b r i d g e U n i v e r s i t y P r e s s - R e v i e w C o p y R e v i e w C o p y - C a m b r i d g e U n i v e r s i t y P r e s s - R e v i e w C o p y R e v i e w C o p y - C a m b r i d g e U n i v e r s i t y Copyright Material - Review Only - Not for Redistribution
- 76. Unit 1: Shape, space and measures Cambridge IGCSE Mathematics 66 Do you remember how to use a pair of compasses to mark a given length? Here is an example showing you how to construct line AB that is 4.5cm long. (Diagrams below are NOT TO SCALE.) • Use a ruler and sharp pencil to draw a straight line that is longer than the length you need. Mark point A on the line with a short vertical dash (or a dot). A • Open your pair of compasses to 4.5cm by measuring against a ruler. 1 2 3 4 5 1 2 3 4 5 • Put the point of the pair of compasses on point A. Twist the pair of compasses lightly to draw a short arc on the line at 4.5cm. Mark this as point B. You have now drawn the line AB at 4.5 cm long. A B Constructing triangles You can draw a triangle if you know the length of three sides. Read through the worked example carefully to see how to construct a triangle given three sides. Once you can use a ruler and pair of compasses to measure and draw lines, you can easily construct triangles and other geometric shapes. Worked example 11 Construct ∆ABC with AB = 5cm, BC = 6cm and CA = 4cm. A B C 4 5 6 Always start with a rough sketch. B C 6 cm Draw the longest side (BC = 6cm) and label it. B C 6 cm Set your pair of compasses at 5cm. Place the point on B and draw an arc. It is a good idea to draw the line longer than you need it and then measure the correct length along it. When constructing a shape, it can help to mark points with a thin line to make it easier to place the point of the pair of compasses. e s s - R e v i e w C o p y - C a m b r i d g e U n i v e r s i t y P r e s s - R e v i e w C o p y R e v i e w C o p y - C a m b r i d g e U n i v e r s i t y P r e s s - R e v i e w C o p y R e v i e w C o p y - C a m b r i d g e U n i v e r s i t y P r e s s - R e v i e w C o p y R e v i e w C o p y - C a m b r i d g e U n i v e r s i t y Copyright Material - Review Only - Not for Redistribution
- 77. Unit 1: Shape, space and measures 67 3 Lines, angles and shapes B C 6 cm Set your pair of compasses at 4cm. Place the point on C and draw an arc. A B C 4 cm 5 cm 6 cm The point where the arcs cross is A. Join BA and CA. Please note that the diagrams here are NOT TO SCALE but your diagrams must use the accurate measurements! Exercise 3.9 1 Construct these lines. a AB = 6cm b CD = 75mm c EF = 5.5cm 2 Accurately construct these triangles. a A C B 2.4 cm 1.7 cm 3.2 cm b 5 cm 5 cm 4 cm D E F c G H I 8 cm 4 cm 5 cm 25° 3 Construct these triangles. a ∆ABC with BC = 8.5cm, AB = 7.2cm and AC = 6.9cm. b ∆XYZ with YZ = 86mm, XY = 120mm and XZ = 66mm. c Equilateral triangle DEF with sides of 6.5cm. d Isosceles triangle PQR with a base of 4cm and PQ = PR = 6.5cm. Exercise 3.10 1 Draw a large circle. Draw any two chords in the same circle, but make sure that they are not parallel. Now construct the perpendicular bisector of each chord. What do you notice about the point at which the perpendicular bisectors meet? Can you explain this? E e s s - R e v i e w C o p y - C a m b r i d g e U n i v e r s i t y P r e s s - R e v i e w C o p y R e v i e w C o p y - C a m b r i d g e U n i v e r s i t y P r e s s - R e v i e w C o p y R e v i e w C o p y - C a m b r i d g e U n i v e r s i t y P r e s s - R e v i e w C o p y R e v i e w C o p y - C a m b r i d g e U n i v e r s i t y Copyright Material - Review Only - Not for Redistribution
- 78. Unit 1: Shape, space and measures Cambridge IGCSE Mathematics 68 Summary Do you know the following? • A point is position and a line is the shortest distance between two points. • Parallel lines are equidistant along their length. • Perpendicular lines meet at right angles. • Acute angles are 90°, right angles are exactly 90°, obtuse angles are 90° but 180°. Straight angles are exactly 180°. Reflex angles are 180° but 360°. A complete revolution is 360°. • Scalene triangles have no equal sides, isosceles triangles have two equal sides and a pair of equal angles, and equilateral triangles have three equal sides and three equal angles. • Complementary angles have a sum of 90°. Supplementary angles have a sum of 180°. • Angles on a line have a sum of 180°. • Angles round a point have a sum of 360°. • Vertically opposite angles are formed when two lines intersect. Vertically opposite angles are equal. • When a transversal cuts two parallel lines various angle pairs are formed. Corresponding angles are equal. Alternate angles are equal. Co-interior angles are supplementary. • The angle sum of a triangle is 180°. • The exterior angle of a triangle is equal to the sum of the two opposite interior angles. • Quadrilaterals can be classified as parallelograms, rectangles, squares, rhombuses, trapeziums or kites according to their properties. • The angle sum of a quadrilateral is 360°. • Polygons are many-sided plane shapes. Polygons can be named according to the number of sides they have: e.g. pentagon (5); hexagon (6); octagon (8); and decagon (10). • Regular polygons have equal sides and equal angles. • Irregular polygons have unequal sides and unequal angles. • The angle sum of a polygon is (n − 2) × 180°, where n is the number of sides. • The angle sum of exterior angles of any convex polygon is 360°. Are you able to … ? • calculate unknown angles on a line and round a point • calculate unknown angles using vertically opposite angles and the angle relationships associated with parallel lines • calculate unknown angles using the angle properties of triangles, quadrilaterals and polygons • accurately measure and construct lines and angles • construct a triangle using given measurements E e s s - R e v i e w C o p y - C a m b r i d g e U n i v e r s i t y P r e s s - R e v i e w C o p y R e v i e w C o p y - C a m b r i d g e U n i v e r s i t y P r e s s - R e v i e w C o p y R e v i e w C o p y - C a m b r i d g e U n i v e r s i t y P r e s s - R e v i e w C o p y R e v i e w C o p y - C a m b r i d g e U n i v e r s i t y Copyright Material - Review Only - Not for Redistribution
- 79. 69 Unit 1: Shape, space and measures Examination practice Exam-style questions 1 Find x in each figure. Give reasons. a A B C D 81° x H E F G b 65° x M P U Q N S T R c 30° x B D C A d x 112° M N Q P S R e 110° x A B C D E f 35° x M R N Q P 2 Study the triangle. x y a Explain why x + y = 90°. b Find y if x = 37°. 3 What is the sum of interior angles of a regular hexagon? 4 a What is the sum of exterior angles of a convex polygon with 15 sides? b What is the size of each exterior angle in this polygon? c If the polygon is regular, what is the size of each interior angle? 5 Explain why x = y in the following figures. a x 2 x 2 y D A B C b y x M N P Q S R U T e s s - R e v i e w C o p y - C a m b r i d g e U n i v e r s i t y P r e s s - R e v i e w C o p y R e v i e w C o p y - C a m b r i d g e U n i v e r s i t y P r e s s - R e v i e w C o p y R e v i e w C o p y - C a m b r i d g e U n i v e r s i t y P r e s s - R e v i e w C o p y R e v i e w C o p y - C a m b r i d g e U n i v e r s i t y Copyright Material - Review Only - Not for Redistribution
- 80. Unit 1: Shape, space and measures 70 6 a Measure this line and construct AB the same length in your book using a ruler and compasses. A B b At point A, measure and draw angle BAC, a 75° angle. c At point B, measure and draw angle ABD, an angle of 125°. 7 a Construct triangle PQR with sides PQ = 4.5cm, QR = 5cm and PR = 7cm. Past paper questions 1 A regular polygon has an interior angle of 172°. Find the number of sides of this polygon. [3] [Cambridge IGCSE Mathematics 0580 Paper 22 Q9 May/June 2016] 2 a x° 47° NOT TO SCALE Find the value of x. [1] b 115° 97° y° 85° NOT TO SCALE Find the value of y. [1] [Cambridge IGCSE Mathematics 0580 Paper 22 Q18 Parts a) and b) February/March 2016] E e s s - R e v i e w C o p y - C a m b r i d g e U n i v e r s i t y P r e s s - R e v i e w C o p y R e v i e w C o p y - C a m b r i d g e U n i v e r s i t y P r e s s - R e v i e w C o p y R e v i e w C o p y - C a m b r i d g e U n i v e r s i t y P r e s s - R e v i e w C o p y R e v i e w C o p y - C a m b r i d g e U n i v e r s i t y Copyright Material - Review Only - Not for Redistribution
- 81. Unit 1: Data handling 71 Chapter 4: Collecting, organising and displaying data • Data • Categorical data • Qualitative • Numerical data • Quantitative • Discrete • Continuous • Primary data • Secondary data • Frequency table • Grouped • Stem and leaf diagram • Two-way table • Pictogram • Bar graph • Pie chart • Line graph Key words People collect information for many different reasons. We collect information to answer questions, make decisions, predict what will happen in the future, compare ourselves with others and understand how things affect our lives. A scientist might collect information from experiments or tests to find out how well a new drug is working. A businesswoman might collect data from business surveys to find out how well her business is performing. A teacher might collect test scores to see how well his students perform in an examination and an individual might collect data from magazines or the internet to decide which brand of shoes, jeans, make-up or car to buy. The branch of mathematics that deals with collecting data is called statistics. At this level, you will focus on asking questions and then collecting information and organising or displaying it so that you can answer questions. This person is collecting information to find out whether people in his village know what government aid is available to them. In this chapter you will learn how to: • collect data and classify different types of data • organise data using tally tables, frequency tables, stem and leaf diagrams and two-way tables • draw pictograms, bar graphs, and pie charts to display data and answer questions about it. e s s - R e v i e w C o p y - C a m b r i d g e U n i v e r s i t y P r e s s - R e v i e w C o p y R e v i e w C o p y - C a m b r i d g e U n i v e r s i t y P r e s s - R e v i e w C o p y R e v i e w C o p y - C a m b r i d g e U n i v e r s i t y P r e s s - R e v i e w C o p y R e v i e w C o p y - C a m b r i d g e U n i v e r s i t y Copyright Material - Review Only - Not for Redistribution
- 82. Unit 1: Data handling Cambridge IGCSE Mathematics 72 RECAP You should already be familiar with the following concepts from working with data: Types of data and methods of collecting data • Primary data – collected by the person doing the investigation. • Secondary data – collected and stored by someone else (and accessed for an investigation). • Data can be collected by experiment, measurement, observation or carrying out a survey. Ways of organising and displaying data Score 1 2 3 4 5 6 Frequency 3 4 3 5 2 3 Frequency table (ungrouped data) Amount spent ($) Frequency 0 – 9.99 34 10 – 10.99 12 20 – 19.99 16 30 – 29.99 9 Frequency table (grouped data) Key = 4 Medals China Russia Great Britain Germany United States Pictogram – used mostly for visual appeal and effect 10 20 30 40 50 60 70 80 90 100 110 120 130 Germany Russia China Great Britain United States Read the number of medals from the scale Bar charts – useful for discrete data in categories Number of data in that group, not individual values. Class intervals are equal and should not overlap. e s s - R e v i e w C o p y - C a m b r i d g e U n i v e r s i t y P r e s s - R e v i e w C o p y R e v i e w C o p y - C a m b r i d g e U n i v e r s i t y P r e s s - R e v i e w C o p y R e v i e w C o p y - C a m b r i d g e U n i v e r s i t y P r e s s - R e v i e w C o p y R e v i e w C o p y - C a m b r i d g e U n i v e r s i t y Copyright Material - Review Only - Not for Redistribution
- 83. Unit 1: Data handling 73 4 Collecting, organising and displaying data RECAP Asia Europe North America Africa Oceania South America Gold Medals by Continent 135 77 61 11 6 12 Pie charts – useful for comparing categories in the data set 130 Medal achievements of most successful countries in Summer Olympics from 2000 to 2016 (Total medals) 120 110 100 90 80 70 60 50 40 Number of total medals 30 20 10 0 2000 2004 2008 2012 United States (USA) China (CHN) Great Britain (GBR) Russia (RUS) Germany (GER) 2016 Line sloping up shows increase Line sloping down shows decrease Line graphs – useful for numerical data that shows changes over time Graphs can be misleading. When you look at a graph think about: • The scale. The frequency axis should start at 0, it should not be exaggerated and it should be clearly labelled. Intervals between numbers should be the same. • How it is drawn. Bars or sections of a pie chart that are 3-dimensional can make some parts look bigger than others and give the wrong impression of the data. e s s - R e v i e w C o p y - C a m b r i d g e U n i v e r s i t y P r e s s - R e v i e w C o p y R e v i e w C o p y - C a m b r i d g e U n i v e r s i t y P r e s s - R e v i e w C o p y R e v i e w C o p y - C a m b r i d g e U n i v e r s i t y P r e s s - R e v i e w C o p y R e v i e w C o p y - C a m b r i d g e U n i v e r s i t y Copyright Material - Review Only - Not for Redistribution
- 84. Unit 1: Data handling Cambridge IGCSE Mathematics 74 4.1 Collecting and classifying data Data is a set of facts, numbers or other information. Statistics involves a process of collecting data and using it to try and answer a question. The flow diagram shows the four main steps involved in this process of statistical investigation: Identify the question (or problem to be solved) • Is the question clear and specific? Collect the data • What data will you need? • What methods will you use to collect it? Organise and display the data • How will you organise the data to make it easy to work with? • Can you draw a graph or chart to show the data clearly. • Can you summarise the data? • What trends are there in the data? • What conclusions can you draw from the data? • Does the data raise any new questions? Analyse and interpret the data • Are there any restrictions on drawing conclusions from the given data? Different types of data Answer these two questions: • Who is your favourite singer? • How many brothers and sisters do you have? Your answer to the first question will be the name of a person. Your answer to the second question will be a number. Both the name and the number are types of data. Categorical data is non-numerical data. It names or describes something without reference to number or size. Colours, names of people and places, yes and no answers, opinions and choices are all categorical. Categorical data is also called qualitative data. Data is actually the plural of the Latin word datum, but in modern English the word data is accepted and used as a singular form, so you can talk about a set of data, this data, two items of data or a lot of data. The information that is stored on a computer hard-drive or CD is also called data. In computer terms, data has nothing to do with statistics, it just means stored information. All of this work is very important in biology and psychology, where scientists need to present data to inform their conclusions. LINK e s s - R e v i e w C o p y - C a m b r i d g e U n i v e r s i t y P r e s s - R e v i e w C o p y R e v i e w C o p y - C a m b r i d g e U n i v e r s i t y P r e s s - R e v i e w C o p y R e v i e w C o p y - C a m b r i d g e U n i v e r s i t y P r e s s - R e v i e w C o p y R e v i e w C o p y - C a m b r i d g e U n i v e r s i t y Copyright Material - Review Only - Not for Redistribution
- 85. Unit 1: Data handling 75 4 Collecting, organising and displaying data Numerical data is data in number form. It can be an amount, a measurement, a time or a score. Numerical data is also called quantitative data (from the word quantity). Numerical data can be further divided into two groups: • discrete data – this is data that can only take certain values, for example, the number of children in a class, goals scored in a match or red cars passing a point. When you count things, you are collecting discrete data. • continuous data – this is data that could take any value between two given values, for example, the height of a person who is between 1.5m and 1.6m tall could be 1.5m, 1.57m, 1.5793m, 1.5793421m or any other value between 1.5m and 1.6m depending on the degree of accuracy used. Heights, masses, distances and temperatures are all examples of continuous data. Continuous data is normally collected by measuring. Methods of collecting data Data can be collected from primary sources by doing surveys or interviews, by asking people to complete questionnaires, by doing experiments or by counting and measuring. Data from primary sources is known as primary data. Data can also be collected from secondary sources. This involves using existing data to find the information you need. For example, if you use data from an internet site or even from these pages to help answer a question, to you this is a secondary source. Data from secondary sources is known as secondary data. Exercise 4.1 1 Copy this table into your book. Categorical data Numerical data Hair colour Number of brothers and sisters a Add five examples of categorical data and five examples of numerical data that could be collected about each student in your class. b Look at the numerical examples in your table. Circle the ones that will give discrete data. 2 State whether the following data would be discrete or continuous. a Mass of each animal in a herd. b Number of animals per household. c Time taken to travel to school. d Volume of water evaporating from a dam. e Number of correct answers in a spelling test. f Distance people travel to work. g Foot length of each student in a class. h Shoe size of each student in a class. i Head circumference of newborn babies. j Number of children per family. k Number of TV programmes watched in the last month. l Number of cars passing a zebra crossing per hour. 3 For each of the following questions state: i one method you could use to collect the data ii whether the source of the data is primary or secondary iii whether the data is categorical or numerical iv If the data is numerical, state whether it is discrete or continuous. a How many times will you get a six if you throw a dice 100 times? b Which is the most popular TV programme among your classmates? c What are the lengths of the ten longest rivers in the world? You will need to fully understand continuous data when you study histograms in chapter 20. FAST FORWARD One way to decide if data is continuous is to ask whether it is possible for the values to be fractions or decimals. If the answer is yes the data is usually continuous. But be careful: • age may seem to be discrete, because it is often given in full years, but it is actually continuous because we are getting older all the time • shoe sizes are discrete, even though you can get shoes in half sizes, because you cannot get shoes in size 7 1 4 or 7 3 4 or 7 8 9 . In 2016, a leading financial magazine listed data scientist as the best paying and most satisfying job for the foreseeable future. The use of computers in data collection and processing has meant that data collection, display and analysis have become more and more important to business and other organisations. LINK e s s - R e v i e w C o p y - C a m b r i d g e U n i v e r s i t y P r e s s - R e v i e w C o p y R e v i e w C o p y - C a m b r i d g e U n i v e r s i t y P r e s s - R e v i e w C o p y R e v i e w C o p y - C a m b r i d g e U n i v e r s i t y P r e s s - R e v i e w C o p y R e v i e w C o p y - C a m b r i d g e U n i v e r s i t y Copyright Material - Review Only - Not for Redistribution
- 86. Unit 1: Data handling Cambridge IGCSE Mathematics 76 d What is the favourite sport of students in your school? e How many books are taken out per week from the local library? f Is it more expensive to drive to work than to use public transport? g Is there a connection between shoe size and height? h What is the most popular colour of car? i What is the batting average of the national cricket team this season? j How many pieces of fruit do you eat in a week? 4.2 Organising data When you collect a large amount of data you need to organise it in some way so that it becomes easy to read and use. Tables (tally tables, frequency tables and two-way tables) are the most commonly used methods of organising data. Tally tables Tallies are little marks (////) that you use to keep a record of items you count. Each time you count five items you draw a line across the previous four tallies to make a group of five (////). Grouping tallies in fives makes it much easier to count and get a total when you need one. A tally table is used to keep a record when you are counting things. Look at this tally table. A student used this to record how many cars of each colour there were in a parking lot. He made a tally mark in the second column each time he counted a car of a particular colour. Colour Number of cars White //// //// /// Red //// //// //// //// / Black //// //// //// //// //// //// //// // Blue //// //// //// //// //// // Silver //// //// //// //// //// //// //// //// /// Green //// //// //// / (The totals for each car are shown after Exercise 4.2 on page 78.) You will use these methods and extend them in later chapters. Make sure that you understand them now. FAST FORWARD Worked example 1 Anita wanted to find out what people thought about pop-up adverts on their social media feeds. She did a survey of 100 people. Each person chose an answer A, B C or D. What do you think about this statement? Please choose one response. Advertising should be strictly controlled on social media. Pop-up adverts should be banned from all social media feeds. A I strongly agree B I agree C I disagree D I strongly disagree e s s - R e v i e w C o p y - C a m b r i d g e U n i v e r s i t y P r e s s - R e v i e w C o p y R e v i e w C o p y - C a m b r i d g e U n i v e r s i t y P r e s s - R e v i e w C o p y R e v i e w C o p y - C a m b r i d g e U n i v e r s i t y P r e s s - R e v i e w C o p y R e v i e w C o p y - C a m b r i d g e U n i v e r s i t y Copyright Material - Review Only - Not for Redistribution
- 87. Unit 1: Data handling 77 4 Collecting, organising and displaying data Exercise 4.2 1 Balsem threw a dice 50 times. These are her scores. Draw a tally table to organise her data. She recorded these results: A B A C A C C D A C C C D A D D C C C A B B A C D B B A C C A B C A D B C D A B A C C D A C C C D A D D C C C A B B A C D C C D A C A B D B C C D A D D C C C A B B A C D B B C C C A B C A D B C D A B a Draw a tally table to organise the results. b What do the results of her survey suggest people think about pop-up advertising on social media? a Response Tally A //// //// //// //// //// B //// //// //// //// C //// //// //// //// //// //// //// // D //// //// //// //// Count each letter. Make a tally each time you count one. It may help to cross the letters off the list as you count them. Check that your tallies add up to 100 to make sure you have included all the scores. (You could work across the rows or down the columns, putting a tally into the correct row in your table, rather than just counting one letter at a time.) b The results suggest that people generally don’t think advertising should be banned on social media. 57 people disagreed or strongly disagreed. Only 24 of the 100 people strongly agreed with Anita’s statement. By giving people a very definite statement and asking them to respond to it, Anita has shown her own bias and that could affect the results of her survey. It is quite possible that people feel some control is necessary, but not that adverts should be banned completely and they don’t have that as an option when they answer. The composition of the sample could also affect the responses, so any conclusions from this survey would need to be considered carefully. You will deal with restrictions on drawing conclusions in more detail in Chapter 12. LINK e s s - R e v i e w C o p y - C a m b r i d g e U n i v e r s i t y P r e s s - R e v i e w C o p y R e v i e w C o p y - C a m b r i d g e U n i v e r s i t y P r e s s - R e v i e w C o p y R e v i e w C o p y - C a m b r i d g e U n i v e r s i t y P r e s s - R e v i e w C o p y R e v i e w C o p y - C a m b r i d g e U n i v e r s i t y Copyright Material - Review Only - Not for Redistribution
- 88. Unit 1: Data handling Cambridge IGCSE Mathematics 78 2 Do a quick survey among your class to find out how many hours each person usually spends doing his or her homework each day. Draw your own tally table to record and organise your data. 3 Faizel threw two dice together 250 times and recorded the score he got using a tally table. Look at the tally table and answer the questions about it. Score Tally 2 //// // 3 //// //// //// 4 //// //// //// //// /// 5 //// //// //// //// //// //// 6 //// //// //// //// //// //// /// 7 //// //// //// //// //// //// //// //// / 8 //// //// //// //// //// //// //// 9 //// //// //// //// //// /// 10 //// //// //// //// / 11 //// //// // 12 //// / a Which score occurred most often? b Which two scores occurred least often? c Why do you think Faizel left out the score of one? d Why do you think he scored six, seven and eight so many times? Frequency tables A frequency table shows the totals of the tally marks. Some frequency tables include the tallies. Colour Number of cars Frequency White //// //// /// 13 Red //// //// //// //// / 21 Black //// //// //// //// //// //// //// // 37 Blue //// //// //// //// //// // 27 Silver //// //// //// //// //// //// //// //// /// 43 Green //// //// //// / 16 Total 157 This frequency table is the same as the tally table the student used to record car colours (page 76). It has another column added with the totals (frequencies) of the tallies. e s s - R e v i e w C o p y - C a m b r i d g e U n i v e r s i t y P r e s s - R e v i e w C o p y R e v i e w C o p y - C a m b r i d g e U n i v e r s i t y P r e s s - R e v i e w C o p y R e v i e w C o p y - C a m b r i d g e U n i v e r s i t y P r e s s - R e v i e w C o p y R e v i e w C o p y - C a m b r i d g e U n i v e r s i t y Copyright Material - Review Only - Not for Redistribution RM.DL.Books
- 89. Unit 1: Data handling 79 4 Collecting, organising and displaying data The frequency table has space to write a total at the bottom of the frequency column. This helps you to know how many pieces of data were collected. In this example the student recorded the colours of 157 cars. Most frequency tables will not include tally marks. Here is a frequency table without tallies. It was drawn up by the staff at a clinic to record how many people were treated for different diseases in one week. Illness Frequency Diabetes HIV/Aids TB Other 30 40 60 50 Total 180 Grouping data in class intervals Sometimes numerical data needs to be recorded in different groups. For example, if you collected test results for 40 students you might find that students scored between 40 and 84 (out of 100). If you recorded each individual score (and they could all be different) you would get a very large frequency table that is difficult to manage. To simplify things, the collected data can be arranged in groups called class intervals. A frequency table with results arranged in class intervals is called a grouped frequency table. Look at the example below: Points scored Frequency 40–44 45–49 50–54 55–59 60–64 65–69 70–74 75–79 80–84 7 3 3 3 0 5 3 7 9 Total 40 The range of scores (40–84) has been divided into class intervals. Notice that the class intervals do not overlap so it is clear which data goes in what class. Exercise 4.3 1 Sheldon did a survey to find out how many coins the students in his class had on them (in their pockets or purses). These are his results: 0 2 3 1 4 6 3 6 7 2 1 2 4 0 0 6 5 4 8 2 6 3 2 0 0 0 2 4 3 5 a Copy this frequency table and use it to organise Sheldon’s data. Number of coins 0 1 2 3 4 5 6 7 8 Frequency b What is the highest number of coins that any person had on them? c How many people had only one coin on them? The frequency column tells you how often (how frequently) each result appeared in the data and the data is discrete. You will soon use these tables to construct bar charts and other frequency diagrams. These diagrams give a clear, visual impression of the data. FAST FORWARD In this example, the test does not allow for fractions of a mark, so all test scores are integers and the data is discrete. Before you could draw any meaningful conclusions about what type of illness is most common at a clinic, you would need to know where this data was collected. The frequency of different diseases would be different in different parts of the world. e s s - R e v i e w C o p y - C a m b r i d g e U n i v e r s i t y P r e s s - R e v i e w C o p y R e v i e w C o p y - C a m b r i d g e U n i v e r s i t y P r e s s - R e v i e w C o p y R e v i e w C o p y - C a m b r i d g e U n i v e r s i t y P r e s s - R e v i e w C o p y R e v i e w C o p y - C a m b r i d g e U n i v e r s i t y Copyright Material - Review Only - Not for Redistribution
- 90. Unit 1: Data handling Cambridge IGCSE Mathematics 80 d What is the most common number of coins that people had on them? e How many people did Sheldon survey altogether? How could you show this on the frequency table? 2 Penny works as a waitress in a fast food restaurant. These are the amounts (in dollars) spent by 25 customers during her shift. 43.55 4.45 17.60 25.95 3.75 12.35 55.00 12.90 35.95 16.25 25.05 2.50 29.35 12.90 8.70 12.50 13.95 6.50 39.40 22.55 20.45 4.50 5.30 15.95 10.50 a Copy and complete this grouped frequency table to organise the data. Amount ($) 0–9.99 10–19.99 20–29.99 30–39.99 40–49.99 50–59.99 Frequency b How many people spent less than $20.00? c How many people spent more than $50.00? d What is the most common amount that people spent during Penny’s shift? 3 Leonard records the length in minutes and whole seconds, of each phone call he makes during one day. These are his results: 3min 29s 4min 12s 4min 15s 1min 29s 2min 45s 1min 32s 1min 09s 2min 50s 3min 15s 4min 03s 3min 04s 5min 12s 5min 45s 3min 29s 2min 09s 1min 12s 4min 15s 3min 45s 3min 59s 5min 01s Use a grouped frequency table to organise the data. Stem and leaf diagrams A stem and leaf diagram is a special type of table that allows you to organise and display grouped data using the actual data values. When you use a frequency table to organise grouped data you cannot see the actual data values, just the number of data items in each group. Stem and leaf diagrams are useful because when you keep the actual values, you can calculate the range and averages for the data. In a stem and leaf diagram each data item is broken into two parts: a stem and a leaf. The final digit of each value is the leaf and the previous digits are the stem. The stems are written to the left of a vertical line and the leaves are written to the right of the vertical line. For example a score of 13 would be shown as: Stem Leaf 1 | 3 In this case, the tens digit is the stem and the units digit is the leaf. A larger data value such as 259 would be shown as: Stem Leaf 25 | 9 Note that currency (money) is discrete data because you cannot get a coin (or note) smaller than one cent. You will work with stem and leaf diagrams again when you calculate averages and measures of spread in chapter 12. FAST FORWARD e s s - R e v i e w C o p y - C a m b r i d g e U n i v e r s i t y P r e s s - R e v i e w C o p y R e v i e w C o p y - C a m b r i d g e U n i v e r s i t y P r e s s - R e v i e w C o p y R e v i e w C o p y - C a m b r i d g e U n i v e r s i t y P r e s s - R e v i e w C o p y R e v i e w C o p y - C a m b r i d g e U n i v e r s i t y Copyright Material - Review Only - Not for Redistribution
- 91. Unit 1: Data handling 81 4 Collecting, organising and displaying data In this case, the stem represents both the tens and the hundreds digits while the units digit is the leaf. To be useful, a stem and leaf diagram should have at least 5 stems. If the number of stems is less than that, you can split the leaves into 2 (or sometimes even 5) classes. If you do this, each stem is listed twice and the leaves are grouped into a lower and higher class. For example, if the stem is tens and the leaves are units, you would make two classes like this: Stem Leaf 1 | 0 3 4 2 1 1 | 5 9 8 7 5 6 Values from 10 to 14 (leaves 0 to 4) are included in the first class, values from 15 to 19 (leaves 5 to 9) are included in the second class. Stem and leaf diagrams are easier to work with if the leaves are ordered from smallest to greatest. Worked example 2 Worked example 2 This data set shows the ages of customers using an internet café. 34 23 40 35 25 28 18 32 37 29 19 17 32 55 36 42 33 20 25 34 48 39 36 30 Draw a stem and leaf diagram to display this data. Key 1 | 7 = 17 years old 1 2 3 4 5 8 9 7 3 5 8 9 0 5 4 5 2 7 6 6 3 4 2 9 0 0 2 8 5 Leaf Stem Group the ages in intervals of ten, 10 – 19; 20 – 29 and so on. These are two-digit numbers, so the tens digit will be the stem. List the stems in ascending order down the left of the diagram. Work through the data in the order it is given, writing the units digits (the leaves) in a row next to the appropriate stem. Space the leaves to make it easier to read them. If you need to work with the data, you can redraw the diagram, putting the leaves in ascending order. Key 1 | 7 = 17 years old 1 2 3 4 5 7 8 9 0 3 5 5 8 9 0 2 2 3 4 4 5 6 6 7 9 0 2 8 5 Leaf Stem From this re-organised stem and leaf diagram you can quickly see that: • the youngest person using the internet café was 17 years old (the first data item) • the oldest person was 55 (the last data item) • most users were in the age group 30 – 39 (the group with the largest number of leaves). A back to back stem and leaf diagram is used to show two sets of data. The second set of data is plotted against the same stem, but the leaves are written to the left. This stem and leaf plot compares the battery life of two different brands of mobile phone. e s s - R e v i e w C o p y - C a m b r i d g e U n i v e r s i t y P r e s s - R e v i e w C o p y R e v i e w C o p y - C a m b r i d g e U n i v e r s i t y P r e s s - R e v i e w C o p y R e v i e w C o p y - C a m b r i d g e U n i v e r s i t y P r e s s - R e v i e w C o p y R e v i e w C o p y - C a m b r i d g e U n i v e r s i t y Copyright Material - Review Only - Not for Redistribution
- 92. Unit 1: Data handling Cambridge IGCSE Mathematics 82 0 1 2 3 4 5 5 8 4 7 8 2 8 9 7 1 5 7 2 1 0 2 1 9 4 8 7 2 7 8 7 2 3 8 4 6 2 7 9 8 7 2 Leaf Leaf Stem Brand Y Brand X Key Brand X 8 | 2 = 28 hours Brand Y 4 | 2 = 42 hours You read the data for Brand X from right to left. The stem is still the tens digit. Exercise 4.4 1 The mass of some Grade 10 students was measured and recorded to the nearest kilogram. These are the results: 45 56 55 68 53 55 48 49 53 54 56 59 60 63 67 49 55 56 58 60 Construct a stem and leaf diagram to display the data. 2 The numbers of pairs of running shoes sold each day for a month at different branches of ‘Runner’s Up Shoe Store’ are given below. Branch A 175, 132, 180, 134, 179, 115, 140, 200, 198, 201, 189, 149, 188, 179, 186, 152, 180, 172, 169, 155, 164, 168, 166, 149, 188, 190, 199, 200 Branch B 188, 186, 187, 159, 160, 188, 200, 201, 204, 198, 190, 185, 142, 188 165, 187, 180, 190, 191, 169, 177, 200, 205, 196, 191, 193, 188, 200 a Draw a back to back stem and leaf diagram to display the data. b Which branch had the most sales on one day during the month? c Which branch appears to have sold the most pairs? Why? 3 A biologist wanted to investigate how pollution levels affect the growth of fish in a dam. In January, she caught a number of fish and measured their length before releasing them back into the water. The stem and leaf diagram shows the lengths of the fish to the nearest centimetre. 1 2 3 4 5 2 4 4 6 0 1 3 3 4 5 8 9 3 5 6 6 6 7 8 9 0 2 5 7 2 7 Length of fish (cm) January sample Key 1 | 2 = 12 cm a How many fish did she measure? b What was the shortest length measured? c How long was the longest fish measured? d How many fish were 40 cm or longer? e How do you think the diagram would change if she did the same survey in a year and: i the pollution levels had increased and stunted the growth of the fish ii the conditions in the water improved and the fish increased in length? e s s - R e v i e w C o p y - C a m b r i d g e U n i v e r s i t y P r e s s - R e v i e w C o p y R e v i e w C o p y - C a m b r i d g e U n i v e r s i t y P r e s s - R e v i e w C o p y R e v i e w C o p y - C a m b r i d g e U n i v e r s i t y P r e s s - R e v i e w C o p y R e v i e w C o p y - C a m b r i d g e U n i v e r s i t y Copyright Material - Review Only - Not for Redistribution
- 93. Unit 1: Data handling 83 4 Collecting, organising and displaying data 4 This stem and leaf diagram shows the pulse rate of a group of people measured before and after exercising on a treadmill. 6 7 8 9 10 11 12 13 14 7 6 4 3 0 2 4 1 3 3 1 7 8 9 8 2 7 2 0 1 3 6 8 7 2 3 4 1 2 7 3 2 7 8 0 1 Leaf Leaf Stem Pulse rate After exercise Before exercise Key Before exercise 2 | 6 = 62 beats per minute After exercise 8 | 7 = 87 beats per minute a How many people had a resting pulse rate (before exercise) in the range of 60 to 70 beats per minute? b What was the highest pulse rate measured before exercise? c That person also had the highest pulse rate after exercise, what was it? d What does the stem and leaf diagram tell you about pulse rates and exercise in this group? How? Two-way tables A two-way table shows the frequency of certain results for two or more sets of data. Here is a two way table showing how many men and woman drivers were wearing their seat belts when they passed a check point. Wearing a seat belt Not wearing a seat belt Men 10 4 Women 6 3 The headings at the top of the table give you information about wearing seat belts. The headings down the side of the table give you information about gender. You can use the table to find out: • how many men were wearing seat belts • how many women were wearing seat belts • how many men were not wearing seat belts • how many women were not wearing seat belts. You can also add the totals across and down to work out: • how many men were surveyed • how many women were surveyed • how many people (men + women) were wearing seat belts or not wearing seat belts. e s s - R e v i e w C o p y - C a m b r i d g e U n i v e r s i t y P r e s s - R e v i e w C o p y R e v i e w C o p y - C a m b r i d g e U n i v e r s i t y P r e s s - R e v i e w C o p y R e v i e w C o p y - C a m b r i d g e U n i v e r s i t y P r e s s - R e v i e w C o p y R e v i e w C o p y - C a m b r i d g e U n i v e r s i t y Copyright Material - Review Only - Not for Redistribution
- 94. Unit 1: Data handling Cambridge IGCSE Mathematics 84 Here are two more examples of two-way tables: Drinks and crisps sold at a school tuck shop during lunch break Sweet chilli Plain Cheese and onion Cola 9 6 23 Fruit juice 10 15 12 How often male and female students use Facebook Never use it Use it sometimes Use it every day Male 35 18 52 Female 42 26 47 Exercise 4.5 1 A teacher did a survey to see how many students in her class were left-handed. She drew up this two-way table to show the results. Left-handed Right-handed Girls 9 33 Boys 6 42 a How many left-handed girls are there in the class? b How many of the girls are right-handed? c Are the boys mostly left-handed or mostly right-handed? d How many students are in the class? 2 Do a quick survey in your own class to find out whether girls and boys are left- or right- handed. Draw up a two-way table of your results. 3 Sima asked her friends whether they liked algebra or geometry best. Here are the responses. Name Algebra Geometry Sheldon Leonard Raj Penny Howard Zarah Zohir Ahmed Jenny e s s - R e v i e w C o p y - C a m b r i d g e U n i v e r s i t y P r e s s - R e v i e w C o p y R e v i e w C o p y - C a m b r i d g e U n i v e r s i t y P r e s s - R e v i e w C o p y R e v i e w C o p y - C a m b r i d g e U n i v e r s i t y P r e s s - R e v i e w C o p y R e v i e w C o p y - C a m b r i d g e U n i v e r s i t y Copyright Material - Review Only - Not for Redistribution
- 95. Unit 1: Data handling 85 4 Collecting, organising and displaying data a Draw a two-way table using these responses. b Write a sentence to summarise what you can learn from the table. Two-way tables in everyday life Two-way tables are often used to summarise and present data in real life situations. You need to know how to read these tables so that you can answer questions about them. Make sure you understand how to draw up and read a two-way table. You will use them again in chapter 8 when you deal with probability. FAST FORWARD Worked example 3 This table shows world population data for 2008 with estimated figures for 2025 and 2050. Region Population in 2008 Projected population 2025 Projected population 2050 World 6705000000 8000000000 9352000000 Africa 967000000 1358000000 1932000000 North America 338000000 393000000 480000000 Latin America and the Caribbean 577000000 678000000 778000000 Asia 4052000000 4793000000 5427000000 Europe 736000000 726000000 685000000 Oceania 35000000 42000000 49000000 (Data from Population Reference Bureau.) a What was the total population of the world in 2008? b By how much is the population of the world expected to grow by 2025? c What percentage of the world’s population lived in Asia in 2008? Give your answer to the closest whole per cent. d Which region is likely to experience a decrease in population between 2008 and 2025? i What is the population of this region likely to be in 2025? ii By how much is the population expected to decrease by 2050? a 6705000000 Read this from the table. b 8000000000 − 6705000000 = 1295000000 Read the value for 2025 from the table and subtract the smaller figure from the larger. c 4052000000 6705000000 100 60 4325 60 × = 100 × = ≈ . % 4325 . % % Read the figures from the table and then calculate the percentage. d Europe i 726000000 ii 736000000 – 685000000 = 51000000 Look to see which numbers are decreasing across the row. Read this from the table. Read the values from the table and subtract the smaller figure from the larger. Name Algebra Geometry Priyanka Anne Ellen e s s - R e v i e w C o p y - C a m b r i d g e U n i v e r s i t y P r e s s - R e v i e w C o p y R e v i e w C o p y - C a m b r i d g e U n i v e r s i t y P r e s s - R e v i e w C o p y R e v i e w C o p y - C a m b r i d g e U n i v e r s i t y P r e s s - R e v i e w C o p y R e v i e w C o p y - C a m b r i d g e U n i v e r s i t y Copyright Material - Review Only - Not for Redistribution
- 96. Unit 1: Data handling Cambridge IGCSE Mathematics 86 Exercise 4.6 Applying your skills This distance table shows the flying distance (in miles) between some major world airports. Mumbai Hong Kong London Montreal Singapore Sydney Dubai 1199 3695 3412 6793 3630 7580 Hong Kong 2673 8252 10345 1605 4586 Istanbul 2992 7016 1554 5757 5379 11772 Karachi 544 3596 5276 8888 2943 8269 Lagos 5140 8930 3098 6734 7428 11898 London 4477 8252 3251 6754 10564 Singapore 2432 1605 6754 9193 3912 Sydney 6308 4586 10564 12045 3916 a Find the flying distance from Hong Kong to: i Dubai ii London iii Sydney b Which is the longer flight: Istanbul to Montreal or Mumbai to Lagos? c What is the total flying distance for a return flight from London to Sydney and back? d If the plane flies at an average speed of 400miles per hour, how long will it take to fly the distance from Singapore to Hong Kong to the nearest hour? e Why are there some blank blocks on this table? 4.3 Using charts to display data Charts are useful for displaying data because you can see patterns and trends easily and quickly. You can also compare different sets of data easily. In this section you are going to revise what you already know about how to draw and make sense of pictograms, bar charts and pie charts. Pictograms Pictograms are fairly simple charts. Small symbols (pictures) are used to represent quantities. The meaning of the symbol and the amount it represents (a ‘key’) must be provided for the graph to make sense. You also need to be able to draw and use frequency distributions and histograms. These are covered in chapter 20. FAST FORWARD Worked example 4 Worked example 4 The table shows how many books five different students have finished reading in the past year. Student Number of books read Amina 12 Bheki 14 Dabilo 8 Saul 16 Linelle 15 e s s - R e v i e w C o p y - C a m b r i d g e U n i v e r s i t y P r e s s - R e v i e w C o p y R e v i e w C o p y - C a m b r i d g e U n i v e r s i t y P r e s s - R e v i e w C o p y R e v i e w C o p y - C a m b r i d g e U n i v e r s i t y P r e s s - R e v i e w C o p y R e v i e w C o p y - C a m b r i d g e U n i v e r s i t y Copyright Material - Review Only - Not for Redistribution
- 97. Unit 1: Data handling 87 4 Collecting, organising and displaying data Draw a pictogram to show this data. Number of books read Amina Key = 2 books Bheki Dabilo Saul Linelle Worked example 5 Worked example 5 This pictogram shows the amount of time that five friends spent talking on their phones during one week. Times spent on the phone Jan Key = 1hour Anna Marie Isobel Tara a Who spent the most time on the phone that week? b How much time did Isobel spend on the phone that week? c Who spent 3 1 2 hours on the phone this week? d Draw the symbols you would use to show 2 1 4 hours. a Anna The person with the most clocks. b 3 3 4 hours There are three whole clocks; the key shows us each one stands for 1 hour. The fourth clock is only three-quarters, so it must be 3 4 of an hour. c Tara She has three full clocks, each worth 1 hour, and one half clock. d Two full clocks to represent two hours, and a quarter of a clock to represent 1 4 hours. e s s - R e v i e w C o p y - C a m b r i d g e U n i v e r s i t y P r e s s - R e v i e w C o p y R e v i e w C o p y - C a m b r i d g e U n i v e r s i t y P r e s s - R e v i e w C o p y R e v i e w C o p y - C a m b r i d g e U n i v e r s i t y P r e s s - R e v i e w C o p y R e v i e w C o p y - C a m b r i d g e U n i v e r s i t y Copyright Material - Review Only - Not for Redistribution
- 98. Unit 1: Data handling Cambridge IGCSE Mathematics 88 Exercise 4.7 1 A pictogram showing how many tourists visit the top five tourist destinations uses this symbol. = 500000 arrivals How many tourists are represented by each of these symbols? a b c d 2 Here is a set of data for the five top tourist destination countries (2016). Use the symbol from question 1 with your own scale to draw a pictogram to show this data. Most tourist arrivals Country France USA Spain China Italy Number of tourists 84500000 77500000 68200000 56900000 50700000 3 This pictogram shows the number of fish caught by five fishing boats during one fishing trip. Golden rod = 70 fish Shark bait Fish tales Reel deal Bite-me Number of fish caught per boat a Which boat caught the most fish? b Which boat caught the least fish? c How many fish did each boat catch? d What is the total catch for the fleet on this trip? The number of arrivals represented by the key should be an integer that is easily divided into the data; you may also need to round the data to a suitable degree of accuracy. e s s - R e v i e w C o p y - C a m b r i d g e U n i v e r s i t y P r e s s - R e v i e w C o p y R e v i e w C o p y - C a m b r i d g e U n i v e r s i t y P r e s s - R e v i e w C o p y R e v i e w C o p y - C a m b r i d g e U n i v e r s i t y P r e s s - R e v i e w C o p y R e v i e w C o p y - C a m b r i d g e U n i v e r s i t y Copyright Material - Review Only - Not for Redistribution
- 99. Unit 1: Data handling 89 4 Collecting, organising and displaying data Bar charts Bar charts are normally used to display discrete data. The chart shows information as a series of bars plotted against a scale on the axis. The bars can be horizontal or vertical. 0 2 4 6 8 10 12 14 16 Days Number of days of rain December January February March Month 0 50 100 150 200 250 Jan Feb Mar Apr May Month Number of books Number of books taken out of the library e s s - R e v i e w C o p y - C a m b r i d g e U n i v e r s i t y P r e s s - R e v i e w C o p y R e v i e w C o p y - C a m b r i d g e U n i v e r s i t y P r e s s - R e v i e w C o p y R e v i e w C o p y - C a m b r i d g e U n i v e r s i t y P r e s s - R e v i e w C o p y R e v i e w C o p y - C a m b r i d g e U n i v e r s i t y Copyright Material - Review Only - Not for Redistribution
- 100. Unit 1: Data handling Cambridge IGCSE Mathematics 90 Worked example 6 Worked example 6 The frequency table shows the number of people who were treated for road accident injuries in the casualty department of a large hospital in the first six months of the year. Draw a bar chart to represent the data. Note that bar chart’s frequency axes should start from zero. Patients admitted as a result of road accidents Month Number of patients January 360 February 275 March 190 April 375 May 200 June 210 0 50 100 150 200 250 300 350 400 Jan Feb Mar Apr May June Months Number of patients Road accident admittances scale is divided into 50 and labelled categories are labelled bars equal width and equally spaced height of bar shows number of patients against scale There are different methods of drawing bar charts, but all bar charts should have: • a title that tells what data is being displayed • a number scale or axis (so you can work out how many are in each class) and a label on the scale that tells you what the numbers stand for • a scale or axis that lists the categories displayed • bars that are equally wide and equally spaced. The bars should not touch for qualitative or discrete data. A bar chart is not the same as a histogram. A histogram is normally used for continuous data. You will learn more about histograms in chapter 20. FAST FORWARD e s s - R e v i e w C o p y - C a m b r i d g e U n i v e r s i t y P r e s s - R e v i e w C o p y R e v i e w C o p y - C a m b r i d g e U n i v e r s i t y P r e s s - R e v i e w C o p y R e v i e w C o p y - C a m b r i d g e U n i v e r s i t y P r e s s - R e v i e w C o p y R e v i e w C o p y - C a m b r i d g e U n i v e r s i t y Copyright Material - Review Only - Not for Redistribution
- 101. Unit 1: Data handling 91 4 Collecting, organising and displaying data Compound bar charts A compound bar chart displays two or more sets of data on the same set of axes to make it easy to compare the data. This chart compares the growth rates of children born to mothers with different education levels. Percentage of children under age 3 whose growth is impacted by mother’s education Percentage of children with growth problems 47 30 28 57 22 47 36 20 39 19 10 8 23 17 17 5 0 10 20 30 40 50 60 Madagascar Nigeria Cambodia Haiti Country Columbia Egypt Senegal India* No education Secondary or higher * Children under age 5 You can see that children born to mothers with secondary education are less likely to experience growth problems because their bars are shorter than the bars for children whose mothers have only primary education. The aim of this graph is to show that countries should pay attention to the education of women if they want children to develop in healthy ways. Exercise 4.8 Applying your skills 1 Draw a bar chart to show each of these sets of data. a Favourite take- away food Burgers Noodles Fried chicken Hot chips Other No. of people 40 30 84 20 29 b African countries with the highest HIV/AIDS infection rates (2015 est) Country % of adults (aged 15 to 49) infected Swaziland 28.8 Botswana 22.2 Lesotho 22.7 Zimbabwe 14.7 South Africa 19.2 Namibia 13.3 Zambia 12.3 Malawi 9.1 Uganda 7.1 Mozambique 10.5 (Data taken from www.aidsinfo.unaids.org) (Adapted from Nutrition Update 2010: www.dhsprogram.com) HIV is a massive global health issue. In 2017, the organisation Avert reported that 36.7 million people worldwide were living with HIV. The vast majority of these people live in low- and middle- income countries and almost 70% of them live in sub-Saharan Africa. The countries of East and Southern Africa are the most affected. Since 2010, there has been a 29% decrease in the rate of new infection in this region, largely due to awareness and education campaigns and the roll out of anti- retroviral medication on a large scale. (Source: www.Avert.org) e s s - R e v i e w C o p y - C a m b r i d g e U n i v e r s i t y P r e s s - R e v i e w C o p y R e v i e w C o p y - C a m b r i d g e U n i v e r s i t y P r e s s - R e v i e w C o p y R e v i e w C o p y - C a m b r i d g e U n i v e r s i t y P r e s s - R e v i e w C o p y R e v i e w C o p y - C a m b r i d g e U n i v e r s i t y Copyright Material - Review Only - Not for Redistribution
- 102. Unit 1: Data handling Cambridge IGCSE Mathematics 92 2 Here is a set of raw data showing the average summer temperature (in °C) for 20 cities in the Middle East during one year. 32 42 36 40 35 36 33 32 38 37 34 40 41 39 42 38 37 42 40 41 a Copy and complete this grouped frequency table to organise the data. Temperature (°C) 32–34 35–37 38–40 41–43 Frequency b Draw a horizontal bar chart to represent this data. 3 The tourism organisation on a Caribbean island records how many tourists visit from the region and how many tourists visit from international destinations. Here is their data for the first six months of this year. Draw a compound bar chart to display this data. Jan Feb Mar Apr May Jun Regional visitors 12000 10000 19000 16000 21000 2000 International visitors 40000 39000 15000 12000 19000 25000 Pie charts A pie chart is a circular chart which uses slices or sectors of the circle to show the data. The circle in a pie chart represents the ‘whole’ set of data. For example, if you surveyed the favourite sports played by everyone in a school then the total number of students would be represented by the circle. The sectors would represent groups of students who played each sport. Like other charts, pie charts should have a heading and a key. Here are some fun examples of pie charts: 100% Being adorable How pandas spend a typical day Sleeping Socialising Grooming Attacking gazelles Eating gazelles 2% 5% 6% 7% How lions spend a typical day 80% 82% Eating Sleeping Not forgetting How elephants spend a typical day 8% 10% Just floating there Absorbing food Ruining a perfectly good day at the beach 1% 9% 90% How jellyfish spend a typical day Look at the earlier sections of this chapter to remind yourself about grouped frequency tables if you need to. REWIND In this example, the temperature groups/class intervals will be displayed as ‘categories’ with gaps between each bar. As temperature is continuous, a better way to deal with it is to use a histogram with equal class intervals; you will see these in chapter 20. e s s - R e v i e w C o p y - C a m b r i d g e U n i v e r s i t y P r e s s - R e v i e w C o p y R e v i e w C o p y - C a m b r i d g e U n i v e r s i t y P r e s s - R e v i e w C o p y R e v i e w C o p y - C a m b r i d g e U n i v e r s i t y P r e s s - R e v i e w C o p y R e v i e w C o p y - C a m b r i d g e U n i v e r s i t y Copyright Material - Review Only - Not for Redistribution
- 103. Unit 1: Data handling 93 4 Collecting, organising and displaying data It is possible that your angles, once rounded, don’t quite add up to 360°. If this happens, you can add or subtract a degree to or from the largest sector (the one with the highest frequency). Worked example 7 The table shows how a student spent her day. Activity School Sleeping Eating Online On the phone Complaining about stuff Number of hours 7 8 1.5 3 2.5 2 Draw a pie chart to show this data. 7 + 8 + 1.5 + 3 + 2.5 + 2 = 24 First work out the total number of hours. Then work out each category as a fraction of the whole and convert the fraction to degrees: (as a fraction of 24) (convert to degrees) School = 7 24 = 7 24 360 105 × = 360 × = ° Sleeping = 8 24 = 8 24 360 120 × = 360 × = ° Eating = 1 5 24 15 240 1 5 1 5 = = 15 240 360 22 5 × = 360 × = ° . Online = 3 24 = 3 24 360 45 × = 360 × = ° On the phone = 2 5 24 25 240 2 5 2 5 = = 25 240 360 37 5 × = 360 × = ° . Complaining = 2 24 = 2 24 360 30 × = 360 × = ° Activity School Sleeping Eating Online On the phone Complaining about stuff Number of hours 7 8 1.5 3 2.5 2 Angle 105° 120° 22.5° 45° 37.5° 30° Sleeping School Eating Online Complaining On phone A student’s day • Draw a circle to represent the whole day. • Use a ruler and a protractor to measure each sector. • Label the chart and give it a title. e s s - R e v i e w C o p y - C a m b r i d g e U n i v e r s i t y P r e s s - R e v i e w C o p y R e v i e w C o p y - C a m b r i d g e U n i v e r s i t y P r e s s - R e v i e w C o p y R e v i e w C o p y - C a m b r i d g e U n i v e r s i t y P r e s s - R e v i e w C o p y R e v i e w C o p y - C a m b r i d g e U n i v e r s i t y Copyright Material - Review Only - Not for Redistribution
- 104. Unit 1: Data handling Cambridge IGCSE Mathematics 94 Exercise 4.9 1 The table shows the results of a survey carried out on a university campus to find out about the use of online support services among students. Draw a pie chart to illustrate this data. Category Number of students Never used online support 180 Used online support in the past 120 Use online support presently 100 2 The table shows the home language of a number of people passing through an international airport. Display this data as a pie chart. Language Frequency English Spanish Chinese Italian French German Japanese 130 144 98 104 24 176 22 Worked example 8 This pie chart shows how Henry spent one day of his school holidays. Sleeping Computer games Other stuff Henry’s day a What fraction of his day did he spend playing computer games? b How much time did Henry spend sleeping? c What do you think ‘other stuff’ involved? a 120 360 1 3 = Measure the angle and convert it to a fraction. The yellow sector has an angle of 120°. Convert to a fraction by writing it over 360 and simplify. b 210 360 24 14 × = 24 × = hours Measure the angle, convert it to hours. c Things he didn’t bother to list. Possibly eating, showering, getting dressed. e s s - R e v i e w C o p y - C a m b r i d g e U n i v e r s i t y P r e s s - R e v i e w C o p y R e v i e w C o p y - C a m b r i d g e U n i v e r s i t y P r e s s - R e v i e w C o p y R e v i e w C o p y - C a m b r i d g e U n i v e r s i t y P r e s s - R e v i e w C o p y R e v i e w C o p y - C a m b r i d g e U n i v e r s i t y Copyright Material - Review Only - Not for Redistribution
- 105. Unit 1: Data handling 95 4 Collecting, organising and displaying data 3 The amount of land used to grow different vegetables on a farm is shown below. Draw a pie chart to show the data. Vegetable Squashes Pumpkins Cabbages Sweet potatoes Area of land (km2 ) 1.4 1.25 1.15 1.2 4 The nationalities of students in an international school is shown on this pie chart. Chinese Brazilian American Indian French Nationalities of students at a school a What fraction of the students are Chinese? b What percentage of the students are Indian? c Write the ratio of Brazilian students: total students as a decimal. d If there are 900 students at the school, how many of them are: i Chinese? ii Indian? iii American? iv French? Line graphs Some data that you collect changes with time. Examples are the average temperature each month of the year, the number of cars each hour in a supermarket car park or the amount of money in your bank account each week. The following line graph shows how the depth of water in a garden pond varies over a year. The graph shows that the water level is at its lowest between June and August. Month of year Depth of water in a garden pond 0 30 35 40 45 50 55 60 Depth of water (mm) Jan Feb Mar Apr May Jun Jul Aug Sep Oct Nov Dec When time is one of your variables it is always plotted on the horizontal axis. Graphs that can be used for converting currencies or systems of units will be covered in chapter 13. Graphs dealing with time, distance and speed are covered in chapter 21. FAST FORWARD e s s - R e v i e w C o p y - C a m b r i d g e U n i v e r s i t y P r e s s - R e v i e w C o p y R e v i e w C o p y - C a m b r i d g e U n i v e r s i t y P r e s s - R e v i e w C o p y R e v i e w C o p y - C a m b r i d g e U n i v e r s i t y P r e s s - R e v i e w C o p y R e v i e w C o p y - C a m b r i d g e U n i v e r s i t y Copyright Material - Review Only - Not for Redistribution
- 106. Unit 1: Data handling Cambridge IGCSE Mathematics 96 Choosing the most appropriate chart You cannot always say that one type of chart is better than another – it depends very much on the data and what you want to show. However, the following guidelines are useful to remember: • Use pie charts or bar charts (single bars) if you want to compare different parts of a whole, if there is no time involved, and there are not too many pieces of data. • Use bar charts for discrete data that does not change over time. • Use compound bar charts if you want to compare two or more sets of discrete data. • Use line graphs for numerical data when you want to show how something changes over time. The table summarises the features, advantages and disadvantages of each different types of chart/ graph. You can use this information to help you decide which type to use. Chart/graph and their features Advantages Disadvantages Pictogram Data is shown using symbols or pictures to represent quantities. The amount represented by each symbol is shown on a key. Attractive and appealing, can be tailored to the subject. Easy to understand. Size of categories can be easily compared. Symbols have to be broken up to represent ‘in-between values’ and may not be clear. Can be misleading as it does not give detailed information. Bar chart Data is shown in columns measured against a scale on the axis. Double bars can be used for two sets of data. Data can be in any order. Bars should be labelled and the measurement axis should have a scale and label. Clear to look at. Easy to compare categories and data sets. Scales are given, so you can work out values. Chart categories can be reordered to emphasise certain effects. Useful only with clear sets of numerical data. Pie charts Data is displayed as a fraction, percentage or decimal fraction of the whole. Each section should be labelled. A key and totals for the data should be given. Looks nice and is easy to understand. Easy to compare categories. No scale needed. Can shows percentage of total for each category. No exact numerical data. Hard to compare two data sets. ‘Other’ category can be a problem. Total is unknown unless specified. Best for three to seven categories. Line graph Values are plotted against ‘number lines’ on the vertical and horizontal axes, which should be clearly marked and labelled. Shows more detail of information than other graphs. Shows patterns and trends clearly. Other ‘in-between’ information can be read from the graph. Has many different formats and can be used in many different ways (for example conversion graphs, curved lines). Useful only with numerical data. Scales can be manipulated to make data look more impressive. Tip You may be asked to give reasons for choosing a particular type of chart. Be sure to have learned the advantages and disadvantages in the table. Tip Before you draw a chart decide: • how big you want the chart to be • what scales you will use and how you will divide these up • what title you will give the chart • whether you need a key or not. You will work with line graphs when you deal with frequency distributions in chapter 20. FAST FORWARD e s s - R e v i e w C o p y - C a m b r i d g e U n i v e r s i t y P r e s s - R e v i e w C o p y R e v i e w C o p y - C a m b r i d g e U n i v e r s i t y P r e s s - R e v i e w C o p y R e v i e w C o p y - C a m b r i d g e U n i v e r s i t y P r e s s - R e v i e w C o p y R e v i e w C o p y - C a m b r i d g e U n i v e r s i t y Copyright Material - Review Only - Not for Redistribution
- 107. Unit 1: Data handling 97 4 Collecting, organising and displaying data Exercise 4.10 1 Which type of graph would you use to show the following information? Give a reason for your choice. a The number of people in your country looking for jobs each month this year. b The favourite TV shows of you and nine of your friends. c The number of people using a gym at different times during a day. d The favourite subjects of students in a school. e The reasons people give for not donating to a charity. f The different languages spoken by people in your school. g The distance you can travel on a tank of petrol in cars with different sized engines. Applying your skills 2 Collect ten different charts from newspapers, magazines or other sources. Stick the charts into your book. For each graph: a write the type of chart it is b write a short paragraph explaining what each chart shows c identify any trends or patterns you can see in the data. d Is there any information missing that makes it difficult to interpret the chart? If so what is missing? e Why do you think the particular type and style of chart was used in each case? f Would you have chosen the same type and style of chart in each case? Why? Summary Do you know the following? • In statistics, data is a set of information collected to answer a particular question. • Categorical (qualitative) data is non-numerical. Colours, names, places and other descriptive terms are all categorical. • Numerical (quantitative) data is collected in the form of numbers. Numerical data can be discrete or continuous. Discrete data takes a certain value; continuous data can take any value in a given range. • Primary data is data you collect yourself from a primary source. Secondary data is data you collect from other sources (previously collected by someone else). • Unsorted data is called raw data. Raw data can be organised using tally tables, frequency tables, stem and leaf diagrams and two-way tables to make it easier to work with. • Data in tables can be displayed as graphs to show patterns and trends at a glance. • Pictograms are simple graphs that use symbols to represent quantities. • Bar charts have rows of horizontal bars or columns of vertical bars of different lengths. The bar length (or height) represents an amount. The actual amount can be read from a scale. • Compound bar charts are used to display two or more sets of data on the same set of axes. • Pie charts are circular charts divided into sectors to show categories of data. • The type of graph you draw depends on the data and what you wish to show. Are you able to … ? • collect data to answer a statistical question • classify different types of data • use tallies to count and record data • draw up a frequency table to organise data • use class intervals to group data and draw up a grouped frequency table • construct single and back-to-back stem and leaf diagrams to organise and display sets of data • draw up and use two-way tables to organise two or more sets of data • construct and interpret pictograms • construct and interpret bar charts and compound bar charts • construct and interpret pie charts. e s s - R e v i e w C o p y - C a m b r i d g e U n i v e r s i t y P r e s s - R e v i e w C o p y R e v i e w C o p y - C a m b r i d g e U n i v e r s i t y P r e s s - R e v i e w C o p y R e v i e w C o p y - C a m b r i d g e U n i v e r s i t y P r e s s - R e v i e w C o p y R e v i e w C o p y - C a m b r i d g e U n i v e r s i t y Copyright Material - Review Only - Not for Redistribution
- 108. 98 Unit 1: Data handling Examination practice Exam-style questions 1 Salma is a quality control inspector. She randomly selects 40 packets of biscuits at a large factory. She opens each packet and counts the number of broken biscuits it contains. Her results are as follows: 0 0 2 1 3 0 0 2 3 1 1 1 2 3 0 1 2 3 4 2 0 0 0 0 1 0 0 1 2 3 3 2 2 2 1 0 1 2 1 2 a Is this primary or secondary data to Salma? Why? b Is the data discrete or continuous? Give a reason why. c Copy and complete this frequency table to organise the data. No. of broken biscuits Tally Frequency 0 1 2 3 4 d What type of graph should Salma draw to display this data? Why? 2 The number of aircraft movements in and out of five main London airports during April 2017 is summarised in the table. Airport Gatwick Heathrow London City Luton Stansted Total flights 23696 39660 6380 10697 15397 a Which airport handled most aircraft movement? b How many aircraft moved in and out of Stansted Airport? c Round each figure to the nearest thousand. d Use the rounded figures to draw a pictogram to show this data. 3 This table shows the percentage of people who own a laptop and a mobile phone in four different districts in a large city. District Own a laptop Own a mobile phone A 45 83 B 32 72 C 61 85 D 22 68 a What kind of table is this? b If there are 6000 people in District A, how many of them own a mobile phone? c One district is home to a University of Technology and several computer software manufacturers. Which district do you think this is? Why? d Draw a compound bar chart to display this data. e s s - R e v i e w C o p y - C a m b r i d g e U n i v e r s i t y P r e s s - R e v i e w C o p y R e v i e w C o p y - C a m b r i d g e U n i v e r s i t y P r e s s - R e v i e w C o p y R e v i e w C o p y - C a m b r i d g e U n i v e r s i t y P r e s s - R e v i e w C o p y R e v i e w C o p y - C a m b r i d g e U n i v e r s i t y Copyright Material - Review Only - Not for Redistribution
- 109. 99 Unit 1: Data handling 4 This table shows how a sample of people in Hong Kong travel to work. Mode of transport Percentage Metro 36 Bus 31 Motor vehicle 19 Cycle 14 Represent this data as a pie chart. 5 Study this pie chart and answer the questions that follow. Baseball Cricket Football Netball Hockey Sport played by students The data was collected from a sample of 200 students. a What data does this graph show? b How many different categories of data are there? c Which was the most popular sport? d What fraction of the students play cricket? e How many students play netball? f How many students play baseball or hockey? Past paper questions 1 The table shows the number of goals scored in each match by Mathsletico Rangers. Number of goals scored Number of matches 0 4 1 11 2 6 3 3 4 2 5 1 6 2 e s s - R e v i e w C o p y - C a m b r i d g e U n i v e r s i t y P r e s s - R e v i e w C o p y R e v i e w C o p y - C a m b r i d g e U n i v e r s i t y P r e s s - R e v i e w C o p y R e v i e w C o p y - C a m b r i d g e U n i v e r s i t y P r e s s - R e v i e w C o p y R e v i e w C o p y - C a m b r i d g e U n i v e r s i t y Copyright Material - Review Only - Not for Redistribution
- 110. 100 Unit 1: Data handling Draw a bar chart to show this information. Complete the scale on the frequency axis. [3] Frequency 0 1 2 3 Number of goals scored 4 5 6 [Cambridge IGCSE Mathematics 0580 Paper 33 Q1 d(i) October/November 2012] 2 Some children are asked what their favourite sport is. The results are shown in the pie chart. Running Hockey Tennis Gymnastics Swimming 80° 120° 45° 60° i Complete the statements about the pie chart. The sector angle for running is ............................ degrees. The least popular sport is ............................ 1 6 of the children chose ............................ Twice as many children chose ............................ as ............................ [4] ii Five more children chose swimming than hockey. Use this information to work out the number of children who chose gymnastics. [3] [Cambridge IGCSE Mathematics 0580 Paper 32 Q5a) October/November 2015] e s s - R e v i e w C o p y - C a m b r i d g e U n i v e r s i t y P r e s s - R e v i e w C o p y R e v i e w C o p y - C a m b r i d g e U n i v e r s i t y P r e s s - R e v i e w C o p y R e v i e w C o p y - C a m b r i d g e U n i v e r s i t y P r e s s - R e v i e w C o p y R e v i e w C o p y - C a m b r i d g e U n i v e r s i t y Copyright Material - Review Only - Not for Redistribution
- 111. Unit 2: Number 101 Chapter 5: Fractions and standard form • Fraction • Vulgar fraction • Numerator • Denominator • Equivalent fraction • Simplest form • Lowest terms • Mixed number • Common denominator • Reciprocal • Percentage • Percentage increase • Percentage decrease • Reverse percentage • Standard form • Estimate Key words The Rhind Mathematical Papyrus is one of the earliest examples of a mathematical document. It is thought to have been written sometime between 1600 and 1700 BC by an Egyptian scribe called Ahmes, though it may be a copy of an older document. The first section of it is devoted to work with fractions. Fractions are not only useful for improving your arithmetic skills. You use them, on an almost daily basis, often without realising it. How far can you travel on half a tank of petrol? If your share of a pizza is two-thirds will you still be hungry? If three-fifths of your journey is complete how far do you still have to travel? A hairdresser needs to mix her dyes by the correct amount and a nurse needs the correct dilution of a drug for a patient. In this chapter you will learn how to: • find equivalent fractions • simplify fractions • add, subtract, multiply and divide fractions and mixed numbers • find fractions of numbers • find one number as a percentage of another • find a percentage of a number • calculate percentage increases and decreases • increase and decrease by a given percentage • handle reverse percentages (undoing increases and decreases) • work with standard form • make estimations without a calculator. EXTENDED e s s - R e v i e w C o p y - C a m b r i d g e U n i v e r s i t y P r e s s - R e v i e w C o p y R e v i e w C o p y - C a m b r i d g e U n i v e r s i t y P r e s s - R e v i e w C o p y R e v i e w C o p y - C a m b r i d g e U n i v e r s i t y P r e s s - R e v i e w C o p y R e v i e w C o p y - C a m b r i d g e U n i v e r s i t y Copyright Material - Review Only - Not for Redistribution
- 112. Unit 2: Number Cambridge IGCSE Mathematics 102 RECAP You should already be familiar with the following fractions work: Equivalent fractions Find equivalent fractions by multiplying or dividing the numerator and denominator by the same number. 1 2 × 4 4 = 4 8 1 2 and 4 8 are equivalent 40 50 ÷ 10 10 = 4 5 40 50 and 4 5 are equivalent To simplify a fraction you divide the numerator and denominator by the same number. 18 40 18 2 40 2 9 20 = ÷ ÷ = Mixed numbers Convert between mixed numbers and improper fractions: 3 4 7 4 7 25 7 = × + = ( ) 3 7 ( ) × + ( ) × + 3 7 × + 3 7 ( ) × + Calculating with fractions To add or subtract fractions make sure they have the same denominators. 7 8 1 3 21 8 24 29 24 5 24 + = + = = = = = + 1 To multiply fractions, multiply numerators by numerators and denominators by denominators. Write the answer in simplest form. Multiply to find a fraction of an amount. The word ‘of’ means multiply. 3 8 3 4 × = × = 9 32 3 8 of 12 3 8 12 1 36 8 1 2 = × = × = = 4 To divide by a fraction you multiply by its reciprocal. 12 1 3 12 3 1 ÷ = ÷ = × = × = 36 2 5 1 2 2 5 2 1 4 5 ÷ = × ÷ = × = Percentages The symbol % means per cent or per hundred. Percentages can be written as fractions and decimals. 45% = 45 100 = 9 20 45% = 45 ÷ 100 = 0.45 Calculating percentages To find a percentage of an amount: use fractions and cancel or use decimals or use a calculator 25% of 60 = 60 1 =15 15 25 100 × 1 41 0.25 × 60 = 15 2 5 % × 6 0 = 15 Number of data in that group, not individual values. Class intervals are equal and should not overlap. e s s - R e v i e w C o p y - C a m b r i d g e U n i v e r s i t y P r e s s - R e v i e w C o p y R e v i e w C o p y - C a m b r i d g e U n i v e r s i t y P r e s s - R e v i e w C o p y R e v i e w C o p y - C a m b r i d g e U n i v e r s i t y P r e s s - R e v i e w C o p y R e v i e w C o p y - C a m b r i d g e U n i v e r s i t y Copyright Material - Review Only - Not for Redistribution
- 113. Unit 2: Number 103 5 Fractions and standard form 5.1 Equivalent fractions A fraction is part of a whole number. Common fractions (also called vulgar fractions) are written in the form a b . The number on the top, a, can be any number and is called the numerator. The number on the bottom, b, can be any number except 0 and is called the denominator. The numerator and the denominator are separated by a horizontal line. If you multiply or divide both the numerator and the denominator by the same number, the new fraction still represents the same amount of the whole as the original fraction. The new fraction is known as an equivalent fraction. For example, 2 3 2 4 3 4 8 12 = 2 4 2 4 3 4 3 4 = and 25 35 25 5 35 5 5 7 = ÷ ÷ = . Notice in the second example that the original fraction 25 35 has been divided to smaller terms and that as 5 and 7 have no common factor other than 1, the fraction cannot be divided any further. The fraction is now expressed in its simplest form (sometimes called the lowest terms). So, simplifying a fraction means expressing it using the lowest possible terms. Worked example 1 Express each of the following in the simplest form possible. a 3 15 b 16 24 c 21 28 d 5 8 a 3 15 3 3 15 3 1 5 = 3 3 3 3 ÷ = b 16 24 16 8 24 8 2 3 = ÷ ÷ = c 21 28 21 7 28 7 3 4 = ÷ ÷ = d 5 8 is already in its simplest form (5 and 8 have no common factors other than 1). Worked example 2 Which two of 5 6 , 20 25 and 15 18 are equivalent fractions? Simplify each of the other fractions: 5 6 is already in its simplest form. 20 25 20 5 25 5 4 5 = ÷ ÷ = 15 18 15 3 18 3 5 6 = ÷ ÷ = So 5 6 and 15 18 are equivalent. You could have written: 15 18 5 6 = 5 6 This is called cancelling and is a shorter way of showing what you have done. Before reading this next section you should remind yourself about Highest Common Factors (HCFs) in chapter 1. REWIND You have come across simplifying in chapter 2 in the context of algebra. REWIND Percentages are particularly important when we deal with money. How often have you been in a shop where the signs tell you that prices are reduced by 10%? Have you considered a bank account and how money is added? The study of financial ideas forms the greater part of economics. LINK Notice that in each case you divide the numerator and the denominator by the HCF of both. e s s - R e v i e w C o p y - C a m b r i d g e U n i v e r s i t y P r e s s - R e v i e w C o p y R e v i e w C o p y - C a m b r i d g e U n i v e r s i t y P r e s s - R e v i e w C o p y R e v i e w C o p y - C a m b r i d g e U n i v e r s i t y P r e s s - R e v i e w C o p y R e v i e w C o p y - C a m b r i d g e U n i v e r s i t y Copyright Material - Review Only - Not for Redistribution
- 114. Unit 2: Number Cambridge IGCSE Mathematics 104 Exercise 5.1 1 By multiplying or dividing both the numerator and denominator by the same number, find three equivalent fractions for each of the following. a 5 9 b 3 7 c 12 18 d 18 36 e 110 128 2 Express each of the following fractions in its simplest form. a 7 21 b 3 9 c 9 12 d 15 25 e 500 2500 f 24 36 g 108 360 5.2 Operations on fractions Multiplying fractions When multiplying two or more fractions together you can simply multiply the numerators and then multiply the denominators. Sometimes you will then need to simplify your answer. It can be faster to cancel the fractions before you multiply. Worked example 3 Calculate: a 3 4 2 7 × b 5 7 3 × c 3 8 4 1 2 of a 3 4 2 7 3 2 4 7 6 28 3 14 × = × = 3 2 3 2 4 7 4 7 = = = = Notice that you can also cancel before multiplying: 3 4 2 7 3 1 2 7 3 14 × = × × = 1 2 Multiply the numerators to get the new numerator value. Then do the same with the denominators. Then express the fraction in its simplest form. Divide the denominator of the first fraction, and the numerator of the second fraction, by two. b 5 7 3 5 3 7 1 15 7 × = 3 × = 5 3 5 3 7 1 7 1 = 15 and 7 do not have a common factor other than 1 and so cannot be simplified. c 3 8 4 1 2 of Here, you have a mixed number (4 ( 1 2). This needs to be changed to an improper fraction (sometimes called a top heavy fraction), which is a fraction where the numerator is larger than the denominator. This allows you to complete the multiplication. 3 8 4 3 8 9 2 27 16 1 2 × = × = 4 × = 2 × = × = × = Notice that the word ‘of’ is replaced with the × sign. To multiply a fraction by an integer you only multiply the numerator by the integer. For example, 5 7 3 5 3 7 15 7 × = 3 × = 5 3 5 3 = . Exercise 5.2 Evaluate each of the following. 1 a 2 3 5 9 × b 1 2 3 7 × c 1 4 8 9 × d 2 7 14 16 × 2 a 50 128 256 500 × b 1 2 7 1 3 × c 2 7 8 2 7 × d 4 5 2 7 of 3 e 1 1 3 of 24 f 5 1 2 1 4 ×7 g 8 8 9 1 4 ×20 h 7 2 3 1 2 ×10 To change a mixed number to a vulgar fraction, multiply the whole number part (in this case 4) by the denominator and add it to the numerator. So: 4 4 2 1 2 9 2 1 2 = × + 4 2 × + 4 2 = e s s - R e v i e w C o p y - C a m b r i d g e U n i v e r s i t y P r e s s - R e v i e w C o p y R e v i e w C o p y - C a m b r i d g e U n i v e r s i t y P r e s s - R e v i e w C o p y R e v i e w C o p y - C a m b r i d g e U n i v e r s i t y P r e s s - R e v i e w C o p y R e v i e w C o p y - C a m b r i d g e U n i v e r s i t y Copyright Material - Review Only - Not for Redistribution
- 115. Unit 2: Number 105 5 Fractions and standard form Adding and subtracting fractions You can only add or subtract fractions that are the same type. In other words, they must have the same denominator. This is called a common denominator. You must use what you know about equivalent fractions to help you make sure fractions have a common denominator. The following worked example shows how you can use the LCM of both denominators as the common denominator. Worked example 4 Write each of the following as a single fraction in its simplest form. a 1 2 1 4 + b 3 4 5 6 + c 2 3 4 1 5 7 − a 1 2 1 4 2 4 1 4 3 4 + = + = + = Find the common denominator. The LCM of 2 and 4 is 4. Use this as the common denominator and find the equivalent fractions. Then add the numerators. b 3 4 5 6 9 12 10 12 19 12 1 7 12 + = + = + = = Find the common denominator. The LCM of 4 and 6 is 12. Use this as the common denominator and find the equivalent fractions. Add the numerators. Change an improper fraction to a mixed number. c 2 3 4 1 5 7 11 4 12 7 77 28 48 28 77 48 28 29 28 1 1 28 − = − = − = − = − = − = = Change mixed numbers to improper fractions to make them easier to handle. The LCM of 4 and 7 is 28, so this is the common denominator. Find the equivalent fractions. Subtract one numerator from the other. Change an improper fraction to a mixed number. Notice that, once you have a common denominator, you only add the numerators. Never add the denominators! You will sometimes find that two fractions added together can result in an improper fraction (sometimes called a top-heavy fraction). Usually you will re-write this as a mixed number. Egyptian fractions An Egyptian fraction is the sum of any number of different fractions (different denominators) each with numerator one. For example 1 2 1 3 + is the Egyptian fraction that represents 5 6 . Ancient Egyptians used to represent single fractions in this way but in modern times we tend to prefer the single fraction that results from finding a common denominator. Exercise 5.3 Evaluate the following. 1 a 1 3 1 3 + b 3 7 2 7 + c 5 8 3 8 − d 5 9 8 9 + e 1 6 1 5 + f 2 3 5 8 − g 2 1 2 1 5 2 1 2 1 8 2 1 2 1 3 4 2 1 2 1 h 5 3 5 3 1 5 3 5 3 8 5 3 5 3 1 16 5 3 5 3 You will need to use the lowest common multiple (LCM) in this section. You met this in chapter 1. REWIND Tip Egyptian fractions are a good example of manipulating fractions but they are not in the syllabus. The same rules apply for subtracting fractions as adding them. e s s - R e v i e w C o p y - C a m b r i d g e U n i v e r s i t y P r e s s - R e v i e w C o p y R e v i e w C o p y - C a m b r i d g e U n i v e r s i t y P r e s s - R e v i e w C o p y R e v i e w C o p y - C a m b r i d g e U n i v e r s i t y P r e s s - R e v i e w C o p y R e v i e w C o p y - C a m b r i d g e U n i v e r s i t y Copyright Material - Review Only - Not for Redistribution
- 116. Unit 2: Number Cambridge IGCSE Mathematics 106 2 a 4 2 3 − b 6 5 11 + c 11 7 1 4 + d 11 7 1 4 − e 3 4 3 4 1 3 4 3 4 2 1 3 3 4 3 4 f 5 3 5 3 4 1 5 3 5 3 4 5 3 5 3 1 16 3 8 + + + + 5 3 + + 5 3 g 5 3 5 3 4 1 5 3 5 3 8 5 3 1 16 3 4 − + − + 5 3 − + 5 3 h 1 2 1 2 1 1 1 2 1 2 3 2 5 1 4 + − + − 1 2 + − 1 2 i 3 7 2 3 14 8 + × + × j 3 2 3 2 1 3 2 3 2 2 3 2 1 4 4 3 − × − × 3 2 − × 3 2 k 3 1 3 1 7 1 3 1 3 1 6 3 1 3 1 1 2 3 4 − + − + 3 1 − + 3 1 l 2 3 2 3 4 1 2 3 2 3 4 2 3 2 3 1 3 1 5 − + − + 2 3 − + 2 3 3 − + 3 Find Egyptian fractions for each of the following. a 3 4 b 2 3 c 5 8 d 3 16 Dividing fractions Before describing how to divide two fractions, the reciprocal needs to be introduced. The reciprocal of any fraction can be obtained by swapping the numerator and the denominator. So, the reciprocal of 3 4 is 4 3 and the reciprocal of 7 2 is 2 7 . Also the reciprocal of 1 2 is 2 1 or just 2 and the reciprocal of 5 is 1 5 . If any fraction is multiplied by its reciprocal then the result is always 1. For example: 1 3 3 1 1 × = × = , 3 8 8 3 1 × = × = and a b b a × = × = 1 To divide one fraction by another fraction, you simply multiply the first fraction by the reciprocal of the second. Look at the example below: a b c d a b c d ÷ = ÷ = Now multiply both the numerator and denominator by bd and cancel: a b c d a b c d a b b bd bd c d d bd bd ad bc a b d c ÷ = ÷ = = × × = = = = × Remember to use BODMAS here. Think which two fractions with a numerator of 1 might have an LCM equal to the denominator given. The multiplication, division, addition and subtraction of fractions will be revisited in chapter 14 when algebraic fractions are considered. FAST FORWARD Worked example 5 Evaluate each of the following. a 3 4 1 2 ÷ b 1 3 4 2 1 3 ÷ c 5 8 2 ÷ d 6 7 3 ÷ a 1 2 3 4 1 2 3 4 2 1 3 2 1 1 2 ÷ = × = = Multiply by the reciprocal of 1 2 . Use the rules you have learned about multiplying fractions. e s s - R e v i e w C o p y - C a m b r i d g e U n i v e r s i t y P r e s s - R e v i e w C o p y R e v i e w C o p y - C a m b r i d g e U n i v e r s i t y P r e s s - R e v i e w C o p y R e v i e w C o p y - C a m b r i d g e U n i v e r s i t y P r e s s - R e v i e w C o p y R e v i e w C o p y - C a m b r i d g e U n i v e r s i t y Copyright Material - Review Only - Not for Redistribution
- 117. Unit 2: Number 107 5 Fractions and standard form Exercise 5.4 Evaluate each of the following. 1 1 7 1 3 ÷ 2 2 5 3 7 ÷ 3 4 9 7 ÷ 4 10 11 5 ÷ 5 4 1 5 1 7 ÷ 6 3 1 5 5 2 3 ÷ 7 7 7 8 5 1 12 ÷ 8 3 1 4 3 1 2 ÷ 9 Evaluate a 2 1 3 1 2 5 1 1 3 − ÷ b 2 1 3 1 2 5 1 1 3 − ÷ Fractions with decimals Sometimes you will find that either the numerator or the denominator, or even both, are not whole numbers! To express these fractions in their simplest forms you need to • make sure both the numerator and denominator are converted to an integer by finding an equivalent fraction • check that the equivalent fraction has been simplified. b 1 1 1 3 4 2 1 3 7 4 7 3 7 4 3 7 3 4 ÷ = ÷ = × = Convert the mixed fractions to improper fractions. Multiply by the reciprocal of 7 3 . c 5 8 2 5 8 2 1 5 8 1 2 5 16 ÷ = ÷ = × = Write 2 as an improper fraction. Multiply by the reciprocal of 2 1 . d 2 1 6 7 3 6 7 1 3 2 7 ÷ = × = To divide a fraction by an integer you can either just multiply the denominator by the integer, or divide the numerator by the same integer. Worked example 6 Simplify each of the following fractions. a 0 1 3 0 1 0 1 b 1 3 2 4 1 3 1 3 2 4 2 4 c 36 0 12 0 1 0 1 a 0 1 3 0 1 10 3 10 1 30 . . 0 1 . . 0 1 0 1 . . 0 1 = × 3 1 3 1 = Multiply 0.1 by 10 to convert 0.1 to an integer. To make sure the fraction is equivalent, you need to do the same to the numerator and the denominator, so multiply 3 by 10 as well. b 1 3 2 4 1 3 10 2 4 10 13 24 1 3 1 3 2 4 2 4 1 3 1 3 2 4 2 4 = × × = Multiply both the numerator and denominator by 10 to get integers. 13 and 24 do not have a HCF other than 1 so cannot be simplified. c 36 0 12 36 100 0 12 100 3600 12 300 . . 0 1 . . 0 12 . . 0 1 . . 0 1 = × × = = = = Multiply 0.12 by 100 to produce an integer. Remember to also multiply the numerator by 100, so the fraction is equivalent. The final fraction can be simplified by cancelling. e s s - R e v i e w C o p y - C a m b r i d g e U n i v e r s i t y P r e s s - R e v i e w C o p y R e v i e w C o p y - C a m b r i d g e U n i v e r s i t y P r e s s - R e v i e w C o p y R e v i e w C o p y - C a m b r i d g e U n i v e r s i t y P r e s s - R e v i e w C o p y R e v i e w C o p y - C a m b r i d g e U n i v e r s i t y Copyright Material - Review Only - Not for Redistribution
- 118. Unit 2: Number Cambridge IGCSE Mathematics 108 E Exercise 5.5 Simplify each of the following fractions. 1 0 3 12 0 3 0 3 2 0 4 0 5 0 4 0 4 0 5 0 5 3 6 0 7 0 7 0 7 4 0 7 0 14 0 7 0 7 0 1 0 1 5 36 1 5 1 5 1 5 6 0 3 5 12 0 3 0 3 × 7 0 4 1 5 1 6 0 4 0 4 1 5 1 5 1 6 1 6 × 8 2 8 0 7 1 44 0 6 2 8 2 8 0 7 0 7 . 1 4 1 4 0 6 0 6 × Further calculations with fractions You can use fractions to help you solve problems. Remember for example, that 2 3 2 1 3 = × 2 = × and that, although this may seem trivial, this simple fact can help you to solve problems easily. Worked example 7 Suppose that 2 5 of the students in a school are girls. If the school has 600 students, how many girls are there? 2 5 2 5 600 2 5 600 120 1 1 2 120 240 girls of 600 = = = × × = × Worked example 8 Now imagine that 2 5 of the students in another school are boys, and that there are 360 boys. How many students are there in the whole school? 2 5 of the total is 360, so 1 5 of the total must be half of this, 180. This means that 5 5 of the population, that is all of it, is 5 × 180 = 900 students in total. Exercise 5.6 1 3 4 of the people at an auction bought an item. If there are 120 people at the auction, how many bought something? 2 An essay contains 420 sentences. 80 of these sentences contain typing errors. What fraction (given in its simplest form) of the sentences contain errors? 3 28 is 2 7 of which number? 4 If 3 5 of the people in a theatre buy a snack during the interval, and of those who buy a snack 5 7 buy ice cream, what fraction of the people in the theatre buy ice cream? 5 Andrew, Bashir and Candy are trying to save money for a birthday party. If Andrew saves 1 4 of the total needed, Bashir saves 2 5 and Candy saves 1 10 , what fraction of the cost of the party is left to pay? 6 Joseph needs 6 1 2 cups of cooked rice for a recipe of Nasi Goreng. If 2 cups of uncooked rice with 2 1 2 cups of water make 4 1 3 cups of cooked rice, how many cups of uncooked rice does Joseph need for his recipe ? How much water should he add ? Remember that any fraction that contains a decimal in either its numerator or denominator will not be considered to be simplified. What fraction can be used to represent 0.3? Remember in worked example 3, you saw that ‘of’ is replaced by ×. e s s - R e v i e w C o p y - C a m b r i d g e U n i v e r s i t y P r e s s - R e v i e w C o p y R e v i e w C o p y - C a m b r i d g e U n i v e r s i t y P r e s s - R e v i e w C o p y R e v i e w C o p y - C a m b r i d g e U n i v e r s i t y P r e s s - R e v i e w C o p y R e v i e w C o p y - C a m b r i d g e U n i v e r s i t y Copyright Material - Review Only - Not for Redistribution
- 119. Unit 2: Number 109 5 Fractions and standard form 5.3 Percentages A percentage is a fraction with a denominator of 100. The symbol used to represent percentage is %. To find 40% of 25, you simply need to find 40 100 of 25. Using what you know about multiplying fractions: 1 5 5 2 40 100 25 40 100 25 1 2 5 25 1 2 1 5 1 10 × = × = × = × = ∴ 40% of 25 = 10 Equivalent forms A percentage can be converted into a decimal by dividing by 100 (notice that the digits move two places to the right). So, 45 45 100 % = = 0.45 and 3 1 3 1 100 . % . = = 0.031. A decimal can be converted to a percentage by multiplying by 100 (notice that the digits move two places to the left). So, 0 65 65 100 65 . % = = and 0.7 × 100 = 70%. Converting percentages to vulgar fractions (and vice versa) involves a few more stages. Worked example 9 Convert each of the following percentages to fractions in their simplest form. a 25% b 30% c 3.5% a 25 25 100 1 4 % = = = = Write as a fraction with a denominator of 100, then simplify. b 30 30 100 3 10 % = = = = Write as a fraction with a denominator of 100, then simplify. c 3 5 3 5 100 35 1000 7 200 . % 3 5 . % 3 5 3 5 3 5 = = = = = Write as a fraction with a denominator of 100, then simplify. Remember that a fraction that contains a decimal is not in its simplest form. Worked example 10 Convert each of the following fractions into percentages. a 1 20 b 1 8 a 1 20 1 5 20 5 5 100 5 = 1 5 1 5 × = = = = % Find the equivalent fraction with a denominator of 100. (Remember to do the same thing to both the numerator and denominator). 5 100 0 05 0 05 100 5 = = 0 0 = = 5 0 = = . , 0 0 . , 0 05 0 . , 5 0. % 05 . % 100 . % 5 . % = = . % 05 = = . % = = 100 = = . % = = . % . % = = . % = = . % e s s - R e v i e w C o p y - C a m b r i d g e U n i v e r s i t y P r e s s - R e v i e w C o p y R e v i e w C o p y - C a m b r i d g e U n i v e r s i t y P r e s s - R e v i e w C o p y R e v i e w C o p y - C a m b r i d g e U n i v e r s i t y P r e s s - R e v i e w C o p y R e v i e w C o p y - C a m b r i d g e U n i v e r s i t y Copyright Material - Review Only - Not for Redistribution
- 120. Unit 2: Number Cambridge IGCSE Mathematics 110 b 1 8 1 12 5 8 12 5 12 5 100 12 5 = 1 1 1 1 8 1 8 1 = = = = 2 5 2 5 2 5 2 5 . . % 5 . % Find the equivalent fraction with a denominator of 100. (Remember to do the same thing to both the numerator and denominator). 12 5 100 0 125 0 125 100 12 5 . . , 125 . , . . 125 . . 100 . . 12 . . % = = 100 = = = = 0 = = 125 = = 0 = = 125 = = × . . . . = = = = Although it is not always easy to find an equivalent fraction with a denominator of 100, any fraction can be converted into a percentage by multiplying by 100 and cancelling. Worked example 11 Convert the following fractions into percentages: a 3 40 b 8 15 a 3 40 100 1 30 4 15 2 7 5 3 40 7 5 × = × = = = = = = . , 7 5 . , 7 5 . % 7 5 . % 7 5 so b 8 15 100 1 160 3 53 3 1 8 15 53 3 × = × = = = . ( 3 1 . ( 3 1 . ), . % 3 . % d p . ) d p . ) . . ) . . ), . so (1d.p.) Exercise 5.7 1 Convert each of the following percentages into fractions in their simplest form. a 70% b 75% c 20% d 36% e 15% f 2.5% g 215% h 132% i 117.5% j 108.4% k 0.25% l 0.002% 2 Express the following fractions as percentages. a 3 5 b 7 25 c 17 20 d 3 10 e 8 200 f 5 12 Finding one number as a percentage of another To write one number as a percentage of another number, you start by writing the first number as a fraction of the second number then multiply by 100. Worked example 12 Worked example 12 a Express 16 as a percentage of 48. 16 48 16 48 100 33 3 16 48 1 3 100 33 3 = × = × = = × = × = . % 3 . % . % 3 . % (1d.p.) (1d.p.) First, write 16 as a fraction of 48, then multiply by 100. This may be easier if you write the fraction in its simplest form first. b Express 15 as a percentage of 75. 15 75 100 1 5 100 20 × = × = × = % Write 15 as a fraction of 75, then simplify and multiply by 100. You know that 100 divided by 5 is 20, so you don’t need a calculator. Later in the chapter you will see that a percentage can be greater than 100. e s s - R e v i e w C o p y - C a m b r i d g e U n i v e r s i t y P r e s s - R e v i e w C o p y R e v i e w C o p y - C a m b r i d g e U n i v e r s i t y P r e s s - R e v i e w C o p y R e v i e w C o p y - C a m b r i d g e U n i v e r s i t y P r e s s - R e v i e w C o p y R e v i e w C o p y - C a m b r i d g e U n i v e r s i t y Copyright Material - Review Only - Not for Redistribution
- 121. Unit 2: Number 111 5 Fractions and standard form Exercise 5.8 Where appropriate, give your answer to 3 significant figures. 1 Express 14 as a percentage of 35. 2 Express 3.5 as a percentage of 14. 3 Express 17 as a percentage of 63. 4 36 people live in a block of flats. 28 of these people jog around the park each morning. What percentage of the people living in the block of flats go jogging around the park? 5 Jack scores 19 24 in a test. What percentage of the marks did Jack get? 6 Express 1.3 as a percentage of 5.2. 7 Express 0.13 as a percentage of 520. Percentage increases and decreases Suppose the cost of a book increases from $12 to $15. The actual increase is $3. As a fraction of the original value, the increase is 3 12 1 4 = . This is the fractional change and you can write this fraction as 25%. In this example, the value of the book has increased by 25% of the original value. This is called the percentage increase. If the value had reduced (for example if something was on sale in a shop) then it would have been a percentage decrease. Note carefully: whenever increases or decreases are stated as percentages, they are stated as percentages of the original value. Worked example 13 The value of a house increases from $120000 to $124800 between August and December. What percentage increase is this? $124800 − $120000 = $4800 First calculate the increase. Write the increase as a fraction of the original and multiply by 100. Then do the calculation (either in your head or using a calculator). % % % % increas % % increas % % e % % % % increas % % increas % % e % % % % origina % % original % % % % % % = × % % % % = × % % % % = × = × = × % % % % 100 % % 100 % % 4800 120000 100% % % % Exercise 5.9 Applying your skills Where appropriate, give your answer to the nearest whole percent. 1 Over a five-year period, the population of the state of Louisiana in the United States of America decreased from 4468976 to 4287768. Find the percentage decrease in the population of Louisiana in this period. 2 Sunil bought 38 CDs one year and 46 the next year. Find the percentage increase. c Express 18 as a percentage of 23. You need to calculate 18 23 100 × , but this is not easy using basic fractions because you cannot simplify it further, and 23 does not divide neatly into 100. Fortunately, you can use your calculator. Simply type: 1 8 ÷ 2 3 × 1 0 0 = 78.26% (2 d.p.) e s s - R e v i e w C o p y - C a m b r i d g e U n i v e r s i t y P r e s s - R e v i e w C o p y R e v i e w C o p y - C a m b r i d g e U n i v e r s i t y P r e s s - R e v i e w C o p y R e v i e w C o p y - C a m b r i d g e U n i v e r s i t y P r e s s - R e v i e w C o p y R e v i e w C o p y - C a m b r i d g e U n i v e r s i t y Copyright Material - Review Only - Not for Redistribution
- 122. Unit 2: Number Cambridge IGCSE Mathematics 112 3 A theatre has enough seats for 450 audience members. After renovation it is expected that this number will increase to 480. Find the percentage increase. 4 Sally works in an electrical component factory. On Monday she makes a total of 363 components but on Tuesday she makes 432. Calculate the percentage increase. 5 Inter Polation Airlines carried a total of 383402 passengers one year and 287431 the following year. Calculate the percentage decrease in passengers carried by the airline. 6 A liquid evaporates steadily. In one hour the mass of liquid in a laboratory container decreases from 0.32kg to 0.18kg. Calculate the percentage decrease. Increasing and decreasing by a given percentage If you know what percentage you want to increase or decrease an amount by, you can find the actual increase or decrease by finding a percentage of the original. If you want to know the new value you either add the increase to or subtract the decrease from the original value. Worked example 14 Increase 56 by: a 10% b 15% c 4% a 10 56 10 100 56 1 10 56 5 6 % 5 6 5 6 of = × = × = × = × = 56 + 5.6 = 61.6 First of all, you need to calculate 10% of 56 to work out the size of the increase. To increase the original by 10% you need to add this to 56. If you don’t need to know the actual increase but just the final value, you can use this method: If you consider the original to be 100% then adding 10% to this will give 110% of the original. So multiply 56 by 110 100 , which gives 61.6. b 115 100 56 64 4 × = 56 × = . A 15% increase will lead to 115% of the original. c 104 100 56 58 24 × = 56 × = . A 4% increase will lead to 104% of the original. Remember that you are always considering a percentage of the original value. Worked example 15 In a sale all items are reduced by 15%. If the normal selling price for a bicycle is $120 calculate the sale price. 100 − 15 = 85 85 100 × $120 = $102 Note that reducing a number by 15% leaves you with 85% of the original. So you simply find 85% of the original value. Exercise 5.10 1 Increase 40 by: a 10% b 15% c 25% d 5% e 4% 2 Increase 53 by: a 50% b 84% c 13.6% d 112% e 1 2 % e s s - R e v i e w C o p y - C a m b r i d g e U n i v e r s i t y P r e s s - R e v i e w C o p y R e v i e w C o p y - C a m b r i d g e U n i v e r s i t y P r e s s - R e v i e w C o p y R e v i e w C o p y - C a m b r i d g e U n i v e r s i t y P r e s s - R e v i e w C o p y R e v i e w C o p y - C a m b r i d g e U n i v e r s i t y Copyright Material - Review Only - Not for Redistribution
- 123. Unit 2: Number 113 5 Fractions and standard form 3 Decrease 124 by: a 10% b 15% c 30% d 4% e 7% 4 Decrease 36.2 by: a 90% b 35.4% c 0.3% d 100% e 1 2 % Applying your skills 5 Shajeen usually works 30 hours per week but decides that he needs to increase this by 10% to be sure that he can save enough for a holiday. How many hours per week will Shajeen need to work? 6 12% sales tax is applied to all items of clothing sold in a certain shop. If a T-shirt is advertised for $12 (before tax) what will be the cost of the T-shirt once tax is added? 7 The Oyler Theatre steps up its advertising campaign and manages to increase its audiences by 23% during the year. If 21300 people watched plays at the Oyler Theatre during the previous year, how many people watched plays in the year of the campaign? 8 The population of Trigville was 153000 at the end of a year. Following a flood, 17% of the residents of Trigville moved away. What was the population of Trigville after the flood? 9 Anthea decides that she is watching too much television. If Anthea watched 12 hours of television in one week and then decreased this by 12% the next week, how much time did Anthea spend watching television in the second week? Give your answer in hours and minutes to the nearest minute. Reverse percentages Sometimes you are given the value or amount of an item after a percentage increase or decrease has been applied to it and you need to know what the original value was. To solve this type of reverse percentage question it is important to remember that you are always dealing with percentages of the original values. The method used in worked example 14 (b) and (c) is used to help us solve these type of problems. Worked example 16 A store is holding a sale in which every item is reduced by 10%. A jacket in this sale is sold for $108. How can you find the original price of the Jacket? 90 100 × = x × = × = 108 x = × = × 100 90 108 original price = $120. If an item is reduced by 10%, the new cost is 90% of the original (100–10). If x is the original value of the jacket then you can write a formula using the new price. Notice that when the × 90 100 was moved to the other side of the = sign it became its reciprocal, 100 90 . Important: Undoing a 10% decrease is not the same as increasing the reduced value by 10%. If you increase the sale price of $108 by 10% you will get 110 100 × $108 = $118.80 which is a different (and incorrect) answer. E e s s - R e v i e w C o p y - C a m b r i d g e U n i v e r s i t y P r e s s - R e v i e w C o p y R e v i e w C o p y - C a m b r i d g e U n i v e r s i t y P r e s s - R e v i e w C o p y R e v i e w C o p y - C a m b r i d g e U n i v e r s i t y P r e s s - R e v i e w C o p y R e v i e w C o p y - C a m b r i d g e U n i v e r s i t y Copyright Material - Review Only - Not for Redistribution
- 124. Unit 2: Number Cambridge IGCSE Mathematics 114 Exercise 5.11 1 If 20% of an amount is 35, what is 100%? 2 If 35% of an amount is 127, what is 100%? 3 245 is 12.5% of an amount. What is the total amount? 4 The table gives the sale price and the % by which the price was reduced for a number of items. Copy the table, then complete it by calculating the original prices. Sale price ($) % reduction Original price ($) 52.00 10 185.00 10 4700.00 5 2.90 5 24.50 12 10.00 8 12.50 7 9.75 15 199.50 20 99.00 25 5 A shop keeper marks up goods by 22% before selling them. The selling price of ten items are given below. For each one, work out the cost price (the price before the mark up). a $25.00 b $200.00 c $14.50 d $23.99 e $15.80 f $45.80 g $29.75 h $129.20 i $0.99 j $0.80 6 Seven students were absent from a class on Monday. This is 17.5% of the class. a How many students are there in the class in total? b How many students were present on Monday? 7 A hat shop is holding a 10% sale. If Jack buys a hat for $18 in the sale, how much did the hat cost before the sale? 8 Nick is training for a swimming race and reduces his weight by 5% over a 3-month period. If Nick now weighs 76kg how much did he weigh before he started training? 9 The water in a pond evaporates at a rate of 12% per week. If the pond now contains 185 litres of water, approximately how much water was in the pond a week ago? 5.4 Standard form When numbers are very small, like 0.0000362, or very large, like 358000000, calculations can be time consuming and it is easy to miss out some of the zeros. Standard form is used to express very small and very large numbers in a compact and efficient way. In standard form, numbers are written as a number multiplied by 10 raised to a given power. Standard form for large numbers The key to standard form for large numbers is to understand what happens when you multiply by powers of 10. Each time you multiply a number by 10 each digit within the number moves one place order to the left (notice that this looks like the decimal point has moved one place to the right). 3.2 3.2 × 10 = 32.0 The digits have moved one place order to the left. 3.2 × 102 = 3.2 × 100 = 320.0 The digits have moved two places. 3.2 × 103 = 3.2 × 1000 = 3200.0 The digits have moved three places. ... and so on. You should see a pattern forming. Remember that digits are in place order: 1000s 100s 10s units 10ths 100ths 1000ths 3 0 0 0 • 0 0 0 E e s s - R e v i e w C o p y - C a m b r i d g e U n i v e r s i t y P r e s s - R e v i e w C o p y R e v i e w C o p y - C a m b r i d g e U n i v e r s i t y P r e s s - R e v i e w C o p y R e v i e w C o p y - C a m b r i d g e U n i v e r s i t y P r e s s - R e v i e w C o p y R e v i e w C o p y - C a m b r i d g e U n i v e r s i t y Copyright Material - Review Only - Not for Redistribution
- 125. Unit 2: Number 115 5 Fractions and standard form Any large number can be expressed in standard form by writing it as a number between 1 and 10 multiplied by a suitable power of 10. To do this write the appropriate number between 1 and 10 first (using the non-zero digits of the original number) and then count the number of places you need to move the first digit to the left. The number of places tells you by what power, 10 should be multiplied. Worked example 17 Write 320000 in standard form. 3.2 Start by finding the number between 1 and 10 that has the same digits in the same order as the original number. Here, the extra 4 zero digits can be excluded because they do not change the size of your new number. 3 2 0 0 0 0.0 3.2 4 5 3 2 1 Now compare the position of the first digit in both numbers: ‘3’ has to move 5 place orders to the left to get from the new number to the original number. 320000 = 3.2 × 10⁵ The first digit, ‘3’, has moved five places. So, you multiply by 105 . Calculating using standard form Once you have converted large numbers into standard form, you can use the index laws to carry out calculations involving multiplication and division. The laws of indices can be found in chapter 2. REWIND Worked example 18 Solve and give your answer in standard form. a ( ) ( ) ( ) 3 1 ( ) ( ) 0 2 ( ) 0 2 ( ) 0 2 ( ) ( ) 0 2 ( ) ( ) 10 ( ) 5 6 ( ) 5 6 ( ) ( ) 5 6 ( ) 0 2 5 6 ( ) 0 2 5 6 ( ) 0 2 ( ) 0 2 ( ) 5 6 0 2 ( ) 10 ( ) 5 6 10 ( ) × × ( ) 3 1 ( ) × × ( ) 3 10 2 × × 0 2 ( ) 0 2 ( ) × × 0 2 0 2 5 6 × × 0 2 5 6 ( ) 0 2 5 6 ( ) 0 2 × × 0 2 ( ) 5 6 0 2 ( ) ( ) ( ) 5 6 ( ) 5 6 b ( ) ( ) ( ) 2 1 ( ) ( ) 0 8 ( ) 0 8 ( ) 0 8 ( ) ( ) 0 8 ( ) ( ) 10 ( ) 3 7 ( ) 3 7 ( ) ( ) 3 7 ( ) 0 8 3 7 ( ) 0 8 3 7 ( ) 0 8 ( ) 0 8 ( ) 3 7 0 8 ( ) 10 ( ) 3 7 10 ( ) × × ( ) 2 1 ( ) × × ( ) 2 10 8 × × 0 8 ( ) 0 8 ( ) × × 0 8 0 8 3 7 × × 0 8 3 7 ( ) 0 8 3 7 ( ) 0 8 × × 0 8 ( ) 3 7 0 8 ( ) ( ) ( ) 3 7 ( ) 3 7 c ( . ) ( . ) 2 8 ( . 2 8 ( . 10 1 4 . ) 1 4 . ) . ) 10 . ) 6 4 ) ( 6 4 . ) 6 4 . ) 1 4 6 4 . ) 1 4 . ) 6 4 1 4 . ) 10 . ) 6 4 10 × ÷ ) ( × ÷ ) ( 10 × ÷ 6 4 × ÷ ) ( 6 4 × ÷ ) ( 6 4 . ) . ) . ) 6 4 . ) 6 4 d ( ) ( ) ( ) 9 1 ( ) ( ) 0 3 ( ) 0 3 ( ) 0 3 ( ) ( ) 0 3 ( ) ( ) 10 ( ) 6 8 ( ) 6 8 ( ) ( ) 6 8 ( ) 0 3 6 8 ( ) 0 3 6 8 ( ) 0 3 ( ) 0 3 ( ) 6 8 0 3 ( ) 10 ( ) 6 8 10 ( ) × + ( ) 9 1 ( ) × + ( ) 9 10 3 × + 0 3 ( ) 0 3 ( ) × + 0 3 0 3 6 8 × + 0 3 6 8 ( ) 0 3 6 8 ( ) 0 3 × + 0 3 ( ) 6 8 0 3 ( ) ( ) ( ) 6 8 ( ) 6 8 a ( ) ( ) ( ) ( ) ( ) 3 1 ( ) 0 2 ( ) 0 2 ( ) ( ) 0 2 ( ) ( ) 10 ( ) ( ) 3 2 ( ) ( ) 10 ( ) ( ) 10 ( ) 6 10 6 10 5 6 ( ) 5 6 ( ) ( ) 5 6 ( ) 0 2 5 6 ( ) 0 2 5 6 ( ) 0 2 ( ) 0 2 ( ) 5 6 0 2 ( ) 10 ( ) 5 6 10 5 6 ( ) 5 6 ( ) ( ) 10 ( ) 5 6 10 5 6 11 ( ) × × ( ) 3 1 ( ) × × ( ) 3 10 2 × × 0 2 ( ) 0 2 ( ) × × 0 2 0 2 5 6 × × 0 2 5 6 ( ) 0 2 5 6 ( ) 0 2 × × 0 2 ( ) 5 6 0 2 × = ( ) × = ( ) ( ) 10 ( ) × = 10 ( ) 5 6 ( ) × = ( ) 5 6 ( ) 10 ( ) 5 6 10 × = 10 ( ) 5 6 10 × × ( ) × × ( ) 3 2 ( ) × × ( ) 3 2 ( ) ( ) ( ) 5 6 ( ) 5 6 = × 6 1 = × 6 1 = × 6 1 = × 6 1 5 6 5 6 Simplify by putting like terms together. Use the laws of indices where appropriate. Write the number in standard form. You may be asked to convert your answer to an ordinary number. To convert 6 × 10¹¹ into an ordinary number, the ‘6’ needs to move 11 places to the left: 11 10 9 8 7 6 5 4 3 2 1 6.0 × 10 6 0 0 0 0 0 0 0 0 0 0 11 = 0.0 b ( ) ( ) ( ) ( ) ( ) 2 1 ( ) 0 8 ( ) 0 8 ( ) ( ) 0 8 ( ) ( ) 10 ( ) ( ) 2 8 ( ) ( ) 10 ( ) ( ) 10 ( ) 16 10 3 7 ( ) 3 7 ( ) ( ) 3 7 ( ) 0 8 3 7 ( ) 0 8 3 7 ( ) 0 8 ( ) 0 8 ( ) 3 7 0 8 ( ) 10 ( ) 3 7 10 3 7 ( ) 3 7 ( ) ( ) 10 ( ) 3 7 10 10 ( ) × × ( ) 2 1 ( ) × × ( ) 2 10 8 × × 0 8 ( ) 0 8 ( ) × × 0 8 0 8 3 7 × × 0 8 3 7 ( ) 0 8 3 7 ( ) 0 8 × × 0 8 ( ) 3 7 0 8 × = ( ) × = ( ) ( ) 10 ( ) × = 10 ( ) 3 7 ( ) × = ( ) 3 7 ( ) 10 ( ) 3 7 10 × = 10 ( ) 3 7 10 × × ( ) × × ( ) 2 8 ( ) × × ( ) 2 8 ( ) ( ) ( ) 3 7 ( ) 3 7 = × 16 = × 16 10 1 6 10 10 1 6 10 10 10 11 × = 10 × = 10 × = × × 10 × × = × 1 6 = × 1 6 1 6 1 6 1 6 1 6 = × 1 6 = × The answer 16 × 1010 is numerically correct but it is not in standard form because 16 is not between 1 and 10. You can change it to standard form by thinking of 16 as 1.6 × 10. c ( . ) ( . ) 2 8 ( . 2 8 ( . 10 1 4 . ) 1 4 . ) . ) 10 . ) 2 8 . 2 8 10 1 4 . 1 4 10 2 8 . 2 8 1 4 . 1 4 10 10 2 10 2 6 4 ) ( 6 4 . ) 6 4 . ) 1 4 6 4 . ) 1 4 . ) 6 4 1 4 . ) 10 . ) 6 4 10 6 4 6 4 6 4 × ÷ ) ( × ÷ ) ( 10 × ÷ 6 4 × ÷ ) ( 6 4 × ÷ ) ( 6 4 × = . ) × = . ) . ) 10 . ) × = 10 . ) 6 4 . ) × = . ) 6 4 . ) 10 . ) 6 4 10 × = 10 . ) 6 4 10 × × = × = × = × 2 1 = × 2 1 = 6 4 6 4 × ×102 Simplify by putting like terms together. Use the laws of indices. Although it is the place order that is changing; it looks like the decimal point moves to the right. When you solve problems in standard form you need to check your results carefully. Always be sure to check that your final answer is in standard form. Check that all conditions are satisfied. Make sure that the number part is between 1 and 10. e s s - R e v i e w C o p y - C a m b r i d g e U n i v e r s i t y P r e s s - R e v i e w C o p y R e v i e w C o p y - C a m b r i d g e U n i v e r s i t y P r e s s - R e v i e w C o p y R e v i e w C o p y - C a m b r i d g e U n i v e r s i t y P r e s s - R e v i e w C o p y R e v i e w C o p y - C a m b r i d g e U n i v e r s i t y Copyright Material - Review Only - Not for Redistribution
- 126. Unit 2: Number Cambridge IGCSE Mathematics 116 To make it easier to add up the ordinary numbers make sure they are lined up so that the place values match: 300000000 + 9000000 Exercise 5.12 1 Write each of the following numbers in standard form. a 380 b 4200000 c 45600000000 d 65400000000000 e 20 f 10 g 10.3 h 5 2 Write each of the following as an ordinary number. a 2 4 106 . 2 4 2 4 × b 3 1 108 3 1 3 1× c 1 05 107 1 0 1 05 1 5 1 d 9 9 103 9 9 9 9 × e 7.1 × 101 3 Simplify each of the following, leaving your answer in standard form. a ( ) ( ) ( ) 2 1 ( ) 0 4 ( ) 0 4 ( ) ( ) 0 4 ( ) ( ) 10 ( ) 13 ( ) 13 ( ) ( ) 0 4 13 ( ) 0 4 17 ( ) 17 ( ) ( ) × × ( ) 2 1 ( ) × × ( ) 2 10 4 × × 0 4 ( ) 0 4 ( ) × × 0 4 ( ) 0 4 13 ( ) 0 4 × × 0 4 ( ) 13 0 4 ( ) ( ) b ( . ) ( ) 1 4 ( . 1 4 ( . 10 3 10 8 4 ) ( 8 4 3 1 8 4 0 8 4 × × ) ( × × ) ( 10 × × 8 4 × × ) ( 8 4 × × ) ( 8 4 3 1 3 1 3 1 8 4 3 1 8 4 c ( . ) 1 5 ( . 1 5 ( . 1013 2 × d ( ) ( ) ( ) 12 ( ) ( ) 10 ( ) ( ) 11 ( ) ( ) 10 ( ) 5 2 ( ) 5 2 ( ) ( ) 5 2 ( ) ( ) 11 ( ) 5 2 11 ( ) 10 ( ) 5 2 10 × × ( ) × × ( ) ( ) 10 ( ) × × 105 2 × × 5 2 ( ) 5 2 ( ) × × 5 2 ( ) ( ) ( ) 5 2 ( ) 5 2 e ( . ) ( . ) 0 2 ( . 0 2 ( . 10 0 7 . ) 0 7 . ) . ) 10 . ) 17 16 . ) 16 . ) × × ) ( × × ) ( 10 × × 17 × × . ) . ) f ( ) ( ) ( ) 9 1 ( ) 0 3 ( ) 0 3 ( ) ( ) 0 3 ( ) ( ) 10 ( ) 17 ( ) 17 ( ) ( ) 0 3 17 ( ) 0 3 16 ( ) 16 ( ) ( ) × ÷ ( ) 9 1 ( ) × ÷ ( ) 9 10 3 × ÷ 0 3 ( ) 0 3 ( ) × ÷ 0 3 ( ) 0 3 17 ( ) 0 3 × ÷ 0 3 ( ) 17 0 3 ( ) ( ) g ( ) ( ) ( ) 8 1 ( ) 0 4 ( ) 0 4 ( ) ( ) 0 4 ( ) ( ) 10 ( ) 17 ( ) 17 ( ) ( ) 0 4 17 ( ) 0 4 16 ( ) 16 ( ) ( ) × ÷ ( ) 8 1 ( ) × ÷ ( ) 8 10 4 × ÷ 0 4 ( ) 0 4 ( ) × ÷ 0 4 ( ) 0 4 17 ( ) 0 4 × ÷ 0 4 ( ) 17 0 4 ( ) ( ) h ( . ) ( ) 1 5 ( . 1 5 ( . 10 5 10 8 4 ) ( 8 4 5 1 8 4 0 8 4 × ÷ ) ( × ÷ ) ( 10 × ÷ 8 4 × ÷ ) ( 8 4 × ÷ ) ( 8 4 5 1 5 1 5 1 8 4 5 1 8 4 i ( . ) ( ) 2 4 ( . 2 4 ( . 10 8 10 64 21 × ÷ ) ( × ÷ ) ( 10 × ÷ 64 × ÷ 8 1 8 1 j ( . ) ( . ) 1 4 ( . 1 4 ( . 4 10 1 ) ( 0 1. ) 2 1 . ) . ) . ) 7 4 ) ( 7 4 . ) 7 4 . ) 0 1 7 4 0 1 ) ( 0 1 7 4 0 1. ) 2 1 . ) 7 4 2 1 . ) . ) 7 4 × ÷ 4 1 × ÷ 4 10 1 × ÷ ) ( 0 1 × ÷ ) ( 0 1 0 1 7 4 0 1 × ÷ 7 4 ) ( 0 1 7 4 0 1 × ÷ ) ( 0 1 ) ( 7 4 0 1. ) 2 1 . ) 2 1 . ) 2 1 7 4 2 1 . ) 2 1 . ) 7 4 2 1 k ( . ) ( . ) 1 7 ( . 1 7 ( . 10 3 4 ( . 3 4 ( . 10 8 5 × × l ( . ) ( . ) 4 9 ( . 4 9 ( . 10 3 6 . ) 3 6 . ) . ) 10 . ) 5 9 ) ( 5 9 . ) 5 9 . ) 3 6 5 9 . ) 3 6 . ) 5 9 3 6 . ) 10 . ) 5 9 10 × × ) ( × × ) ( 10 × × 5 9 × × ) ( 5 9 × × ) ( 5 9 . ) . ) . ) 5 9 . ) 5 9 4 Simplify each of the following, leaving your answer in standard form. a ( ) ( ) ( ) 3 1 ( ) ( ) 0 4 ( ) 0 4 ( ) 0 4 ( ) ( ) 0 4 ( ) ( ) 10 ( ) 4 3 ( ) 4 3 ( ) ( ) 4 3 ( ) 0 4 4 3 ( ) 0 4 4 3 ( ) 0 4 ( ) 0 4 ( ) 4 3 0 4 ( ) 10 ( ) 4 3 10 ( ) × + ( ) 3 1 ( ) × + ( ) 3 10 4 × + 0 4 ( ) 0 4 ( ) × + 0 4 0 4 4 3 × + 0 4 4 3 ( ) 0 4 4 3 ( ) 0 4 × + 0 4 ( ) 4 3 0 4 ( ) ( ) ( ) 4 3 ( ) 4 3 b ( ) ( ) ( ) 4 1 ( ) ( ) 0 3 ( ) 0 3 ( ) 0 3 ( ) ( ) 0 3 ( ) ( ) 10 ( ) 6 5 ( ) 6 5 ( ) ( ) 6 5 ( ) 0 3 6 5 ( ) 0 3 6 5 ( ) 0 3 ( ) 0 3 ( ) 6 5 0 3 ( ) 10 ( ) 6 5 10 ( ) × − ( ) 4 1 ( ) × − ( ) 4 10 3 × − 0 3 ( ) 0 3 ( ) × − 0 3 0 3 6 5 × − 6 5 ( ) 0 3 6 5 ( ) 0 3 × − 0 3 ( ) 6 5 0 3 ( ) ( ) ( ) 6 5 ( ) 6 5 c ( . ) ( . ) 2 7 ( . 2 7 ( . 10 5 6 . ) 5 6 . ) . ) 10 . ) 3 5 ) ( 3 5 . ) 3 5 . ) 5 6 3 5 . ) 5 6 . ) 3 5 5 6 . ) 10 . ) 3 5 10 × + ) ( × + ) ( 10 × + 3 5 × + ) ( 3 5 × + ) ( 3 5 . ) . ) . ) 3 5 . ) 3 5 d ( . ) ( . ) 7 1 ( . 7 1 ( . 10 4 3 . ) 4 3 . ) . ) 10 . ) 9 7 ) ( 9 7 . ) 9 7 . ) 4 3 9 7 . ) 4 3 . ) 9 7 4 3 . ) 10 . ) 9 7 10 × − ) ( × − ) ( 10 × − 9 7 × − ) ( 9 7 × − 9 7 . ) . ) . ) 9 7 . ) 9 7 e ( . ) ( . ) 5 8 ( . 5 8 ( . 10 2 7 . ) 2 7 . ) . ) 10 . ) 9 3 ) ( 9 3 . ) 9 3 . ) 2 7 9 3 . ) 2 7 . ) 9 3 2 7 . ) 10 . ) 9 3 10 × − ) ( × − ) ( 10 × − 9 3 × − ) ( 9 3 × − 9 3 . ) . ) . ) 9 3 . ) 9 3 Standard form for small numbers You have seen that digits move place order to the left when multiplying by powers of 10. If you divide by powers of 10 move the digits in place order to the right and make the number smaller. Consider the following pattern: 2300 2300 ÷ 10 = 230 2300 10 2300 100 23 2 ÷ = 10 ÷ = 2 ÷ = ÷ = 100 ÷ = 2300 10 2300 1000 2 3 3 ÷ = 10 ÷ = 3 ÷ = ÷ = 1000 ÷ = 2 3 2 3 . . . and so on. The digits move place order to the right (notice that this looks like the decimal point is moving to the left). You saw in chapter 1 that if a direction is taken to be positive, the opposite direction is taken to be negative. Since moving place order to the left raises 10 to the power of a positive index, it follows that moving place order to the right raises 10 to the power of a negative index. Also remember from chapter 2 that you can write negative powers to indicate that you divide, and you saw above that with small numbers, you divide by 10 to express the number in standard form. When converting standard form back to an ordinary number, the power of 10 tells you how many places the first digit moves to the left (or decimal point moves to the right), not how many zeros there are. Remember that you can write these as ordinary numbers before adding or subtracting. d ( ) ( ) ( ) 9 1 ( ) ( ) 0 3 ( ) 0 3 ( ) 0 3 ( ) ( ) 0 3 ( ) ( ) 10 ( ) 6 8 ( ) 6 8 ( ) ( ) 6 8 ( ) 0 3 6 8 ( ) 0 3 6 8 ( ) 0 3 ( ) 0 3 ( ) 6 8 0 3 ( ) 10 ( ) 6 8 10 ( ) × + ( ) 9 1 ( ) × + ( ) 9 10 3 × + 0 3 ( ) 0 3 ( ) × + 0 3 0 3 6 8 × + 0 3 6 8 ( ) 0 3 6 8 ( ) 0 3 × + 0 3 ( ) 6 8 0 3 ( ) ( ) ( ) 6 8 ( ) 6 8 When adding or subtracting numbers in standard form it is often easiest to re-write them both as ordinary numbers first, then convert the answer to standard form. 9 10 9000000 6 0 9 0 9 × = 9 1 × = 9 10 9 × = 0 9 0 9 0 9 × = 3 10 300000000 8 × = 3 1 × = 3 10 × = 8 × = So ( ) ( ) ( ) 9 1 ( ) 0 3 ( ) 0 3 ( ) ( ) 0 3 ( ) ( ) 10 ( ) 300000000 9000000 309000000 3 0 . 3 09 10 6 8 ( ) 6 8 ( ) ( ) 6 8 ( ) 0 3 6 8 ( ) 0 3 6 8 ( ) 0 3 ( ) 0 3 ( ) 6 8 0 3 ( ) 10 ( ) 6 8 10 8 ( ) × + ( ) 9 1 ( ) × + ( ) 9 10 3 × + 0 3 ( ) 0 3 ( ) × + 0 3 0 3 6 8 × + 0 3 6 8 ( ) 0 3 6 8 ( ) 0 3 × + 0 3 ( ) 6 8 0 3 × = ( ) × = ( ) ( ) 10 ( ) × = 10 ( ) 6 8 ( ) × = ( ) 6 8 ( ) 10 ( ) 6 8 10 × = 10 ( ) 6 8 10 + = = × 3 0 = × . 3 0 = × 3 09 1 = × 9 1 Astronomy deals with very large and very small numbers and it would be clumsy and potentially inaccurate to write these out in full every time you needed them. Standard form makes calculations and recording much easier. LINK e s s - R e v i e w C o p y - C a m b r i d g e U n i v e r s i t y P r e s s - R e v i e w C o p y R e v i e w C o p y - C a m b r i d g e U n i v e r s i t y P r e s s - R e v i e w C o p y R e v i e w C o p y - C a m b r i d g e U n i v e r s i t y P r e s s - R e v i e w C o p y R e v i e w C o p y - C a m b r i d g e U n i v e r s i t y Copyright Material - Review Only - Not for Redistribution
- 127. Unit 2: Number 117 5 Fractions and standard form Worked example 19 Write each of the following in standard form. a 0.004 b 0.00000034 c ( ) ( ) ( ) 2 1 ( ) ( ) 0 3 ( ) 0 3 ( ) 0 3 ( ) ( ) 0 3 ( ) ( ) 10 ( ) 3 7 ( ) 3 7 ( ) ( ) 3 7 ( ) 0 3 3 7 ( ) 0 3 3 7 ( ) 0 3 ( ) 0 3 ( ) 3 7 0 3 ( ) 10 ( ) 3 7 10 ( ) × × ( ) 2 1 ( ) × × ( ) 2 10 3 × × 0 3 ( ) 0 3 ( ) × × 0 3 0 3 3 7 × × 0 3 3 7 ( ) 0 3 3 7 ( ) 0 3 × × 0 3 ( ) 3 7 0 3 ( ) ( ) ( ) 3 7 ( ) 3 7 ( ) 0 3 − − ( ) 0 3 ( ) 3 7 − − ( ) 3 7 0 3 3 7 − − 3 7 ( ) 0 3 3 7 ( ) 0 3 − − 0 3 ( ) 3 7 0 3 ( ) 0 3 ( ) 3 7 0 3 − − 0 3 ( ) 3 7 0 3 ( ) 10 ( ) 3 7 10 − − 10 ( ) 3 7 10 a 3 2 1 × = 10 –3 0 0 . 4 4.0 0 4 Start with a number between 1 and 10, in this case 4. Compare the position of the first digit: ‘4’ needs to move 3 place orders to the right to get from the new number to the original number. In worked example 17 you saw that moving 5 places to the left meant multiplying by 105 , so it follows that moving 3 places to the right means multiply by 10−3 . Notice also that the first non-zero digit in 0.004 is in the 3rd place after the decimal point and that the power of 10 is −3. Alternatively: you know that you need to divide by 10 three times, so you can change it to a fractional index and then a negative index. 0.004 4 10 4 10 4 10 . 3 3 0 . 0 . = ÷ 4 1 = ÷ 4 1 = × 4 1 = × 4 1 = × 4 1 = × 4 10 . 0 . 1 3 b 0 00000034 3 4 10 3 4 10 7 7 . . 000 . . 000 . . 34 . . 3 4 . . 3 4 3 4 3 4 = ÷ 3 4 = ÷ . . = ÷ 3 4 . . 3 4 = ÷ . . = × 3 4 = × 3 4 3 4 = × − 1 2 3 4 5 6 7 × 10 –7 0. 0 0 0 0 0 0 3 4 = 3.4 Notice that the first non-zero digit in 0.00000034 is in the 7th place after the decimal point and that the power of 10 is −7. c ( ) ( ) ( ) ( ) ( ) 2 1 ( ) 0 3 ( ) 0 3 ( ) ( ) 0 3 ( ) ( ) 10 ( ) ( ) 2 3 ( ) ( ) 10 ( ) ( ) 10 ( ) 6 10 6 10 3 7 ( ) 3 7 ( ) ( ) 3 7 ( ) 0 3 3 7 ( ) 0 3 3 7 ( ) 0 3 ( ) 0 3 ( ) 3 7 0 3 ( ) 10 ( ) 3 7 10 3 7 ( ) 3 7 ( ) ( ) 10 ( ) 3 7 10 3 10 ( ) × × ( ) 2 1 ( ) × × ( ) 2 10 3 × × 0 3 ( ) 0 3 ( ) × × 0 3 0 3 3 7 × × 0 3 3 7 ( ) 0 3 3 7 ( ) 0 3 × × 0 3 ( ) 3 7 0 3 ( ) ( ) ( ) 3 7 ( ) 3 7 = × ( ) = × ( ) 2 3 ( ) = × ( ) 2 3 × × ( ) × × ( ) ( ) 10 ( ) × × 10 ( ) 3 7 ( ) × × ( ) 3 7 = × 6 1 = × 6 1 = × 6 1 = × 6 1 ( ) 0 3 − − ( ) 0 3 ( ) 3 7 − − ( ) 3 7 0 3 3 7 − − 3 7 ( ) 0 3 3 7 ( ) 0 3 − − 0 3 ( ) 3 7 0 3 ( ) 0 3 ( ) 3 7 0 3 − − 0 3 ( ) 3 7 0 3 ( ) 10 ( ) 3 7 10 − − 10 ( ) 3 7 10 ( ) − − ( ) ( ) 3 7 ( ) − − ( ) 3 7 ( ) 10 ( ) 3 7 10 − − 10 ( ) 3 7 10 − + 3 − + − − 7 Simplify by gathering like terms together. Use the laws of indices. Exercise 5.13 1 Write each of the following numbers in standard form. a 0.004 b 0.00005 c 0.000032 d 0.0000000564 2 Write each of the following as an ordinary number. a 3 6 10 4 3 6 3 6 × − b 1 6 10 8 1 6 1 6 × − c 2 03 10 7 2 0 2 03 1 3 1 − d 8 8 10 3 8 8 8 8 × − e 7 1 10 1 7 1 7 1× − 3 Simplify each of the following, leaving your answer in standard form. a ( ) ( ) ( ) 2 1 ( ) 0 4 ( ) 0 4 ( ) ( ) 0 4 ( ) ( ) 10 ( ) 4 1 ( ) 4 1 ( ) ( ) 4 1 ( ) 0 4 4 1 ( ) 0 4 4 1 ( ) 0 4 ( ) 0 4 ( ) 4 1 0 4 ( ) 10 ( ) 4 1 10 6 ( ) ( ) ( ) × × ( ) 2 1 ( ) × × ( ) 2 10 4 × × 0 4 ( ) 0 4 ( ) × × 0 4 0 4 4 1 × × 0 4 4 1 ( ) 0 4 4 1 ( ) 0 4 × × 0 4 ( ) 4 1 0 4 ( ) ( ) ( ) 4 1 ( ) 4 1 ( ) 0 4 − − ( ) 0 4 ( ) 4 1 − − ( ) 4 1 0 4 4 1 − − 4 1 ( ) 0 4 4 1 ( ) 0 4 − − 0 4 ( ) 4 1 0 4 ( ) 0 4 ( ) 4 1 0 4 − − 0 4 ( ) 4 1 0 4 ( ) 10 ( ) 4 1 10 − − 10 ( ) 4 1 10 b ( . ) ( ) 1 6 ( . 1 6 ( . 10 4 10 8 4 ) ( 8 4 4 1 8 4 0 8 4 × × ) ( × × ) ( 10 × × 8 4 × × ) ( 8 4 × × ) ( 8 4 4 1 4 1 4 1 8 4 4 1 8 4 − − 8 4 − − 8 4 ) ( 8 4 − − 8 4 4 1 8 4 − − 8 4 0 8 4 − − 8 4 c ( . ) ( . ) 1 5 ( . 1 5 ( . 10 2 1 . ) 2 1 . ) . ) 10 . ) 6 3 ) ( 6 3 . ) 6 3 . ) 2 1 6 3 . ) 2 1 . ) 6 3 2 1 . ) 10 . ) 6 3 10 × × ) ( × × ) ( 10 × × 6 3 × × ) ( 6 3 × × ) ( 6 3 . ) . ) . ) 6 3 . ) 6 3 − − 6 3 − − ) ( 6 3 − − 6 3 . ) 6 3 − − . ) 6 3 2 1 6 3 − − 6 3 . ) 2 1 . ) 6 3 2 1 − − 2 1 . ) 6 3 2 1 . ) 10 . ) 6 3 10 − − 10 . ) 6 3 10 d ( ) ( ) ( ) 11 ( ) ( ) 10 ( ) ( ) 3 1 ( ) ( ) ( ) 5 2 ( ) 5 2 ( ) ( ) 5 2 ( ) ( ) 3 1 ( ) 5 2 3 1 ( ) ( ) 5 2 × × ( ) × × ( ) ( ) 10 ( ) × × 10 5 2 × × 5 2 ( ) 5 2 ( ) × × 5 2 ( ) 3 1 ( ) 3 1 ( ) 3 1 5 2 3 1 ( ) 3 1 ( ) 5 2 3 1 ( ) ( ) e ( ) ( . ) ( ) 9 1 ( ) 0 4 ( ) 0 4 ( ) ( . 0 4 ( .5 10 17 ( ) 17 ( ) ( ) 0 4 17 ( ) 0 4 16 ( ) × ÷ ( ) 9 1 ( ) × ÷ ( ) 9 10 4 × ÷ 0 4 ( ) 0 4 ( ) × ÷ 0 4 ( ) 0 4 17 ( ) 0 4 × ÷ 0 4 ( ) 17 0 4 5 1 5 1 − f ( ) ( ) ( ) 7 1 ( ) 0 1 ( ) 0 1 ( ) ( ) 0 1 ( ) ( ) 10 ( ) 21 ( ) 21 ( ) ( ) 0 1 21 ( ) 0 1 16 ( ) 16 ( ) ( ) × ÷ ( ) 7 1 ( ) × ÷ ( ) 7 10 1 × ÷ 0 1 ( ) 0 1 ( ) × ÷ 0 1 ( ) 0 1 21 ( ) 0 1 × ÷ 0 1 ( ) 21 0 1 ( ) ( ) ( ) 0 1 ( ) 0 1 g ( . ) ( . ) 4 5 ( . 4 5 ( . 10 0 9 . ) 0 9 . ) . ) 10 . ) 8 4 ) ( 8 4 . ) 8 4 . ) 0 9 8 4 . ) 0 9 . ) 8 4 0 9 . ) 10 . ) 8 4 10 × ÷ ) ( × ÷ ) ( 10 × ÷ 8 4 × ÷ ) ( 8 4 × ÷ ) ( 8 4 . ) . ) . ) 8 4 . ) 8 4 . ) 8 4 . ) 8 4 h ( ) ( ) ( ) ( ) 11 ( ) ( ) 10 ( ) ( ) 3 1 ( ) 0 2 ( ) 0 2 ( ) ( ) 0 2 ( ) ( ) 10 ( ) 5 2 ( ) 5 2 ( ) ( ) 5 2 ( ) ( ) 3 1 ( ) 5 2 3 1 ( ) 0 2 ( ) 5 2 ( ) 0 2 5 2 ( ) 5 2 ( ) ( ) 5 2 ( ) 3 1 ( ) 5 2 3 1 ( ) 0 2 ( ) 5 2 ( ) 0 2 3 ( ) ( ) × × ( ) × × ( ) ( ) 10 ( ) × × 10 5 2 × × 5 2 ( ) 5 2 ( ) × × 5 2 ( ) × ÷ ( ) 3 1 ( ) × ÷ ( ) 3 10 2 × ÷ 0 2 ( ) 0 2 ( ) × ÷ 0 2 ( ) 5 2 × ÷ 5 2 ( ) 3 1 ( ) 5 2 3 1 × ÷ ( ) 3 1 ( ) 5 2 3 1 ( ) 0 2 ( ) 5 2 ( ) 0 2 × ÷ 0 2 ( ) 5 2 0 2 ( ) ( ) ( ) − − ( ) 0 2 − − ( ) 0 2 − − 0 2 ( ) 0 2 ( ) − − 0 2 ( ) − − ( ) ( ) 10 ( ) − − 10 5 2 − − ( ) 5 2 ( ) − − 5 2 ( ) 5 2 − − 5 2 ( ) 3 1 ( ) 5 2 3 1 − − 3 1 ( ) 5 2 3 1 ( ) 0 2 ( ) 5 2 ( ) 0 2 − − 0 2 ( ) 5 2 0 2 4 Simplify each of the following, leaving your answer in standard form. a ( . ) ( . ) 3 1 ( . 3 1 ( . 10 2 7 . ) 2 7 . ) . ) 10 . ) 4 2 ) ( 4 2 . ) 4 2 . ) 2 7 4 2 . ) 2 7 . ) 4 2 2 7 . ) 10 . ) 4 2 10 × + ) ( × + ) ( 10 × + 4 2 × + ) ( 4 2 × + ) ( 4 2 . ) . ) . ) 4 2 . ) 4 2 − − 4 2 − − ) ( 4 2 − − 4 2 . ) 4 2 − − . ) 4 2 2 7 4 2 − − 4 2 . ) 2 7 . ) 4 2 2 7 − − 2 7 . ) 4 2 2 7 . ) 10 . ) 4 2 10 − − 10 . ) 4 2 10 b ( . ) ( . ) 3 2 ( . 3 2 ( . 10 3 2 . ) 3 2 . ) . ) 10 . ) 1 2 ) ( 1 2 . ) 1 2 . ) 3 2 1 2 . ) 3 2 . ) 1 2 3 2 . ) 10 . ) 1 2 10 × − ) ( × − ) ( 10 × − 1 2 × − ) ( 1 2 × − 1 2 . ) . ) . ) 1 2 . ) 1 2 − − 1 2 − − ) ( 1 2 − − 1 2 . ) 1 2 − − . ) 1 2 3 2 1 2 − − 1 2 . ) 3 2 . ) 1 2 3 2 − − 3 2 . ) 1 2 3 2 . ) 10 . ) 1 2 10 − − 10 . ) 1 2 10 c ( . ) ( . ) 7 0 ( . 7 0 ( . 1 10 5 ) ( 0 5. ) 6 1 . ) . ) . ) 3 1 ) ( 3 1 . ) 3 1 . ) 0 5 3 1 0 5 ) ( 0 5 3 1 0 5. ) 6 1 . ) 3 1 6 1 . ) . ) 3 1 × + 1 1 × + 1 10 5 × + ) ( 0 5 × + ) ( 0 5 0 5 3 1 0 5 × + 3 1 ) ( 0 5 3 1 0 5 × + ) ( 0 5 ) ( 3 1 0 5. ) 6 1 . ) 6 1 . ) 6 1 3 1 6 1 . ) 6 1 . ) 3 1 6 1 . ) 3 1 . ) 3 1 d ( . ) ( . ) 1 4 ( . 1 4 ( . 4 10 2 ) ( 0 2. ) 33 . ) . ) 10 . ) 5 6 ) ( 5 6 . ) 5 6 . ) 0 2 5 6 0 2 ) ( 0 2 5 6 0 2. ) 33 . ) 5 6 33 5 6 . ) 5 6 0 2 5 6 0 2 ) ( 0 2 5 6 0 2. ) 33 . ) 5 6 33 . ) 10 . ) 5 6 10 × − 4 1 × − 4 10 2 × − ) ( 0 2 × − ) ( 0 2 0 2 5 6 0 2 × − 5 6 ) ( 0 2 5 6 0 2 × − 0 2 ) ( 5 6 0 2. ) . ) . ) 5 6 . ) 5 6 0 2 − − 0 2. ) 5 6 − − . ) 5 6 5 6 − − . ) 5 6 − − 5 6 0 2 5 6 0 2 − − 5 6 ) ( 0 2 5 6 0 2 − − 0 2 ) ( 5 6 0 2. ) 33 . ) 5 6 33 − − 33 . ) 5 6 33 . ) 10 . ) 5 6 10 − − 10 . ) 5 6 10 Applying your skills 5 Find the number of seconds in a day, giving your answer in standard form. 6 The speed of light is approximately 3 108 3 1 3 1 metres per second. How far will light travel in: a 10 seconds b 20 seconds c 102 seconds Remember that you can write these as ordinary numbers before adding or subtracting. For some calculations, you might need to change a term into standard form before you multiply or divide. When using standard form with negative indices, the power to which10 is raised tells you the position of the first non-zero digit after (to the right of) the decimal point. e s s - R e v i e w C o p y - C a m b r i d g e U n i v e r s i t y P r e s s - R e v i e w C o p y R e v i e w C o p y - C a m b r i d g e U n i v e r s i t y P r e s s - R e v i e w C o p y R e v i e w C o p y - C a m b r i d g e U n i v e r s i t y P r e s s - R e v i e w C o p y R e v i e w C o p y - C a m b r i d g e U n i v e r s i t y Copyright Material - Review Only - Not for Redistribution
- 128. Unit 2: Number Cambridge IGCSE Mathematics 118 7 Data storage (in computers) is measured in gigabytes. One gigabyte is 230 bytes. a Write 230 in standard form correct to 1 significant figure. b There are 1024 gigabytes in a terabyte. How many bytes is this? Give your answer in standard form correct to one significant figure. 5.5 Your calculator and standard form On modern scientific calculators you can enter calculations in standard form. Your calculator will also display numbers with too many digits for screen display in standard form. Keying in standard form calculations You will need to use the × 10x button or the Exp or EE button on your calculator. These are known as the exponent keys. All exponent keys work in the same way, so you can follow the example below on your own calculator using whatever key you have and you will get the same result. When you use the exponent function key of your calculator, you do NOT enter the ‘× 10’ part of the calculation. The calculator does that part automatically as part of the function. Worked example 20 Using your calculator, calculate: a 2.134 × 10⁴ b 3.124 × 10⁻⁶ a 2.134 × 104 = 21340 Press: 2 . 1 3 4 × 10x 4 = This is the answer you will get. b 3.124 × 10–6 = 0.000003123 Press: 3 . 1 2 3 Exp − 6 = This is the answer you will get. Making sense of the calculator display Depending on your calculator, answers in scientific notation will be displayed on a line with an exponent like this: This is 5.98 × 10–06 or on two lines with the calculation and the answer, like this: This is 2.56 × 1024 If you are asked to give your answer in standard form, all you need to do is interpret the display and write the answer correctly. If you are asked to give your answer as an ordinary number (decimal), then you need to apply the rules you already know to write the answer correctly. Exercise 5.14 1 Enter each of these numbers into your calculator using the correct function key and write down what appears on your calculator display. a 4.2 × 10¹² b 1.8 × 10⁻⁵ c 2.7 × 10⁶ d 1.34 × 10⁻² e 1.87 × 10⁻⁹ f 4.23 × 10⁷ g 3.102 × 10⁻⁴ h 3.098 × 10⁹ i 2.076 × 10⁻²³ Standard form is also called scientific notation or exponential notation. Different calculators work in different ways and you need to understand how your own calculator works. Make sure you know what buttons to use to enter standard form calculations and how to interpret the display and convert your calculator answer into decimal form. e s s - R e v i e w C o p y - C a m b r i d g e U n i v e r s i t y P r e s s - R e v i e w C o p y R e v i e w C o p y - C a m b r i d g e U n i v e r s i t y P r e s s - R e v i e w C o p y R e v i e w C o p y - C a m b r i d g e U n i v e r s i t y P r e s s - R e v i e w C o p y R e v i e w C o p y - C a m b r i d g e U n i v e r s i t y Copyright Material - Review Only - Not for Redistribution
- 129. Unit 2: Number 119 5 Fractions and standard form 2 Here are ten calculator displays giving answers in standard form. v vi vii viii ix x i ii iii iv a Write out each answer in standard form. b Arrange the ten numbers in order from smallest to largest. 3 Use your calculator. Give the answers in standard form correct to 5 significant figures. a 42345 b 0.0008 ÷ 92003 c (1.009)5 d 123 000 000 ÷ 0.00076 e (97 × 876)4 f (0.0098)4 × (0.0032)3 g 8543 921 34 × 0 0 0000 . h 9754 4 ( ) 5 ( ) 0 ( ) 000 ( ) . ( ) 4 Use your calculator to find the answers correct to 4 significant figures. a 9.27 × (2.8 × 105 ) b (4.23 × 10⁻² )3 c (3.2 × 10⁷ ) ÷ (7.2 × 10⁹ ) d (3.2 × 10⁻⁴ )2 e 231 × (1.5 × 10–6 ) f (4.3 × 10⁵ ) + (2.3 × 10⁷ ) g 3 24 1 7 3 2 3 24 1 4 10 h 4 2 10 8 3 . 4 2 4 2× − i 4.126 10 9 × − 3 5.6 Estimation It is important that you know whether or not an answer that you have obtained is at least roughly as you expected. This section demonstrates how you can produce an approximate answer to a calculation easily. To estimate, the numbers you are using need to be rounded before you do the calculation. Although you can use any accuracy, usually the numbers in the calculation are rounded to one significant figure: 3.9 × 2.1 ≈ 4 × 2 = 8 Notice that 3.9 × 2.1 = 8.19, so the estimated value of 8 is not too far from the real value! For this section you will need to remember how to round an answer to a specified number of significant figures. You covered this in chapter 1. REWIND Tip Note that the ‘≈’ symbol is only used at the point where an approximation is made. At other times you should use ‘=’ when two numbers are exactly equal. Worked example 21 Worked example 21 Estimate the value of: a 4 6 3 9 398 . . 4 6 . . 4 6 3 9 . . 3 9 + . . . . b 42 2 5 1 . . 2 5 . . 2 5 2 5 a 4 6 3 9 398 5 4 400 9 20 4 5 10 0 45 . . 4 6 . . 4 6 3 9 . . 3 9 4 5 4 5 0 4 0 4 + . . . . ≈ 5 4 5 4 = = = = = Round the numbers to 1 significant figure. Check the estimate: 4 6 3 9 398 0 426 . . 4 6 . . 4 6 3 9 . . 3 9 . + . . . . = (3sf) Now if you use a calculator you will find the exact value and see that the estimate was good. e s s - R e v i e w C o p y - C a m b r i d g e U n i v e r s i t y P r e s s - R e v i e w C o p y R e v i e w C o p y - C a m b r i d g e U n i v e r s i t y P r e s s - R e v i e w C o p y R e v i e w C o p y - C a m b r i d g e U n i v e r s i t y P r e s s - R e v i e w C o p y R e v i e w C o p y - C a m b r i d g e U n i v e r s i t y Copyright Material - Review Only - Not for Redistribution
- 130. Unit 2: Number Cambridge IGCSE Mathematics 120 A good starting point for the questions in the following exercise will be to round the numbers to 1 significant figure. Remember that you can sometimes make your calculation even simpler by modifying your numbers again. Exercise 5.15 1 Estimate the value of each of the following. Show the rounded values that you use. a 23 6 6 3 . 6 3 6 3 b 4 3 0 087 3 89 4 3 4 3 . . 087 . . 3 8 . . 3 8 × . . . . c 7 21 0 46 9 09 . . 7 2 . . 7 21 0 . . 9 0 9 0 1 0 1 0 1 0 . . 1 0 . . d 4 82 6 01 2 54 1 09 . . 4 8 . . 4 82 6 . . . . 2 5 . . 2 54 1 . . 2 6 2 6 2 6 . . 2 6 . . 4 1 4 1 4 1 . . 4 1 . . e 48 2 54 4 09 . . 2 5 . . 2 54 4 . . 4 4 4 4 4 4 . . 4 4 . . f (0.45 + 1.89)(6.5 – 1.9) g 23 8 2 2 4 7 5 7 . . 8 2 . . . . 4 7 . . 4 7 5 7 . . 5 7 8 2 8 2 8 2 . . 8 2 . . + . . . . 0 . . . . h 1 9 6 45 1 19 4 13 9 0 . 1 9 0 . 1 9 5 1 5 1 . . 4 1 . . 3 9 . . 3 9 6 4 6 4 4 1 4 1 i ( . ) . ) . 2 5 ( . 2 5 ( . 2 4 ) . 2 4 ) . ) . 2 48 9 ) . 8 9 ) . 9 2 ) . ) . ) . 2 4 ) . 2 4 ) . 2 4 ) . 2 4 j 223 8 45 1 . . 8 4 . . 5 1 . . 5 1 8 4 8 4 8 4 . . 8 4 . . k 9 26 9 6 9 6 9 6 99 87 . . 9 2 . . 9 26 9 . . 6 9 . . 9 8 . . 9 8 6 9 6 9 6 9 . . 6 9 . . l (4.1)3 × (1.9)4 2 Work out the actual answer for each part of question 1, using a calculator. Summary Do you know the following? • An equivalent fraction can be found by multiplying or dividing the numerator and denominator by the same number. • Fractions can be added or subtracted, but you must make sure that you have a common denominator first. • To multiply two fractions you multiply their numerators and multiply their denominators. • To divide by a fraction you find its reciprocal and then multiply. • Percentages are fractions with a denominator of 100. • Percentage increases and decreases are always percentages of the original value. • You can use reverse percentages to find the original value. • Standard form can be used to write very large or very small numbers quickly. • Estimations can be made by rounding the numbers in a calculation to one significant figure. Are you able to. . . ? • find a fraction of a number • find a percentage of a number • find one number as a percentage of another number • calculate a percentage increase or decrease • find a value before a percentage change • do calculations with numbers written in standard form • find an estimate to a calculation. b 42 2 5 1 4 1 40 5 35 36 6 . . 2 5 . . − ≈ 2 5 − ≈ 2 5 1 4 − ≈ 1 40 5 0 5 = ≈ = In this question you begin by rounding each value to one significant figure but it is worth noting that you can only easily take the square root of a square number! Round 35 up to 36 to get a square number. E E e s s - R e v i e w C o p y - C a m b r i d g e U n i v e r s i t y P r e s s - R e v i e w C o p y R e v i e w C o p y - C a m b r i d g e U n i v e r s i t y P r e s s - R e v i e w C o p y R e v i e w C o p y - C a m b r i d g e U n i v e r s i t y P r e s s - R e v i e w C o p y R e v i e w C o p y - C a m b r i d g e U n i v e r s i t y Copyright Material - Review Only - Not for Redistribution
- 131. 121 Unit 2: Number Examination practice Exam-style questions 1 Calculate 5 6 1 4 1 8 + giving your answer as a fraction in its lowest terms. 2 93800 students took an examination. 19% received grade A. 24% received grade B. 31% received grade C. 10% received grade D. 11% received grade E. The rest received grade U. a What percentage of the students received grade U? b What fraction of the students received grade B? Give your answer in its lowest terms. c How many students received grade A? 3 During one summer there were 27500 cases of Salmonella poisoning in Britain. The next summer there was an increase of 9% in the number of cases. Calculate how many cases there were in the second year. 4 Abdul’s height was 160cm on his 15th birthday. It was 172cm on his 16th birthday. What was the percentage increase in his height? Past paper questions 1 Write 0.0000574 in standard form. [1] [Cambridge IGCSE Mathematics 0580 Paper 22 Q1 May/June 2016] 2 Do not use a calculator in this question and show all the steps of your working. Give each answer as a fraction in its lowest terms. Work out a 3 4 1 12 − [2] b 2 1 2 4 25 × [2] [Cambridge IGCSE Mathematics 0580 Paper 11 Q21 October/November 2013] 3 Calculate 17.5% of 44 kg. [2] [Cambridge IGCSE Mathematics 0580 Paper 11 Q10 October/November 2013] 4 Without using your calculator, work out 5 3 8 2 1 5 − . Give your answer as a fraction in its lowest terms. You must show all your working. [3] [Cambridge IGCSE Mathematics 0580 Paper 13 Q17 October/November 2012] 5 Samantha invests $600 at a rate of 2% per year simple interest. Calculate the interest Samantha earns in 8 years. [2] [Cambridge IGCSE Mathematics 0580 Paper 13 Q5 October/November 2012] e s s - R e v i e w C o p y - C a m b r i d g e U n i v e r s i t y P r e s s - R e v i e w C o p y R e v i e w C o p y - C a m b r i d g e U n i v e r s i t y P r e s s - R e v i e w C o p y R e v i e w C o p y - C a m b r i d g e U n i v e r s i t y P r e s s - R e v i e w C o p y R e v i e w C o p y - C a m b r i d g e U n i v e r s i t y Copyright Material - Review Only - Not for Redistribution
- 132. 122 Unit 2: Number 6 Show that 1 10 2 5 0 17 2 2 2 2 2 + 2 2 2 2 2 2 2 2 = 0 1 0 1 Write down all the steps in your working. [2] [Cambridge IGCSE Mathematics 0580 Paper 13 Q6 October/November 2012] 7 Maria pays $84 rent. The rent is increased by 5%. Calculate Maria’s new rent. [2] [Cambridge IGCSE Mathematics 0580 Paper 13 Q10 October/November 2012] 8 Huy borrowed $4500 from a bank at a rate of 5% per year compound interest. He paid back the money and interest at the end of 2 years. How much interest did he pay? [3] [Cambridge IGCSE Mathematics 0580 Paper 13 Q13 May/June 2013] 9 Jasijeet and her brother collect stamps. When Jasjeet gives her brother 1% of her stamps, she has 2475 stamps left. Calculate how many stamps Jasjeet had originally [3] [Cambridge IGCSE Mathematics 0580 Paper 22 Q14 October/November 2014] 10 Without using a calculator, work out 2 5 8 3 7 × . Show all your working and give your answer as a mixed number in its lowest terms. [3] [Cambridge IGCSE Mathematics 0580 Paper 22 Q14 May/June 2016] e s s - R e v i e w C o p y - C a m b r i d g e U n i v e r s i t y P r e s s - R e v i e w C o p y R e v i e w C o p y - C a m b r i d g e U n i v e r s i t y P r e s s - R e v i e w C o p y R e v i e w C o p y - C a m b r i d g e U n i v e r s i t y P r e s s - R e v i e w C o p y R e v i e w C o p y - C a m b r i d g e U n i v e r s i t y Copyright Material - Review Only - Not for Redistribution
- 133. 123 Unit 2: Algebra Chapter 6: Equations and rearranging formulae In this chapter you will learn how to: • expand brackets that have been multiplied by a negative number • solve a linear equation • factorise an algebraic expression where all terms have common factors • rearrange a formula to change the subject. • Expansion • Linear equation • Solution • Common factor • Factorisation • Variable • Subject Key words Leonhard Euler (1707–1783) was a great Swiss mathematician. He formalised much of the algebraic terminology and notation that is used today. Equations are a shorthand way of recording and easily manipulating many problems. Straight lines or curves take time to draw and change but their equations can quickly be written. How to calculate areas of shapes and volumes of solids can be reduced to a few, easily remembered symbols. A formula can help you work out how long it takes to cook your dinner, how well your car is performing or how efficient the insulation is in your house. RECAP You should already be familiar with the following algebra work: Expanding brackets (Chapter 2) y(y – 3) = y × y – y × 3 Solving equations (Year 9 Mathematics) Expand brackets and get the terms with the variable on one side by performing inverse operations. 2(2x + 2) = 2x – 10 4x + 4 = 2x – 10 Remove the brackets first 4x – 2x = –10 – 4 Subtract 2x from both sides. Subtract 4 from both sides. 2x = –14 Add or subtract like terms on each side x = –7 Divide both sides by 2 to get x on its own. e s s - R e v i e w C o p y - C a m b r i d g e U n i v e r s i t y P r e s s - R e v i e w C o p y R e v i e w C o p y - C a m b r i d g e U n i v e r s i t y P r e s s - R e v i e w C o p y R e v i e w C o p y - C a m b r i d g e U n i v e r s i t y P r e s s - R e v i e w C o p y R e v i e w C o p y - C a m b r i d g e U n i v e r s i t y Copyright Material - Review Only - Not for Redistribution
- 134. Unit 2: Algebra Cambridge IGCSE Mathematics 124 Factorising (Year 9 Mathematics) You can think of factorising as ‘putting the brackets back into an expression’. To remove a common factor: • find the highest common factor (HCF) of each term. This can be a variable, it can also be a negative integer • write the HCF in front of the brackets and write the terms divided by the HCF inside the brackets. 2xy + 3xz = x(2y + 3z) –2xy – 3xz = –x (2y + 3z) Changing the subject of a formula (Year 9 Mathematics) You can rearrange formulae to get one letter on the left hand side of the equals sign. Use the same methods you use to solve an equation. A = lb b = 1 A l = A b 6.1 Further expansions of brackets You have already seen that you can re-write algebraic expressions that contain brackets by expanding them. The process is called expansion. This work will now be extended to consider what happens when negative numbers appear before brackets. The key is to remember that a ‘+’ or a ‘−’ is attached to the number immediately following it and should be included when you multiply out brackets. You dealt with expanding brackets in chapter 2. REWIND Worked example 1 Expand and simplify the following expressions. a −3(x + 4) b 4(y − 7) − 5(3y + 5) c 8(p + 4) − 10(9p − 6) a −3(x + 4) Remember that you must multiply the number on the outside of the bracket by everything inside and that the negative sign is attached to the 3. −3(x + 4) = −3x − 12 Because −3 × x = −3x and −3 × 4 = −12. b 4(y − 7) − 5(3y + 5) 4(y − 7) = 4y − 28 −5(3y + 5) = −15y − 25 Expand each bracket first and remember that the ‘−5’ must keep the negative sign when it is multiplied through the second bracket. 4 7 5 3 5 4 28 15 25 11 53 ( ) 4 7 ( ) 4 7 ( ) 5 3 ( ) 5 3 5 4 ( ) 5 4 y y 5 3 y y ( ) y y ( ) 4 7 ( ) y y 4 7 ( ) ( ) y y ( ) 5 3 ( ) 5 3 y y ( ) y y 28 y y 15 y y y y y − − y y ( ) y y − − y y 4 7 ( ) y y ( ) − − 4 7 ( ) 4 7 y y ( ) 5 4 + = 5 4 ( ) + = ( ) 5 4 ( ) 5 4 + = ( ) y y − − y y 28 y y − − y y − = − − Collect like terms and simplify. c 8(p + 4) − 10(9p − 6) 8(p + 4) = 8p + 32 −10(9p − 6) = −90p + 60 It is important to note that when you expand the second bracket ‘−10’ will need to be multiplied by ‘−6’, giving a positive result for that term. 8 4 10 8 32 90 60 82 92 ( ) 8 4 ( ) 8 4 ( ) 9 6 ( ) p p 10 p p ( ) p p ( ) 8 4 ( ) p p 8 4 ( ) ( ) p p ( ) 9 6 ( ) p p 9 6 ( ) p p 8 3 p p 8 32 9 p p 0 6 p p 0 6 p + − ( ) + − 8 4 ( ) + − 8 4 ( ) p p + − p p ( ) p p + − p p 8 4 ( ) p p ( ) + − 8 4 ( ) 8 4 p p ( ) − = ( ) − = 9 6 ( ) − = 9 6 ( ) + − 8 3 + − 8 32 9 + − p p + − 8 3 p p + − 8 3 p p 2 9 p p + − 2 9 p p 0 6 0 6 = − + Collect like terms and simplify. Watch out for negative numbers in front of brackets because they always require extra care. Remember: + × + = + + × − = − − × − = + Tip Physicists often rearrange formulae. If you have a formula that enables you work out how far something has travelled in a particular time, you can rearrange the formula to tell you how long it will take to travel a particular distance, for example. LINK e s s - R e v i e w C o p y - C a m b r i d g e U n i v e r s i t y P r e s s - R e v i e w C o p y R e v i e w C o p y - C a m b r i d g e U n i v e r s i t y P r e s s - R e v i e w C o p y R e v i e w C o p y - C a m b r i d g e U n i v e r s i t y P r e s s - R e v i e w C o p y R e v i e w C o p y - C a m b r i d g e U n i v e r s i t y Copyright Material - Review Only - Not for Redistribution
- 135. Unit 2: Algebra 125 6 Equations and rearranging formulae Exercise 6.1 1 Expand each of the following and simplify your answers as far as possible. a −10(3p + 6) b −3(5x + 7) c −5(4y + 0.2) d −3(q − 12) e −12(2t − 7) f −1.5(8z − 4) 2 Expand each of the following and simplify your answers as far as possible. a −3(2x + 5y) b −6(4p + 5q) c −9(3h − 6k) d −2(5h + 5k − 8j) e −4(2a −3b − 6c + 4d) f −6(x2 + 6y2 − 2y3 ) 3 Expand each of the following and simplify your answers as far as possible. a 2 − 5(x + 2) b 2 − 5(x − 2) c 14(x − 3) − 4(x − 1) d −7(f + 3) − 3(2f − 7) e 3g − 7(7g − 7) + 2(5g − 6) f 6(3y − 5) − 2(3y − 5) 4 Expand each of the following and simplify your answers as far as possible. a 4x(x − 4) − 10x(3x + 6) b 14x(x + 7) − 3x(5x + 7) c x2 − 5x(2x − 6) d 5q2 − 2q(q −12) − 3q2 e 18pq − 12p(5q − 7) f 12m(2n − 4) − 24n(m − 2) 5 Expand each expression and simplify your answers as far as possible. a 8x – 2(3 – 2x) b 11x – (6 – 2x) c 4x + 5 – 3(2x – 4) d 7 – 2(x – 3) + 3x e 15 – 4(x – 2) – 3x f 4x – 2(1 – 3x) – 6 g 3(x + 5) – 4(5 – x) h x(x – 3) – 2(x – 4) i 3x(x – 2) – (x – 2) j 2x(3 + x) – 3(x – 2) k 3(x – 5) – (3 + x) l 2x(3x + 1) – 2(3 – 2x) You will now look at solving linear equations and return to these expansions a little later in the chapter. 6.2 Solving linear equations I think of a number. My number is x. If I multiply my number by three and then add one, the answer is 13. What is my number? To solve this problem you first need to understand the stages of what is happening to x and then undo them in reverse order: This diagram (sometimes called a function machine) shows what is happening to x, with the reverse process written underneath. Notice how the answer to the problem appears quite easily: Try not to carry out too many steps at once. Show every term of your expansion and then simplify. It is important to remind yourself about BODMAS before working through this section. (Return to chapter 1 if you need to.) REWIND × 3 ÷ 3 x 4 + 1 13 – 1 12 So x = 4 Accounting uses a great deal of mathematics. Accountants use computer spreadsheets to calculate and analyse financial data. Although the programs do the calculations, the user has to know which equations and formula to insert to tell the program what to do. LINK e s s - R e v i e w C o p y - C a m b r i d g e U n i v e r s i t y P r e s s - R e v i e w C o p y R e v i e w C o p y - C a m b r i d g e U n i v e r s i t y P r e s s - R e v i e w C o p y R e v i e w C o p y - C a m b r i d g e U n i v e r s i t y P r e s s - R e v i e w C o p y R e v i e w C o p y - C a m b r i d g e U n i v e r s i t y Copyright Material - Review Only - Not for Redistribution
- 136. Unit 2: Algebra Cambridge IGCSE Mathematics 126 A more compact and efficient solution can be obtained using algebra. Follow the instructions in the question: 1 The number is x: x 2 Multiply this number by three: 3x 3 Then add one: 3x + 1 4 The answer is 13: 3x + 1 = 13 Even if you can see what the solution is going to be easily you must show working. This is called a linear equation. ‘Linear’ refers to the fact that there are no powers of x other than one. The next point you must learn is that you can change this equation without changing the solution (the value of x for which the equation is true) provided you do the same to both sides at the same time. Follow the reverse process shown in the function machine above but carry out the instruction on both sides of the equation: 3x + 1 = 13 3 1 1 13 1 3 1 3 1 + − 3 1 + − 3 1 = − 1 1 = − 1 13 1 = − 3 1 (Subtract one from both sides.) 3 12 3 1 3 1 3 1 3 1 3 3 12 3 x = (Divide both sides by three.) x = 4 Always line up your ‘=’ signs because this makes your working much clearer. Sometimes you will also find that linear equations contain brackets, and they can also contain unknown values (like x, though you can use any letter or symbol) on both sides. The following worked example demonstrates a number of possible types of equation. Worked example 2 Worked example 2 An equation with x on both sides and all x terms with the same sign: a Solve the equation 5x − 2 = 3x + 6 5 2 3 6 5 2 3 3 6 3 2 2 6 x x 5 2 x x 5 2 3 6 x x 3 6 x x 5 2 x x 5 2 3 3 x x 3 3x x 6 3 x x 2 2 2 2 x x − = x x 5 2 x x − = 5 2 x x 3 6 3 6 x x − − x x 5 2 x x − − 5 2 x x = + 3 3 = + 3 3x x = + x x 6 3 x x 6 3 x x − = 2 2 − = 2 2 Look for the smallest number of x’s and subtract this from both sides. So, subtract 3x from both sides. 2 2 2 6 2 2 8 2 2 2 2 2 8 2 8 − + 2 2 − + 2 2 = + 2 6 = + 2 6 2 8 2 8 Add two to both sides. 2 2 8 2 x = Divide both sides by two. x = 4 An equation with x on both sides and x terms with different sign: e s s - R e v i e w C o p y - C a m b r i d g e U n i v e r s i t y P r e s s - R e v i e w C o p y R e v i e w C o p y - C a m b r i d g e U n i v e r s i t y P r e s s - R e v i e w C o p y R e v i e w C o p y - C a m b r i d g e U n i v e r s i t y P r e s s - R e v i e w C o p y R e v i e w C o p y - C a m b r i d g e U n i v e r s i t y Copyright Material - Review Only - Not for Redistribution
- 137. Unit 2: Algebra 127 6 Equations and rearranging formulae Exercise 6.2 1 Solve the following equations. a 4x + 3 = 31 b 8x + 42 = 2 c 6x −1 = 53 d 7x − 4 = − 66 e 9y + 7 = 52 f 11n − 19 = 102 g 12q − 7 = 14 h 206t + 3 = 106 i 2 1 3 8 x 2 1 2 1 2 1 2 1 = j 2 3 1 8 x + = 1 8 + = 1 8 k 3 5 11 21 x + = 11 + = l x x + = 3 2 m 2 1 3 3 x 2 1 2 1 x 2 1 2 1 = n 3 2 5 2 x x + = 5 2 + = 5 2 2 Solve the following equations. a 12x + 1 = 7x + 11 b 6x + 1 = 7x + 11 c 6y + 1 = 3y − 8 d 11x + 1 = 12 − 4x e 8 − 8p = 9 − 9p f 1 2 7 1 4 8 x x x x 7 x x x x − = x x 7 x x − = x x + b Solve the equation 5x + 12 = 20 − 11x 5 12 20 11 5 12 11 20 11 11 16 12 20 x x 5 1 x x 5 12 2 x x 0 1 x x 1 x x x x 5 1 x x 5 12 1 x x 1 2 x x 1 2 x x 1 1 x x 1 11 x x x + = 5 1 + = 5 12 2 + = x x + = 5 1 x x + = 5 1 x x 2 2 x x + = 2 2 x x 0 1 x x 0 1 x x + + 5 1 + + 5 12 1 + + 2 1 x x + + 5 1 x x + + 5 1 x x 2 1 x x + + 2 1 x x = − 1 2 = − 1 20 1 = − 0 11 1 1 1 1 1 x x 1 1 x x + = 12 + = This time add the negative x term to both sides. Add 11x to both sides. 16 12 12 20 12 16 8 x x + − 12 + − = − 20 = − = Subtract 12 from both sides. 16 16 8 16 x = Divide both sides by 16. x = 1 2 An equation with brackets on at least one side: c Solve the equation 2(y − 4) + 4(y + 2) = 30 2 4 4 2 30 2 8 4 8 30 ( ) 2 4 ( ) 2 4 ( ) 4 2 ( ) 4 2 y y 4 2 y y ( ) y y ( ) 2 4 ( ) y y 2 4 ( ) ( ) y y ( ) 4 2 ( ) 4 2 y y 4 2 ( ) y y 2 8 y y 2 8 4 8 y y 4 8 − + ( ) − + 2 4 ( ) − + ( ) y y − + y y ( ) y y − + y y 2 4 ( ) y y ( ) − + 2 4 ( ) 2 4 y y ( ) + = ( ) + = 4 2 ( ) + = 4 2 ( ) − + 2 8 − + y y − + y y 2 8 y y − + 2 8 y y + = 4 8 + = 4 8 Expand the brackets and collect like terms together. Expand. 6y = 30 Collect like terms. 6 6 30 6 y = Divide both sides by 6. y = 5 An equation that contains fractions: d Solve the equation 6 7 10 p = 6 7 7 10 7 p × = 7 1 × = 7 10 7 0 7 Multiply both sides by 7. 6p = 70 p = = = = 70 6 35 3 Divide both sides by 6. Write the fraction in its simplest form. By adding 11x to both sides you will see that you are left with a positive x term. This helps you to avoid errors with ‘−’ signs! Unless the question asks you to give your answer to a specific degree of accuracy, it is perfectly acceptable to leave it as a fraction. e s s - R e v i e w C o p y - C a m b r i d g e U n i v e r s i t y P r e s s - R e v i e w C o p y R e v i e w C o p y - C a m b r i d g e U n i v e r s i t y P r e s s - R e v i e w C o p y R e v i e w C o p y - C a m b r i d g e U n i v e r s i t y P r e s s - R e v i e w C o p y R e v i e w C o p y - C a m b r i d g e U n i v e r s i t y Copyright Material - Review Only - Not for Redistribution
- 138. Unit 2: Algebra Cambridge IGCSE Mathematics 128 3 Solve the following equations. a 4(x + 1) = 12 b 2(2p + 1) = 14 c 8(3t + 2) = 40 d 5(m − 2) = 15 e −5(n − 6) = −20 f 2(p − 1) + 7(3p + 2) = 7(p − 4) g 2(p − 1) − 7(3p − 2) = 7(p − 4) h 3(2x + 5) – (3x + 2) = 10 4 Solve for x. a 7(x + 2) = 4(x + 5) b 4(x – 2) + 2(x + 5) = 14 c 7x – (3x + 11) = 6 – (5 – 3x) d −2(x + 2) = 4x + 9 e 3(x + 1) = 2(x + 1) + 2x f 4 + 2(2 − x) = 3 – 2(5 – x) 5 Solve the following equations for x a 33x = 27 b 23x+4 = 32 c 8.14x+3 = 1 d 52(3x+1) = 625 e 43x = 2x+1 f 93x+4 = 274x+3 6.3 Factorising algebraic expressions You have looked in detail at expanding brackets and how this can be used when solving some equations. It can sometimes be helpful to carry out the opposite process and put brackets back into an algebraic expression. Consider the algebraic expression 12x − 4. This expression is already simplified but notice that 12 and 4 have a common factor. In fact the HCF of 12 and 4 is 4. Now, 12 = 4 × 3 and 4 = 4 × 1. So, 12 4 4 3 4 1 4 3 x x 2 4 x x 2 4 4 3 x x x x − = x x 2 4 x x − = 2 4 x x × − 4 3 × − 4 3 x x × − 4 3 x x × − 4 3 x x 4 1 4 1 = − 4 3 = − ( ) 4 3 ( ) 4 3 1 ( ) x ( ) = − ( ) 4 3 = − ( ) 4 3 = − x = − ( ) = − Notice that the HCF has been ‘taken out’ of the bracket and written at the front. The terms inside are found by considering what you need to multiply by 4 to get 12x and −4. The process of writing an algebraic expression using brackets in this way is known as factorisation. The expression, 12x − 4, has been factorised to give 4(3x−1). Some factorisations are not quite so simple. The following worked example should help to make things clearer. Some of the numbers in each equation are powers of the same base number. Re-write these as powers and use the laws of indices from chapter 2 Tip If you need to remind yourself how to find HCFs, return to chapter 1. REWIND Worked example 3 Worked example 3 Factorise each of the following expressions as fully as possible. a 15x + 12y b 18mn − 30m c 36p2 q − 24pq2 d 15(x − 2) − 20(x − 2)3 a 15x +12y The HCF of 12 and 15 is 3, but x and y have no common factors. 15x +12y = 3(5x + 4y) Because 3 × 5x = 15x and 3 × 4y = 12y. b 18mn − 30m The HCF of 18 and 30 = 6 and HCF of mn and m is m. 18mn − 30m = 6m(3n − 5) Because 6m × 3n = 18mn and 6m × 5 = 30m. E e s s - R e v i e w C o p y - C a m b r i d g e U n i v e r s i t y P r e s s - R e v i e w C o p y R e v i e w C o p y - C a m b r i d g e U n i v e r s i t y P r e s s - R e v i e w C o p y R e v i e w C o p y - C a m b r i d g e U n i v e r s i t y P r e s s - R e v i e w C o p y R e v i e w C o p y - C a m b r i d g e U n i v e r s i t y Copyright Material - Review Only - Not for Redistribution
- 139. Unit 2: Algebra 129 6 Equations and rearranging formulae Exercise 6.3 1 Factorise. a 3x + 6 b 15y − 12 c 8 − 16z d 35 + 25t e 2x − 4 f 3x + 7 g 18k − 64 h 33p + 22 i 2x + 4y j 3p − 15q k 13r − 26s l 2p + 4q + 6r 2 Factorise as fully as possible. a 21u − 49v + 35w b 3xy + 3x c 3x2 + 3x d 15pq + 21p e 9m2 − 33m f 90m3 − 80m2 g 36x3 + 24x5 h 32p2 q − 4pq2 3 Factorise as fully as possible. a 14m2 n2 + 4m3 n3 b 17abc + 30ab2 c c m3 n2 + 6m2 n2 (8m + n) d 1 2 3 2 a b a b 3 a b a b a b e 3 4 7 8 4 x x x x + x x x x f 3(x − 4) + 5(x − 4) g 5(x + 1)2 − 4(x + 1)3 h 6x3 + 2x4 + 4x5 i 7x3 y – 14x2 y2 + 21xy2 j x(3 + y) + 2(y + 3) 6.4 Rearrangement of a formula Very often you will find that a formula is expressed with one variable written alone on one side of the ‘=’ symbol (usually on the left but not always). The variable that is written alone is known as the subject of the formula. Consider each of the following formulae: s ut at = + ut = + 1 2 2 (s is the subject) F = ma (F is the subject) x b b b b ac a = − ± b b − ± b b − 2 4 2 (x is the subject) Now that you can recognise the subject of a formula, you must look at how you change the subject of a formula. If you take the formula v = u + at and note that v is currently the subject, you can change the subject by rearranging the formula. To make a the subject of this formula: v = u + at Write down the starting formula. v − u = at Subtract u from both sides (to isolate the term containing a). Once you have taken a common factor out, you may be left with an expression that needs to be simplified further. You will look again at rearranging formulae in chapter 22. FAST FORWARD Another word sometimes used for changing the subject is ‘transposing’. Make sure that you have taken out all the common factors. If you don’t, then your algebraic expression is not fully factorised. Take care to put in all the bracket symbols. c 36p2 q − 24pq2 The HCF of 36 and 24 = 12 and p2 q and pq2 have common factor pq. 36p2 q − 24pq2 = 12pq(3p − 2q) Because 12pq × 3p = 36p2 q and 12pq × −2q = − 24pq2 . Sometimes, the terms can have an expression in brackets that is common to both terms. d 15(x − 2) − 20(x − 2)3 The HCF of 15 and 20 is 5 and the HCF of (x − 2) and (x − 2)3 is (x − 2). 15(x − 2) − 20(x − 2)3 = 5(x − 2)[3 − 4(x − 2)2 ] Because 5(x − 2) × 3 = 15(x − 2) and 5(x − 2) × 4(x − 2)2 = 20(x − 2)3 . e s s - R e v i e w C o p y - C a m b r i d g e U n i v e r s i t y P r e s s - R e v i e w C o p y R e v i e w C o p y - C a m b r i d g e U n i v e r s i t y P r e s s - R e v i e w C o p y R e v i e w C o p y - C a m b r i d g e U n i v e r s i t y P r e s s - R e v i e w C o p y R e v i e w C o p y - C a m b r i d g e U n i v e r s i t y Copyright Material - Review Only - Not for Redistribution
- 140. Unit 2: Algebra Cambridge IGCSE Mathematics 130 v u t a v u v u = Divide both sides by t (notice that everything on the left is divided by t). You now have a on its own and it is the new subject of the formula. This is usually re-written so that the subject is on the left: a v u t = v u v u Notice how similar this process is to solving equations. Worked example 4 Make the variable shown in brackets the subject of the formula in each case. a x + y = c (y) b x y z + = x y + = x y (x) c a b c d a b a b = (b) a x + y = c ⇒ y = c − x Subtract x from both sides. b x y z + = x y + = x y ⇒ = ⇒ = − x z ⇒ = x z ⇒ = y Subtract y from both sides. ⇒ = ( ) − ( ) x z ⇒ = x z ⇒ = ( ) x z ( ) ( ) ( )2 Square both sides. c a b c d a b a b = ⇒ a − b = cd Multiply both sides by c to clear the fraction. ⇒ a = cd + b Make the number of b’s positive by adding b to both sides. ⇒ a − cd = b Subtract cd from both sides. So b = a − cd Re-write so the subject is on the left. ⇒ is a symbol that can be used to mean ‘implies that’. Exercise 6.4 Make the variable shown in brackets the subject of the formula in each case. 1 a a + b = c (a) b p − q = r (r) c fh = g (h) d ab + c = d (b) e a b c = (a) f an − m = t (n) 2 a an − m = t (m) b a(n − m) = t (a) c xy z t = (x) d x a b c x a x a = (x) e x(c − y) = d (y) f a − b = c (b) 3 a p r q t − = − = (r) b x a b c x a x a = (b) c a(n − m) = t (m) d a b c d = (a) e x a b c x a x a = (a) f xy z t = (z) 4 a b c b c b c (b) b ab c = (b) c a b a b c = (b) d b c c + = b c + = b c (b) e x b c − = x b − = x b (b) f x y c = (y) Remember that what you do to one side of the formula must be done to the other side. This ensures that the formula you produce still represents the same relationship between the variables. e s s - R e v i e w C o p y - C a m b r i d g e U n i v e r s i t y P r e s s - R e v i e w C o p y R e v i e w C o p y - C a m b r i d g e U n i v e r s i t y P r e s s - R e v i e w C o p y R e v i e w C o p y - C a m b r i d g e U n i v e r s i t y P r e s s - R e v i e w C o p y R e v i e w C o p y - C a m b r i d g e U n i v e r s i t y Copyright Material - Review Only - Not for Redistribution
- 141. Unit 2: Algebra 131 6 Equations and rearranging formulae Applying your skills 5 A rocket scientist is trying to calculate how long a Lunar Explorer Vehicle will take to descend towards the surface of the moon. He knows that if u = initial speed and v = speed at time t seconds, then: v = u + at where a is the acceleration and t is the time that has passed. If the scientist wants to calculate the time taken for any given values of u, v, and a, he must rearrange the formula to make a the subject. Do this for the scientist. 6 Geoff is the Headmaster of a local school, who has to report to the board of Governors on how well the school is performing. He does this by comparing the test scores of pupils across an entire school. He has worked out the mean but also wants know the spread about the mean so that the Governors can see that it is representative of the whole school. He uses a well-known formula from statistics for the upper bound b of a class mean: b a s n = + b a = + b a 3 where s = sample spread about the mean, n = the sample size, a = the school mean and b = the mean maximum value. If Geoff wants to calculate the standard deviation (diversion about the mean) from values of b, n and a he will need to rearrange this formula to make s the subject. Rearrange the formula to make s the subject to help Geoff. 7 If the length of a pendulum is l metres, the acceleration due to gravity is g m s−2 and T is the period of the oscillation in seconds then: T l g = 2π Rearrange the formula to make l the subject. Summary Do you know the following? • Expanding brackets means to multiply all the terms inside the bracket by the term outside. • A variable is a letter or symbol used in an equation or formula that can represent many values. • A linear equation has no variable with a power greater than one. • Solving an equation with one variable means to find the value of the variable. • When solving equations you must make sure that you always do the same to both sides. • Factorising is the reverse of expanding brackets. • A formula can be rearranged to make a different variable the subject. • A recurring fraction can be written as an exact fraction. Are you able to . . . ? • expand brackets, taking care when there are negative signs • solve a linear equation • factorise an algebraic expressions by taking out any common factors • rearrange a formulae to change the subject by treating the formula as if it is an equation. E E e s s - R e v i e w C o p y - C a m b r i d g e U n i v e r s i t y P r e s s - R e v i e w C o p y R e v i e w C o p y - C a m b r i d g e U n i v e r s i t y P r e s s - R e v i e w C o p y R e v i e w C o p y - C a m b r i d g e U n i v e r s i t y P r e s s - R e v i e w C o p y R e v i e w C o p y - C a m b r i d g e U n i v e r s i t y Copyright Material - Review Only - Not for Redistribution
- 142. Unit 2: Algebra 132 Examination practice Exam-style questions 1 Given that T = 3p − 5, calculate T when p = 12. 2 In mountaineering, in general, the higher you go, the colder it gets. This formula shows how the height and temperature are related. Temperature drop ( C) height increase (m) ° = C) ° = 200 a If the temperature at a height of 500m is 23°C, what will it be when you climb to 1300m? b How far would you need to climb to experience a temperature drop of 5°C? 3 The formula e = 3n can be used to relate the number of sides (n) in the base of a prism to the number of edges (e) that the prism has. a Make n the subject of the formula. b Find the value of n for a prism with 21 edges. Past paper questions 1 Factorise 2x − 4xy. [2] [Cambridge IGCSE Mathematics 0580 Paper 22 Q2 Feb/March 2016] 2 Make r the subject of this formula. v p r = + = + p r = + p r 3 = + = + [2] [Cambridge IGCSE Mathematics 0580 Paper 22 Q5 October/November 2014] 3 Expand the brackets. y(3 − y3 ) [2] [Cambridge IGCSE Mathematics 0580 Paper 13 Q9 October/November 2012] 4 Factorise completely. 4xy + 12yz [2] [Cambridge IGCSE Mathematics 0580 Paper 13 Q13 October/November 2012] 5 Solve the equation. 5(2y − 17) = 60 [3] [Cambridge IGCSE Mathematics 0580 Paper 22 Q12 May/June 2013] 6 Solve the equation (3x − 5) = 16. [2] [Cambridge IGCSE Mathematics 0580 Paper 13 Q5 May/June 2013] 7 Factorise completely. 6xy2 + 8y [2] [Cambridge IGCSE Mathematics 0580 Paper 13 Q9 May/June 2013] E e s s - R e v i e w C o p y - C a m b r i d g e U n i v e r s i t y P r e s s - R e v i e w C o p y R e v i e w C o p y - C a m b r i d g e U n i v e r s i t y P r e s s - R e v i e w C o p y R e v i e w C o p y - C a m b r i d g e U n i v e r s i t y P r e s s - R e v i e w C o p y R e v i e w C o p y - C a m b r i d g e U n i v e r s i t y Copyright Material - Review Only - Not for Redistribution
- 143. 133 Unit 2: Shape, space and measures • Perimeter • Area • Irrational number • Sector • Arc • Semi-circle • Solid • Net • Vertices • Face • Surface area • Volume • Apex • Slant height Key words The glass pyramid at the entrance to the Louvre Art Gallery in Paris. Reaching to a height of 20.6m, it is a beautiful example of a three-dimensional object. A smaller pyramid – suspended upside down – acts as a skylight in an underground mall in front of the museum. When runners begin a race around a track they do not start in the same place because their routes are not the same length. Being able to calculate the perimeters of the various lanes allows the officials to stagger the start so that each runner covers the same distance. A can of paint will state how much area it should cover, so being able to calculate the areas of walls and doors is very useful to make sure you buy the correct size can. How much water do you use when you take a bath instead of a shower? As more households are metered for their water, being able to work out the volume used will help to control the budget. In this chapter you will learn how to: • calculate areas and perimeters of two- dimensional shapes • calculate areas and perimeters of shapes that can be separated into two or more simpler polygons • calculate areas and circumferences of circles • calculate perimeters and areas of circular sectors • understand nets for three- dimensional solids • calculate volumes and surface areas of solids • calculate volumes and surface area of pyramids, cones and spheres. Chapter 7: Perimeter, area and volume e s s - R e v i e w C o p y - C a m b r i d g e U n i v e r s i t y P r e s s - R e v i e w C o p y R e v i e w C o p y - C a m b r i d g e U n i v e r s i t y P r e s s - R e v i e w C o p y R e v i e w C o p y - C a m b r i d g e U n i v e r s i t y P r e s s - R e v i e w C o p y R e v i e w C o p y - C a m b r i d g e U n i v e r s i t y Copyright Material - Review Only - Not for Redistribution
- 144. Cambridge IGCSE Mathematics 134 Unit 2: Shape, space and measures RECAP You should already be familiar with the following perimeter, area and volume work: Perimeter Perimeter is the measured or calculated length of the boundary of a shape. The perimeter of a circle is its circumference. You can add the lengths of sides or use a formula to calculate perimeter. P = 2(l+ b) P = 4 s C = πd b l s d Area The area of a region is the amount of space it occupies. Area is measured in square units. The surface area of a solid is the sum of the areas of its faces. The area of basic shapes is calculated using a formula. A = s2 A = lb A = π r2 b l s h b A = bh 1 2 r Volume The volume of a solid is the amount of space it occupies. Volume is measured in cubic units. The volume of cuboids and prisms can be calculated using a formula. h l h h b V = l b h V = Area of cross section × height π r2 bh 1 2 e s s - R e v i e w C o p y - C a m b r i d g e U n i v e r s i t y P r e s s - R e v i e w C o p y R e v i e w C o p y - C a m b r i d g e U n i v e r s i t y P r e s s - R e v i e w C o p y R e v i e w C o p y - C a m b r i d g e U n i v e r s i t y P r e s s - R e v i e w C o p y R e v i e w C o p y - C a m b r i d g e U n i v e r s i t y Copyright Material - Review Only - Not for Redistribution
- 145. 135 Unit 2: Shape, space and measures 7 Perimeter, area and volume 7.1 Perimeter and area in two dimensions Polygons A polygon is a flat (two-dimensional) shape with three or more straight sides. The perimeter of a polygon is the sum of the lengths of its sides. The perimeter measures the total distance around the outside of the polygon. The area of a polygon measures how much space is contained inside it. Two-dimensional shapes Formula for area Quadrilaterals with parallel sides b h b h b h rhombus rectangle parallelogram Area = bh Triangles b h b h b h Area = 1 2 bh or bh 2 Trapezium b h b h a a Area = 1 2 ( ) a b ( ) a b ( )h ( ) a b ( ) a b or ( ) a b ( ) a b ( )h ( ) a b ( ) a b 2 Here are some examples of other two-dimensional shapes. kite regular hexagon irregular pentagon It is possible to find areas of other polygons such as those on the left by dividing the shape into other shapes such as triangles and quadrilaterals. When geographers study coastlines it is sometimes very handy to know the length of the coastline. If studying an island, then the length of the coastline is the same as the perimeter of the island. LINK LINK LINK LINK e s s - R e v i e w C o p y - C a m b r i d g e U n i v e r s i t y P r e s s - R e v i e w C o p y R e v i e w C o p y - C a m b r i d g e U n i v e r s i t y P r e s s - R e v i e w C o p y R e v i e w C o p y - C a m b r i d g e U n i v e r s i t y P r e s s - R e v i e w C o p y R e v i e w C o p y - C a m b r i d g e U n i v e r s i t y Copyright Material - Review Only - Not for Redistribution
- 146. Cambridge IGCSE Mathematics 136 Unit 2: Shape, space and measures At this point you may need to remind yourself of the work you did on rearrangment of formulae in chapter 6. REWIND Worked example 1 a Calculate the area of the shape shown in the diagram. 5 cm 7 cm 6 cm This shape can be divided into two simple polygons: a rectangle and a triangle. Work out the area of each shape and then add them together. 5 cm 7 cm 5 cm 6 cm rectangle triangle Area of rectangle = bh = × = 7 5 = × 7 5 = × 35 2 cm (substitute values in place of b and h) Area of triangle = 1 2 1 2 5 6 1 2 30 15 2 bh = × = × × = 5 6 × = 5 6 × = 30 × = cm Total area = 35 + 15 = 50cm2 b The area of a triangle is 40cm2 . If the base of the triangle is 5cm, find the height. A b h A b = × A b A b = × × 1 A b A b 2 40 1 2 5 40 2 5 40 2 5 80 5 16 = × = × × ⇒ × 40 ⇒ × = × 2 5 = × 2 5 ⇒ = × = = = = h h h ⇒ = ⇒ = cm Use the formula for the area of a triangle. Substitute all values that you know. Rearrange the formula to make h the subject. The formula for the area of a triangle can be written in different ways: 1 2 2 1 2 × × = = b h × × b h × × bh b h b h b h b h b h b h b h × b h OR OR = × b h b h = × b h = × b h b h b h b h b h b h 1 b h b h 2 Choose the way that works best for you, but make sure you write it down as part of your method. You do not usually have to redraw the separate shapes, but you might find it helpful. Units of area If the dimensions of your shape are given in cm, then the units of area are square centimetres and this is written cm2 . For metres, m2 is used and for kilometres, km2 is used and so on. Area is always given in square units. Tip You should always give units for a final answer if it is appropriate to do so. It can, however, be confusing if you include units throughout your working. e s s - R e v i e w C o p y - C a m b r i d g e U n i v e r s i t y P r e s s - R e v i e w C o p y R e v i e w C o p y - C a m b r i d g e U n i v e r s i t y P r e s s - R e v i e w C o p y R e v i e w C o p y - C a m b r i d g e U n i v e r s i t y P r e s s - R e v i e w C o p y R e v i e w C o p y - C a m b r i d g e U n i v e r s i t y Copyright Material - Review Only - Not for Redistribution
- 147. 137 Unit 2: Shape, space and measures 7 Perimeter, area and volume Exercise 7.1 1 By measuring the lengths of each side and adding them together, find the perimeter of each of the following shapes. a b c d 2 Calculate the perimeter of each of the following shapes. a 2.5 cm 5.5 cm b 4 cm 3 cm 5 cm c 7 cm 10 cm 4 cm 4 cm d 2 cm 2 cm 10 cm 9 cm e 8.4 m 1.9 m 2.8 m 2.5 m 7.2 m f 9 km 8 km 3 km 3 km Agricultural science involves work with perimeter, area and rates. For example, fertiliser application rates are often given in kilograms per hectare (an area of 10 000 m2 ). Applying too little or too much fertiliser can have serious implications for crops and food production. LINK e s s - R e v i e w C o p y - C a m b r i d g e U n i v e r s i t y P r e s s - R e v i e w C o p y R e v i e w C o p y - C a m b r i d g e U n i v e r s i t y P r e s s - R e v i e w C o p y R e v i e w C o p y - C a m b r i d g e U n i v e r s i t y P r e s s - R e v i e w C o p y R e v i e w C o p y - C a m b r i d g e U n i v e r s i t y Copyright Material - Review Only - Not for Redistribution
- 148. Cambridge IGCSE Mathematics 138 Unit 2: Shape, space and measures 3 Calculate the area of each of the following shapes. a 11 cm 5 cm b 5 m 3 m c 5 m 4 m d 3.2 cm 1.4 cm e 8 m 2 m f 2.8 cm g 6 cm 5 cm 10 cm h 6 m 6 m 8 m i 4 cm 4 cm j 12 cm 6 cm 6 cm 4 The following shapes can all be divided into simpler shapes. In each case find the total area. a 5 m 8 m 4 m 8 m b 7.2 m 4.5 m 1.2 m 2.1 m 5.1 m Draw the simpler shapes separately and then calculate the individual areas, as in worked example 1. e s s - R e v i e w C o p y - C a m b r i d g e U n i v e r s i t y P r e s s - R e v i e w C o p y R e v i e w C o p y - C a m b r i d g e U n i v e r s i t y P r e s s - R e v i e w C o p y R e v i e w C o p y - C a m b r i d g e U n i v e r s i t y P r e s s - R e v i e w C o p y R e v i e w C o p y - C a m b r i d g e U n i v e r s i t y Copyright Material - Review Only - Not for Redistribution
- 149. 139 Unit 2: Shape, space and measures 7 Perimeter, area and volume c 4.9 cm 5.3 cm 8.2 cm d 7.8 cm 7.2 cm 7.2 cm 3.4 cm 5.4 cm 2.1 cm e 18 cm 2.4 cm 12 cm 12 cm f 19.1 cm 38.2 cm 3.8 cm g 3.71 cm 1.82 cm 7.84 cm 8.53 cm 5 For each of the following shapes you are given the area and one other measurement. Find the unknown length in each case. a 8 cm h 24 2 cm b 17 cm b 289 2 cm Write down the formula for the area in each case. Substitute into the formula the values that you already know and then rearrange it to find the unknown quantity. c 16 cm a 14 cm 132 2 cm d 75 cm2 15 cm b e 6 cm 6 cm 18 cm h 200 cm2 6 How many 20 cm by 30 cm rectangular tiles would you need to tile the outdoor area shown below? 1.7 m 4.8 m 0.9 m 2.6 m 7 Sanjay has a square mirror measuring 10 cm by 10 cm. Silvie has a square mirror which covers twice the area of Sanjay’s mirror. Determine the dimensions of Silvie’s mirror correct to 2 decimal places. e s s - R e v i e w C o p y - C a m b r i d g e U n i v e r s i t y P r e s s - R e v i e w C o p y R e v i e w C o p y - C a m b r i d g e U n i v e r s i t y P r e s s - R e v i e w C o p y R e v i e w C o p y - C a m b r i d g e U n i v e r s i t y P r e s s - R e v i e w C o p y R e v i e w C o p y - C a m b r i d g e U n i v e r s i t y Copyright Material - Review Only - Not for Redistribution
- 150. Cambridge IGCSE Mathematics 140 Unit 2: Shape, space and measures E 8 For each of the following, draw rough sketches and give the dimensions: a two rectangles with the same perimeter but different areas b two rectangles with the same area but different perimeters c two parallelograms with the same perimeter but different areas d two parallelograms with the same area but different perimeters. 9 2(x + 1) + 3 4(y – 2) 3y + 4 3x + 2 NOT TO SCALE Find the area and perimeter of the rectangle shown in the diagram above. Circles Archimedes worked out the formula for the area of a circle by inscribing and circumscribing polygons with increasing numbers of sides. The circle seems to appear everywhere in our everyday lives. Whether driving a car, running on a race track or playing basketball, this is one of a number of shapes that are absolutely essential to us. Finding the circumference of a circle Circumference is the word used to identify the perimeter of a circle. Note that the diameter = 2 × radius (2r). The Ancient Greeks knew that they could find the circumference of a circle by multiplying the diameter by a particular number. This number is now known as ‘π’ (which is the Greek letter ‘p’), pronounced ‘pi’ (like apple pie). π is equal to 3.141592654. . . The circumference of a circle can be found using a number of formulae that all mean the same thing: Circumference diameter e d = × e d = = π e d e d e d = × e d = × π π d r 2 You will need to use some of the algebra from chapter 6. ‘Inscribing’ here means to draw a circle inside a polygon so that it just touches every edge. ‘Circumscribing’ means to draw a circle outside a polygon that touches every vertex. π is an example of an irrational number. The properties of irrational numbers will be discussed later in chapter 9. FAST FORWARD (where d = diameter) (where r = radius) You learned the names of the parts of a circle in chapter 3. The diagram below is a reminder of some of the parts. The diameter is the line that passes through a circle and splits it into two equal halves. REWIND circumference O is the centre r a d i u s diameter O e s s - R e v i e w C o p y - C a m b r i d g e U n i v e r s i t y P r e s s - R e v i e w C o p y R e v i e w C o p y - C a m b r i d g e U n i v e r s i t y P r e s s - R e v i e w C o p y R e v i e w C o p y - C a m b r i d g e U n i v e r s i t y P r e s s - R e v i e w C o p y R e v i e w C o p y - C a m b r i d g e U n i v e r s i t y Copyright Material - Review Only - Not for Redistribution
- 151. 141 Unit 2: Shape, space and measures 7 Perimeter, area and volume Finding the area of a circle There is a simple formula for calculating the area of a circle. Here is a method that shows how the formula can be worked out: Consider the circle shown in the diagram below. It has been divided into 12 equal parts and these have been rearranged to give the diagram on the right. length ≈ × = 1 2 2 r r height ≈ r r π π Because the parts of the circle are narrow, the shape almost forms a rectangle with height equal to the radius of the circle and the length equal to half of the circumference. Now, the formula for the area of a rectangle is Area = bh so, Area of a circle ≈ × ≈ × × = 1 2 2 2 π π r r × r r r If you try this yourself with a greater number of even narrower parts inside a circle, you will notice that the right-hand diagram will look even more like a rectangle. This indicates (but does not prove) that the area of a circle is given by: A = πr2 . You will now look at some examples so that you can see how to apply these formulae. (Using the values of b and h shown above) (Simplify) BODMAS in chapter 1 tells you to calculate the square of the radius before multiplying by π. REWIND Note that in (a), the diameter is given and in (b) only the radius is given. Make sure that you look carefully at which measurement you are given. Worked example 2 For each of the following circles calculate the circumference and the area. Give each answer to 3 significant figures. a O 8 mm a Circumference diameter mm = × = × = π = × = × π = × = × 8 25 1327 25 1 . ... . ≃ Area mm = × = = × = × = π = × = × π = × = × π = × = × r r d 2 2 2 2 4 16 50 265 50 3 . ... . ≃ b O 5 cm b Circumference diameter cm = × = × = π = × = × π = × = ×10 31 415 31 4 ( ) . ... . d r ( ) d r ( ) = × ( ) d r ( ) 2 ( ) d r ( ) = × = × ( ) d r = × ( ) ≃ Area cm = × = × = × = π = × = × π = × = × π = × = × r2 2 2 5 25 78 539 78 5 . ... . ≃ Tip Your calculator should have a π button. If it does not, use the approximation 3.142, but make sure you write this in your working. Make sure you record the final calculator answer before rounding and then state what level of accuracy you rounded to. e s s - R e v i e w C o p y - C a m b r i d g e U n i v e r s i t y P r e s s - R e v i e w C o p y R e v i e w C o p y - C a m b r i d g e U n i v e r s i t y P r e s s - R e v i e w C o p y R e v i e w C o p y - C a m b r i d g e U n i v e r s i t y P r e s s - R e v i e w C o p y R e v i e w C o p y - C a m b r i d g e U n i v e r s i t y Copyright Material - Review Only - Not for Redistribution
- 152. Cambridge IGCSE Mathematics 142 Unit 2: Shape, space and measures Worked example 3 Calculate the area of the shaded region in the diagram. 2.5 cm 20 cm 18 cm O Shaded area = area of triangle – area of circle. Area cm = − = − = × = × × − × = 1 2 1 2 18 20 × − 20 × − 2 5 160 365 160 2 2 2 bh = − bh = − r π π 2 5 2 5 . ... ≃ Substitute in values of b, h and r. Round the answer. In this case it has been rounded to 3 significant figures. Exercise 7.2 1 Calculate the area and circumference in each of the following. a O 4 m b O 3.1 mm c O 0.8 m d O 1 2 cm e O 2 km f O 2 m π In some cases you may find it helpful to find a decimal value for the radius and diameter before going any further, though you can enter exact values easily on most modern calculators. If you know how to do so, then this is a good way to avoid the introduction of rounding errors. e s s - R e v i e w C o p y - C a m b r i d g e U n i v e r s i t y P r e s s - R e v i e w C o p y R e v i e w C o p y - C a m b r i d g e U n i v e r s i t y P r e s s - R e v i e w C o p y R e v i e w C o p y - C a m b r i d g e U n i v e r s i t y P r e s s - R e v i e w C o p y R e v i e w C o p y - C a m b r i d g e U n i v e r s i t y Copyright Material - Review Only - Not for Redistribution
- 153. 143 Unit 2: Shape, space and measures 7 Perimeter, area and volume 2 Calculate the area of the shaded region in each case. a 2 cm 18 cm b 8 cm 8 cm O 8 cm 8 cm c 12 m 7 m 2 m 1 m O O d 5 cm O 15 cm 10 cm e 5 cm O 15 cm 12 cm 19 cm f 3 cm 12 cm Applying your skills 3 pond 3 m 10 m 12 m The diagram shows a plan for a rectangular garden with a circular pond. The part of the garden not covered by the pond is to be covered by grass. One bag of grass seed covers five square metres of lawn. Calculate the number of bags of seed needed for the work to be done. 4 1.2 m 0.4 m 0.5 m The diagram shows a road sign. If the triangle is to be painted white and the rest of the sign will be painted red, calculate the area covered by each colour to 1 decimal place. 5 Sixteen identical circles are to be cut from a square sheet of fabric whose sides are 0.4 m long. Find the area of the leftover fabric (to 2dp) if the circles are made as large as possible. This is a good example of a problem in which you need to carry out a series of calculations to get to the answer. Set your work out in clear steps to show how you get to the solution. e s s - R e v i e w C o p y - C a m b r i d g e U n i v e r s i t y P r e s s - R e v i e w C o p y R e v i e w C o p y - C a m b r i d g e U n i v e r s i t y P r e s s - R e v i e w C o p y R e v i e w C o p y - C a m b r i d g e U n i v e r s i t y P r e s s - R e v i e w C o p y R e v i e w C o p y - C a m b r i d g e U n i v e r s i t y Copyright Material - Review Only - Not for Redistribution
- 154. Cambridge IGCSE Mathematics 144 Unit 2: Shape, space and measures Exercise 7.3 1 Find the circumference and area of each shape. Give each answer as a multiple of π. 9 cm a b c 120 cm 37 cm d e f 14 cm 6 cm 6 cm 9.2 mm 6 Anna and her friend usually order a large pizza to share. The large pizza has a diameter of 24 cm. This week they want to eat different things on their pizzas, so they decide to order two small pizzas. The small pizza has a diameter of 12 cm. They want to know if there is the same amount of pizza in two small pizzas as in one large. Work out the answer. Exact answers as multiples of π Pi is an irrational number so it has no exact decimal or fractional value. For this reason, calculations in which you give a rounded answer or work with an approximate value of pi are not exact answers. If you are asked to give an exact answer in any calculation that uses pi it means you have to give the answer in terms of pi. In other words, your answer will be a multiple of pi and the π symbol should be in the answer. If the circumference or area of a circle is given in terms of π, you can work out the length of the diameter or radius by dividing by pi. For example, if C = 5π cm the diameter is 5 cm and the radius is 2.5 cm (half the diameter). Similarly, if A = 25π cm2 then r2 = 25 and r = 25 = 5 cm. Worked example 4 Worked example 4 For each calculation, give your answer as a multiple of π. a Find the circumference of a circle with a diameter of 12 cm. b What is the exact circumference of a circle of radius 4 mm? c Determine the area of a circle with a diameter of 10 m. d What is the radius of a circle of circumference 2.8π cm? a C = πd C = 12π cm Multiply the diameter by 12 and remember to write the units. b C = πd C = 2 × 4 × π = 8π mm Remember the diameter is 2 × the radius. c A = πr2 r = 5 m , so A = π × 52 A = 25π m d C = πd So, d = C π 2.8π π = 2.8 cm r = 1.4 cm Divide the diameter by 2 to find the radius. e s s - R e v i e w C o p y - C a m b r i d g e U n i v e r s i t y P r e s s - R e v i e w C o p y R e v i e w C o p y - C a m b r i d g e U n i v e r s i t y P r e s s - R e v i e w C o p y R e v i e w C o p y - C a m b r i d g e U n i v e r s i t y P r e s s - R e v i e w C o p y R e v i e w C o p y - C a m b r i d g e U n i v e r s i t y Copyright Material - Review Only - Not for Redistribution
- 155. 145 Unit 2: Shape, space and measures 7 Perimeter, area and volume 2 For each of the following, give the answer as a multiple of π. a Calculate the circumference of a circle of diameter 10 cm. b A circle has a radius of 7 mm. What is its circumference? c What is the area of a circle of diameter 1.9 cm? d The radius of a semi-circle is 3 cm. What is the area of the semi-circle? 3 A circle of circumference 12π cm is precision cut from a metal square as shown. a What is the length of each side of the square? b What area of metal is left once the circle has been cut from it? Give your answer in terms of π. 4 The diagram shows two concentric circles. The inner circle has a circumference of 14π mm. The outer circle has a radius of 9 mm. Determine the exact area of the shaded portion. Arcs and sectors major sector O minor sector r r θ arc length The diagram shows a circle with two radii (plural of radius) drawn from the centre. The region contained in-between the two radii is known as a sector. Notice that there is a major sector and a minor sector. A section of the circumference is known as an arc. The Greek letter θ represents the angle subtended at the centre. Notice that the minor sector is a fraction of the full circle. It is θ 360 of the circle. Area of a circle is πr2 . The sector is θ 360 of a circle, so replace ‘of’ with ‘×’ to give: Sector area = θ 360 × πr2 Circumference of a circle is 2πr. If the sector is θ 360 of a circle, then the length of the arc of a sector is θ 360 of the circumference. So; Arc length = θ 360 × 2πr Make sure that you remember the following two special cases: • If θ = 90° then you have a quarter of a circle. This is known as a quadrant. • If θ = 180° then you have a half of a circle. This is known as a semi-circle. e s s - R e v i e w C o p y - C a m b r i d g e U n i v e r s i t y P r e s s - R e v i e w C o p y R e v i e w C o p y - C a m b r i d g e U n i v e r s i t y P r e s s - R e v i e w C o p y R e v i e w C o p y - C a m b r i d g e U n i v e r s i t y P r e s s - R e v i e w C o p y R e v i e w C o p y - C a m b r i d g e U n i v e r s i t y Copyright Material - Review Only - Not for Redistribution
- 156. Cambridge IGCSE Mathematics 146 Unit 2: Shape, space and measures E Exercise 7.4 1 For each of the following shapes find the area and perimeter. a O 40° 6 cm b O 45° 8 cm c O 15° 3.2 cm d O 17.2 cm e O 15.4 m f 0.28 cm O Note that for the perimeter you need to add 5m twice. This happens because you need to include the two straight edges. Note that the size of θ has not been given. You need to calculate it (θ = 360 − 65). To find the perimeter you need the arc length, so calculate that separately. Worked example 5 Find the area and perimeter of shapes a and b, and the area of shape c. Give your answer to 3 significant figures. a 30° O 5 m . ... Area m = × = × = × = × × = θ 360 30 360 5 6 544 6 5 . 6 54 2 2 2 π π r ≃ Perimeter m = × = × = × = × + × = θ 360 2 2 30 360 2 5 × × 2 5 2 5 + × 2 5 + × 12 617 12 6 π 2 2 2 2 π 2 5 2 5 × × 2 5 × × 2 5 r r 2 2 r r 2 2 + 2 2 r r 2 2 . ... . ≃ b O 6 cm 4 cm Total area = area of triangle + area of a semi-circle. Area cm = + = + = × × + × = 1 2 1 2 1 2 8 6 × × + 8 6 × × + 1 2 4 49 132 49 1 2 2 2 bh = + bh = + r π π . ... . ≃ (Semi-circle is half of a circle so divide circle area by 2). c θ 4 cm 65° . ... . Area cm = × = × = − × × = × = × × = θ 360 360 65 360 4 295 360 16 41 189 . . 189 . . 41 2 2 2 π π × × × × π r ≃ 2 2 Perimeter cm = × = × = × = × + × = θ 360 2 2 295 360 2 4 × × 2 4 2 4 + × 2 4 + × 28 594 28 6 π 2 2 2 2 π 2 4 2 4 × × 2 4 × × 2 4 r r 2 2 r r 2 2 + 2 2 r r 2 2 . ... . ≃ You will be able to find the perimeter of this third shape after completing the work on Pythagoras’ theorem in chapter 11. FAST FORWARD You should have spotted that you do not have enough information to calculate the perimeter of the top part of the shape using the rules you have learned so far. Note that the base of the triangle is the diameter of the circle. e s s - R e v i e w C o p y - C a m b r i d g e U n i v e r s i t y P r e s s - R e v i e w C o p y R e v i e w C o p y - C a m b r i d g e U n i v e r s i t y P r e s s - R e v i e w C o p y R e v i e w C o p y - C a m b r i d g e U n i v e r s i t y P r e s s - R e v i e w C o p y R e v i e w C o p y - C a m b r i d g e U n i v e r s i t y Copyright Material - Review Only - Not for Redistribution
- 157. 147 Unit 2: Shape, space and measures 7 Perimeter, area and volume g 4.3 cm O h OO 6 m 14 m O 2 Find the area of the coloured region and find the arc length l in each of the following. a 70° l O 18 cm b 120° 8.2 cm l O c 6.4 cm 95° O l d 175° 3 m O l Find the area and perimeter of the following: e O 75° 5 m f 62° 62° 15 cm Q2, part b is suitable for Core learners. 3 For each of the following find the area and perimeter of the coloured region. a 5 cm 8 cm b 9 cm 10 cm 6 cm E e s s - R e v i e w C o p y - C a m b r i d g e U n i v e r s i t y P r e s s - R e v i e w C o p y R e v i e w C o p y - C a m b r i d g e U n i v e r s i t y P r e s s - R e v i e w C o p y R e v i e w C o p y - C a m b r i d g e U n i v e r s i t y P r e s s - R e v i e w C o p y R e v i e w C o p y - C a m b r i d g e U n i v e r s i t y Copyright Material - Review Only - Not for Redistribution
- 158. Cambridge IGCSE Mathematics 148 Unit 2: Shape, space and measures c 30° 30° 5 m 12 m d 8.4 cm 8.4 cm e 18 m 18 m 4 Each of the following shapes can be split into simpler shapes. In each case find the perimeter and area. a 28 cm b 1.5 cm 1.3 cm c 100° 3.2 cm d 3 cm 7 cm 11 cm 7.2 Three-dimensional objects We now move into three dimensions but will use many of the formulae for two-dimensional shapes in our calculations. A three-dimensional object is called a solid. Nets of solids A net is a two-dimensional shape that can be drawn, cut out and folded to form a three- dimensional solid. You might be asked to count the number of vertices (corners), edges and faces that a solid has. Tip E e s s - R e v i e w C o p y - C a m b r i d g e U n i v e r s i t y P r e s s - R e v i e w C o p y R e v i e w C o p y - C a m b r i d g e U n i v e r s i t y P r e s s - R e v i e w C o p y R e v i e w C o p y - C a m b r i d g e U n i v e r s i t y P r e s s - R e v i e w C o p y R e v i e w C o p y - C a m b r i d g e U n i v e r s i t y Copyright Material - Review Only - Not for Redistribution
- 159. 149 Unit 2: Shape, space and measures 7 Perimeter, area and volume The following shape is the net of a solid that you should be quite familiar with. A A B A B C D C B D If you fold along the dotted lines and join the points with the same letters then you will form this cube: A C B D You should try this yourself and look carefully at which edges (sides) and which vertices (the points or corners) join up. Exercise 7.5 1 The diagram shows a cuboid. Draw a net for the cuboid. a b c 2 The diagram shows the net of a solid. a Describe the solid in as much detail as you can. b Which two points will join with point M when the net is folded? c Which edges are certainly equal in length to PQ? S T M Z R U Q V N Y P W O X e s s - R e v i e w C o p y - C a m b r i d g e U n i v e r s i t y P r e s s - R e v i e w C o p y R e v i e w C o p y - C a m b r i d g e U n i v e r s i t y P r e s s - R e v i e w C o p y R e v i e w C o p y - C a m b r i d g e U n i v e r s i t y P r e s s - R e v i e w C o p y R e v i e w C o p y - C a m b r i d g e U n i v e r s i t y Copyright Material - Review Only - Not for Redistribution
- 160. Cambridge IGCSE Mathematics 150 Unit 2: Shape, space and measures 3 A teacher asked her class to draw the net of a cuboid cereal box. These are the diagrams that three students drew. Which of them is correct? 4 How could you make a cardboard model of this octahedral dice? Draw labelled sketches to show your solution. 7.3 Surface areas and volumes of solids The flat, two-dimensional surfaces on the outside of a solid are called faces. The area of each face can be found using the techniques from earlier in this chapter. The total area of the faces will give us the surface area of the solid. The volume is the amount of space contained inside the solid. If the units given are cm, then the volume is measured in cubic centimetres (cm3 ) and so on. Some well known formulae for surface area and volume are shown below. Cuboids A cuboid has six rectangular faces, 12 edges and eight vertices. If the length, breadth and height of the cuboid are a, b and c (respectively) then the surface area can be found by thinking about the areas of each rectangular face. a b c Notice that the surface area is exactly the same as the area of the cuboid’s net. Surface area of cuboid = 2(ab + ac + bc) Volume of cuboid = a × b × c c a c c c b b a × b b c a It can be helpful to draw the net of a solid when trying to find its surface area. If you can't visualise the solution to problems like this one, you can build models to help you. e s s - R e v i e w C o p y - C a m b r i d g e U n i v e r s i t y P r e s s - R e v i e w C o p y R e v i e w C o p y - C a m b r i d g e U n i v e r s i t y P r e s s - R e v i e w C o p y R e v i e w C o p y - C a m b r i d g e U n i v e r s i t y P r e s s - R e v i e w C o p y R e v i e w C o p y - C a m b r i d g e U n i v e r s i t y Copyright Material - Review Only - Not for Redistribution
- 161. 151 Unit 2: Shape, space and measures 7 Perimeter, area and volume The volume of a cuboid is its length × breadth × height. So, volume of cuboid = a × b × c. a b c Prisms A prism is a solid whose cross-section is the same all along its length. (A cross-section is the surface formed when you cut parallel to a face.) cross-section length The cuboid is a special case of a prism with a rectangular cross-section. A triangular prism has a triangular cross-section. cross-section length cross-section length The surface area of a prism is found by working out the area of each face and adding the areas together. There are two ends with area equal to the cross-sectional area. The remaining sides are all the same length, so their area is equal to the perimeter of the cross-section multiplied by the length: surface area of a prism = 2 × area of cross-section + perimeter of cross-section × length The volume of a prism is found by working out the area of the cross-section and multiplying this by the length. volume of a prism = area of cross-section × length Cylinders A cylinder is another special case of a prism. It is a prism with a circular cross-section. r h r h e s s - R e v i e w C o p y - C a m b r i d g e U n i v e r s i t y P r e s s - R e v i e w C o p y R e v i e w C o p y - C a m b r i d g e U n i v e r s i t y P r e s s - R e v i e w C o p y R e v i e w C o p y - C a m b r i d g e U n i v e r s i t y P r e s s - R e v i e w C o p y R e v i e w C o p y - C a m b r i d g e U n i v e r s i t y Copyright Material - Review Only - Not for Redistribution
- 162. Cambridge IGCSE Mathematics 152 Unit 2: Shape, space and measures A cylinder can be ‘unwrapped’ to produce its net. The surface consists of two circular faces and a curved face that can be flattened to make a rectangle. Curved surface area of a cylinder = 2πrh and Volume = πr h 2 r h r h. h 2 r π Exercise 7.6 1 Find the volume and surface area of the solid with the net shown in the diagram. 3 cm 3 cm 4 cm 5 cm 5 cm 11 cm 5 cm 5 cm 4 cm 3 cm 3 cm 2 Find (i) the volume and (ii) the surface area of the cuboids with the following dimensions: a length = 5cm, breadth = 8cm, height = 18cm b length = 1.2mm, breadth = 2.4mm, height = 4.8mm Applying your skills 3 The diagram shows a bottle crate. Find the volume of the crate. FIZZ 90 cm 60 cm 80 cm You may be asked to give exact answers to surface area and volume calculations where pi is part of the formula. If so, give your answer as a multiple of π. Tip e s s - R e v i e w C o p y - C a m b r i d g e U n i v e r s i t y P r e s s - R e v i e w C o p y R e v i e w C o p y - C a m b r i d g e U n i v e r s i t y P r e s s - R e v i e w C o p y R e v i e w C o p y - C a m b r i d g e U n i v e r s i t y P r e s s - R e v i e w C o p y R e v i e w C o p y - C a m b r i d g e U n i v e r s i t y Copyright Material - Review Only - Not for Redistribution
- 163. 153 Unit 2: Shape, space and measures 7 Perimeter, area and volume 4 The diagram shows a pencil case in the shape of a triangular prism. 8 cm 6 cm 10 cm 32 cm Calculate: a the volume and b the surface area of the pencil case. 5 The diagram shows a cylindrical drain. Calculate the volume of the drain. 1.2 m 3 m 6 The diagram shows a tube containing chocolate sweets. Calculate the total surface area of the tube. 10 cm 2.2 cm 7 The diagram shows the solid glass case for a clock. The case is a cuboid with a cylinder removed (to fit the clock mechanism). Calculate the volume of glass required to make the clock case. 10 cm 8 cm 4 cm 5 cm Don’t forget to include the circular faces. e s s - R e v i e w C o p y - C a m b r i d g e U n i v e r s i t y P r e s s - R e v i e w C o p y R e v i e w C o p y - C a m b r i d g e U n i v e r s i t y P r e s s - R e v i e w C o p y R e v i e w C o p y - C a m b r i d g e U n i v e r s i t y P r e s s - R e v i e w C o p y R e v i e w C o p y - C a m b r i d g e U n i v e r s i t y Copyright Material - Review Only - Not for Redistribution
- 164. Cambridge IGCSE Mathematics 154 Unit 2: Shape, space and measures 8 A storage company has a rectangular storage area 20 m long, 8 m wide and 2.8 m high. a Find the volume of the storage area. b How many cardboard boxes of dimensions 1 m × 0.5 m × 2.5 m can fit into this storage area? c What is the surface area of each cardboard box? 9 Vuyo is moving to Brazil for his new job. He has hired a shipping container of dimensions 3 m × 4 m × 4 m to move his belongings. a Calculate the volume of the container. b He is provided with crates to fit the dimensions of the container. He needs to move eight of these crates, each with a volume of 5 m3 . Will they fit into one container? Pyramids A pyramid is a solid with a polygon-shaped base and triangular faces that meet at a point called the apex. If you find the area of the base and the area of each of the triangles, then you can add these up to find the total surface area of the pyramid. The volume can be found by using the following formula: Volume = 1 3 × × ba × × ba × × se × × se × × are × × are × × a p × × a p × × erpendicular height h Cones A cone is a special pyramid with a circular base. The length l is known as the slant height. h is the perpendicular height. l r h The curved surface of the cone can be opened out and flattened to form a sector of a circle. Curved surface area = πrl and Volume = 1 3 2 πr h 2 r h The perpendicular height is the shortest distance from the base to the apex. The slant height can be calculated by using Pythagoras’ theorem, which you will meet in chapter 11. FAST FORWARD If you are asked for the total surface area of a cone, you must work out the area of the circular base and add it to the curved surface area. l l e n g t h o f a r c o f sector = length of circumferenc e o f b a s e o f c o n e l r h e s s - R e v i e w C o p y - C a m b r i d g e U n i v e r s i t y P r e s s - R e v i e w C o p y R e v i e w C o p y - C a m b r i d g e U n i v e r s i t y P r e s s - R e v i e w C o p y R e v i e w C o p y - C a m b r i d g e U n i v e r s i t y P r e s s - R e v i e w C o p y R e v i e w C o p y - C a m b r i d g e U n i v e r s i t y Copyright Material - Review Only - Not for Redistribution
- 165. 155 Unit 2: Shape, space and measures 7 Perimeter, area and volume Spheres The diagram shows a sphere with radius r. Surface area = 4 2 πr and Volume = 4 3 3 πr 1 The diagram shows a beach ball. a Find the surface area of the beach ball. b Find the volume of the beach ball. 40 cm 2 The diagram shows a metal ball bearing that is completely submerged in a cylinder of water. Find the volume of water in the cylinder. 30 cm 2 cm 15 cm 3 The Great Pyramid at Giza has a square base of side 230m and perpendicular height 146m. Find the volume of the Pyramid. Exercise 7.7 r The volume of the water is the volume in the cylinder minus the displacement caused by the metal ball. The displacement is equal to the volume of the metal ball. Remember, if you are asked for an exact answer you must give the answer as a multiple of π and you cannot use approximate values in the calculation. e s s - R e v i e w C o p y - C a m b r i d g e U n i v e r s i t y P r e s s - R e v i e w C o p y R e v i e w C o p y - C a m b r i d g e U n i v e r s i t y P r e s s - R e v i e w C o p y R e v i e w C o p y - C a m b r i d g e U n i v e r s i t y P r e s s - R e v i e w C o p y R e v i e w C o p y - C a m b r i d g e U n i v e r s i t y Copyright Material - Review Only - Not for Redistribution
- 166. Cambridge IGCSE Mathematics 156 Unit 2: Shape, space and measures 4 The diagram shows a rocket that consists of a cone placed on top of a cylinder. a Find the surface area of the rocket. b Find the volume of the rocket. 5 m 13 m 1 2 m 2 5 m 5 The diagram shows a child’s toy that consists of a hemisphere (half of a sphere) and a cone. a Find the volume of the toy. b Find the surface area of the toy. 8 cm 6 cm 10 cm 6 The sphere and cone shown in the diagram have the same volume. Find the radius of the sphere. 2.4 cm 8.3 cm r 7 The volume of the larger sphere (of radius R) is twice the volume of the smaller sphere (of radius r). Find an equation connecting r to R. R r e s s - R e v i e w C o p y - C a m b r i d g e U n i v e r s i t y P r e s s - R e v i e w C o p y R e v i e w C o p y - C a m b r i d g e U n i v e r s i t y P r e s s - R e v i e w C o p y R e v i e w C o p y - C a m b r i d g e U n i v e r s i t y P r e s s - R e v i e w C o p y R e v i e w C o p y - C a m b r i d g e U n i v e r s i t y Copyright Material - Review Only - Not for Redistribution
- 167. 157 Unit 2: Shape, space and measures 7 Perimeter, area and volume 8 A 32 cm long cardboard postage tube has a radius of 2.5 cm. a What is the exact volume of the tube? b For posting the tube is sealed at both ends. What is the surface area of the sealed tube? 9 A hollow metal tube is made using a 5 mm metal sheet. The tube is 35 cm long and has an exterior diameter of 10.4 cm. a Draw a rough sketch of the tube and add its dimensions b Write down all the calculations you will have to make to find the volume of metal in the tube. c Calculate the volume of metal in the tube. d How could you find the total surface area of the outside plus the inside of the tube? Summary Do you know the following? • The perimeter is the distance around the outside of a two-dimensional shape and the area is the space contained within the sides. • Circumference is the name for the perimeter of a circle. • If the units of length are given in cm then the units of area are cm2 and the units of volume are cm3 . This is true for any unit of length. • A sector of a circle is the region contained in-between two radii of a circle. This splits the circle into a minor sector and a major sector. • An arc is a section of the circumference. • Prisms, pyramids, spheres, cubes and cuboids are examples of three-dimensional objects (or solids). • A net is a two-dimensional shape that can be folded to form a solid. • The net of a solid can be useful when working out the surface area of the solid. Are you able to . . . ? • recognise different two-dimensional shapes and find their areas • give the units of the area • calculate the areas of various two-dimensional shapes • divide a shape into simpler shapes and find the area • find unknown lengths when some lengths and an area are given • calculate the area and circumference of a circle • calculate the perimeter, arc length and area of a sector • recognise nets of solids • fold a net correctly to create its solid • find the volumes and surface areas of a cuboid, prism and cylinder • find the volumes of solids that can be broken into simpler shapes • find the volumes and surface areas of a pyramid, cone and sphere. e s s - R e v i e w C o p y - C a m b r i d g e U n i v e r s i t y P r e s s - R e v i e w C o p y R e v i e w C o p y - C a m b r i d g e U n i v e r s i t y P r e s s - R e v i e w C o p y R e v i e w C o p y - C a m b r i d g e U n i v e r s i t y P r e s s - R e v i e w C o p y R e v i e w C o p y - C a m b r i d g e U n i v e r s i t y Copyright Material - Review Only - Not for Redistribution
- 168. Unit 2: Shape, space and measures 158 Examination practice Exam-style questions 1 A piece of rope is wound around a cylindrical pipe 18 times. If the diameter of the pipe is 600mm, how long is the rope? 2 Find the perimeter and area of this shape. 9 cm 1 cm 1 cm NOT TO SCALE 6 cm 3 A cylindrical rainwater tank is 1.5m tall with a diameter of 1.4m. What is the maximum volume of rainwater it can hold? Past paper questions 1 This diagram shows the plan of a driveway to a house. 18 m 12 m 14 m 3 m HOUSE NOT TO SCALE a Work out the perimeter of the driveway. [2] b The driveway is made from concrete. The concrete is 15 cm thick. Calculate the volume of concrete used for the driveway. Give your answer in cubic metres. [4] [Cambridge IGCSE Mathematics 0580 Paper 33 Q8 d, e October/November 2012] 2 12 cm 22 cm 10 cm NOT TO SCALE Find the area of the trapezium. [2] [Cambridge IGCSE Mathematics 0580 Paper 22 Q7 October/November 2013] e s s - R e v i e w C o p y - C a m b r i d g e U n i v e r s i t y P r e s s - R e v i e w C o p y R e v i e w C o p y - C a m b r i d g e U n i v e r s i t y P r e s s - R e v i e w C o p y R e v i e w C o p y - C a m b r i d g e U n i v e r s i t y P r e s s - R e v i e w C o p y R e v i e w C o p y - C a m b r i d g e U n i v e r s i t y Copyright Material - Review Only - Not for Redistribution
- 169. 159 Unit 2: Shape, space and measures 3 12 cm A hemisphere has a radius of 12 cm. Calculate its volume. [The volume, V, of a sphere with radius r isV r V r V r V r 4 V r V r 3 3 π V r V r .] [2] [Cambridge IGCSE Mathematics 0580 Paper 22 Q8 October/November 2013] 4 Calculate the volume of a hemisphere with radius 5 cm. [The volume, V, of a sphere with radius r isV r V r V r V r 4 V r V r 3 3 π V r V r .] [2] [Cambridge IGCSE Mathematics 0580 Paper 22 Q5 October/November 2015] 5 NOT TO SCALE 15 cm 26° The diagram shows a sector of a circle with radius 15 cm. Calculate the perimeter of this sector. [3] [Cambridge IGCSE Mathematics 0580 Paper 22 Q16 October/November 2015] E e s s - R e v i e w C o p y - C a m b r i d g e U n i v e r s i t y P r e s s - R e v i e w C o p y R e v i e w C o p y - C a m b r i d g e U n i v e r s i t y P r e s s - R e v i e w C o p y R e v i e w C o p y - C a m b r i d g e U n i v e r s i t y P r e s s - R e v i e w C o p y R e v i e w C o p y - C a m b r i d g e U n i v e r s i t y Copyright Material - Review Only - Not for Redistribution
- 170. Unit 2: Data handling 160 Chapter 8: Introduction to probability • Event • Probability • Probability scale • Trial • Experimental probability • Outcome • Theoretical probability • Favourable outcomes • Bias • Possibility diagram • Independent • Mutually exclusive Key words Blaise Pascal was a French mathematician and inventor. In 1654, a friend of his posed a problem of how the stakes of a game may be divided between the players even though the game had not yet ended. Pascal’s response was the beginning of the mathematics of probability. What is the chance that it will rain tomorrow? If you take a holiday in June, how many days of sunshine can you expect? When you flip a coin to decide which team will start a match, how likely is it that you will get a head? Questions of chance come into our everyday life from what is the weather going to be like tomorrow to who is going to wash the dishes tonight. Words like ‘certain’, ‘even’ or ‘unlikely’ are often used to roughly describe the chance of an event happening but probability refines this to numbers to help make more accurate predictions. In this chapter you will learn how to: • express probabilities mathematically • calculate probabilities associated with simple experiments • use possibility diagrams to help you calculate probability of combined events • identify when events are independent • identify when events are mutually exclusive e s s - R e v i e w C o p y - C a m b r i d g e U n i v e r s i t y P r e s s - R e v i e w C o p y R e v i e w C o p y - C a m b r i d g e U n i v e r s i t y P r e s s - R e v i e w C o p y R e v i e w C o p y - C a m b r i d g e U n i v e r s i t y P r e s s - R e v i e w C o p y R e v i e w C o p y - C a m b r i d g e U n i v e r s i t y Copyright Material - Review Only - Not for Redistribution
- 171. 161 Unit 2: Data handling 8 Introduction to probability 8.1 Basic probability When you roll a die, you may be interested in throwing a prime number. When you draw a name out of a hat, you may want to draw a boy’s name. Throwing a prime number or drawing a boy’s name are examples of events. Probability is a measure of how likely an event is to happen. Something that is impossible has a value of zero and something that is certain has a value of one. The range of values from zero to one is called a probability scale. A probability cannot be negative or be greater than one. The smaller the probability, the closer it is to zero and the less likely the associated event is to happen. Similarly, the higher the probability, the more likely the event. Performing an experiment, such as rolling a die, is called a trial. If you repeat an experiment, by carrying out a number of trials, then you can find an experimental probability of an event happening: this fraction is often called the relative frequency. P(A) number of times desired event happens number of trials = or, sometimes: P(A) number of successes number of trials = A die is the singular of dice. P(A) means the probability of event A happening. RECAP You should already be familiar with the following probability work: Calculating probability Probability always has a value between 0 and 1. The sum of probabilities of mutually exclusive events is 1. Probability = number o number of successful successful successful outcome total number o number of outcomes Relative frequency The number of times an event occurs in a number of trials is its relative frequency. Relative frequency is also called experimental probability. Relative frequency = number o number of times an o an outcome o utcome occurred number o number of trials Worked example 1 Suppose that a blindfolded man is asked to throw a dart at a dartboard. If he hits the number six 15 times out of 125 throws, what is the probability of him hitting a six on his next throw? P(six) number times a six obtained number of trials = = = 15 125 0. .1 0. .1 0. 2 20 1 18 4 13 6 10 15 2 17 3 19 7 16 8 11 14 9 12 5 Relative frequency and expected occurrences You can use relative frequency to make predictions about what might happen in the future or how often an event might occur in a larger sample. For example, if you know that the relative frequency of rolling a 4 on particular die is 18%, you can work out how many times you’d expect to get 4 when you roll the dice 80 or 200 times. e s s - R e v i e w C o p y - C a m b r i d g e U n i v e r s i t y P r e s s - R e v i e w C o p y R e v i e w C o p y - C a m b r i d g e U n i v e r s i t y P r e s s - R e v i e w C o p y R e v i e w C o p y - C a m b r i d g e U n i v e r s i t y P r e s s - R e v i e w C o p y R e v i e w C o p y - C a m b r i d g e U n i v e r s i t y Copyright Material - Review Only - Not for Redistribution
- 172. Cambridge IGCSE Mathematics 162 Unit 2: Data handling Of course a die may be weighted in some way, or imperfectly made, and indeed this may be true of any object discussed in a probability question. Under these circumstances a die, coin or other object is said to be biased. The outcomes will no longer be equally likely and you may need to use experimental probability. Worked example 2 An unbiased die is thrown and the number on the upward face is recorded. Find the probability of obtaining: a a three b an even number c a prime number. a P( ) 3 1 6 = There is only one way of throwing a three, but six possible outcomes (you could roll a 1, 2, 3, 4, 5, 6). b P e numbe ( ) P e ( ) P even ( ) numbe ( ) r ( ) = = = = 3 6 1 2 There are three even numbers on a die, giving three favourable outcomes. c P prime numbe ( ) prime ( ) numbe ( ) r ( ) = = = = 3 6 1 2 The prime numbers on a die are 2, 3 and 5, giving three favourable outcomes. Worked example 3 A card is drawn from an ordinary 52 card pack. What is the probability that the card will be a king? P King ( ) P K ( ) P Kin ( ) g ( ) = = = = 4 52 1 13 Number of possible outcomes is 52. Number of favourable outcomes is four, because there are four kings per pack. For example, if you throw an unbiased die and need the probability of an even number, then the favourable outcomes are two, four or six. There are three of them. Under these circumstances the event A (obtaining an even number) has the probability: P(A) number of favourable outcomes number of possible outco = me m me m s = = = = 3 6 1 2 Never assume that a die or any other object is unbiased unless you are told that this is so. 8.2 Theoretical probability When you flip a coin you may be interested in the event ‘obtaining a head’ but this is only one possibility. When you flip a coin there are two possible outcomes: ‘obtaining a head’ or ‘obtaining a tail.’ You can calculate the theoretical (or expected) probability easily if all of the possible outcomes are equally likely, by counting the number of favourable outcomes and dividing by the number of possible outcomes. Favourable outcomes are any outcomes that mean your event has happened. In some countries, theoretical probability is referred to as ‘expected probability’. This is a casual reference and does not mean the same thing as mathematical ‘expectation’. Biology students will sometimes consider how genes are passed from a parent to a child. There is never a certain outcome, which is why we are all different. Probability plays an important part in determining how likely or unlikely a particular genetic outcome might be. LINK 18% of 80 = 14.4 and 18% of 200 = 36, so if you rolled the same die 80 times you could expect to get a 4 about 14 times and if you rolled it 200 times, you could expect to get a 4 thirty-six times. Remember though, that even if you expected to get a 4 thirty six times, this is not a given and your actual results may be very different. e s s - R e v i e w C o p y - C a m b r i d g e U n i v e r s i t y P r e s s - R e v i e w C o p y R e v i e w C o p y - C a m b r i d g e U n i v e r s i t y P r e s s - R e v i e w C o p y R e v i e w C o p y - C a m b r i d g e U n i v e r s i t y P r e s s - R e v i e w C o p y R e v i e w C o p y - C a m b r i d g e U n i v e r s i t y Copyright Material - Review Only - Not for Redistribution
- 173. 163 Unit 2: Data handling 8 Introduction to probability Worked example 5 The picture shows the famous Hollywood sign in Los Angeles, USA. Nine painters are assigned a letter from the word HOLLYWOOD for painting at random. Find the probability that a painter is assigned: a the letter ‘Y’ b the letter ‘O’ c the letter ‘H’ or the letter ‘L’ d the letter ‘Z’. For each of these the number of possible outcomes is 9. a P Y ( ) P Y ( ) P Y = 1 9 Number of favourable outcomes is one (there is only one ‘Y’). b P O ( ) P O ( ) P O = = = = 3 9 1 3 Number of favourable outcomes is three. c P H ( ) P H ( ) P H or ( ) L ( ) = = = = 3 9 1 3 Number of favourable outcomes=number of letters that are either H or L = 3, since there is one H and two L’s in Hollywood. d P Z ( ) P Z ( ) P Z = = = = 0 9 0 Number of favourable outcomes is zero (there are no ‘Z’s) Worked example 4 Jason has 20 socks in a drawer. 8 socks are red, 10 socks are blue and 2 socks are green. If a sock is drawn at random, what is the probability that it is green? P g ( ) P g ( ) P green ( ) = = = = 2 20 1 10 Number of possible outcomes is 20. Number of favourable outcomes is two. e s s - R e v i e w C o p y - C a m b r i d g e U n i v e r s i t y P r e s s - R e v i e w C o p y R e v i e w C o p y - C a m b r i d g e U n i v e r s i t y P r e s s - R e v i e w C o p y R e v i e w C o p y - C a m b r i d g e U n i v e r s i t y P r e s s - R e v i e w C o p y R e v i e w C o p y - C a m b r i d g e U n i v e r s i t y Copyright Material - Review Only - Not for Redistribution
- 174. Cambridge IGCSE Mathematics 164 Unit 2: Data handling 8.3 The probability that an event does not happen Something may happen or it may not happen. The probability of an event happening may be different from the probability of the event not happening but the two combined probabilities will always sum up to one. If A is an event, then A is the event that A does not happen and P(A) P(A) = − 1 = − = − A is usually just pronounced as 'not A'. Exercise 8.1 1 A simple die is thrown 100 times and the number five appears 14 times. Find the experimental probability of throwing a five, giving your answer as a fraction in its lowest terms. 2 The diagram shows a spinner that is divided into exactly eight equal sectors. Ryan spins the spinner 260 times and records the results in a table: Number 1 2 3 4 5 6 7 8 Frequency 33 38 26 35 39 21 33 35 Calculate the experimental probability of spinning: a the number three b the number five c an odd number d a factor of eight. 3 A consumer organisation commissioned a series of tests to work out the average lifetime of a new brand of solar lamps. The results of the tests as summarised in the table. Lifetime of lamp, L hours 0 L 1 000 1 000 L 2 000 2000 L 3 000 3000 L Frequency 30 75 160 35 a Calculate the relative frequency of a lamp lasting for less than 3 000 hours, but more than 1 000 hours. b If a hardware chain ordered 2 000 of these lamps, how many would you expect to last for more than 3 000 hours? 4 Research shows that the probability of a person being right-handed is 0.77. How many left- handed people would you expect in a population of 25 000? 5 A flower enthusiast collected 385 examples of a Polynomialus mathematicus flower in deepest Peru. Just five of the flowers were blue. One flower is chosen at random. Find the probability that: a it is blue b it is not blue. 6 A bag contains nine equal sized balls. Four of the balls are coloured blue and the remaining five balls are coloured red. What is the probability that, when a ball is drawn from the bag: a it is blue? b it is red? c it neither blue nor red? d it is either blue or red? 1 2 3 4 5 6 7 8 Worked example 6 The probability that Jasmine passes her driving test is 2 3 . What is the probability that Jasmine fails? P(failure) = − = 1 = − = − 2 3 1 3 P(failure) = P(not passing) = 1 − P(passing) e s s - R e v i e w C o p y - C a m b r i d g e U n i v e r s i t y P r e s s - R e v i e w C o p y R e v i e w C o p y - C a m b r i d g e U n i v e r s i t y P r e s s - R e v i e w C o p y R e v i e w C o p y - C a m b r i d g e U n i v e r s i t y P r e s s - R e v i e w C o p y R e v i e w C o p y - C a m b r i d g e U n i v e r s i t y Copyright Material - Review Only - Not for Redistribution
- 175. 165 Unit 2: Data handling 8 Introduction to probability 7 A bag contains 36 balls. The probability that a ball drawn at random is blue is 1 4 . How many blue balls are there in the bag? 8 Oliver shuffles an ordinary pack of 52 playing cards. If he then draws a single card at random, find the probability that the card is: a a king b a spade c a black card d a prime-numbered card. 8.4 Possibility diagrams The probability space is the set of all possible outcomes. It can sometimes simplify our work if you draw a possibility diagram to show all outcomes clearly. See how drawing a possibility diagram helps solve problems in the following worked example. In some countries, these might be called ‘probability space diagrams’. Worked example 7 Two dice, one red and one blue, are thrown at the same time and the numbers showing on the dice are added together. Find the probability that: a the sum is 7 b the sum is less than 5 c the sum is greater than or equal to 8 d the sum is less than 8. + Blue Red 1 2 3 4 5 6 5 6 1 2 3 4 7 2 5 6 3 4 7 8 3 5 6 4 7 8 9 4 5 6 7 8 9 10 5 6 7 8 9 10 11 6 7 8 9 10 11 12 In the diagram above there are 36 possible sums, so there are 36 equally likely outcomes in total. a P( ) 7 6 36 1 6 = = = = There are six 7s in the grid, so six favourable outcomes. b P less than ( ) P l ( ) P less than ( ) 5 ( ) = = = = 6 36 1 6 The outcomes that are less than 5 are 2, 3 and 4. These numbers account for six favourable outcomes. c P greater than or equal to ( ) P g ( ) P greater than or equal to ( ) 8 ( ) = = = = 15 36 5 12 The outcomes greater than or equal to 8 (which includes 8) are 8, 9, 10, 11 or 12, accounting for 15 outcomes. d P less than ( ) P l ( ) P less than ( ) 8 ( ) = − = 1 = − = − 5 12 7 12 P(less than 8) = P(not greater than or equal to 8) = 1 − P(greater than or equal to 8) e s s - R e v i e w C o p y - C a m b r i d g e U n i v e r s i t y P r e s s - R e v i e w C o p y R e v i e w C o p y - C a m b r i d g e U n i v e r s i t y P r e s s - R e v i e w C o p y R e v i e w C o p y - C a m b r i d g e U n i v e r s i t y P r e s s - R e v i e w C o p y R e v i e w C o p y - C a m b r i d g e U n i v e r s i t y Copyright Material - Review Only - Not for Redistribution
- 176. Cambridge IGCSE Mathematics 166 Unit 2: Data handling Exercise 8.2 1 An unbiased coin is thrown twice and the outcome for each is recorded as H (head) or T (tail). A possibility diagram could be drawn as shown. a Copy and complete the diagram. b Find the probability that: i the coins show the same face ii the coins both show heads iii there is at least one head iv there are no heads. 2 Two dice are thrown and the product of the two numbers is recorded. a Draw a suitable possibility diagram to show all possible outcomes. b Find the probability that: i the product is 1 ii the product is 7 iii the product is less than or equal to 4 iv the product is greater than 4 v the product is a prime number vi the product is a square number. 3 4 6 8 The diagram shows a spinner with five equal sectors numbered 1, 2, 3, 4 and 5, and an unbiased tetrahedral die with faces numbered 2, 4, 6 and 8. The spinner is spun and the die is thrown and the higher of the two numbers is recorded. If both show the same number then that number is recorded. a Draw a possibility diagram to show the possible outcomes. b Calculate the probability that: i the higher number is even ii the higher number is odd iii the higher number is a multiple of 3 iv the higher number is prime v the higher number is more than twice the smaller number. 4 An unbiased cubical die has six faces numbered 4, 6, 10, 12, 15 and 24. The die is thrown twice and the highest common factor (HCF) of both results is recorded. a Draw a possibility diagram to show the possible outcomes. b Calculate the probability that: i the HCF is 2 ii the HCF is greater than 2 iii the HCF is not 7 iv the HCF is not 5 v the HCF is 3 or 5 vi the HCF is equal to one of the numbers thrown. Second throw H H T T T H First throw You learnt about HCF in chapter 1. REWIND e s s - R e v i e w C o p y - C a m b r i d g e U n i v e r s i t y P r e s s - R e v i e w C o p y R e v i e w C o p y - C a m b r i d g e U n i v e r s i t y P r e s s - R e v i e w C o p y R e v i e w C o p y - C a m b r i d g e U n i v e r s i t y P r e s s - R e v i e w C o p y R e v i e w C o p y - C a m b r i d g e U n i v e r s i t y Copyright Material - Review Only - Not for Redistribution
- 177. 167 Unit 2: Data handling 8 Introduction to probability 5 Two dice are thrown and the result is obtained by adding the two numbers shown. Two sets of dice are available. Set A: one dice has four faces numbered 1 to 4 and the other eight faces numbered 1 to 8. Set B: each dice has six faces numbered 1 to 6. a Copy and complete the possibility diagrams below for each set. 1 1 + Set A 2 2 3 3 4 4 5 6 7 8 1 1 + Set B 2 2 3 3 4 4 5 6 5 6 b In an experiment with one of the sets of dice, the following results were obtained Dice score Frequency 2 3 4 5 6 7 8 9 10 11 12 15 25 44 54 68 87 66 54 43 30 14 By comparing the probabilities and relative frequencies, decide which set of dice was used. 8.5 Combining independent and mutually exclusive events If you flip a coin once the probability of it showing a head is 0.5. If you flip the coin a second time the probability of it showing a head is still 0.5, regardless of what happened on the first flip. Events like this, where the first outcome has no influence on the next outcome, are called independent events. Sometimes there can be more than one stage in a problem and you may be interested in what combinations of outcomes there are. If A and B are independent events then: P(A happens and then B happens)=P(A)×P(B) or P(A and B)=P(A)×P(B) There are situations where it is impossible for events A and B to happen at the same time. For example, if you throw a normal die and let: A = the event that you get an even number and B = the event that you get an odd number then A and B cannot happen together because no number is both even and odd at the same time. Under these circumstances you say that A and B are mutually exclusive events and P(A or B)=P(A)+P(B). The following worked examples demonstrate how these simple formulae can be used. Note that this formula is only true if A and B are independent. Note, this formula only works if A and B are mutually exclusive. E Computer programming and software development uses probability to build applications (apps) such as voice activated dialing on a mobile phone. When you say a name to the phone, the app chooses the most likely contact from your contact list. LINK e s s - R e v i e w C o p y - C a m b r i d g e U n i v e r s i t y P r e s s - R e v i e w C o p y R e v i e w C o p y - C a m b r i d g e U n i v e r s i t y P r e s s - R e v i e w C o p y R e v i e w C o p y - C a m b r i d g e U n i v e r s i t y P r e s s - R e v i e w C o p y R e v i e w C o p y - C a m b r i d g e U n i v e r s i t y Copyright Material - Review Only - Not for Redistribution
- 178. Cambridge IGCSE Mathematics 168 Unit 2: Data handling The events, ‘James passes and Sarah fails’ and, ‘James fails and Sarah passes,’ are mutually exclusive because no-one can both pass and fail at the same time. This is why you can add the two probabilities here. Worked example 9 Simone and Jon are playing darts. The probability that Simone hits a bull’s-eye is 0.1. The probability that Jon throws a bull’s- eye is 0.2. Simone and Jon throw one dart each. Find the probability that: a both hit a bull’s-eye b Simone hits a bull’s-eye but Jon does not c exactly one bull’s-eye is hit. Simone’s success or failure at hitting the bull’s-eye is independent of Jon’s and vice versa. a P(both throw a bull’s-eye) = 0.1 × 0.2 = 0.02 b P(Simone throws a bull’s-eye but Jon does not) = 0.1 × (1 − 0.2) = 0.1 × 0.8 = 0.08 c P(exactly one bull’s-eye is thrown) P(Simone throws a bull = ’ ’s-eye and Jon does not or Simone does not throw a bull’s- -eye and Jon does) s- -eye and Jon does) s- = × + × = + = 0 1 0 8 × + × 0 8 × + × 0 9 × + × 0 9 × + × 0 2 0 0 = + 0 0 = + 8 0 = + 8 0 = + 8 0 18 0 26 . . × + × . . 0 1 . . 0 1 0 8 . . 0 8 × + × 0 8 × + × . . × + × 0 8 . . × + × . . 0 9 . . 0 9 × + × 0 9 × + × . . × + × 0 9 0 2 . . 0 2 . . = + . . 0 0 . . 0 0 = + 0 0 = + . . = + 0 08 0 . . = + 8 0 = + . . 8 0 0 2 0 2 Worked example 8 James and Sarah are both taking a music examination independently. The probability that James passes is 3 4 and the probability that Sarah passes is 5 6 . What is the probability that: a both pass b neither passes c at least one passes d either James or Sarah passes (not both)? Use the formula for combined events in each case. Sarah’s success or failure in the exam is independent of James’ outcome and vice versa. a P(both pass) P(James passes and Sarah passes) = = P(James passes and Sarah passes) = = × = × = = 3 4 5 6 15 24 5 8 8 b P(neither passes) P(James fails and Sarah fails) = = − × ( ) ( ) = − ( ) = − ( ( ) ( ) = − ( ) = − ( ) 3 ( ) ( ) 4 ( ) ( ) 1− − = × = × = 5 6 1 4 1 6 1 24 ) c P(at least one passes) P(neither passes) = − = − = 1 1 P(neither passes) 1 1 = − 1 1 = − = − 1 1 = − 1 24 23 24 d P(either Sarah or James passes) P(James passes and Sarah f = ails or James fails and Sarah passes) a ails or James fails and Sarah passes) a = × = × + × + × = + = + 3 4 1 6 1 4 5 6 3 24 5 24 = = = 8 24 1 3 e s s - R e v i e w C o p y - C a m b r i d g e U n i v e r s i t y P r e s s - R e v i e w C o p y R e v i e w C o p y - C a m b r i d g e U n i v e r s i t y P r e s s - R e v i e w C o p y R e v i e w C o p y - C a m b r i d g e U n i v e r s i t y P r e s s - R e v i e w C o p y R e v i e w C o p y - C a m b r i d g e U n i v e r s i t y Copyright Material - Review Only - Not for Redistribution
- 179. 169 Unit 2: Data handling 8 Introduction to probability Exercise 8.3 1 A standard cubical die is thrown twice. Calculate the probability that: a two sixes are thrown b two even numbers are thrown c the same number is thrown twice d the two numbers thrown are different. 2 A bag contains 12 coloured balls. Five of the balls are red and the rest are blue. A ball is drawn at random from the bag. It is then replaced and a second ball is drawn. The colour of each ball is recorded. a List the possible outcomes of the experiment. b Calculate the probability that: i the first ball is blue ii the second ball is red iii the first ball is blue and the second ball is red iv the two balls are the same colour v the two balls are a different colour vi neither ball is red vii at least one ball is red. 3 Devin and Tej are playing cards. Devin draws a card, replaces it and then shuffles the pack. Tej then draws a card. Find the probability that: a both draw an ace b both draw the king of Hearts c Devin draws a spade and Tej draws a queen d exactly one of the cards drawn is a heart e both cards are red or both cards are black f the cards are different colours. 4 Kirti and Justin are both preparing to take a driving test. They each learned to drive separately, so the results of the tests are independent. The probability that Kirti passes is 0.6 and the probability that Justin passes is 0.4. Calculate the probability that: a both pass the test b neither passes the test c Kirti passes the test, but Justin doesn’t pass d at least one of Kirti and Justin passes e exactly one of Kirti and Justin passes. Usually ‘AND’ in probability means you will need to multiply probabilities. ‘OR’ usually means you will need to add them. You will learn how to calculate probabilities for situations where objects are not replaced in chapter 24. FAST FORWARD Summary Do you know the following? • Probability measures how likely something is to happen. • An outcome is the single result of an experiment. • An event is a collection of favourable outcomes. • Experimental probability can be calculated by dividing the number of favourable outcomes by the number of trials. • Favourable outcomes are any outcomes that mean your event has happened. • If outcomes are equally likely then theoretical probability can be calculated by dividing the number of favourable outcomes by the number of possible outcomes. • The probability of an event happening and the probability of that event not happening will always sum up to one. If A is an event, then A is the event that A does not happen and P(A) = 1 − P(A) • Independent events do not affect one another. • Mutually exclusive events cannot happen together. Are you able to . . . ? • find an experimental probability given the results of several trials • find a theoretical probability • find the probability that an event will not happen if you know the probability that it will happen • draw a possibility diagram • recognise independent and mutually exclusive events • do calculations involving combined probabilities. e s s - R e v i e w C o p y - C a m b r i d g e U n i v e r s i t y P r e s s - R e v i e w C o p y R e v i e w C o p y - C a m b r i d g e U n i v e r s i t y P r e s s - R e v i e w C o p y R e v i e w C o p y - C a m b r i d g e U n i v e r s i t y P r e s s - R e v i e w C o p y R e v i e w C o p y - C a m b r i d g e U n i v e r s i t y Copyright Material - Review Only - Not for Redistribution
- 180. Unit 2: Data handling 170 Examination practice Exam-style questions 1 Rooms in a hotel are numbered from 1 to 19. Rooms are allocated at random as guests arrive. a What is the probability that the first guest to arrive is given a room which is a prime number? (Remember: 1 is not a prime number.) b The first guest to arrive is given a room which is a prime number. What is the probability that the second guest to arrive is given a room which is a prime number? 2 A bowl of fruit contains three apples, four bananas, two pears and one orange. Aminata chooses one piece of fruit at random. What is the probability that she chooses: a a banana? b a mango? 3 The probability that it will rain in Switzerland on 1 September is 5 12 . State the probability that it will not rain in Switzerland on 1 September. 4 Sian has three cards, two of them black and one red. She places them side by side, in random order, on a table. One possible arrangement is red, black, black. a Write down all the possible arrangements. b Find the probability that the two black cards are next to one another. Give your answer as a fraction. 5 A die has the shape of a tetrahedron. The four faces are numbered 1, 2, 3 and 4. The die is thrown on the table. The probabilities of each of the four faces finishing flat on the table are as shown. Face 1 2 3 4 Probability 2 9 1 3 5 18 1 6 a Copy the table and fill in the four empty boxes with the probabilities changed to fractions with a common denominator. b Which face is most likely to finish flat on the table? c Find the sum of the four probabilities. d What is the probability that face 3 does not finish flat on the table? 6 Josh and Soumik each take a coin at random out of their pockets and add the totals together to get an amount. Josh has two $1 coins, a 50c coin, a $5 coin and three 20c coins in his pocket. Soumik has three $5 coins, a $2 coin and three 50c pieces. a Draw up a possibility diagram to show all the possible outcomes for the sum of the two coins. b What is the probability that the coins will add up to $6? c What is the probability that the coins add up to less than $2? d What is the probability that the coins will add up to $5 or more? e s s - R e v i e w C o p y - C a m b r i d g e U n i v e r s i t y P r e s s - R e v i e w C o p y R e v i e w C o p y - C a m b r i d g e U n i v e r s i t y P r e s s - R e v i e w C o p y R e v i e w C o p y - C a m b r i d g e U n i v e r s i t y P r e s s - R e v i e w C o p y R e v i e w C o p y - C a m b r i d g e U n i v e r s i t y Copyright Material - Review Only - Not for Redistribution
- 181. 171 Unit 2: Data handling Past paper questions 1 A letter is chosen at random from the following word. S T A T I S T I C S Write down the probability that the letter is a Aor I, [1] b E. [1] [Cambridge IGCSE Mathematics 0580 Paper 12 Q3 May/June 2011] 2 Omar rolls two fair dice, each numbered from 1 to 6, and adds the numbers shown. He repeats the experiment 70 times and records the results in a frequency table. The first 60 results are shown in the tally column of the table. The last 10 results are 6, 8, 9, 2, 6, 4, 7, 9, 6, 10. Frequency Tally Total 2 3 4 5 6 7 8 9 10 11 12 a i Complete the frequency table to show all his results. [2] ii Write down the relative frequency of a total of 5. [3] [Cambridge IGCSE Mathematics 0580 Paper 33 Q6 a May/June 2013] 3 S P A C E S One of the 6 letters is taken at random. a Write down the probability that the letter is S. [1] b The letter is replaced and again a letter is taken at random. This is repeated 600 times. How many times would you expect the letter to be S? [1] [Cambridge IGCSE Mathematics 0580 Paper 11 Q14 October/November 2013] e s s - R e v i e w C o p y - C a m b r i d g e U n i v e r s i t y P r e s s - R e v i e w C o p y R e v i e w C o p y - C a m b r i d g e U n i v e r s i t y P r e s s - R e v i e w C o p y R e v i e w C o p y - C a m b r i d g e U n i v e r s i t y P r e s s - R e v i e w C o p y R e v i e w C o p y - C a m b r i d g e U n i v e r s i t y Copyright Material - Review Only - Not for Redistribution
- 182. Unit 2: Data handling 172 4 Kiah plays a game. The game involves throwing a coin onto a circular board. Points are scored for where the coin lands on the board. 20 10 5 If the coin lands on part of a line or misses the board then 0 points are scored. The table shows the probabilities of Kiah scoring points on the board with one throw. Points scored 20 10 5 0 Probability x 0.2 0.3 0.45 a Find the value of x. [2] b Kiah throws a coin fifty times. Work out the expected number of times she scores 5 points. [1] c Kiah throws a coin two times. Calculate the probability that i she scores either 5 or 0 with her first throw, [2] ii she scores 0 with her first throw and 5 with her scond throw, [2] iii she scores a total of 15 points with her two throws. [3] d Kiah throws a coin three times. Calculate the probability that she scores a total of 10 points with her three throws. [5] [Cambridge IGCSE Mathematics 0580 Paper 42 Q5 May/June 2016] 5 Dan either walks or cycles to school. The probability that he cycles to school is 1 3 . a Write down the probability that Dan walks to school. [1] b There are 198 days in a school year. Work out the expected number of days that Dan cycles to school in a school year. [1] [Cambridge IGCSE Mathematics 0580 Paper 12 Q9 February/March 2016] e s s - R e v i e w C o p y - C a m b r i d g e U n i v e r s i t y P r e s s - R e v i e w C o p y R e v i e w C o p y - C a m b r i d g e U n i v e r s i t y P r e s s - R e v i e w C o p y R e v i e w C o p y - C a m b r i d g e U n i v e r s i t y P r e s s - R e v i e w C o p y R e v i e w C o p y - C a m b r i d g e U n i v e r s i t y Copyright Material - Review Only - Not for Redistribution
- 183. Chapter 9: Sequences and sets 173 Unit 3: Number • Sequence • Term • Term-to-term rule • nth term • Rational number • Terminating decimals • Recurring decimals • Set • Element • Empty set • Universal set • Complement • Union • Intersection • Subset • Venn diagram • Set builder notation Key words How many students at your school study History and how many take French? If an event was organised that was of interest to those students who took either subject, how many would that be? If you chose a student at random, what is the probability that they would be studying both subjects? Being able to put people into appropriate sets can help to answer these types of questions! Collecting shapes with the same properties into groups can help to show links between groups. Here, three-sided and four-sided shapes are grouped as well as those shapes that have a right angle. In this chapter you will learn how to • describe the rule for continuing a sequence • find the nth term of some sequences • use the nth term to find terms from later in a sequence • generate and describe sequences from patterns of shapes • list the elements of a set that have been described by a rule • find unions and intersections of sets • find complements of sets • represent sets and solve problems using Venn diagrams • express recurring decimals as fractions EXTENDED EXTENDED e s s - R e v i e w C o p y - C a m b r i d g e U n i v e r s i t y P r e s s - R e v i e w C o p y R e v i e w C o p y - C a m b r i d g e U n i v e r s i t y P r e s s - R e v i e w C o p y R e v i e w C o p y - C a m b r i d g e U n i v e r s i t y P r e s s - R e v i e w C o p y R e v i e w C o p y - C a m b r i d g e U n i v e r s i t y Copyright Material - Review Only - Not for Redistribution
- 184. Cambridge IGCSE Mathematics 174 Unit 3: Number 9.1 Sequences A sequence can be thought of as a set whose elements (items in the list) have been listed in a particular order, with some connection between the elements. Sets are written using curly brackets { }, whereas sequences are generally written without the brackets and there is usually a rule that will tell you which number, letter, word or object comes next. Each number, letter or object in the sequence is called a term. Any two terms that are next to each other are called consecutive terms. The term-to-term rule Here are some sequences with the rule that tells you how to keep the sequence going: 2, 8, 14, 20, 26, 32, . . . (get the next term by adding six to the previous term). The pattern can be shown by drawing it in this way: 2 8 14 20 26 32 + 6 + 6 + 6 + 6 + 6 ... 1, 1 2 , 1 4 , 1 8 , 1 16 , . . . (divide each term by two to get the next term). Again, a diagram can be drawn to show how the sequence progresses: 1 2 1 4 1 8 1 16 1 ... ÷ 2 ÷ 2 ÷ 2 ÷ 2 1, 2, 4, 8, 16, 32, . . . (get the next term by multiplying the previous term by two). In diagram form: 1 2 4 8 16 32 ... × 2 × 2 × 2 × 2 × 2 In chapter 1 you learned that a set is a list of numbers or other items. REWIND When trying to spot the pattern followed by a sequence, keep things simple to start with. You will often find that the simplest answer is the correct one. RECAP You should already be familiar with the following number sequences and patterns work: Sequences (Year 9 Mathematics) A sequence is a list of numbers in a particular order. Each number is called a term. The position of a term in the sequence is written using a small number like this: T5 T1 means the first term and Tn means any term. Term to term rule (Year 9 Mathematics) The term to term rule describes how to move from one term to the next in words. For the sequence on the right the term to term rule is ‘subtract 4 from the previous term to find the next one’. Position to term rule (Year 9 Mathematics; Chapter 2) When there is a clear rule connecting the terms you can use algebra to write a function (equation) for finding any term. For example, the sequence above has the rule Tn = 27 − 4(n − 1) T1 = 27 − 4 × (1 − 1) = 27 T2 = 27 − 4 × (2 − 1) = 23 and so on. 27, 23, 19, 15 . . . –4 –4 –4 Chemists will often need to understand how quantities change over time. Sometimes an understanding of sequences can help chemists to understand how a reaction works and how results can be predicted. LINK e s s - R e v i e w C o p y - C a m b r i d g e U n i v e r s i t y P r e s s - R e v i e w C o p y R e v i e w C o p y - C a m b r i d g e U n i v e r s i t y P r e s s - R e v i e w C o p y R e v i e w C o p y - C a m b r i d g e U n i v e r s i t y P r e s s - R e v i e w C o p y R e v i e w C o p y - C a m b r i d g e U n i v e r s i t y Copyright Material - Review Only - Not for Redistribution
- 185. 175 Unit 3: Number 9 Sequences and sets The rule that tells you how to generate the next term in a sequence is called the term-to-term rule. Sequences can contain terms that are not numbers. For example, the following sequence is very well known: a, b, c, d, e, f, g, h, i, . . . In this last example, the sequence stops at the 26th element and is, therefore, a finite sequence. The previous three sequences do not necessarily stop, so they may be infinite sequences (unless you choose to stop them at a certain point). Exercise 9.1 1 Draw a diagram to show how each of the following sequences continues and find the next three terms in each case. a 5, 7, 9, 11, 13, . . . b 3, 8, 13, 18, 23, . . . c 3, 9, 27, 81, 243, . . . d 0.5, 2, 3.5, 5, 6.5, . . . e 8, 5, 2, −1, −4, . . . f 13, 11, 9, 7, 5, . . . g 6, 4.8, 3.6, 2.4, 1.2, . . . h 2.3, 1.1, −0.1, −1.3, . . . 2 Find the next three terms in each of the following sequences and explain the rule that you have used in each case. a 1, −3, 9, −27, . . . b Mo, Tu, We, Th, . . . c a, c, f, j, o, . . . d 1, 2, 2, 4, 3, 6, 4, 8, . . . Relating a term to its position in the sequence Think about the following sequence: 1, 4, 9, 16, 25, . . . You should have recognised these as the first five square numbers, so: first term = 1 × 1 = 12 = 1 second term = 2 × 2 = 22 = 4 third term = 3 × 3 = 33 = 9 and so on. You could write the sequence in a table that also shows the position number of each term: Term number (n) 1 2 3 4 5 6 7 8 9 Term value (n2 ) 1 4 9 16 25 36 49 64 81 Notice that the term number has been given the name ‘n’. This means, for example, that n = 3 for the third term and n = 100 for the hundredth term. The rule that gives each term from its position is: term in position n = n2 An expression for the term in position n is called the nth term. So for this sequence: nth term = n2 Now think about a sequence with nth term = 3n + 2 For term 1, n = 1 so the first term is 3 × 1 + 2 = 5 For term 2, n = 2 so the second term is 3 × 2 + 2 = 8 For term 3, n = 3 so the third term is 3 × 3 + 2 = 11 You will carry out similar calculations when you study equations of straight lines in chapter 10. FAST FORWARD e s s - R e v i e w C o p y - C a m b r i d g e U n i v e r s i t y P r e s s - R e v i e w C o p y R e v i e w C o p y - C a m b r i d g e U n i v e r s i t y P r e s s - R e v i e w C o p y R e v i e w C o p y - C a m b r i d g e U n i v e r s i t y P r e s s - R e v i e w C o p y R e v i e w C o p y - C a m b r i d g e U n i v e r s i t y Copyright Material - Review Only - Not for Redistribution
- 186. Cambridge IGCSE Mathematics 176 Unit 3: Number Continuing this sequence in a table you will get: n 1 2 3 4 5 6 7 8 9 Term 5 8 11 14 17 20 23 26 29 If you draw a diagram to show the sequence’s progression, you get: 5 8 11 14 17 20 ... + 3 + 3 + 3 + 3 + 3 Notice that the number added to each term in the diagram appears in the nth term formula (it is the value that is multiplying n, or the coefficient of n). This happens with any sequence for which you move from one term to the next by adding (or subtracting) a fixed number. This fixed number is known as the common difference. For example, if you draw a sequence table for the sequence with nth term = 4n − 1, you get: n 1 2 3 4 5 6 7 8 9 Term 3 7 11 15 19 23 27 31 35 Here you can see that 4 is added to get from one term to the next and this is the coefficient of n that appears in the nth term formula. The following worked example shows you how you can find the nth term for a sequence in which a common difference is added to one term to get the next. You should always try to include a diagram like this. It will remind you what to do and will help anyone reading your work to understand your method. Worked example 1 Worked example 1 a Draw a diagram to show the rule that tells you how the following sequence progresses and find the nth term. 2, 6, 10, 14, 18, 22, 26, . . . b Find the 40th term of the sequence. c Explain how you know that the number 50 is in the sequence and work out which position it is in. d Explain how you know that the number 125 is not in the sequence. a Notice that 4 is added on each time, this is the common difference. This means that the coefficient of n in the nth term will be 4. This means that ‘4n’ will form part of your nth term rule. If n = 3 Then 4n = 4 × 3 = 12 Now think about any term in the sequence, for example the third (remember that the value of n gives the position in the sequence). Try 4n to see what you get when n = 3. You get an answer of 12 but you need the third term to be 10, so you must subtract 2. It appears that the nth term rule should be 4n − 2. Try for n = 5 4n − 2 = 4 × 5 − 2 = 18 So the nth term = 4n − 2 You should check this. Test it using any term, say the 5th term. Substitute n = 5 into the rule. Notice that the 5th term is indeed 18. 2 6 10 14 18 22 ... + 4 + 4 + 4 + 4 + 4 e s s - R e v i e w C o p y - C a m b r i d g e U n i v e r s i t y P r e s s - R e v i e w C o p y R e v i e w C o p y - C a m b r i d g e U n i v e r s i t y P r e s s - R e v i e w C o p y R e v i e w C o p y - C a m b r i d g e U n i v e r s i t y P r e s s - R e v i e w C o p y R e v i e w C o p y - C a m b r i d g e U n i v e r s i t y Copyright Material - Review Only - Not for Redistribution
- 187. 177 Unit 3: Number 9 Sequences and sets Exercise 9.2 1 Find the (i) 15th and (ii) nth term for each of the following sequences. a 5, 7, 9, 11, 13, . . . b 3, 8, 13, 18, 23, . . . c 3, 9, 27, 81, 243, . . . d 0.5, 2, 3.5, 5, 6.5, . . . e 8, 5, 2, −1, −4, . . . f 13, 11, 9, 7, 5, . . . g 6, 4.8, 3.6, 2.4, 1.2, . . . h 2, 8, 18, 32, 50, … 2 Consider the sequence: 4, 12, 20, 28, 36, 44, 52, . . . a Find the nth term of the sequence. b Find the 500th term. c Which term of this sequence has the value 236? Show full working. d Show that 154 is not a term in the sequence. Not all sequences progress in the same way. You will need to use your imagination to find the nth terms for each of these. 3 a 1 2 , 1 4 , 1 8 , 1 16 , 1 32 , . . . b 3 8 , 7 11 , 11 14 , 15 17 , . . . c 9 64 , 49 121 , 121 196 , 225 289 , . . . d − − − − 2 3 1 6 1 3 5 6 4 3 , , , , , . . . 4 List the first three terms and find the 20th term of the number patterns given by the following rules, where T = term and n = the position of the term. a Tn = 4 − 3n b Tn = 2 − n c Tn = 1 2 n2 d Tn = n(n + 1)(n − 1) e Tn = 3 1+n f Tn = 2n3 5 If x + 1 and −x + 17 are the second and sixthterms of a sequence with a common difference of 5, find the value of x. Remember that ‘n’ is always going to be a positive integer in nth term questions. Questions 3 to 6 involve much more difficult nth terms. b 40th term ∴ n = 40 4 × 40 − 2 = 158 To find the 40th term in the sequence you simply need to let n = 40 and substitute this into the nth term formula. c 4n − 2 = 50 4n − 2 = 50 If the number 50 is in the sequence there must be a value of n for which 4n − 2 = 50. Rearrange the rule to make n the subject: 4n = 52 Add 2 to both sides n = = = = 52 4 13 Divide both sides by 4 Since this has given a whole number, 50 must be the 13th term in the sequence. d 4n − 2 = 125 If the number 125 is in the sequence then there must be a value of n for which 4n − 2 = 125. Rearrange to make n the subject. 4n = 127 Add 2 to both sides n = = = = 127 4 31 75 . Divide both sides by 4 Since n is the position in the sequence it must be a whole number and it is not in this case. This means that 125 cannot be a number in the sequence. e s s - R e v i e w C o p y - C a m b r i d g e U n i v e r s i t y P r e s s - R e v i e w C o p y R e v i e w C o p y - C a m b r i d g e U n i v e r s i t y P r e s s - R e v i e w C o p y R e v i e w C o p y - C a m b r i d g e U n i v e r s i t y P r e s s - R e v i e w C o p y R e v i e w C o p y - C a m b r i d g e U n i v e r s i t y Copyright Material - Review Only - Not for Redistribution
- 188. Cambridge IGCSE Mathematics 178 Unit 3: Number 6 If x + 4 and x − 4 are the third and seventh terms of a sequence with a common difference of −2, find the value of x. 7 Write down the next three terms in each of the following sequences. a 3 7 11 15 19 … b 4 9 16 25 36 … c 23 19 13 5 −5 … Some special sequences You should be able to recognise the following patterns and sequences. Sequence Description Square numbers Tn = n2 A square number is the product of multiplying a whole number by itself. Square numbers can be represented using dots arranged to make squares. 1 4 9 16 25 Square numbers form the (infinite) sequence: 1, 4, 9, 16, 25, 36, … Square numbers may be used in other sequences: 1 4 , 1 9 , 1 16 , 1 25 , … 2, 8, 18, 32, 50, … (each term is double a square number) Cube numbers Tn = n3 A cube number is the product of multiplying a whole number by itself and then by itself again. 1 2 3 3 2 2 1 1 13 23 33 Cube numbers form the (infinite) sequence: 1, 8, 27, 64, 125, … Triangular numbers Tn = 1 2 n(n + 1) Triangular numbers are made by arranging dots to form either equilateral or right-angled isosceles triangles. Both arrangements give the same number sequence. 1 3 6 10 15 T1 T2 T3 T4 T5 Triangular numbers form the (infinite) sequence: 1, 3, 6, 10, 15, … e s s - R e v i e w C o p y - C a m b r i d g e U n i v e r s i t y P r e s s - R e v i e w C o p y R e v i e w C o p y - C a m b r i d g e U n i v e r s i t y P r e s s - R e v i e w C o p y R e v i e w C o p y - C a m b r i d g e U n i v e r s i t y P r e s s - R e v i e w C o p y R e v i e w C o p y - C a m b r i d g e U n i v e r s i t y Copyright Material - Review Only - Not for Redistribution
- 189. 179 Unit 3: Number 9 Sequences and sets Sequence Description Fibonacci numbers Leonardo Fibonacci was an Italian mathematician who noticed that many natural patterns produced the sequence: 1, 1, 2, 3, 5, 8, 13, 21, … These numbers are now called Fibonacci numbers. They have the term-to-term rule ‘add the two previous numbers to get the next term’. Generating sequences from patterns The diagram shows a pattern using matchsticks. Pattern 1 Pattern 2 Pattern 3 The table shows the number of matchsticks for the first five patterns. Pattern number (n) 1 2 3 4 5 Number of matches 3 5 7 9 11 Notice that the pattern number can be used as the position number, n, and that the numbers of matches form a sequence, just like those considered in the previous section. The number added on each time is two but you could also see that this was true from the original diagrams. This means that the number of matches for pattern n is the same as the value of the nth term of the sequence. The nth term will therefore be: 2n ± something. Use the ideas from the previous section to find the value of the ‘something’. Taking any term in the sequence from the table, for example the first: n = 1, so 2n = 2 × 1 = 2. But the first term is 3, so you need to add 1. So, nth term = 2n + 1 Which means that, if you let ‘p’ be the number of matches in pattern n then, p = 2n + 1. Worked example 2 The diagram shows a pattern made with squares. p = 1 p = 2 p = 3 a Construct a sequence table showing the first six patterns and the number of squares used. b Find a formula for the number of squares, s, in terms of the pattern number ‘p’. c How many squares will there be in pattern 100? e s s - R e v i e w C o p y - C a m b r i d g e U n i v e r s i t y P r e s s - R e v i e w C o p y R e v i e w C o p y - C a m b r i d g e U n i v e r s i t y P r e s s - R e v i e w C o p y R e v i e w C o p y - C a m b r i d g e U n i v e r s i t y P r e s s - R e v i e w C o p y R e v i e w C o p y - C a m b r i d g e U n i v e r s i t y Copyright Material - Review Only - Not for Redistribution
- 190. Cambridge IGCSE Mathematics 180 Unit 3: Number Exercise 9.3 For each of the following shape sequences: i draw a sequence table for the first six patterns, taking care to use the correct letter for the pattern number and the correct letter for the number of shapes ii find a formula for the number of shapes used in terms of the pattern number iii use your formula to find the number of shapes used in the 300th pattern. Notice that ‘p’ has been used for the pattern number rather than ‘n’ here. You can use any letters that you like – it doesn’t have to be n every time. a Pattern number (p) 1 2 3 4 5 6 Number of squares (s) 7 11 15 19 23 27 b 4p is in the formula Notice that the number of squares increases by 4 from shape to shape. This means that there will be a term ‘4p’ in the formula. If p = 1 then 4p = 4 4 + 3 = 7 Now, if p = 1 then 4p = 4. The first term is seven, so you need to add three. so, s = 4p + 3 This means that s = 4p + 3. If p = 5 then 4p + 3 = 20 + 3 = 23, the rule is correct. Check: if p = 5 then there should be 23 squares, which is correct. c For pattern 100, p = 100 and s = 4 × 100 + 3 = 403. a n = 1 n = 3 n = 2 m = 4 m = 10 m = 7 Number of matches ... b p = 3 c = 3 p = 2 c = 5 Number of circles p = 1 c = 1 ... c Number of triangles p = 1 t = 5 p = 2 t = 8 p = 3 t = 11 ... d Number of squares n = 1 s = 5 n = 2 s = 10 n = 3 s = 15 ... e s s - R e v i e w C o p y - C a m b r i d g e U n i v e r s i t y P r e s s - R e v i e w C o p y R e v i e w C o p y - C a m b r i d g e U n i v e r s i t y P r e s s - R e v i e w C o p y R e v i e w C o p y - C a m b r i d g e U n i v e r s i t y P r e s s - R e v i e w C o p y R e v i e w C o p y - C a m b r i d g e U n i v e r s i t y Copyright Material - Review Only - Not for Redistribution
- 191. 181 Unit 3: Number 9 Sequences and sets Subscript notation The nth term of a sequence can be written as un . This is called subscript notation and u represents a sequence. You read this as ‘u sub n’. Terms in a specific position (for example, the first, second and hundredth term) are written as u1 , u2 , u100 and so on. Term-to-term rules and position-to-term rules may be given using subscript notation. You can work out the value of any term or the position of a term by substituting known values into the rules. In any sequence n must be a positive integer. There are no negative ‘positions’ for terms. For example, n can be 7 because it is possible to have a 7th term, but n cannot be −7 as it is not possible to have a −7th term. Worked example 3 The position to term rule for a sequence is given as un = 3n − 1. What are the first three terms of the sequence? Substitute n = 1, n = 2 and n = 3 into the rule. u1 = 3(1) − 1 = 2 u2 = 3(2) − 1 = 5 u3 = 3(3) − 1 = 8 For the first term, n = 1 The first three terms are 2, 5 and 8. Worked example 4 The number 149 is a term in the sequence defined as un = n2 + 5. Which term in the sequence is 149? 149 = n2 + 5 149 − 5 = n2 144 = n2 12 = n Find the value of n, when un = 149 144 = 12 and −12, but n must be positive as there is no −12th term. 149 is the 12th term in the sequence. Exercise 9.4 1 Find the first three terms and the 25th term of each sequence. a un = 4n + 1 b un = 3n − 5 c un = 5n − 1 2 d un = −2n + 1 e un = n 2 + 1 f un = 2n2 − 1 g un = n2 h un = 2n 2 The numbers 30 and 110 are found in the sequence un = n(n − 1). In which position is each number found? 3 Which term in the sequence un = 2n2 + 5 has a value of 167? 4 For the sequence un = 2n2 − 5n + 3, determine: a the value of the tenth term. b the value of n for which un = 45 5 The term-to-term rule for a sequence is given as un + 1 = un + 2. a Explain in words what this means. b Given that u3 = −4, list the first five terms of the sequence. E e s s - R e v i e w C o p y - C a m b r i d g e U n i v e r s i t y P r e s s - R e v i e w C o p y R e v i e w C o p y - C a m b r i d g e U n i v e r s i t y P r e s s - R e v i e w C o p y R e v i e w C o p y - C a m b r i d g e U n i v e r s i t y P r e s s - R e v i e w C o p y R e v i e w C o p y - C a m b r i d g e U n i v e r s i t y Copyright Material - Review Only - Not for Redistribution
- 192. Cambridge IGCSE Mathematics 182 Unit 3: Number 9.2 Rational and irrational numbers Rational numbers You already know about decimals and how they are used to write down numbers that are not whole. Some of these numbers can be expressed as fractions, for example: 0.5 = 1 2 2.5 = 5 2 0.125 = 1 8 0.33333333 . . . = 1 3 . . . and so on. Any number that can be expressed as a fraction in its lowest terms is known as a rational number. Notice that there are two types of rational number: terminating decimals (i.e. those with a decimal part that doesn’t continue forever) and recurring decimals (the decimal part continues forever but repeats itself at regular intervals). Recurring decimals can be expressed by using a dot above the repeating digit(s): 0.333333333 . . . = 0 3 0 3 0 3 ɺ 0.302302302302 . . . = 0 302 .ɺ ɺ 0.454545454 . . . = 0 45 0 4 0 4 ɺ ɺ Converting recurring decimals to fractions What can we do with a decimal that continues forever but does repeat? Is this kind of number rational or irrational? As an example we will look at the number 0 4 .ɺ. We can use algebra to find another way of writing this recurring decimal: Let x = = 0 4 = = 0 4 = = 0 444444 . . 0 4 . . 0 4 0 . . ... ɺ Then 10 4 444444 0 4 0 4 0 4 0 4. ... We can then subtract x from 10x like this: 10 4 444444 0 444444 9 4 x x 9 4 9 4 = = 9 4 9 4 . ... . ... _______________ 4 9 ⇒ = x ⇒ = Notice that this shows how it is possible to write the recurring decimal 0 4 .ɺ as a fraction. This means that 0 4 .ɺ is a rational number. Indeed all recurring decimals can be written as fractions, and so are rational. Remember that the dot above one digit means that you have a recurring decimal. If more than one digit repeats we place a dot above the first and last repeating digit. For example 0.418 ɺ ɺ is the same as 0.418418418418418… and 0.342 ɺ = 0.3422222222… . Every recurring decimal is a rational number. It is always possible to write a recurring decimal as a fraction. E e s s - R e v i e w C o p y - C a m b r i d g e U n i v e r s i t y P r e s s - R e v i e w C o p y R e v i e w C o p y - C a m b r i d g e U n i v e r s i t y P r e s s - R e v i e w C o p y R e v i e w C o p y - C a m b r i d g e U n i v e r s i t y P r e s s - R e v i e w C o p y R e v i e w C o p y - C a m b r i d g e U n i v e r s i t y Copyright Material - Review Only - Not for Redistribution
- 193. 183 Unit 3: Number 9 Sequences and sets Worked example 5 Use algebra to write each of the following as fractions. Simplify your fractions as far as possible. a 0.3 ɺ b 0.24 ɺ ɺ c 0.934 ɺ ɺ d 0.524 ɺ a x x Subtract x x = = = = 0.33333... 10 3.33333... 3.33333... 0.33333. 10 . .. 3 ________ 9 3 9 1 3 x x = ⇒ = x ⇒ = = Write your recurring decimal in algebra. It is easier to see how the algebra works if you write the number out to a handful of decimal places. Multiply by 10, so that the recurring digits still line up Subtract Divide by 9 b Let x = 0.242424... (1) then, 100x = 24.242424.... (2) Multiply by 100 99x = 24.24 − 0.24 Subtract (2) − (1) 99x = 24 so, x = = = = 24 99 8 33 Divide both sides by 99 Notice that you start by multiplying by 100 to make sure that the ‘2’s and ‘4’s started in the correct place after the decimal point. c x x x x = = = = 0.934934... 934.934934... 1000 1000 934 934934 . ... 0 934934 999 934 934 999 . ... _____________________ x x = ⇒ = x ⇒ = x This time we have three recurring digits. To make sure that these line up we multiply by 1000, so that all digits move three places. Notice that the digits immediately after the decimal point for both x and 1000x are 9, 3 and 4 in the same order. d x x x = = = 0.52444444... 100 52 4444444 1000 524 444444 10 . ... . ... 00 0 00 0 524 444444 100 52 4444444 x x = = . ... . ... ______________________ _ _ ____________________ ____________________ ____________________ ____________________ 900 472 472 900 118 225 x x = ⇒ = x ⇒ = x = Multiply by 100 so that the recurring digits begin immediately after the decimal point. Then proceed as in the first example, multiplying by a further 10 to move the digits one place. Subtract and simplify. Once you have managed to get the recurring decimals to start immediately after the decimal point you will need to multiply again, by another power of 10. The power that you choose should be the same as the number of digits that recur. In the second example the digits 9, 3 and 4 recur, so we multiply by 103 = 1000. Tip The key point is that you need to subtract two different numbers, but in such a way that the recurring part disappears. This means that sometimes you have to multiply by 10, sometimes by 100, sometimes by 1000, depending on how many digits repeat. E e s s - R e v i e w C o p y - C a m b r i d g e U n i v e r s i t y P r e s s - R e v i e w C o p y R e v i e w C o p y - C a m b r i d g e U n i v e r s i t y P r e s s - R e v i e w C o p y R e v i e w C o p y - C a m b r i d g e U n i v e r s i t y P r e s s - R e v i e w C o p y R e v i e w C o p y - C a m b r i d g e U n i v e r s i t y Copyright Material - Review Only - Not for Redistribution
- 194. Cambridge IGCSE Mathematics 184 Unit 3: Number Exercise 9.5 1 Copy and complete each of the following by filling in the boxes with the correct number or symbol. a Let x = 0 6 .ɺ Then 10x = Subtracting: 10x = − x = 0 6 .ɺ x = So x = Simplify: x = b Let x = 0 17 .ɺ ɺ Then 100x = Subtracting: 100x = − x = 0 17 .ɺ ɺ x = So x = Simplify: x = 2 Write each of the following recurring decimals as a fraction in its lowest terms. a 0.5 ɺ b 0 1 0 1 0 1 ɺ c 0 8 0 8 0 8 ɺ d 0 24 0 2 0 2 ɺɺ e 0 61 0 6 0 6 ɺ ɺ f 0 32 0 3 0 3 ɺ ɺ g 0 618 .ɺ ɺ h 0 233 .ɺ ɺ i 0 208 .ɺ ɺ j 0 02 0 0 0 0ɺ k 0 18 0 1 0 1ɺ l 0 031 . ɺ ɺ m 2 45 . 2 4 2 4 ɺ ɺ n 3 105 .ɺ ɺ o 2 50 2 5 2 5 ɺ ɺ p 5 4 4 5 . . 5 4 . . 5 4 4 5 . . 4 5 ɺ ɺ + . . . . q 2 36 3 63 . . 36 . . 3 6 . . 3 6 ɺ ɺ ɺɺ + . . . . r 0 17 0 71 . . 17 . . 0 7 . . 0 7 ɺ ɺ ɺɺ + . . . . s 0 9 0 9 0 9 ɺ 3 a Write down the numerical value of each of the following i 1 − 0.9 ii 1 − 0.99 iii 1 − 0.999 iv 1 − 0.999999999 b Comment on your answers to (a). What is happening to the answer as the number of digits in the subtracted number increases? What is the answer getting closer to? Will it ever get there? c Use algebra to express 0 6 0 6 0 6 ɺ and 0 2 0 2 0 2 ɺ as fractions in their simplest form. d Express 0 6 0 6 0 6 ɺ + 0 2 0 2 0 2 ɺ as a recurring decimal. E e s s - R e v i e w C o p y - C a m b r i d g e U n i v e r s i t y P r e s s - R e v i e w C o p y R e v i e w C o p y - C a m b r i d g e U n i v e r s i t y P r e s s - R e v i e w C o p y R e v i e w C o p y - C a m b r i d g e U n i v e r s i t y P r e s s - R e v i e w C o p y R e v i e w C o p y - C a m b r i d g e U n i v e r s i t y Copyright Material - Review Only - Not for Redistribution
- 195. 185 Unit 3: Number 9 Sequences and sets e Use your answer to (c) to express 0 6 0 6 0 6 ɺ + 0 2 0 2 0 2 ɺ as a fraction in its lowest terms. f Now repeat parts c, d and e using the recurring decimals 0 4 0 4 0 4 ɺ and 0 5 0 5 0 5 ɺ . g Explain how your findings for part f relate to your answers in parts a and b. 4 Jessica’s teacher asks a class to find the largest number that is smaller than 4.5. Jessica’s friend Jeevan gives the answer 4.4. a Why is Jeevan not correct? Jessica’s friend Ryan now suggests that the answer is 4.49999. b Why is Ryan not correct? Jessica now suggests the answer 4 49 . 4 4 4 4ɺ c Is Jessica correct? Give full reasons for your answer, including any algebra that helps you to explain. Do you think that there is a better answer than Jessica’s? Exercise 9.6 1 Say whether each number is rational or irrational. a 1 4 b 4 c −7 d 3.147 e π f 3 g 25 h 0 i 0.45 j −0.67 k −232 l 3 8 m 9.45 n 123 o 2π p 3 2 3 2 2 Show that the following numbers are rational. a 6 b 2 3 8 c 1.12 d 0.8 e 0.427 f 3.14 3 Find a number in the interval −1 x 3 so that: a x is rational b x is a real number but not rational c x is an integer d x is a natural number 4 Which set do you think has more members: rational numbers or irrational numbers? Why? 5 Mathematicians also talk about imaginary numbers. Find out what these are and give one example. 9.3 Sets A set is a list or collection of objects that share a characteristic. The objects in a set can be anything from numbers, letters and shapes to names, places or paintings, but there is usually something that they have in common. The list of members or elements of a set is placed inside a pair of curly brackets { }. Some examples of sets are: {2, 4, 6, 8, 10} – the set of all even integers greater than zero but less than 11 {a, e, i, o, u} – the set of vowels {Red, Green, Blue} – the set containing the colours red, green and blue. Capital letters are usually used as names for sets: If A is the set of prime numbers less than 10, then: A = {2, 3, 5, 7} If B is the set of letters in the word ‘HAPPY’, then: B = {H, A, P, Y}. When writing sets, never forget to use the curly brackets on either side. Notice, for set B, that elements of a set are not repeated. E e s s - R e v i e w C o p y - C a m b r i d g e U n i v e r s i t y P r e s s - R e v i e w C o p y R e v i e w C o p y - C a m b r i d g e U n i v e r s i t y P r e s s - R e v i e w C o p y R e v i e w C o p y - C a m b r i d g e U n i v e r s i t y P r e s s - R e v i e w C o p y R e v i e w C o p y - C a m b r i d g e U n i v e r s i t y Copyright Material - Review Only - Not for Redistribution
- 196. Cambridge IGCSE Mathematics 186 Unit 3: Number Two sets are equal if they contain exactly the same elements, even if the order is different, so: {1, 2, 3, 4} = {4, 3, 2, 1} = {2, 4, 1, 3} and so on. The number of elements in a set is written as n(A), where A is the name of the set. For example in the set A = {1, 3, 5, 7, 9} there are five elements so n(A) = 5. A set that contains no elements is known as the empty set. The symbol ∅ is used to represent the empty set. For example: {odd numbers that are multiples of two} = ∅ because no odd number is a multiple of two. Now, if x is a member (an element) of the set A then it is written: x ∈ A. If x is not a member of the set A, then it is written: x ∉ A. For example, if H = {Spades, Clubs, Diamonds, Hearts}, then: Spades ∈ H but Turtles ∉ H. Some sets have a number of elements that can be counted. These are known as finite sets. If there is no limit to the number of members of a set then the set is infinite. If A = {letters of the alphabet}, then A has 26 members and is finite. If B = {positive integers}, then B = {1, 2, 3, 4, 5, 6, . . .} and is infinite. So, to summarise: • sets are listed inside curly brackets { } • ∅ means it is an empty set • a ∈ B means a is an element of the set B • a ∉ B means a is not an element of the set B • n(A) is the number of elements in set A The following exercise requires you to think about things that are outside of mathematics. In each case you might like to see if you can find out ALL possible members of each set. Exercise 9.7 Applying your skills 1 List all of the elements of each set. a {days of the week} b {months of the year} c {factors of 36} d {colours of the rainbow} e {multiples of seven less than 50} f {primes less than 30} g {ways of arranging the letters in the word ‘TOY’} 2 Find two more members of each set. a {rabbit, cat, dog, . . .} b {carrot, potato, cabbage, . . .} c {London, Paris, Stockholm, . . .} d {Nile, Amazon, Loire, . . .} e {elm, pine, oak, . . .} f {tennis, cricket, football, . . .} g {France, Germany, Belgium, . . .} h {Bush, Obama, Truman, . . .} i {Beethoven, Mozart, Sibelius, . . .} j {rose, hyacinth, poppy, . . .} k {3, 6, 9, . . .} l {Husky, Great Dane, Boxer, . . .} m {Mercury, Venus, Saturn, . . .} n {happy, sad, angry, . . .} o {German, Czech, Australian, . . .} p {hexagon, heptagon, triangle, . . .} 3 Describe each set fully in words. a {1, 4, 9, 16, 25, . . .} b {Asia, Europe, Africa, . . .} c {2, 4, 6, 8} d {2, 4, 6, 8, . . .} e {1, 2, 3, 4, 6, 12} E e s s - R e v i e w C o p y - C a m b r i d g e U n i v e r s i t y P r e s s - R e v i e w C o p y R e v i e w C o p y - C a m b r i d g e U n i v e r s i t y P r e s s - R e v i e w C o p y R e v i e w C o p y - C a m b r i d g e U n i v e r s i t y P r e s s - R e v i e w C o p y R e v i e w C o p y - C a m b r i d g e U n i v e r s i t y Copyright Material - Review Only - Not for Redistribution
- 197. 187 Unit 3: Number 9 Sequences and sets E 4 True or false? a If A = {1, 2, 3, 4, 5} then 3 ∉ A b If B = {primes less than 10}, then n(B) = 4 c If C = {regular quadrilaterals}, then square ∈ C d If D = {paint primary colours}, then yellow ∉ D e If E = {square numbers less than 100}, then 64 ∈ E 5 Make 7 copies of this Venn diagram and shade the following sets: a A∪B b A∪B∪C c A∪B′ d A∩(B∪C) e (A∪B)∩C f A∪(B∪C)′ g (A∩C)∪(A∩B) 6 In a class of 30 students, 22 like classical music and 12 like Jazz. 5 like neither. Using a Venn diagram find out how many students like both classical and jazz music. 7 Students in their last year at a school must study at least one of the three main sciences: Biology, Chemistry and Physics. There are 180 students in the last year, of whom 84 study Biology and Chemistry only, 72 study Chemistry and Physics only and 81 study Biology and Physics only. 22 pupils study only Biology, 21 study only Chemistry and 20 study only Physics. Use a Venn diagram to work out how many students study all three sciences. Universal sets The following sets all have a number of things in common: M = {1, 2, 3, 4, 5, 6, 7, 8} N = {1, 5, 9} O = {4, 8, 21} All three are contained within the set of whole numbers. They are also all contained in the set of integers less than 22. When dealing with sets there is usually a ‘largest’ set which contains all of the sets that you are studying. This set can change according to the nature of the problem you are trying to solve. Here, the set of integers contains all elements from M, N or O. But then so does the set of all positive integers less than 22. Both these sets (and many more) can be used as a universal set. A universal set contains all possible elements that you would consider for a set in a particular problem. The symbol ℰ is used to mean the universal set. Complements The complement of the set A is the set of all things that are in ℰ but NOT in the set A. The symbol A′ is used to denote the complement of set A. For example, if: ℰ = {1, 2, 3, 4, 5, 6, 7, 8, 9, 10} and F = {2, 4, 6} then the complement of F would be F′ = {1, 3, 5, 7, 8, 9, 10}. So, in summary: • ℰ represents a universal set • A′ represents the complement of set A. A B C E e s s - R e v i e w C o p y - C a m b r i d g e U n i v e r s i t y P r e s s - R e v i e w C o p y R e v i e w C o p y - C a m b r i d g e U n i v e r s i t y P r e s s - R e v i e w C o p y R e v i e w C o p y - C a m b r i d g e U n i v e r s i t y P r e s s - R e v i e w C o p y R e v i e w C o p y - C a m b r i d g e U n i v e r s i t y Copyright Material - Review Only - Not for Redistribution
- 198. Cambridge IGCSE Mathematics 188 Unit 3: Number Worked example 6 If W = {4, 8, 12, 16, 20, 24} and T = {5, 8, 20, 24, 28}. i List the sets: a W∪T b W∩T ii Is it true that T ⊂ W? i a W∪T = set of all members of W or of T or of both = {4, 5, 8, 12, 16, 20, 24, 28}. b W∩T = set of all elements that appear in both W and T = {8, 20, 24}. ii Notice that 5 ∈ T but 5 ∉ W. So it is not true that every member of T is also a member of W. So T is not a subset of W. So in summary: • ∪ is the symbol for union • ∩ is the symbol for intersection • B ⊂ A indicates that B is a proper subset of A • B ⊆ A indicates that B is a subset of A but also equal to A i.e. it is not a proper subset of A. • B ⊄ A indicates that B is not a proper subset of A. • B ⊆ A indicates that B is not a subset of A. Unions and intersections The union of two sets, A and B, is the set of all elements that are members of A or members of B or members of both. The symbol ∪ is used to indicate union so, the union of sets A and B is written: A∪B The intersection of two sets, A and B, is the set of all elements that are members of both A and B. The symbol ∩ is used to indicate intersection so, the intersection of sets A and B is written: A∩B. For example, if C = {4, 6, 8, 10} and D = {6, 10, 12, 14}, then: C∩D = the set of all elements common to both = {6, 10} C∪D = the set of all elements that are in C or D or both = {4, 6, 8, 10, 12, 14}. Subsets Let the set A be the set of all quadrilaterals and let the set B be the set of all rectangles. A rectangle is a type of quadrilateral. This means that every element of B is also a member of A and, therefore, B is completely contained within A. When this happens B is called a subset of A, and is written: B ⊆ A. The ⊆ symbol can be reversed but this does not change its meaning. B ⊆ A means B is a subset of A, but so does A ⊇ B. If B is not a subset of A, we write B ⊆ A. If B is not equal to A, then B is known as a proper subset. If it is possible for B to be equal to A, then B is not a proper subset and you write: B ⊂ A. If A is not a proper subset of B, we write A ⊄ B. Tip Note that taking the union of two sets is rather like adding the sets together. You must remember, however, that you do not repeat elements within the set. Note that the symbol, ⊂, has a open end and a closed end. The subset goes at the closed end. E e s s - R e v i e w C o p y - C a m b r i d g e U n i v e r s i t y P r e s s - R e v i e w C o p y R e v i e w C o p y - C a m b r i d g e U n i v e r s i t y P r e s s - R e v i e w C o p y R e v i e w C o p y - C a m b r i d g e U n i v e r s i t y P r e s s - R e v i e w C o p y R e v i e w C o p y - C a m b r i d g e U n i v e r s i t y Copyright Material - Review Only - Not for Redistribution
- 199. 189 Unit 3: Number 9 Sequences and sets Exercise 9.8 1 A = {2, 4, 6, 8, 10} and B = {1, 3, 5, 6, 8, 10}. a List the elements of: i A∩B ii A∪B b Find: i n(A∩B) ii n(A∪B) 2 C = {a, b, g, h, u, w, z} and D = {a, g, u, v, w, x, y, z}. a List the elements of: i C∩D ii C∪D b Is it true that u is an element of C∩D? Explain your answer. c Is it true that g is not an element of C∪D? Explain your answer. 3 F = {equilateral triangles} and G = {isosceles triangles}. a Explain why F ⊂ G. b What is F∩G? Can you simplify F∩G in any way? 4 T = {1, 2, 3, 6, 7} and W = {1, 3, 9, 10}. a List the members of the set: (i) T∪W (ii) T∩W b Is it true that 5 ∉T? Explain your answer fully. 5 If ℰ = {rabbit, cat, dog, emu, turtle, mouse, aardvark} and H = {rabbit, emu, mouse} and J = {cat, dog}: a list the members of H′ b list the members of J′ c list the members of H′∪J′ d what is H∩J? e find (H′)′ f what is H∪H′? Venn diagrams In 1880, mathematician John Venn began using overlapping circles to illustrate connections between sets. These diagrams are now referred to as Venn diagrams. For example, if ℰ = {1, 2, 3, 4, 5, 6, 7, 8, 9, 10}, A = {1, 2, 3, 4, 5, 6, 7} and B = {4, 5, 8} then the Venn diagram looks like this: A B 1 2 3 4 5 6 7 8 9 10 Unions and intersections can be reversed without changing their elements, for example A∪B = B∪A and C∩D = D∩C. You need to understand Venn diagrams well as you will need to use them to determine probabilities in Chapter 24. FAST FORWARD E e s s - R e v i e w C o p y - C a m b r i d g e U n i v e r s i t y P r e s s - R e v i e w C o p y R e v i e w C o p y - C a m b r i d g e U n i v e r s i t y P r e s s - R e v i e w C o p y R e v i e w C o p y - C a m b r i d g e U n i v e r s i t y P r e s s - R e v i e w C o p y R e v i e w C o p y - C a m b r i d g e U n i v e r s i t y Copyright Material - Review Only - Not for Redistribution
- 200. Cambridge IGCSE Mathematics 190 Unit 3: Number Notice that the universal set is shown by drawing a rectangle and then each set within the universal set is shown as a circle. The intersection of the sets A and B is contained within the overlap of the circles. The union is shown by the region enclosed by at least one circle. Here are some examples of Venn diagrams and shaded regions to represent particular sets: The rectangle represents . The circle represents set A. A Set A and set B are disjoint, they have no common elements. A B M S 13 4 6 7 Venn diagrams can also be used to show the number of elements n(A) in a set. In this case: M = {students doing Maths}, S = {students doing Science}. A B A ∩ B is the shaded portion. A ∪ B is the shaded portion. A B Always remember to draw the box around the outside and mark it, ℰ, to indicate that it represents the universal set. A′ is the shaded portion. A A B (A ∪ B)′ is the shaded portion. A B A ⊂ B Worked example 7 Worked example 7 For the following sets: ℰ= {a, b, c, d, e, f, g, h, i, j, k} A = {a, c, e, h, j} B = {a, b, d, g, h} a illustrate these sets in a Venn diagram b list the elements of the set A∩B c find n(A∩B) d list the elements of the set A∪B e find n(A∪B) f list the set A∩B’. E e s s - R e v i e w C o p y - C a m b r i d g e U n i v e r s i t y P r e s s - R e v i e w C o p y R e v i e w C o p y - C a m b r i d g e U n i v e r s i t y P r e s s - R e v i e w C o p y R e v i e w C o p y - C a m b r i d g e U n i v e r s i t y P r e s s - R e v i e w C o p y R e v i e w C o p y - C a m b r i d g e U n i v e r s i t y Copyright Material - Review Only - Not for Redistribution
- 201. 191 Unit 3: Number 9 Sequences and sets Exercise 9.9 1 Use the given Venn diagram to answer the following questions. a List the elements of A and B b List the elements of A∩B. c List the elements of A∪B. A B 6 18 24 12 4 8 16 20 2 10 22 14 2 Use the given Venn diagram to answer the following questions. a List the elements that belong to: i P ii Q b List the elements that belong to both P and Q. c List the elements that belong to: i neither P nor Q ii P but not Q. P Q e c a h g f j i b d 3 Draw a Venn diagram to show the following sets and write each element in its correct space. a The universal set is {a ,b, c, d, e, f, g, h}. A = {b, c, f, g} and B = {a, b, c, d, f}. b ℰ = {whole numbers from 20 to 36 inclusive}. A = {multiples of four} and B = {numbers greater than 29}. 4 The universal set is: {students in a class}. V = {students who like volleyball}. S = {students who play soccer}. There are 30 students in the class. The Venn diagram shows numbers of students. a Find the value of x. b How many students like volleyball? c How many students in the class do not play soccer? V S 10 8 6 x a b c d e f A B a c j e d g b h f k i Look in the region that is contained within the overlap of both circles. This region contains the set {a, h}. So A∩B = {a, h}. n(A∩B) = 2 as there are two elements in the set A∩B. A∪B = set of elements of A or B or both = {a, b, c, d, e, g, h, j}. n(A∪B) = 8 A∩B’ = set of all elements that are both in set A and not in set B = {c, e, j} e s s - R e v i e w C o p y - C a m b r i d g e U n i v e r s i t y P r e s s - R e v i e w C o p y R e v i e w C o p y - C a m b r i d g e U n i v e r s i t y P r e s s - R e v i e w C o p y R e v i e w C o p y - C a m b r i d g e U n i v e r s i t y P r e s s - R e v i e w C o p y R e v i e w C o p y - C a m b r i d g e U n i v e r s i t y Copyright Material - Review Only - Not for Redistribution
- 202. Cambridge IGCSE Mathematics 192 Unit 3: Number 5 Copy the Venn diagram and shade the region which represents the subset A∩B′. A B Set builder notation So far the contents of a set have either been given as a list of the elements or described by a rule (in words) that defines whether or not something is a member of the set. We can also describe sets using set builder notation. Set builder notation is a way of describing the elements of a set using the properties that each of the elements must have. For example: A = {x : x is a natural number} This means: Set A is the set of A = { x : x is a natural number } all values (x) such that each value of x is a natural number In other words, this is the set: A = {1, 2, 3, 4, … } Sometimes the set builder notation contains restrictions. For example, B = {{x : x is a letter of the alphabet, x is a vowel} In this case, set B = {a, e, i, o, u} Here is another example: A = {integers greater than zero but less than 20}. In set builder notation this is: A = {x : x is an integer, 0 x 20} This is read as: ‘A is the set of all x such that x is an integer and x is greater than zero but less than 20’. The following examples should help you to get used to the way in which this notation is used. Worked example 8 List the members of the set C if: C = {x:x ∈ primes, 10 x 20}. Read the set as: ‘C is the set of all x such that x is a member of the set of primes and x is greater than 10 but less than 20’. The prime numbers greater than 10 but less than 20 are 11, 13, 17 and 19. So, C = {11, 13, 17, 19} E e s s - R e v i e w C o p y - C a m b r i d g e U n i v e r s i t y P r e s s - R e v i e w C o p y R e v i e w C o p y - C a m b r i d g e U n i v e r s i t y P r e s s - R e v i e w C o p y R e v i e w C o p y - C a m b r i d g e U n i v e r s i t y P r e s s - R e v i e w C o p y R e v i e w C o p y - C a m b r i d g e U n i v e r s i t y Copyright Material - Review Only - Not for Redistribution
- 203. 193 Unit 3: Number 9 Sequences and sets As you can see from this last example, set builder notation can sometimes force you to write more, but this isn’t always the case, as you will see in the following exercise. Exercise 9.10 1 Describe each of these sets using set builder notation. a square numbers less than 101 b days of the week c integers less than 0 d whole numbers between 2 and 10 e months of the year containing 30 days 2 Express each of the following in set builder notation. a {2, 3, 4, 5, 6, 7, 8} b {a, e, i, o, u} c {n, i, c, h, o, l, a, s} d {2, 4, 6, 8, 10, 12, 14, 16, 18, 20} e {1, 2, 3, 4, 6, 9, 12, 18, 36} 3 List the members of each of the following sets. a {x : x is an integer, 40 x 50} b {x : x is a regular polygon and x has no more than six sides} c {x : x is a multiple of 3, 16 x 32} 4 Describe each set in words and say why it’s not possible to list all the members of each set. a A = {x, y : y = 2x + 4} b B = {x : x3 is negative} 5 If A = {x : x is a multiple of three} and B = {y : y is a multiple of five}, express A∩B in set builder notation. 6 ℰ= {y : y is positive, y is an integer less than 18}. A = {w : w 5} and B = {x : x 5}. a List the members of the set: i A∩B ii A′ iii A′∩B iv A∩B′ v (A∩B′)′ b What is A∪B? c List the members of the set in part (b). Set builder notation is very useful when it isn’t possible to list all the members of set because the set is infinite. For example, all the numbers less than −3 or all whole numbers greater than 1000. Worked example 9 Express the following set in set builder notation: D = {right-angled triangles}. So, D = {x : x is a triangle, x has a right-angle} If D is the set of all right-angled triangles then D is the set of all x such that x is a triangle and x is right-angled. E e s s - R e v i e w C o p y - C a m b r i d g e U n i v e r s i t y P r e s s - R e v i e w C o p y R e v i e w C o p y - C a m b r i d g e U n i v e r s i t y P r e s s - R e v i e w C o p y R e v i e w C o p y - C a m b r i d g e U n i v e r s i t y P r e s s - R e v i e w C o p y R e v i e w C o p y - C a m b r i d g e U n i v e r s i t y Copyright Material - Review Only - Not for Redistribution
- 204. Cambridge IGCSE Mathematics 194 Unit 3: Number Summary Do you know the following? • A sequence is the elements of a set arranged in a particular order, connected by a rule. • A term is a value (element) of a sequence. • If the position of a term in a sequence is given the letter n then a rule can be found to work out the value of the nth term. • A rational number is a number that can be written as a fraction. • An irrational number has a decimal part that continues forever without repeating. • A set is a list or collection of objects that share a characteristic. • An element is a member of a set. • A set that contains no elements is called the empty set (∅). • A universal set (ℰ) contains all the possible elements appropriate to a particular problem. • The complement of a set is the elements that are not in the set (′). • The elements of two sets can be combined (without repeats) to form the union of the two sets (∪). • The elements that two sets have in common is called the intersection of the two sets (∩). • The elements of a subset that are all contained within a larger set are a proper subset (⊆). • If it is possible for a subset to be equal to the larger set, then it is not a proper subset (⊂). • A Venn diagram is a pictorial method of showing sets. • A shorthand way of describing the elements of a set is called set builder notation. Are you able to …? • continue sequences • describe a rule for continuing a sequence • find the nth term of a sequence • use the nth term to find later terms • find out whether or not a specific number is in a sequence • generate sequences from shape patterns • find a formula for the number of shapes used in a pattern • write a recurring decimal as a fraction in its lowest terms • describe a set in words • find the complement of a set • represent the members of set using a Venn diagram • solve problems using a Venn diagram • describe a set using set builder notation. E E E E E e s s - R e v i e w C o p y - C a m b r i d g e U n i v e r s i t y P r e s s - R e v i e w C o p y R e v i e w C o p y - C a m b r i d g e U n i v e r s i t y P r e s s - R e v i e w C o p y R e v i e w C o p y - C a m b r i d g e U n i v e r s i t y P r e s s - R e v i e w C o p y R e v i e w C o p y - C a m b r i d g e U n i v e r s i t y Copyright Material - Review Only - Not for Redistribution
- 205. 195 Unit 3: Number Examination practice Exam-style questions 1 Pattern 1 Pattern 2 Pattern 3 The first three patterns in a sequence are shown above. a Copy and complete the table. Pattern number (n) 1 2 3 4 Number of dots (d) 5 b Find a formula for the number of dots, d, in the nth pattern. c Find the number of dots in the 60th pattern. d Find the number of the pattern that has 89 dots. 2 The diagram below shows a sequence of patterns made from dots and lines. 1 dot 2 dots 3 dots a Draw the next pattern in the sequence. b Copy and complete the table for the numbers of dots and lines. Dots 1 2 3 4 5 6 Lines 4 7 10 c How many lines are in the pattern with 99 dots? d How many lines are in the pattern with n dots? e Complete the following statement: There are 85 lines in the pattern with . . . dots. Past paper questions 1 a Here are the first four terms of a sequence: 27 23 19 15 i Write down the next term in the sequence. [1] ii Explain how you worked out your answer to part (a)(i). [1] b The nth term of a different sequence is 4n – 2. Write down the first three terms of this sequence. [1] c Here are the first four terms of another sequence: –1 2 5 8 Write down the nth term of this sequence. [2] [Cambridge IGCSE Mathematics 0580 Paper 11 Q23 October/November 2013] e s s - R e v i e w C o p y - C a m b r i d g e U n i v e r s i t y P r e s s - R e v i e w C o p y R e v i e w C o p y - C a m b r i d g e U n i v e r s i t y P r e s s - R e v i e w C o p y R e v i e w C o p y - C a m b r i d g e U n i v e r s i t y P r e s s - R e v i e w C o p y R e v i e w C o p y - C a m b r i d g e U n i v e r s i t y Copyright Material - Review Only - Not for Redistribution
- 206. Unit 3: Number 196 2 Shade the required region on each Venn diagram. [2] A B A B A′ ∪ B A′ ∩ B′ [Cambridge IGCSE Mathematics 0580 Paper 22 Q1 May/June 2013] 3 The first five terms of a sequence are shown below. 13 9 5 1 –3 Find the nth term of this sequence. [2] [Cambridge IGCSE Mathematics 0580 Paper 22 Q3 May/June 2013] 4 Shade the required region in each of the Venn diagrams. [2] P Q R (P ∩ R) ∪ Q A B A′ [Cambridge IGCSE Mathematics 0580 Paper 23 Q9 October/November 2012] 5 Shade the region required in each Venn diagrams. [2] A B A B (A ∪ B)′ A′ ∩ B [Cambridge IGCSE Mathematics 0580 Paper 22 Q4 October/November 2014] 6 The Venn diagram shows the number of students who study French (F), Spanish (S) and Arabic (A). F S A 7 4 1 2 3 5 8 0 a Find n(A ∪ (F ∩ S)). [1] b On the Venn diagram, shade the region F' ∩ S. [1] [Cambridge IGCSE Mathematics 0580 Paper 22 Q6 October/November 2015] E E e s s - R e v i e w C o p y - C a m b r i d g e U n i v e r s i t y P r e s s - R e v i e w C o p y R e v i e w C o p y - C a m b r i d g e U n i v e r s i t y P r e s s - R e v i e w C o p y R e v i e w C o p y - C a m b r i d g e U n i v e r s i t y P r e s s - R e v i e w C o p y R e v i e w C o p y - C a m b r i d g e U n i v e r s i t y Copyright Material - Review Only - Not for Redistribution
- 207. 197 Unit 3: Number 7 Layer 1 Layer 2 Layer 3 The diagrams show layers of white and grey cubes. Khadega places these layers on top of each other to make a tower. a Complete the table for towers with 5 and 6 layers. Number of layers 1 2 3 4 5 6 Total number of white cubes 0 1 6 15 Total number of grey cubes 1 5 9 13 Total number of cubes 1 6 15 28 [4] b i Find, in terms of n, the total number of grey cubes in a tower with n layers. [2] ii Find the total number of grey cubes in a tower with 60 layers. [1] iii Khadega has plenty of white cubes but only 200 grey cubes. How many layers are there in the highest tower that she can build? [2] [Cambridge IGCSE Mathematics 0580 Paper 42 Q9 (a) (b) October/November 2014] 8 Write the recurring decimal 0.36 . as a fraction. Give your answer in its simplest form. [0.36 . means 0.3666…] [3] [Cambridge IGCSE Mathematics 0580 Paper 22 Q12 May/June 2016] E e s s - R e v i e w C o p y - C a m b r i d g e U n i v e r s i t y P r e s s - R e v i e w C o p y R e v i e w C o p y - C a m b r i d g e U n i v e r s i t y P r e s s - R e v i e w C o p y R e v i e w C o p y - C a m b r i d g e U n i v e r s i t y P r e s s - R e v i e w C o p y R e v i e w C o p y - C a m b r i d g e U n i v e r s i t y Copyright Material - Review Only - Not for Redistribution
- 208. 198 Unit 3: Algebra Chapter 10: Straight lines and quadratic equations • Equation of a line • Gradient • y-intercept • Constant • x-intercept • Line segment • Midpoint • Expand • Constant term • Quadratic expression • Factorisation • Difference between two squares • Quadratic equation Key words Geoff wishes he had paid more attention when his teacher talked about negative and positive gradients and rates of change. On 4 October 1957, the first artificial satellite, Sputnik, was launched. This satellite orbited the Earth but many satellites that do experiments to study the upper atmosphere fly on short, sub-orbital flights. The flight path can be described with a quadratic equation, so scientists know where the rocket will be when it deploys its parachute and so they know where to recover the instruments. The same equation can be used to describe any thrown projectile including a baseball! EXTENDED In this chapter you will learn how to: • construct a table of values and plot points to draw graphs • find the gradient of a straight line graph • recognise and determine the equation of a line • determine the equation of a line parallel to a given line • calculate the gradient of a line using co-ordinates of points on the line • find the gradient of parallel and perpendicular lines • find the length of a line segment and the co-ordinates of its midpoint • expand products of algebraic expressions • factorise quadratic expressions • solve quadratic equations by factorisation EXTENDED e s s - R e v i e w C o p y - C a m b r i d g e U n i v e r s i t y P r e s s - R e v i e w C o p y R e v i e w C o p y - C a m b r i d g e U n i v e r s i t y P r e s s - R e v i e w C o p y R e v i e w C o p y - C a m b r i d g e U n i v e r s i t y P r e s s - R e v i e w C o p y R e v i e w C o p y - C a m b r i d g e U n i v e r s i t y Copyright Material - Review Only - Not for Redistribution
- 209. Unit 3: Algebra 199 10 Straight lines and quadratic equations RECAP You should already be familiar with the following algebra and graph work: Table of values and straight line graphs (Stage 9 Mathematics) A table of values gives a set of ordered pairs (x, y) that you can use to plot graphs on a coordinate grid. x −1 0 1 2 y 3 4 5 6 (−1, 3), (0, 4), (1, 5) and (2, 6) are all points on the graph. Plot them and draw a line through them. Equations in the form of y = mx + c (Year 9 Mathematics) The standard equation of a straight line graph is y = mx + c • m is the gradient (or steepness) of the graph • c is the point where the graph crosses the y-axis (the y-intercept) Gradient of a straight line (Year 9 Mathematics) Gradient( adient( ) rise run change i ange in - values change i ange in - values m y x = = = = Drawing a straight line graph (Year 9 Mathematics) You can use the equation of a graph to find the gradient and y-intercept and use these to draw the graph. For example y x y x y x y x 1 3 y x y x 2 − Expand expressions to remove brackets (Chapter 2) To expand 3x(2x − 4) you multiply the term outside the bracket by each term inside the first bracket 3x (2x − 4) = 3x × 2x − 3x × 4 = 6x2 − 12x x y –4 –10 –2 0 4 –6 2 –8 6 8 10 –4 –10 –6 –8 –2 2 4 6 y-intercept + gradient 1 up, 3 right 8 10 x y –4 –10 –2 0 4 –6 2 –8 6 8 10 –4 –10 –6 –8 –2 2 4 6 8 10 e s s - R e v i e w C o p y - C a m b r i d g e U n i v e r s i t y P r e s s - R e v i e w C o p y R e v i e w C o p y - C a m b r i d g e U n i v e r s i t y P r e s s - R e v i e w C o p y R e v i e w C o p y - C a m b r i d g e U n i v e r s i t y P r e s s - R e v i e w C o p y R e v i e w C o p y - C a m b r i d g e U n i v e r s i t y Copyright Material - Review Only - Not for Redistribution
- 210. Unit 3: Algebra Cambridge IGCSE Mathematics 200 10.1 Straight lines Using equations to plot lines Mr Keele owns a boat hire company. If Mr Keele makes a flat charge of $40 and then another $15 per hour of hire, you can find a formula for the total cost $y after a hire time of x hours. Total cost = flat charge + total charge for all hours y = 40 + 15 × x or (rearranging) y = 15x + 40 Now think about the total cost for a range of different hire times: one hour: cost = 15 × 1 + 40 = $55 two hours: cost = 15 × 2 + 40 = $70 three hours: cost = 15 × 3 + 40 = $85 and so on. If you put these values into a table (with some more added) you can then plot a graph of the total cost against the number of hire hours: Number of hours (x) 1 2 3 4 5 6 7 8 9 Total cost (y) 55 70 85 100 115 130 145 160 175 x y 150 200 100 50 2 4 6 8 10 Costs for hiring Mr Keele’s boats Total cost ($) Number of hours 0 The graph shows the total cost of the boat hire (plotted on the vertical axis) against the number of hire hours (on the horizontal axis). Notice that the points all lie on a straight line. The formula y = 15x + 40 tells you how the y co-ordinates of all points on the line are related to the x co-ordinates. This formula is called an equation of the line. The following worked examples show you how some more lines can be drawn from given equations. You will recognise that the formulae used to describe nth terms in chapter 9 are very similar to the equations used in this chapter. REWIND Equations of motion, in physics, often include terms that are squared. To solve some problems relating to physical problems, therefore, physicists often need to solve quadratic equations. LINK e s s - R e v i e w C o p y - C a m b r i d g e U n i v e r s i t y P r e s s - R e v i e w C o p y R e v i e w C o p y - C a m b r i d g e U n i v e r s i t y P r e s s - R e v i e w C o p y R e v i e w C o p y - C a m b r i d g e U n i v e r s i t y P r e s s - R e v i e w C o p y R e v i e w C o p y - C a m b r i d g e U n i v e r s i t y Copyright Material - Review Only - Not for Redistribution
- 211. Unit 3: Algebra 201 10 Straight lines and quadratic equations Worked example 2 Draw the line with equation y = − x + 3 for x-values between −2 and 5 inclusive. The table for this line would be: x −2 −1 0 1 2 3 4 5 y 5 4 3 2 1 0 −1 −2 x y –2 –1 0 1 2 3 4 5 –1 –2 1 2 3 4 5 Graph of y = – x + 3 Worked example 1 A straight line has equation y = 2x + 3. Construct a table of values for x and y and draw the line on a labelled pair of axes. Use integer values of x from −3 to 2. Substituting the values −3, −2, −1, 0, 1 and 2 into the equation gives the values in the following table: x −3 −2 −1 0 1 2 y −3 −1 1 3 5 7 Notice that the y-values range from −3 to 7, so your y-axis should allow for this. x y –4 –3 –2 –1 0 1 2 3 –2 –3 –1 1 2 3 4 5 6 7 Graph of y = 2x + 3 e s s - R e v i e w C o p y - C a m b r i d g e U n i v e r s i t y P r e s s - R e v i e w C o p y R e v i e w C o p y - C a m b r i d g e U n i v e r s i t y P r e s s - R e v i e w C o p y R e v i e w C o p y - C a m b r i d g e U n i v e r s i t y P r e s s - R e v i e w C o p y R e v i e w C o p y - C a m b r i d g e U n i v e r s i t y Copyright Material - Review Only - Not for Redistribution
- 212. Unit 3: Algebra Cambridge IGCSE Mathematics 202 To draw a graph from its equation: • draw up a table of values and fill in the x and y co-ordinates of at least three points (although you may be given more) • draw up and label your set of axes for the range of y-values you have worked out • plot each point on the number plane • draw a straight line to join the points (use a ruler). Exercise 10.1 1 Make a table for x-values from −3 to 3 for each of the following equations. Plot the co-ordinates on separate pairs of axes and draw the lines. a y = 3x + 2 b y = x + 2 c y = 2x − 1 d y = 5x − 4 e y = −2x + 1 f y = −x − 2 g y = 6 − x h y x = + y x = + y x 3 y x y x = + = + y x = + y x = + 1 2 i y x = + y x = + y x y x = + 1 2 y x y x 1 j y = 4x k y = −3 l y = −1 − x m x + y = 4 n x − y = 2 o y = x p y = −x 2 Plot the lines y = 2x, y = 2x + 1, y = 2x − 3 and y = 2x + 2 on the same pair of axes. Use x-values from −3 to 3. What do you notice about the lines that you have drawn? 3 For each of the following equations, draw up a table of x-values for −3, 0 and 3. Complete the table of values and plot the graphs on the same set of axes. a y = x + 2 b y = −x + 2 c y = x − 2 d y = − x − 2 4 Use your graphs from question 3 above to answer these questions. a Where do the graphs cut the x-axis? b Which graphs slope up to the right? c Which graphs slope down to the right? d Which graphs cut the y-axis at (0, 2)? e Which graphs cut the y-axis at (0, −2)? f Does the point (3, 3) lie on any of the graphs? If so, which? g Which graphs are parallel to each other? h Compare the equations of graphs that are parallel to each other. How are they similar? How are they different? Gradient The gradient of a line tells you how steep the line is. For every one unit moved to the right, the gradient will tell you how much the line moves up (or down). When graphs are parallel to each other, they have the same gradient. Vertical and horizontal lines Look at the two lines shown in the following diagram: x y –4 –3 –2 –1 0 1 2 3 4 5 –4 –3 –2 –1 1 2 3 4 5 –5 –5 y = –2 x = 3 Before drawing your axes, always check that you know the range of y-values that you need to use. e s s - R e v i e w C o p y - C a m b r i d g e U n i v e r s i t y P r e s s - R e v i e w C o p y R e v i e w C o p y - C a m b r i d g e U n i v e r s i t y P r e s s - R e v i e w C o p y R e v i e w C o p y - C a m b r i d g e U n i v e r s i t y P r e s s - R e v i e w C o p y R e v i e w C o p y - C a m b r i d g e U n i v e r s i t y Copyright Material - Review Only - Not for Redistribution
- 213. Unit 3: Algebra 203 10 Straight lines and quadratic equations Every point on the vertical line has x co-ordinate = 3. So the equation of the line is simply x = 3. Every point on the horizontal line has y co-ordinate = −2. So the equation of this line is y = −2. All vertical lines are of the form: x = a number. All horizontal lines are of the form: y = a number. The gradient of a horizontal line is zero (it does not move up or down when you move to the right). Exercise 10.2 1 Write down the equation of each line shown in the diagram. x y –2 –7 –1 2 –3 1 –4 3 4 7 –2 –7 –3 –4 –1 0 1 2 3 4 7 (d) (a) (e) (f) (b) (c) –5 –6 5 6 5 6 –5 –6 2 Draw the following graphs on the same set of axes without plotting points or drawing up a table of values. a y = 3 b x = 3 c y = −1 d x = −1 e y = −3 f y = 4 g x = 1 2 h x = −7 2 i a graph parallel to the x-axis which cuts the y-axis at (0, 4) j a graph parallel to the y-axis which goes through the point (−2, 0) e s s - R e v i e w C o p y - C a m b r i d g e U n i v e r s i t y P r e s s - R e v i e w C o p y R e v i e w C o p y - C a m b r i d g e U n i v e r s i t y P r e s s - R e v i e w C o p y R e v i e w C o p y - C a m b r i d g e U n i v e r s i t y P r e s s - R e v i e w C o p y R e v i e w C o p y - C a m b r i d g e U n i v e r s i t y Copyright Material - Review Only - Not for Redistribution
- 214. Unit 3: Algebra Cambridge IGCSE Mathematics 204 Lines that are neither vertical nor horizontal x y –4 –10 –2 4 –6 2 –8 6 8 10 –4 –2 0 2 4 6 A (b) (a) The diagram shows two different lines. If you take a point A on the line and then move to the right then, on graph (a) you need to move up to return to the line, and on graph (b) you need to move down. The gradient of a line measures how steep the line is and is calculated by dividing the change in the y co-ordinate by the change in the x co-ordinate: gradient -change -increase = y x For graph (a): the y-change is 8 and the x-increase is 2, so the gradient is 8 2 4 = For graph (b): the y-change is −9 (negative because you need to move down to return to the line) and the x-increase is 4, so the gradient is − − 9 4 2 25 = . 2 2 2 2 . It is essential that you think about x-increases only. Whether the y-change is positive or negative tells you what the sign of the gradient will be. You will deal with gradient as a rate of change when you work with kinematic graphs in Chapter 21. FAST FORWARD Another good way of remembering the gradient formula is gradient ’rise’ ’run’ = . The ‘run’ must always be to the right (increase x). e s s - R e v i e w C o p y - C a m b r i d g e U n i v e r s i t y P r e s s - R e v i e w C o p y R e v i e w C o p y - C a m b r i d g e U n i v e r s i t y P r e s s - R e v i e w C o p y R e v i e w C o p y - C a m b r i d g e U n i v e r s i t y P r e s s - R e v i e w C o p y R e v i e w C o p y - C a m b r i d g e U n i v e r s i t y Copyright Material - Review Only - Not for Redistribution
- 215. Unit 3: Algebra 205 10 Straight lines and quadratic equations Worked example 3 Calculate the gradient of each line. Leave your answer as a whole number or fraction in its lowest terms. a x y –2 2 4 6 8 10 12 –2 0 2 4 6 b x y 0 2 1 3 –2 –1 2 4 6 a Notice that the graph passes through the points (2, 4) and (4, 10). gradient -change -increase = = = = − = = = = y x 10 4 4 2 − 4 2 6 2 3 b Notice that the graph passes through the points (2, 1) and (4, 0). gradient -change -increase = = = = = − y x 0 1 − 0 1 4 2 − 4 2 1 2 Worked example 4 Calculate the gradient of the line that passes through the points (3, 5) and (7, 17). 17 – 5 = 12 7 – 3 = 4 (7, 17) (3, 5) gradient -change -increase = = = = − = = = = y x 17 5 7 3 − 7 3 12 4 3 Think about where the points would be, in relation to each other, on a pair of axes. You don’t need to draw this accurately but the diagram will give you an idea of how it may appear. E e s s - R e v i e w C o p y - C a m b r i d g e U n i v e r s i t y P r e s s - R e v i e w C o p y R e v i e w C o p y - C a m b r i d g e U n i v e r s i t y P r e s s - R e v i e w C o p y R e v i e w C o p y - C a m b r i d g e U n i v e r s i t y P r e s s - R e v i e w C o p y R e v i e w C o p y - C a m b r i d g e U n i v e r s i t y Copyright Material - Review Only - Not for Redistribution
- 216. Unit 3: Algebra Cambridge IGCSE Mathematics 206 Exercise 10.3 1 Calculate the gradient of each line. Leave your answers as a fraction in its lowest terms. a x y 6 0 4 2 –2 2 –2 4 6 b x y 6 0 4 2 2 –2 –2 4 6 c x y 6 4 2 –2 0 2 –2 4 6 d x y 6 4 2 –6 –4 –2 –2 0 e x y 6 4 2 –6 –4 –2 0 2 –2 8 10 12 f x y 6 0 4 –4 2 2 4 –4 6 g x y 6 4 2 –2 0 2 –2 4 6 h x y 6 4 2 –2 0 2 –2 4 6 i x y –4 –2 2 0 –6 –6 –4 –2 2 2 Calculate the gradient of the line that passes through both points in each case. Leave your answer as a whole number or a fraction in its lowest terms. a A (1, 2) and B (3, 8) b A (0, 6) and B (3, 9) c A (2, −1) and B (4, 3) d A (3, 2) and B (7, −10) e A (−1, −4) and B (−3, 2) f A (3, −5) and B (7, 12) Applying your skills 3 If the car climbs 60m vertically how far must the car have travelled horizontally? horizontal distance vertical distance GRADIENT 2 15 . Think carefully about whether you expect the gradient to be positive or negative. Think carefully about the problem and what mathematics you need to do to find the solution. E e s s - R e v i e w C o p y - C a m b r i d g e U n i v e r s i t y P r e s s - R e v i e w C o p y R e v i e w C o p y - C a m b r i d g e U n i v e r s i t y P r e s s - R e v i e w C o p y R e v i e w C o p y - C a m b r i d g e U n i v e r s i t y P r e s s - R e v i e w C o p y R e v i e w C o p y - C a m b r i d g e U n i v e r s i t y Copyright Material - Review Only - Not for Redistribution
- 217. Unit 3: Algebra 207 10 Straight lines and quadratic equations Finding the equation of a line Look at the three lines shown below. a x y –4 –2 0 4 2 –4 –2 2 4 y = 3x + 2 b x y –2 0 4 2 –4 –4 –2 2 4 y = –2x + 4 c y x = − 1 2 3 x y –4 –2 0 4 2 –4 –2 2 4 Check for yourself that the lines have the following gradients: • gradient of line (a) = 3 • gradient of line (b) = −2 • gradient of line (c) = 1 2 Notice that the gradient of each line is equal to the coefficient of x in the equation and that the point at which the line crosses the y-axis (known as the y-intercept) has a y co-ordinate that is equal to the constant term. In fact this is always true when y is the subject of the equation: y is the subject of the equation gradient y-intercept y = mx + c In summary: • equations of a straight line graphs can be written in the form of y = mx + c • c (the constant term) tells you where the graph cuts the y-axis (the y-intercept) • m (the coefficient of x) is the gradient of the graph; a negative value means the graph slopes down the to the right, a positive value means it slopes up to the right. The higher the value of m, the steeper the gradient of the graph • graphs which have the same gradient are parallel to each other (therefore graphs that are parallel have the same gradient). You met the coefficient in chapter 2. REWIND Worked example 5 Find the gradient and y-intercept of the lines given by each of the following equations. a y = 3x + 4 b y = 5 − 3x c y x = + y x = + y x y x = + 1 2 y x y x y x = + y x = + 9 d x + y = 8 e 3x + 2y = 6 a y = 3x + 4 Gradient = 3 y-intercept = 4 The coefficient of x is 3. The constant term is 4. b y = 5 − 3x Gradient = −3 y-intercept = 5 Re-write the equation as y = −3x + 5. The coefficient of x is −3. The constant term is 5. e s s - R e v i e w C o p y - C a m b r i d g e U n i v e r s i t y P r e s s - R e v i e w C o p y R e v i e w C o p y - C a m b r i d g e U n i v e r s i t y P r e s s - R e v i e w C o p y R e v i e w C o p y - C a m b r i d g e U n i v e r s i t y P r e s s - R e v i e w C o p y R e v i e w C o p y - C a m b r i d g e U n i v e r s i t y Copyright Material - Review Only - Not for Redistribution
- 218. Unit 3: Algebra Cambridge IGCSE Mathematics 208 Worked example 6 Find the equation of each line shown in the diagrams. a x y –2 –1 2 3 4 5 6 1 –2 –1 0 1 2 b x y –2 –1 2 –1 0 1 1 3 2 a Gradient = 6 and the y-intercept = −1 So the equation is y = 6x − 1 Gradient = 6 1 6 = Graph crosses y-axis at −1 b Gradient = −3 4 and the y-intercept = 1 So the equation is y x y x y x = − y x + 3 4 y x y x 1 Gradient = − = − 1 5 2 3 4 1 5 1 5 Graph crosses y-axis at 1. Exercise 10.4 1 Find the gradient and y-intercept of the lines with the following equations. Sketch the graph in each case, taking care to show where the graph cuts the y-axis. a y = 4x − 5 b y = 2x + 3 c y = −3x − 2 d y = −x + 3 e y x = + y x = + y x y x = + 1 = + = + 3 y x y x y x = + y x = + 2 f y x y x y x = − y x 6 y x y x y x = − y x = − 1 4 y x y x g x + y = 4 h x + 2y = 4 i x y + = + = y + = 2 3 j x = 4y − 2 k x y = + = + y = + 4 2 l 2x − 3y = −9 You should always label your axes x and y when drawing graphs – even when they are sketches. Look carefully at your sketches for answers 1(d) and 1(g). If you draw them onto the same axes you will see that they are parallel. These lines have the same gradient but they cut the y-axis at different places. If two or more lines are parallel, they will have the same gradient. c y x = + y x = + y x y x = + 1 2 y x y x y x = + y x = + 9 Gradient = 1 2 y-intercept = 9 The gradient can be a fraction. d x + y = 8 Gradient = −1 y-intercept = 8 Subtracting x from both sides, so that y is the subject, gives y = −x + 8. e 3x + 2y = 6 Gradient = −3 2 y-intercept = 3 Make y the subject of the equation. 3 2 6 2 3 6 3 2 6 2 3 2 3 x y 3 2 x y 3 2 y x 2 3 y x 2 3 y x 2 y x y x 2 y x + = 3 2 + = 3 2 x y + = 3 2 x y + = 3 2 x y = + 2 3 = + y x = + 2 3 y x = + 2 3 y x = + y x = + y x y x = + = + y x = + y x y x = + 2 3 y x = + y x 2 3 y x 2 3 = + y x − − e s s - R e v i e w C o p y - C a m b r i d g e U n i v e r s i t y P r e s s - R e v i e w C o p y R e v i e w C o p y - C a m b r i d g e U n i v e r s i t y P r e s s - R e v i e w C o p y R e v i e w C o p y - C a m b r i d g e U n i v e r s i t y P r e s s - R e v i e w C o p y R e v i e w C o p y - C a m b r i d g e U n i v e r s i t y Copyright Material - Review Only - Not for Redistribution
- 219. Unit 3: Algebra 209 10 Straight lines and quadratic equations 2 Rearrange each equation so that it is in the form y = mx + c and then find the gradient and y-intercept of each graph. a 2y = x − 4 b 2x + y − 1 = 0 c x = y 2 − 2 d 2x − y − 5 = 0 e 2x − y + 5 = 0 f x + 3y − 6 = 0 g 4y = 12x − 8 h 4x + y = 2 i y 2 = x + 2 j y 3 = 2x − 4 k x y 2 4 1 y 4 12 − = 4 1 − = 4 1 y 4 1 − = 4 1 l − = − y x 3 4 2 = − 4 2 = − x 4 2 = − = − 4 2 3 Find the equation (in the form of y = mx + c) of a line which has: a a gradient of 2 and a y-intercept of 3 b a gradient of −3 and a y-intercept of −2 c a gradient of 3 and a y-intercept of −1 d a gradient of − 3 2 and a y-intercept at (0, −0.5) e a y-intercept of 2 and a gradient of − 3 4 f a y-intercept of −3 and a gradient of 4 8 g a y-intercept of −0.75 and a gradient of 0.75 h a y-intercept of −2 and a gradient of 0 i a gradient of 0 and a y-intercept of 4 4 Find an equation for each line. a x y –2 –1 –4 –3 1 2 –9 –6 –7 –8 –5 –2 –3 –4 –1 0 1 2 3 4 b x y –2 –1 –4 –3 0 1 2 3 6 5 4 7 –2 –3 –4 –1 1 2 3 4 c x y –2 –1 0 1 2 3 6 5 4 7 8 9 –2 –3 –4 –1 1 2 3 4 d x y –2 –1 0 1 2 3 6 5 4 7 8 9 –2 –3 –4 –1 0 1 2 3 4 e x y –2 –1 1 2 3 6 5 4 7 8 9 –2 –3 –4 –1 0 1 2 3 4 f x y –2 –1 0 1 2 3 6 5 4 7 8 9 –2 –3 –4 –1 1 2 3 4 g x y –2 –1 –4 –3 –6 –5 0 1 2 3 5 4 –2 –3 –4 –1 1 2 3 4 h x y –2 –1 –4 –3 0 1 2 3 6 5 4 7 –2 –3 –4 –1 1 2 3 4 i x –2 –1 –4 –3 0 1 2 3 6 5 4 7 –2 –3 –4 –1 1 2 3 4 e s s - R e v i e w C o p y - C a m b r i d g e U n i v e r s i t y P r e s s - R e v i e w C o p y R e v i e w C o p y - C a m b r i d g e U n i v e r s i t y P r e s s - R e v i e w C o p y R e v i e w C o p y - C a m b r i d g e U n i v e r s i t y P r e s s - R e v i e w C o p y R e v i e w C o p y - C a m b r i d g e U n i v e r s i t y Copyright Material - Review Only - Not for Redistribution
- 220. Unit 3: Algebra Cambridge IGCSE Mathematics 210 5 Find the equation of the line which passes through both points in each case. a A (2, 3) and B (4, 11) b A (4, 5) and B (8, −7) c A (−1, −3) and B (4, 6) d A (3, −5) and B (7, 12) 6 Write down the equation of a line that is parallel to: a y = −3x b y = 2x − 3 c y = x 2 + 4 d y = −x − 2 e x = 8 f y = −6 7 Which of the following lines are parallel to y = 1 2 x? a y = 1 2 1 x + b y = 2x c y x y x + = y x + = y x 1 + = + = y x + = y x + = 1 2 y x y x d 2y + x = −6 e y = 2x − 4 8 Find the equation of a line parallel to y = 2x + 4 which: a has a y-intercept of −2 b passes through the origin c passes through the point (0, −4) d has a y-intercept of 1 2 9 A graph has the equation 3y − 2x = 9. a Write down the equation of one other graph that is parallel to this one. b Write down the equation of one other graph that crosses the y-axis at the same point as this one. c Write down the equation of a line that passes through the y-axis at the same point as this one and which is parallel to the x-axis. Parallel and perpendicular lines You have already seen that parallel lines have the same gradient and that lines with the same gradient are parallel. Perpendicular lines meet at right angles. The product of the gradients is −1. So, m1 × m2 = −1, where m is the gradient of each line. The sketch shows two perpendicular graphs. 1 3 x y –4 –2 4 –6 2 6 8 10 –4 –2 0 2 4 6 –6 8 y x 2 y 3x 4 If the product of the gradients of two lines is equal to –1, it follows that the lines are perpendicular to each other. E E e s s - R e v i e w C o p y - C a m b r i d g e U n i v e r s i t y P r e s s - R e v i e w C o p y R e v i e w C o p y - C a m b r i d g e U n i v e r s i t y P r e s s - R e v i e w C o p y R e v i e w C o p y - C a m b r i d g e U n i v e r s i t y P r e s s - R e v i e w C o p y R e v i e w C o p y - C a m b r i d g e U n i v e r s i t y Copyright Material - Review Only - Not for Redistribution
- 221. Unit 3: Algebra 211 10 Straight lines and quadratic equations y = − 1 3 x + 2 has a gradient of − 1 3 y = 3x – 4 has a gradient of 3 The product of the gradients is − 1 3 × 3 = −1. Worked example 7 Given that y = 2 3 x + 2, determine the equation of the straight line that is: a perpendicular to this line and which passes through the origin b perpendicular to this line and which passes through the point (−3, 1). a y = mx + c m = − 3 2 The gradient is the negative reciprocal of 2 3 c = 0 The equation of the line is y = − 3 2 x. b y = − 3 2 x + c Using m = − 3 2 from part (a) above. x = −3 and y = 1 1 = − 3 2 (–3) + c Substitute the values of x and y for the given point to solve for c. 1 = 9 2 + c c = −3 1 2 y = − 3 2 x − 3 1 2 Exercise 10.5 1 A line perpendicular to y = x 5 + 3 passes through (1, 3). What is the equation of the line? 2 Show that the line through the points A(6, 0) and B(0, 12) is: a perpendicular to the line through P(8, 10) and Q(4, 8) b perpendicular to the line through M(–4, –8) and N(–1, – 13 2 ) 3 Given A(0, 0) and B(1, 3), find the equation of the line perpendicular to AB with a y-intercept of 5. 4 Find the equation of the following lines: a perpendicular to 2x – y – 1 = 0 and passing through (2, – 1 2 ) b perpendicular to 2x + 2y = 5 and passing through (1, –2) 5 Line A joins the points (6, 0) and (0, 12) and Line B joins the points (8, 10) and (4, 8). Determine the gradient of each line and state whether A is perpendicular to B. 6 Line MN joins points (7, 4) and (2, 5). Find the equation of AB, the perpendicular bisector of MN. 7 Show that points A(–3, 6), B(–12, –4) and C(8, –5) could not be the vertices of a rectangle ABCD. E e s s - R e v i e w C o p y - C a m b r i d g e U n i v e r s i t y P r e s s - R e v i e w C o p y R e v i e w C o p y - C a m b r i d g e U n i v e r s i t y P r e s s - R e v i e w C o p y R e v i e w C o p y - C a m b r i d g e U n i v e r s i t y P r e s s - R e v i e w C o p y R e v i e w C o p y - C a m b r i d g e U n i v e r s i t y Copyright Material - Review Only - Not for Redistribution
- 222. Unit 3: Algebra Cambridge IGCSE Mathematics 212 Intersection with the x–axis So far only the y-intercept has been found, either from the graph or from the equation. There is, of course, an x-intercept too. The following sketch shows the line with equation y = 3x − 6. x y –4 –10 –2 0 4 –6 2 –8 6 8 10 –4 –10 –6 –8 –2 2 4 6 8 10 y x = − 3 6 Notice that the line crosses the x-axis at the point where x = 2 and, importantly, y = 0. In fact, all points on the x-axis have y co-ordinate = 0. If you substitute y = 0 into the equation of the line: y = 3x − 6 0 = 3x − 6 (putting y = 0) 3x = 6 (add 6 to both sides) x = 2 (dividing both sides by 3) this is exactly the answer that you found from the graph. You can also find the y-intercept by putting x = 0. The following worked examples show calculations for finding both the x- and y-intercepts. You will need to understand this method when solving simultaneous equations in chapter 14. FAST FORWARD Worked example 8 Find the x- and y-intercepts for each of the following lines. Sketch the graph in each case. a y = 6x − 12 b y = −x + 3 c 2x + 5y = 20 a y = 6x − 12 x y y x x x y = ⇒ x y y x = ⇒ y x − = ⇒ = x ⇒ = 0 1 x y 0 1 x y x y = ⇒ x y 0 1 x y = ⇒ = − 0 12 0 6 y x 0 6 y x y x = ⇒ y x 0 6 y x = ⇒ 12 − = 12 − = 0 2 x y –4 –10 –12 –2 0 4 –6 2 –8 6 8 10 –2 –4 –6 –8 –10 2 4 6 8 10 y = 6x – 12 e s s - R e v i e w C o p y - C a m b r i d g e U n i v e r s i t y P r e s s - R e v i e w C o p y R e v i e w C o p y - C a m b r i d g e U n i v e r s i t y P r e s s - R e v i e w C o p y R e v i e w C o p y - C a m b r i d g e U n i v e r s i t y P r e s s - R e v i e w C o p y R e v i e w C o p y - C a m b r i d g e U n i v e r s i t y Copyright Material - Review Only - Not for Redistribution
- 223. Unit 3: Algebra 213 10 Straight lines and quadratic equations b y = −x + 3 x y y x x x y = ⇒ x y y x = ⇒ y x + = ⇒ = x ⇒ = 0 3 x y 0 3 x y x y = ⇒ x y 0 3 x y = ⇒ = 0 3 0 3 y x 0 3 y x y x = ⇒ y x 0 3 y x = ⇒ + = 0 3 + = 0 3 y x 0 3 y x 0 3 x y –4 –2 0 4 –6 2 –8 6 8 –4 –6 –8 –10 –2 2 4 6 8 10 10 –10 –12 y = –x + 3 c 2x + 5y = 20 x y y x y = ⇒ x y = ⇒ = y ⇒ = 0 5 x y 0 5 x y x y = ⇒ x y 0 5 x y = ⇒ 20 4 y x x y x = ⇒ y x = ⇒ = x ⇒ = 0 2 y x 0 2 y x y x = ⇒ y x 0 2 y x = ⇒ 20 10 x y –2 4 2 6 8 10 –4 –10 –6 –8 –2 0 2 4 6 8 10 –4 –6 –8 –10 –12 2x + 5y = 20 Exercise 10.6 1 Find the x- and y-intercepts for each of the following lines. Sketch the graph in each case. a y = −5x + 10 b y x = − = − 3 1 c y = −3x + 6 d y = 4x + 2 e y = 3x + 1 f y = −x + 2 g y = 2x − 3 h y x = − = − 2 3 1 i y x = − = − 4 2 j y x = + = + 2 5 1 k − + = 2 − + − + 4 y x l − = − y x 3 4 2 = − 4 2 = − x 4 2 = − = − 4 2 2 For each equation, find c, if the given point lies on the graph. a y = 3x + c (1, 5) b y = 6x + c (1, 2) c y = −2x + c (−3, −3) d y = 3 4 x + c (4, −5) e y = 1 2 x + c (−2, 3) f y = c − 1 2 x (−4, 5) g y = c + 4x (−1, −6) h 2 3 x + c = y (3, 4) e s s - R e v i e w C o p y - C a m b r i d g e U n i v e r s i t y P r e s s - R e v i e w C o p y R e v i e w C o p y - C a m b r i d g e U n i v e r s i t y P r e s s - R e v i e w C o p y R e v i e w C o p y - C a m b r i d g e U n i v e r s i t y P r e s s - R e v i e w C o p y R e v i e w C o p y - C a m b r i d g e U n i v e r s i t y Copyright Material - Review Only - Not for Redistribution
- 224. Unit 3: Algebra Cambridge IGCSE Mathematics 214 Finding the length of a straight line segment Although lines are infinitely long, usually just a part of a line is considered. Any section of a line joining two points is called a line segment. If you know the co-ordinates of the end points of a line segment you can use Pythagoras’ theorem to calculate the length of the line segment. Worked example 9 Find the distance between the points (1, 1) and (7, 9) 6 8 a 0 2 4 6 8 10 y x (1, 1) (7, 9) 2 4 6 8 10 a2 = 82 + 62 a2 = 64 + 36 a2 = 100 ∴a = 100 a = 10 units a2 = b2 + c2 (Pythagoras’ theorem) Work out each expression. Undo the square by taking the square root of both sides. Worked example 10 Given that A(3, 6) and B(7, 3), find the length of AB. 4 3 0 2 4 6 8 10 y x B(7, 3) C(3, 3) 0 2 4 6 8 10 A(3, 6) AB2 = AC2 + CB2 a2 = b2 + c2 (Pythagoras’ theorem) AB2 = 32 + 42 Work out each expression. = 9 + 16 = 25 ∴AB = 25 = 5 units E Pythagoras’ theorem is covered in more detail in chapter 11. Remember though, that in any right- angled triangle the square on the hypotenuse is equal to the sum of the squares on the other two sides. We write this as a2 + b2 = c2 . FAST FORWARD e s s - R e v i e w C o p y - C a m b r i d g e U n i v e r s i t y P r e s s - R e v i e w C o p y R e v i e w C o p y - C a m b r i d g e U n i v e r s i t y P r e s s - R e v i e w C o p y R e v i e w C o p y - C a m b r i d g e U n i v e r s i t y P r e s s - R e v i e w C o p y R e v i e w C o p y - C a m b r i d g e U n i v e r s i t y Copyright Material - Review Only - Not for Redistribution
- 225. Unit 3: Algebra 215 10 Straight lines and quadratic equations Midpoints It is possible to find the co-ordinates of the midpoint of the line segment (i.e. the point that is exactly halfway between the two original points). Consider the following line segment and the points A(3, 4) and B(5, 10). 2 4 6 8 10 0 1 2 3 4 5 B(5,10) A(3, 4) y x If you add both x co-ordinates and then divide by two you get ( ) ( ) 3 5 ( ) 2 8 2 4 ( ) 3 5 ( ) 3 5 = = = = . If you add both y co-ordinates and then divide by two you get ( ) ( ) 4 1 ( ) ( ) ( ) 2 14 2 7 ( ) 4 1 ( ) 4 1 = = = = . This gives a new point with co-ordinates (4, 7). This point is exactly half way between A and B. Exercise 10.7 1 Find the length and the co-ordinates of the midpoint of the line segment joining each pair of points. a (3, 6) and (9, 12) b (4, 10) and (2, 6) c (8, 3) and (4, 7) d (5, 8) and (4, 11) e (4, 7) and (1, 3) f (12, 3) and (11, 4) g (−1, 2) and (3, 5) h (4, −1) and (5, 5) i (−2, −4) and (−3, 7) 2 Use the graph to find the length and the midpoint of each line segment. 2 4 6 8 –8 –6 –4 –2 y x 0 2 4 6 –8 –6 –4 –2 8 A B E D F O P L N M K I J C H G In chapter 12 you will learn about the mean of two or more numbers. The midpoint uses the mean of the x co-ordinates and the mean of the y co-ordinates. FAST FORWARD Check that you remember how to deal with negative numbers when adding. REWIND E e s s - R e v i e w C o p y - C a m b r i d g e U n i v e r s i t y P r e s s - R e v i e w C o p y R e v i e w C o p y - C a m b r i d g e U n i v e r s i t y P r e s s - R e v i e w C o p y R e v i e w C o p y - C a m b r i d g e U n i v e r s i t y P r e s s - R e v i e w C o p y R e v i e w C o p y - C a m b r i d g e U n i v e r s i t y Copyright Material - Review Only - Not for Redistribution
- 226. Unit 3: Algebra Cambridge IGCSE Mathematics 216 3 Find the distance from the origin to point (−3, −5). 4 Which of the points A(5, 6) or B(5, 3) is closer to point C(−3, 2)? 5 Which is further from the origin, A(4, 2) or B(−3, −4)? 6 Triangle ABC has its vertices at points A(0, 0), B(4, −5) and C(−3, −3). Find the length of each side. 7 The midpoint of the line segment joining (10, a) and (4, 3) is (7, 5). What is the value of a? 8 The midpoint of line segment DE is (−4, 3). If point D has the co-ordinates (−2, 8), what are the co-ordinates of E? 10.2 Quadratic (and other) expressions The diagram shows a rectangle of length (x + 3) cm and width (x + 5) cm that has been divided into smaller rectangles. The area of the whole rectangle is equal to the sum of the smaller areas, so the area of whole rectangle = (x + 3) × (x + 5). The sum of smaller rectangle areas: x x x x 2 2 3 5 x x 3 5 x x 2 2 3 5 2 2 15 x x 15 x x 2 2 15 2 2 8 1 x 8 15 + + + x x + + + x x x x + + + x x 2 2 + + + 2 2 3 5 + + + 3 5 x x 3 5 x x + + + 3 5 2 2 3 5 2 2 + + + 2 2 3 5 = + x x = + x x 2 2 = + 8 1 8 1 . This means that ( ) ( ) ( ) x x ( ) x x ( ) + × ( ) ( ) x x + × ( ) x x + = ( ) + = + + x x + + x x 3 5 ( ) 3 5 ( ) ( ) 3 5 ( ) x x 3 5 ( ) x x 3 5 ( ) x x ( ) x x ( ) 3 5 x x + × 3 5 ( ) + × 3 5 ( ) + × x x + × x x 3 5 + × ( ) x x + × x x 3 5 ( ) x x ( ) + × x x ( ) + = ( ) 3 5 ( ) + = 8 1 x x 8 1 x x + + 8 1 + + x x + + 8 1 x x + + 5 2 and this is true for all values of x. Notice what happens if you multiply every term in the second bracket by every term in the first: 5x 15 x 3 + + 5 ) ) ( (x x 3 x2 + + 5 ) ) ( (x x 3 + + 5 ) ) ( (x x 3 + + 5 ) ) ( (x x 3 Notice that the four terms in boxes are exactly the same as the four smaller areas that were calculated before. Another way to show this calculation is to use a grid: x x 3 5 5x 3x 15 x2 You will notice that this is almost the same as the areas method above but it can also be used when the constants are negative, as you will see in the worked examples shortly. When you remove the brackets and re-write the algebraic expression you are expanding or multiplying out the brackets. The resulting algebraic expression contains an x2 term, an x term and a constant term. This is called a quadratic expression. The following worked example shows these two methods and a third method for expanding pairs of brackets. You should try each method when working through the next exercise and decide which you find easiest, though you will begin to notice that they are all, in fact, the same. x x 3 5 5x 3x 15 x2 E e s s - R e v i e w C o p y - C a m b r i d g e U n i v e r s i t y P r e s s - R e v i e w C o p y R e v i e w C o p y - C a m b r i d g e U n i v e r s i t y P r e s s - R e v i e w C o p y R e v i e w C o p y - C a m b r i d g e U n i v e r s i t y P r e s s - R e v i e w C o p y R e v i e w C o p y - C a m b r i d g e U n i v e r s i t y Copyright Material - Review Only - Not for Redistribution
- 227. Unit 3: Algebra 217 10 Straight lines and quadratic equations Worked example 11 Expand and simplify: a (x + 2)(x + 9) b (x − 7)(x + 6) c (2x − 1)(x + 9) a x x + + 2 9 x x x x x 2 x x x x 2 9 2 x x 9 2 x x 18 11 x x 11 x x 18 + + x x + + x x 9 2 + + 9 2 x x 9 2 x x + + 9 2 + = + x x = + x x 2 = + x x x x = + + In this version of the method you will notice that the arrows have not been included and the multiplication ‘arcs’ have been arranged so that they are symmetrical and easier to remember. b x x –7 +6 6x –7x –42 x2 x x x x x 2 x x x x 2 x x x x 7 6 x x 7 6 x x 42 42 − + x x − + x x 7 6 − + 7 6 x x 7 6 x x − + 7 6 − = − x x = − x x − The grid method with a negative value. c (2x − 1)(x + 9) Firsts: 2 2 2 2 2 x x 2 2x 2 2 × = 2 2 2 2 x x 2 2 × = 2 2 x x Outsides: 2x × 9 = 18x Insides: −1 × x = − x Lasts: −1 × 9 = −9 2 18 9 17 9 2 2 1 2 1 2 x x 2 1 x x 2 18 9 x x 8 9 2 1 2 1 x x 8 9 8 9 x x 17 x x + − 2 1 + − 2 18 9 + − 8 9 x x + − 2 1 x x + − 2 1 x x 8 9 x x 8 9 + − x x 8 9 8 9 = + 2 = + x x = + x x 2 x x = + x x − A third method that you can remember using the mnemonic ‘FOIL’ which stands for First, Outside, Inside, Last. This means that you multiply the first term in each bracket together then the ‘outside’ pair together (i.e. the first term and last term), the ‘inside’ pair together (i.e. the second term and third term) and the ‘last’ pair together (i.e. the second term in each bracket). You need to choose which method works best for you but ensure that you show all the appropriate stages of working clearly. The product of more than two sets of brackets You can multiply in steps to expand three (or more) sets of brackets. Your answer might contain terms with powers of 3 (cubic expressions). Worked example 12 Expand and simplify (3x + 2)(2x + 1)(x − 1) (3x + 2)(2x + 1)(x − 1) = (6x2 + 4x + 3x + 2)(x − 1) = (6x2 + 7x + 2)(x − 1) Expand the first two brackets. Collect like terms. = 6x3 + 7x2 + 2x − 6x2 − 7x − 2 = 6x3 + x2 − 5x − 2 Multiply each term in the first bracket by each term in the second. Collect like terms to simplify. E Quadratic expressions and formulae are useful for modelling situations that involve movement, including acceleration, stopping distances, velocity and distance travelled (displacement). These situations are studied in Physics but they also have real life applications in situations such as road or plane accident investigations. LINK e s s - R e v i e w C o p y - C a m b r i d g e U n i v e r s i t y P r e s s - R e v i e w C o p y R e v i e w C o p y - C a m b r i d g e U n i v e r s i t y P r e s s - R e v i e w C o p y R e v i e w C o p y - C a m b r i d g e U n i v e r s i t y P r e s s - R e v i e w C o p y R e v i e w C o p y - C a m b r i d g e U n i v e r s i t y Copyright Material - Review Only - Not for Redistribution
- 228. Unit 3: Algebra Cambridge IGCSE Mathematics 218 Exercise 10.8 1 Expand and simplify each of the following. a (x + 3)(x + 1) b (x + 6)(x + 4) c (x + 9)(x + 10) d (x + 3)(x + 12) e (x + 1)(x + 1) f (x + 5)(x + 4) g (x + 4)(x − 7) h (x − 3)(x + 8) i (x − 1)(x + 1) j (x − 9)(x + 8) k (x − 6)(x − 7) l (x −13)(x + 4) m (y + 3)(y − 14) n (z + 8)(z − 8) o (t + 17)(t − 4) p (h − 3)(h − 3) q ( )( ) g g ( ) g g ( )( ) g g ( ) − + ( ) − + ( ) − + ( ) g g − + ( ) g g − + ( ) g g ( ) g g − + g g ( ) g g ( ) − + g g 1 ( ) ( ) ( ) − + ( ) − + ( ) g g − + g g ( ) g g ( ) − + g g g g g g ( ) g g ( ) g g ( ) g g − + g g ( ) g g ( ) − + g g ( ) ( ) r ( )( ) ( ) d d ( ) d d ( )( ) d d ( ) ( ) + − ( ) d d + − ( ) d d + − ( ) d d ( ) d d + − d d ( ) d d ( ) + − d d 3 d d d d ( ) d d ( ) d d ( ) d d + − d d ( ) d d ( ) + − d d 2 ( ) ( ) ( ) d d ( ) d d ( ) d d + − d d ( ) d d ( ) + − d d 3 ( ) ( ) 4 ( ) ( ) 2 Find the following products. a (4 − x)(3 − x) b (3 − 2x)(1 + 3x) c (3m − 7)(2m − 1) d (2x + 1)(3 − 4x) e (4a − 2b)(2a + b) f (2m − n)(−3n − 4m) g x x x x + x x x x x x x x x x x x x x x x x x x x + x x x x x x x x x x x x x x x x 1 2 1 4 h 2 1 3 1 2 x x x x + x x x x x x x x x x x x x x x x x x x x − x x x x x x x x x x x x x x x x i 2 2 ( ) 2 4 ( ) 2 2 ( ) 2 2 2 4 2 2 2 4 ( ) 2 2 x y ( ) 2 4 x y 2 4 ( ) x y 2 4 x y 2 4 x y ( ) x y 2 4 x y ( ) 2 2 ( ) 2 2 y x ( ) y x y x ( ) j (7 − 9b)(4b + 6) k x y + x y x y ( )( ) y x ( ) ( ) 2 4 ( ) y x ( ) 2 4 y x ( ) y x y x ( ) 2 4 y x ( ) ( ) 2 3 ( ) y x ( ) 2 3 ( ) ( ) 2 4 ( ) 2 3 ( ) 2 4 y x ( ) 2 4 y x ( ) 2 3 ( ) y x 2 4 ( ) l (3x − 3)(5 + 2x) 3 Expand and simplify each of the following. a (2x + 3)(x + 3) b (3y + 7)(y + 1) c (7z + 1)(z + 2) d (t + 5)(4t − 3) e (2w − 7)(w − 8) f (4g − 1)(4g + 1) g (8x − 1)(9x + 4) h (20c − 3)(18c − 4) i (2m − 4)(3 − m) 4 Expand and simplify each of the following. a ( )( ) ( ) 3 1 ( )( ) 2 3 ( ) 2 ( ) ( ) ( ) 3 1 ( ) 3 1 x x ( ) x x ( ) x x ( ) 3 1 ( ) x x ( ) 3 1 ( ) 2 3 ( ) x x ( ) 2 3 + + ( ) + + ( ) + + ( ) 3 1 ( ) + + ( ) 3 1 ( ) 2 3 ( ) + + ( ) 2 3 x x + + ( ) x x + + x x ( ) x x + + x x ( ) 3 1 ( ) x x 3 1 + + ( ) 3 1 ( ) x x 3 1 ( ) 2 3 ( ) x x ( ) 2 3 + + 2 3 ( ) x x 2 3 b ( )( ) ( ) 5 1 ( )( ) 3 3 ( ) 2 2 ( ) 2 2 ( )( ) 2 2 ( ) ( ) 5 1 ( ) 2 2 ( ) 5 1 ( ) 3 3 ( ) 2 2 ( ) 3 3 x x ( ) x x ( ) x x ( ) 5 1 ( ) x x ( ) 5 1 ( ) 3 3 ( ) x x ( ) 3 3 ( ) 3 3 − − ( ) 3 3 x x − − ( ) x x − − x x ( ) x x − − x x ( ) 5 1 ( ) x x 5 1 − − ( ) 5 1 ( ) x x 5 1 ( ) 3 3 ( ) x x ( ) 3 3 − − 3 3 ( ) x x 3 3 c ( )( ) 3 2 ( ) 3 2 ( )( ) 3 2 ( ) ( ) ( ) 2 ( ) ( ) ( ) 3 2 ( ) 3 2 x y ( ) x y ( ) ( ) 3 2 x y ( ) 3 2x y ( ) x y ( ) ( ) ( ) x y ( ) − + ( ) 3 2 − + ( ) 3 2 − + 3 2 ( ) 3 2 ( ) − + 3 2 ( ) 3 2 x y ( ) 3 2 − + ( ) 3 2 ( ) x y 3 2 ( ) x y ( ) − + ( ) x y 5 Expand and simplify. a (5x + 2)(3x − 3)(x + 2) b (x − 5)(x − 5)(x + 5) c (4x − 1)(x + 1)(3x − 2) d (x + 4)(2x + 4)(2x + 4) e (2x − 3)(3x − 2)(2x − 1) f (3x − 2)2 (2x − 1) g (x + 2)3 h (2x − 2)3 i (x2 y2 + x2 )(xy + x)(xy − x) j 1 3 + 2 1 9 4 1 3 2 2 x x 1 x x x x x x x x x x x x x x x x x − x x x x x x x x x x x x − 6 The volume of a cuboid can be found using the formula V = lbh, where l is the length, b is the breadth and h is the height. A cuboid has length 2x + 1 2 m, breadth (x − 2) m and height (x − 2) m. a Write an expression for the volume of the cuboid in factor form. b Expand the expression. c Determine the volume of the cuboid when x = 2.2 m. You will need to remember how to multiply fractions. This was covered in chapter 5. REWIND Refer to chapter 2 to remind you how to multiply different powers of the same number together. REWIND E e s s - R e v i e w C o p y - C a m b r i d g e U n i v e r s i t y P r e s s - R e v i e w C o p y R e v i e w C o p y - C a m b r i d g e U n i v e r s i t y P r e s s - R e v i e w C o p y R e v i e w C o p y - C a m b r i d g e U n i v e r s i t y P r e s s - R e v i e w C o p y R e v i e w C o p y - C a m b r i d g e U n i v e r s i t y Copyright Material - Review Only - Not for Redistribution
- 229. Unit 3: Algebra 219 10 Straight lines and quadratic equations Squaring a binomial (x + y)2 means (x + y)(x + y) To find the product, you can use the method you learned earlier. (x + y)(x + y) = x2 + xy + xy + y2 = x2 + 2xy + y2 However, if you think about this, you should be able to solve these kinds of expansions by inspection. Look at the answer. Can you see that: • the first term is the square of the first term (x2 ) • the middle term is twice the product of the middle terms (2xy) • the last term is the square of the last term (y2 )? Exercise 10.9 1 Find the square of each binomial. Try to do this by inspection first and then check your answers. a (x − y)2 b a b a b a b ( )2 c 2 3 2 x y 2 3 x y 2 3 2 3 2 3 2 3 x y 2 3 x y ( ) d 3 2 2 x y 3 2 x y 3 2 3 2 x y 3 2 x y ( ) e x y + x y x y ( ) 2 x y x y 2 f ( ) y x ( ) y x y x ( ) ( ) ( ) y x ( ) y x ( ) ( ) ( )2 g 2 ( ) x y ( ) 2 2 ( ) x y x y ( ) h 2 ( ) 2 ( ) 3 ( ) + ( ) ( ) ( ) i ( ) − − ( ) ( ) 2 4 ( ) − − ( ) 2 4 − − ( ) ( ) ( )2 ( ) x y ( ) ( ) 2 4 ( ) x y ( ) 2 4 − − ( ) 2 4 ( ) x y − − ( ) − − 2 4 ( ) j 1 2 1 4 2 x y 4 x y − k 3 4 2 2 x y − l a b a b a b a b 1 a b a b 2 2 m ( ) − − ( ) ( ) ab ( ) − − ( ) ab − − ( ) ( ) ( ) ( ) ( )2 n 2 ( ) 3 1 ( ) 2 ( ) 3 1 3 1 ( ) x y ( ) 3 1 x y 3 1 ( ) x y 3 1 3 1 ( ) o 2 3 4 2 x y + p [ ] − − [ ] ( ) [ ] − − ( ) − − [ ] ( ) ( ) [ ] ( ) [ ] − − ( ) [ ] ( ) − − ( ) − − [ ] ( ) ( ) [ ] ( ) [ ]2 2 Simplify. a x x ( ) x x ( ) x x x x x x ( ) ( ) x x ( ) x x 2 4 x x 2 4 ( ) 2 4 ( ) x x ( ) x x 2 4 x x ( ) x x − − x x 2 4 − − ( ) 2 4 ( ) x x ( ) x x 2 4 ( ) − − ( ) 2 4 ( ) x x − − ( ) x x − − 2 4 − − x x ( ) − − 2 2 ( ) 2 2 2 4 2 2 2 4 ( ) 2 4 ( ) 2 2 2 4 b (x + 2)(x − 2) − (3 − x)(5 + x) c y x x y y x + y x y x ( ) + − x y + − x y ( ) − + y x − + y x ( ) 2 2 + − 2 2 + − 2 2 y x 2 2 y x) 2 2 + − 2 2 ( 2 2 + − + − 2 2 2 y x y x 2 2 2 2 2 d 1 2 3 2 x ( ) 3 2 ( ) 3 2 3 2 ( ) 3 2 3 2 ( ) + e 3(x + 2)(2x + 0.6) f ( ) ( )( ) ( ) 2 2 ( ) 2 2 ( )( ) 2 2 ( ) ( ) 2 2 4 2 x y ( ) x y ( ) ( ) 2 2 x y ( ) 2 2x y ( ) x y ( ) x y ( ) − + ( ) 2 2 − + ( ) 2 2 − + 2 2 ( ) 2 2 ( ) − + 2 2 ( ) 2 2 − + 2 2 ( ) 2 2 x y ( ) 2 2 − + ( ) 2 2 ( ) x y 2 2 ( ) x y ( ) − + ( ) x y − − 4 − − x y − − x y − − ( − − − − ) g ( ) x x ( ) x x + ( ) x x x x ( )( )− − ( ) x ( ) 4 5 x x 4 5 ( ) 4 5 ( ) x x ( ) x x 4 5 x x ( )( ) 4 5 ( ) x x ( ) x x 4 5 ( ) − ( ) 4 5 ( ) 2 1 − − 2 1 − − ( ) 2 1 ( ) x ( ) 2 1 ( ) − − ( ) − − 2 1 ( ) x − − ( ) − − 2 1 − − ( ) − − 2 h 2 2 2 4 2 2 2 2 2 2 2 2 2 4 2 2 x y 2 2 x y 2 2 x y 2 2 x y 2 2 x y 2 4 x y 2 4 x y 2 4 x y 2 4 2 2 x y 2 2 x y ( ) 2 2 2 2 2 2 + − 2 2 2 2 x y 2 2 + − 2 2 x y ( 2 2 2 2 2 2 2 2 2 2 2 2 2 2 2 2 2 2 + − 2 2 + − ) 2 2 2 2 + x y x y ( 2 2 2 2 ) 2 4 2 4 2 2 2 2 2 4 2 2 2 4 2 2 2 4 − + 2 4 2 4 x y 2 4 − + 2 4 x y 2 4 − + 2 4 2 4 2 4 2 2 2 2 2 4 2 2 2 4 2 2 ( 2 4 − + 2 4 − + ) 2 2 2 2 i − + ( ) − − ( ) − − ( ) − − ( ) 2 1 − + 2 1 − + ( ) 2 1 ( ) − + ( ) − + 2 1 ( ) 5 3 ( ) 5 3 ( )( ) 5 3 ( ) 2 x x ( ) x x ( ) − + 2 1 x x − + 2 1 − + ( ) − + 2 1 ( ) x x − + ( ) − + 2 1 ( ) ( ) x x ( ) ( ) x x ( ) − − ( ) x x − − ( ) 5 3 x x ( ) 5 3 ( ) x x 5 3 ( ) 5 3 ( ) x x 5 3 − ( ) 5 3 ( ) x x ( ) 5 3 ( ) j 5 5 2 ( ) 3 2 ( ) 3 2 3 2 ( ) − + 5 5 − + ( ) 5 5 ( ) 5 5 2 ( ) − + ( ) 5 5 − + ( ) 5 5 − + x x 5 5 x x ( ) x x ( ) − + x x 5 5 − + x x − + ( ) x x ( ) 5 5 ( ) 5 5 x x ( ) − + ( ) x x − + ( ) 5 5 − + ( ) 5 5 − + x x − + 5 5 ( ) − + 3 Evaluate each expression when x = 4. a x ( ) x x ( ) x x + ( ) x x x x ( )( )− 7 7 x x 7 7 ( ) 7 7 ( ) x x ( ) x x 7 7 x x ( )( ) 7 7 ( ) x x ( ) x x 7 7 ( ) − ( ) 7 7 ( ) 2 b x x 2 3 3 x x − − x x ( ) x x ( ) x x 3 3 ( ) 3 3 − − ( ) x x − − ( ) x x − − ( ) 3 3 ( ) 3 3 x 3 3 ( ) 3 3 3 3 3 3 ( ) c 2 ( ) 3 2 ( ) 3 2 3 2 ( ) − + ( ) 2 3 ( ) − + ( ) − + 2 3 − + 2 3 ( ) − + ( ) 2 3 ( ) 2 3 2 3 ( ) x x ( ) x x ( ) − + x x ( ) x x 2 3 ( ) x x 2 3 ( ) − + ( ) − + x x ( ) 2 3 − + ( ) − + x x 2 3 − + 2 3 ( ) − + 2 3 ( ) 2 3 ( ) d ( ) x ( ) ( ) + ( ) ( ) ( )2 e 3 4 x x 3 4 ( ) x x ( ) x x 2 ( ) 3 4 ( ) 3 4 x x 3 4 x x ( ) x x 3 4 + ( ) x x x x ( )( ) 3 4 ( ) 3 4 x x 3 4 ( ) x x 3 4 3 4 3 4 ( ) f 4 1 2 x x ( ) 2 3 ( ) x x ( ) x x 2 3 x x 2 3 ( ) x x 2 3 2 3 ( ) 2 3 x x 2 3 x x ( ) x x 2 3 x x − + 4 1 − + x x − + x x 4 1 x x − + x x ( ) 4 1 ( ) 4 1 x x ( ) x x 4 1 − + 4 1 ( ) 4 1 − + 4 1 x x 4 1 − + x x ( ) 4 1 x x 4 1 − + x x ( ) 2 3 ( ) x ( ) 2 3 2 3 ( ) Factorising quadratic expressions Look again at the expansion of (x + 2)(x + 9), which gave x x 2 11 18 + + x x + + x x 11 + + x x 11 x x + + 11 : x x x x + ( ) + ( ) = + + 2 9 11 18 2 2 × 9 = 18 2 + 9 = 11 Here the two numbers add to give the coefficient of x in the final expression and the two numbers multiply to give the constant term. E e s s - R e v i e w C o p y - C a m b r i d g e U n i v e r s i t y P r e s s - R e v i e w C o p y R e v i e w C o p y - C a m b r i d g e U n i v e r s i t y P r e s s - R e v i e w C o p y R e v i e w C o p y - C a m b r i d g e U n i v e r s i t y P r e s s - R e v i e w C o p y R e v i e w C o p y - C a m b r i d g e U n i v e r s i t y Copyright Material - Review Only - Not for Redistribution
- 230. Unit 3: Algebra Cambridge IGCSE Mathematics 220 This works whenever there is just one x in each bracket. Worked example 13 Expand and simplify: a (x + 6)(x + 12) b (x + 4)(x − 13) a (x + 6)(x + 12) = x2 + 18x + 72 6 + 12 = 18 and 6 × 12 = 72 so this gives 18x and 72. b (x + 4)(x − 13) = x2 − 9x − 52 4 + −13 = −9 and 4 × −13 = −52 so this gives −9x and −52. If you use the method in worked example 11 and work backwards you can see how to put a quadratic expression back into brackets. Note that the coefficient of x2 in the quadratic expression must be 1 for this to work. Consider the expression x2 + 18x + 72 and suppose that you want to write it in the form (x + a)(x + b). From the worked example you know that a + b = 18 and a × b = 72. Now 72 = 1 × 72 but these two numbers don’t add up to give 18. However, 72 = 6 × 12 and 6 + 12 = 18. So, x2 + 18x + 72 = (x + 6)(x + 12). The process of putting a quadratic expression back into brackets like this is called factorisation. Worked example 14 Factorise completely: a x x 2 x x x x 7 1 x x 7 1 x x 2 + + x x + + x x 7 1 + + 7 1 x x 7 1 x x + + 7 1 b x x 2 x x x x 6 1 x x 6 1 x x 6 x x − − x x 6 1 − − 6 1 x x 6 1 x x − − 6 1 c x x 2 x x x x 8 1 x x 8 1 x x 5 − + x x − + x x 8 1 − + 8 1 x x 8 1 x x − + 8 1 a 12 = 1 × 12 12 = 2 × 6 12 = 3 × 4 and 3 + 4 = 7 So, x x x x 2 x x x x 7 1 x x 7 1 x x 2 3 + + x x + + x x 7 1 + + 7 1 x x 7 1 x x + + 7 12 3 = + 2 3 ( ) x x ( ) x x 2 3 ( ) 2 3 x x 2 3 x x ( ) 2 3 2 3 = + 2 3 ( ) 2 3 = + x x 2 3 = + x x 2 3 ( ) 2 3 x x = + 2 3 ( ) x x ( ) x x 4 ( ) + ( ) You need two numbers that multiply to give 12 and add to give 7. These don’t add to give 7. These don’t add to give 7. These multiply to give 12 and add to give 7. b −8 × 2 = −16 and −8 + 2 = −6 So, x x x x 2 x x x x 6 1 x x 6 1 x x 6 8 x x − − x x 6 1 − − 6 1 x x 6 1 x x − − 6 16 8 = − 6 8 ( ) x x ( ) x x 6 8 ( ) 6 8 x x 6 8 x x ( ) 6 8 6 8 = − ( ) 6 8 = − x x 6 8 = − x x 6 8 ( ) 6 8 x x = − 6 8 ( ) x x ( ) x x 2 ( ) + ( ). You need two numbers that multiply to give −16 and add to give −6. Since they multiply to give a negative answer, one of the numbers must be negative and the other must be positive. (Since they add to give a negative, the larger of the two numbers must be negative.) c −5 × −3 = 15 and −5 + −3 = −8 So, x x x x 2 x x x x 8 1 x x 8 1 x x 5 3 x x x x + = − 8 1 + = − 8 15 3 + = − 5 3 ( ) x x ( ) x x 5 3 ( ) 5 3 x x 5 3 x x ( ) 5 3 5 3 + = − ( ) 5 3 + = − x x 5 3 + = − x x 5 3 ( ) 5 3 x x + = − 5 3 ( ) x x ( ) x x 5 ( ) − ( ). You need two numbers that multiply to give 15 and add to give −8. Since they multiply to give a positive value but add to give a negative then both must be negative. List the factor pairs of 12. (If you spot which pair of numbers works straight away then you don’t need to write out all the other factor pairs.) 1 × 72 and 6 × 12 are the factor pairs of 72. You learned about factor pairs in chapter 1. REWIND E e s s - R e v i e w C o p y - C a m b r i d g e U n i v e r s i t y P r e s s - R e v i e w C o p y R e v i e w C o p y - C a m b r i d g e U n i v e r s i t y P r e s s - R e v i e w C o p y R e v i e w C o p y - C a m b r i d g e U n i v e r s i t y P r e s s - R e v i e w C o p y R e v i e w C o p y - C a m b r i d g e U n i v e r s i t y Copyright Material - Review Only - Not for Redistribution
- 231. Unit 3: Algebra 221 10 Straight lines and quadratic equations Exercise 10.10 1 Factorise each of the following. a x x 2 14 24 + + x x + + x x 14 + + x x 14 x x + + 14 b x x 2 3 2 x x 3 2 x x + + x x + + x x 3 2 + + 3 2 x x 3 2 x x + + 3 2 c x x 2 7 1 x x 7 1 x x 2 + + x x + + x x 7 1 + + 7 1 x x 7 1 x x + + 7 1 d x x 2 12 35 + + x x + + x x 12 + + x x 12 x x + + 12 e x2 12 27 + + 12 + + f x x 2 7 6 x x 7 6 x x + + x x + + x x 7 6 + + 7 6 x x 7 6 x x + + 7 6 g x x 2 11 30 + + x x + + x x 11 + + x x 11 x x + + 11 h x x 2 10 x x 10 x x 16 + + x x + + x x 10 + + x x 10 x x + + 10 i x x 2 11 10 + + x x + + x x 11 + + x x 11 x x + + 11 j x x 2 8 7 x x 8 7 x x + + x x + + x x 8 7 + + 8 7 x x 8 7 x x + + 8 7 k x x 2 24 80 + + x x + + x x 24 + + x x 24 x x + + 24 l x x 2 13 x x 13 x x 42 + + x x + + x x 13 + + x x 13 x x + + 13 2 Factorise each of the following. a x x 2 8 1 x x 8 1 x x 2 − + x x − + x x 8 1 − + 8 1 x x 8 1 x x − + 8 1 b x x 2 9 2 x x 9 2 x x 0 − + x x − + x x 9 2 − + 9 2 x x 9 2 x x − + 9 2 c x x 2 7 1 x x 7 1 x x 2 − + x x − + x x 7 1 − + 7 1 x x 7 1 x x − + 7 1 d x x 2 6 8 x x 6 8 x x − + x x − + x x 6 8 − + 6 8 x x 6 8 x x − + 6 8 e x x 2 12 32 − + x x − + x x 12 − + x x 12 x x − + 12 f x x 2 14 49 − + x x − + x x 14 − + x x 14 x x − + 14 g x x 2 8 2 x x 8 2 x x 0 x x − − x x 8 2 − − 8 2 x x 8 2 x x − − 8 2 h x x 2 7 1 x x 7 1 x x 8 x x − − x x 7 1 − − 7 1 x x 7 1 x x − − 7 1 i x x 2 4 3 x x 4 3 x x 2 x x − − x x 4 3 − − 4 3 x x 4 3 x x − − 4 3 k x x 2 6 + − x x + − x x l x x 2 8 3 x x 8 3 x x 3 + − x x + − x x 8 3 + − 8 3 x x 8 3 x x + − 8 3 m x x 2 10 x x 10 x x 24 + − x x + − x x 10 + − x x 10 x x + − 10 3 Factorise each of the following. a y y 2 7 y y y y 170 + − y y + − y y 7 + − y y y y + − b p p 2 p p p p 8 8 p p 8 8 p p 4 + − p p + − p p 8 8 + − 8 8 p p 8 8 p p + − 8 8 c w w 2 24 144 − + w w − + w w 24 − + w w 24 w w − + 24 d t t 2 t t t t 16 t t 16 t t 36 + − t t + − t t t t 16 t t + − 16 e v v 2 20 v v 20 v v 75 + + v v + + v v 20 + + v v 20 v v + + 20 f x2 100 − Difference between two squares The very last question in the previous exercise was a special kind of quadratic. To factorise x2 100 − you must notice that x x x 2 2 100 x x 100 x x 2 2 100 2 2 x x 100 x x 0 100 x x − = x x x x 100 x x − = 100 + − x + − 0 + − . Now, proceeding as in worked example 12: 10 × −10 = −100 and −10 + 10 = 0 so, x x x x 2 0 x x x x 100 + − x x + − x x 0 + − x x x x + − = − ( ) x x ( ) x x 10 ( ) x x 10 x x ( ) 10 = − ( ) = − x x = − x x ( ) = − ( ) x x ( ) x x 10 ( ) + ( ). Now think about a more general case in which you try to factorise x a 2 2 x a x a . Notice that x a x x a 2 2 2 2 x x x x 2 2 2 2 − = x a − = x a + − x x + − x x 2 2 + − 2 2 0 + − x x x x + − 2 2 2 2 + − . Since a a a × = a a × = a a − − × = − − a a × = − − a a × = and a + −a = 0, this leads to: x a 2 2 − = x a − = x a − + ( ) x a ( ) − + ( ) − + x a − + x a ( ) − + ( ) x a ( ) − + ( ) − + x a − + x a ( ) − + . You must remember this special case. This kind of expression is called a difference between two squares. When looking for your pair of integers, think about the factors of the constant term first. Then choose the pair which adds up to the x term in the right way. Worked example 15 Factorise the following using the difference between two squares: a x2 49 − b x2 1 4 − c 16 2 2 25 2 2 y w 25 y w 2 2 y w 2 2 25 2 2 y w 2 2 y w y w a 49 = 72 x x 2 2 x x 2 2 x x 2 49 x x 49 x x 2 2 49 2 2 x x 2 2 49 x x 2 2 7 7 7 x x 7 7 x x − = x x x x 49 x x − = 49 − = − ( ) x x ( ) x x 7 7 ( ) 7 7 x x 7 7 x x ( ) x x 7 7 = − ( ) = − x x = − x x ( ) = − ( ) 7 7 ( ) 7 7 x x 7 7 ( ) x x 7 7 7 7 7 7 ( ) Use the formula for the difference between two squares: x2 − a2 = (x − a)(x + a). You know that 49 7 = so you can write 49 as 72 . This gives you a2 . Substitute 72 into the formula. b 1 2 1 4 2 = x x x x 2 2 x x 2 2 x x 2 1 2 2 2 2 4 x x x x 1 2 1 2 1 2 x x − = x x x x − = − = − ( ) x x ( ) x x x x ( ) 1 ( ) 2 ( ) x x x x ( ) = − ( ) = − x x = − x x ( ) = − ( ) ( ) x x ( ) x x 1 ( ) 2 ( ) + ( ) 1 4 is 1 2 so you can rewrite 1 4 1 2 as 2 and substitute it into the formula for the difference between two squares. E e s s - R e v i e w C o p y - C a m b r i d g e U n i v e r s i t y P r e s s - R e v i e w C o p y R e v i e w C o p y - C a m b r i d g e U n i v e r s i t y P r e s s - R e v i e w C o p y R e v i e w C o p y - C a m b r i d g e U n i v e r s i t y P r e s s - R e v i e w C o p y R e v i e w C o p y - C a m b r i d g e U n i v e r s i t y Copyright Material - Review Only - Not for Redistribution
- 232. Unit 3: Algebra Cambridge IGCSE Mathematics 222 Worked example 16 Solve each of the following equations for x. a x x 2 x x x x 3 0 x x 3 0 x x x x − = x x 3 0 − = 3 0 x x 3 0 x x − = 3 0 b x x 2 x x x x 7 1 x x 7 1 x x 2 0 − + x x − + x x 7 1 − + 7 1 x x 7 1 x x − + 7 12 0 2 0 c x x 2 x x x x 6 4 x x 6 4 x x 12 + − x x + − x x 6 4 + − 6 4 x x 6 4 x x + − 6 4 = d x x 2 x x x x 8 1 x x 8 1 x x 6 0 − + x x − + x x 8 1 − + 8 1 x x 8 1 x x − + 8 16 0 6 0 a Notice that both terms of the left-hand side are multiples of x so you can use common factorisation. x x x x 2 x x x x 3 0 x x 3 0 x x 3 0 x x − = x x 3 0 − = 3 0 x x 3 0 x x − = 3 0 3 0 − = 3 0 ( ) x x ( ) x x 3 0 ( ) 3 0 − = ( ) 3 0 − = ( ) 3 0 − = Now the key point: If two or more quantities multiply to give zero, then at least one of the quantities must be zero. So either x = 0 or x − 3 = 0 ⇒ x = 3. Check: 02 − 3 × 0 = 0 (this works). 32 − 3 × 3 = 9 − 9 = 0 (this also works). In fact both x = 0 and x = 3 are solutions. b Use the factorisation method of worked example 12 on the left-hand side of the equation. x x 2 x x x x 7 1 x x 7 12 0 4 3 x x 4 3 0 − + x x − + x x 7 1 − + 7 1 x x 7 1 x x − + 7 12 0 2 0 x x 4 3 − − 4 3 = ( ) x x ( ) 4 3 ( ) 4 3 x x 4 3 x x ( ) x x 4 3 x x − − x x ( ) − − x x 4 3 x x − − 4 3 ( ) x x 4 3 x x − − 4 3 ( ) 4 3 ( ) 4 3 x x 4 3 ( ) x x 4 3 4 3 − − 4 3 ( ) − − x x 4 3 − − 4 3 ( ) x x 4 3 x x − − 4 3 Therefore either x − 4 = 0 ⇒ x = 4 or x − 3 = 0 ⇒ x = 3. Again, there are two possible values of x. c ( ) 4 4 ( ) 4 4 ( ) 4 1 2 2 4 4 2 2 4 4 4 1 2 2 6 2 2 y y ( ) y y ( ) 4 4 y y ( ) 4 4 y y ( ) 4 4 4 4 2 2 4 4 y y 2 2 y y 4 1 y y 4 16 y y 2 2 y y 2 2 4 1 2 2 y y 4 1 2 2 6 2 2 y y 2 2 = × 2 2 = × 2 2 y y = × 4 4 y y = × 4 4 y y 2 2 y y 2 2 = × y y 4 4 2 2 y y 2 2 = × 2 2 4 4 y y 2 2 4 1 y y 4 1 y y and ( ) 5 5 ( ) 5 5 ( ) 5 25 2 2 5 5 2 2 5 5 5 2 2 2 5 2 2 w w 5 5 w w ( ) 5 5 w w ( ) 5 5 5 5 2 2 5 5 w w 2 2 w w 5 2 w w 5 25 w w 2 2 w w 2 2 5 2 2 2 w w 5 2 2 2 5 2 2 w w 2 2 = × 2 2 = × 2 2 5 5 2 2 = × 2 2 w w = × 5 5 w w = × 5 5 w w 2 2 w w 2 2 = × w w 5 5 2 2 w w 2 2 = × 2 2 5 5 w w 2 2 5 2 w w 5 2 w w 16 4 5 2 2 25 2 2 2 2 4 5 2 2 4 5 y w 25 y w 2 2 y w 2 2 25 2 2 y w 2 2 y w 4 5 y w 4 5 2 2 4 5 y w 2 2 y w y w − = y w − = y w 25 y w − = y w 4 5 y w 4 5 y w = − ( ) 4 5 ( ) 4 5 y w ( ) y w 4 5 y w 4 5 ( ) 4 5 y w ( ) 2 2 ( ) 2 2 4 5 2 2 ( ) 4 5 2 2 y w ( ) y w 4 5 y w ( ) 4 5 y w 2 2 y w 2 2 ( ) y w 4 5 2 2 y w 2 2 ( ) 4 5 2 2 4 5 y w 2 2 ( ) 4 5 ( ) y w ( ) 4 5 y w 4 5 ( ) y w = − ( ) = − 4 5 = − ( ) = − 4 5 y w 4 5 = − 4 5 y w ( ) y w 4 5 = − y w ( ) 4 5 ( ) y w ( ) 4 5 y w 4 5 ( ) y w 4 5 4 5 ( ) 4 5 y w 4 5 y w ( ) y w 4 5 y w The 16 2 2 y y 2 2 y y y y y y ( ) 2 2 ( ) 2 2 4 2 2 ( ) 2 2 y y ( ) y y 4 y y ( ) y y 2 2 y y 2 2 ( ) 2 2 y y 4 2 2 y y 2 2 ( ) 2 2 y y 2 2 . 25w2 = (5w)2 Substitute in (4y)2 and (5w)2 . Exercise 10.11 1 Factorise each of the following. a x2 36 − b p2 81 − c w2 16 − d q2 9 − e k2 400 − f t2 121 − g x y 2 2 x y x y h 81 2 2 h g 16 h g 2 2 h g 16 2 2 h g 2 2 h g h g i 16 2 2 36 2 2 p q 36 p q 2 2 p q 36 2 2 p q 2 2 p q p q j 144 2 2 s c s c s c k 64 2 2 h g 49 h g 2 2 h g 49 2 2 h g 2 2 h g h g l 27 48 2 2 48 2 2 x y 48 x y x y x y m 200 2 2 98 2 2 q p 98 q p 2 2 q p 2 2 98 2 2 q p 2 2 q p q p n 20 2 2 d e 125 d e 2 2 d e 125 2 2 d e 2 2 d e d e o x4 − y4 p xy2 − x3 2 Factorise and simplify 362 − 352 without using a calculator. 3 Factorise and simplify (6 1 4)2 − (5 3 4 )2 without using a calculator. Using factors to solve quadratic equations You can now use the factorisation method to solve some quadratic equations. A quadratic equation is an equation of the form ax bx c 2 0 + + bx + + = . The method is illustrated in the following worked examples. From question (l) you should notice that the numbers given are not square. Try taking a common factor out first. E e s s - R e v i e w C o p y - C a m b r i d g e U n i v e r s i t y P r e s s - R e v i e w C o p y R e v i e w C o p y - C a m b r i d g e U n i v e r s i t y P r e s s - R e v i e w C o p y R e v i e w C o p y - C a m b r i d g e U n i v e r s i t y P r e s s - R e v i e w C o p y R e v i e w C o p y - C a m b r i d g e U n i v e r s i t y Copyright Material - Review Only - Not for Redistribution
- 233. Unit 3: Algebra 223 10 Straight lines and quadratic equations Summary Do you know the following? • The equation of a line tells you how the x- and y co-ordinates are related for all points that sit on the line. • The gradient of a line is a measure of its steepness. • The x- and y-intercepts are where the line crosses the x- and y-axes respectively. • The value of m in y = mx + c is the gradient of the line. • The value of c in y = mx + c is the y-intercept. • The x-intercept can be found by substituting y = 0 and solving for x. • The y-intercept can be found by substituting x = 0 and solving for y. • Two lines with the same gradient are parallel. • The gradients of two perpendicular lines will multiply to give −1. • There is more than one way to expand brackets. • Some quadratic expressions can be factorised to solve quadratic equations. • Quadratic equations usually have two solutions, though these solutions may be equal to one another. Are you able to …? • draw a line from its equation by drawing a table and plotting points • find the gradient, x-intercept and y-intercept from the equation of a line • calculate the gradient of a line from its graph • find the equation of a line if you know its gradient and y-intercept • find the equation of a vertical or horizontal line • calculate the gradient of a line from the co-ordinates of two points on the line • find the length of a line segment and the co-ordinates of its midpoint • expand double brackets • expand three or more sets of brackets • factorise a quadratic expression • factorise an expression that is the difference between two squares • solve a quadratic equation by factorising. Exercise 10.12 1 Solve the following equations by factorisation. a x x 2 9 0 x x 9 0 x x x x − = x x 9 0 − = 9 0 x x 9 0 x x − = 9 0 b x x 2 7 0 x x 7 0 x x + = x x + = x x 7 0 + = 7 0 x x 7 0 x x + = 7 0 c x x 2 21 x x 21 x x 0 − = x x − = x x x x 21 x x − = 21 d x x 2 9 2 x x 9 2 x x 0 0 − + x x − + x x 9 2 − + 9 2 x x 9 2 x x − + 9 20 0 0 0 e x x 2 8 7 x x 8 7 x x 0 + + x x + + x x 8 7 + + 8 7 x x 8 7 x x + + 8 7 = f x x 2 6 0 + − x x + − x x 6 0 6 0 g x x 2 3 2 x x 3 2 x x 0 + + x x + + x x 3 2 + + 3 2 x x 3 2 x x + + 3 2 = h x x 2 11 10 0 + + x x + + x x 11 + + x x 11 x x + + 11 = i x x 2 7 1 x x 7 1 x x 2 0 − + x x − + x x 7 1 − + 7 1 x x 7 1 x x − + 7 12 0 2 0 j x x 2 8 1 x x 8 1 x x 2 0 − + x x − + x x 8 1 − + 8 1 x x 8 1 x x − + 8 12 0 2 0 k x2 100 0 − = 100 − = l t t 2 t t t t 16 t t 16 t t 36 0 + − t t + − t t t t 16 t t + − 16 = m y y 2 7 y y y y 170 0 + − y y + − y y 7 + − y y y y + − = n p p 2 p p p p 8 8 p p 8 8 p p 4 0 + − p p + − p p 8 8 + − 8 8 p p 8 8 p p + − 8 84 0 4 0 o w w 2 24 144 0 − + w w − + w w 24 − + w w 24 w w − + 24 = c x x 2 2 x x 2 2 x x 6 4 x x 6 4 x x 2 2 6 4 2 2 2 2 12 2 2 x x + − x x 2 2 + − 2 2 x x 2 2 + − x x 2 2 6 4 + − 6 4 x x 6 4 x x + − 6 4 2 2 6 4 2 2 + − 6 4 x x 2 2 6 4 x x 2 2 + − 2 2 x x 6 4 2 2 = ⇒ 2 2 = ⇒ 12 = ⇒ 2 2 12 2 2 = ⇒ 12 x x 2 2 x x 2 2 x x 6 1 x x 6 1 x x 6 0 = ⇒ 2 2 = ⇒ 2 2 + − x x + − x x 6 1 + − 6 1 x x 6 1 x x + − 6 16 0 6 0 (subtract 12 from both sides) Factorising, you get (x + 8)(x − 2) = 0 So either x + 8 = 0 ⇒ x = −8 or x − 2 = 0 ⇒ x = 2. d Factorising, x x 2 x x x x 8 1 x x 8 1 x x 6 0 4 4 x x 4 4 0 − + x x − + x x 8 1 − + 8 1 x x 8 1 x x − + 8 16 0 6 0 x x 4 4 − − 4 4 = ( ) x x ( ) x x 4 4 ( ) 4 4 x x 4 4 x x ( ) x x 4 4 x x − − x x ( ) − − x x 4 4 x x − − 4 4 ( ) x x 4 4 x x − − 4 4 ( ) 4 4 ( ) 4 4 x x 4 4 ( ) x x 4 4 4 4 − − 4 4 ( ) − − x x 4 4 − − 4 4 ( ) x x 4 4 x x − − 4 4 So either x − 4 = 0 ⇒ x = 4 or x − 4 = 0 ⇒ x = 4 Of course these are both the same thing, so the only solution is x = 4. When solving quadratic equations they should be rearranged so that a zero appears on one side, i.e. so that they are in the form ax2 + bx + c = 0 There are still two solutions here, but they are identical. E E E E e s s - R e v i e w C o p y - C a m b r i d g e U n i v e r s i t y P r e s s - R e v i e w C o p y R e v i e w C o p y - C a m b r i d g e U n i v e r s i t y P r e s s - R e v i e w C o p y R e v i e w C o p y - C a m b r i d g e U n i v e r s i t y P r e s s - R e v i e w C o p y R e v i e w C o p y - C a m b r i d g e U n i v e r s i t y Copyright Material - Review Only - Not for Redistribution
- 234. Unit 3: Algebra 224 Examination practice Exam-style questions 1 Expand and simplify each of the following. a (x + 2)(x + 18) b (2x + 3)(2x − 3) c ( )( ) ( ) 4 3 ( )( ) 3 1 ( ) 2 2 ( ) 2 2 ( )( ) 2 2 ( ) ( ) 4 3 ( ) 2 2 ( ) 4 3 ( ) 3 1 ( ) 2 2 ( ) 3 1 y y ( ) y y ( )( ) y y ( ) ( ) 4 3 ( ) y y ( ) 4 3 ( ) 3 1 ( ) y y ( ) 3 1 − + ( ) − + ( ) − + ( ) 4 3 ( ) − + 4 3 ( ) 3 1 ( ) − + ( ) 3 1 2 2 − + ( ) 2 2 − + 2 2 ( ) 2 2 − + 2 2 ( ) 4 3 ( ) 2 2 4 3 − + 4 3 ( ) 2 2 4 3 ( ) 3 1 ( ) 2 2 ( ) 3 1 − + 3 1 ( ) 2 2 3 1 y y − + ( ) y y − + y y ( ) y y − + y y ( ) 4 3 ( ) y y 4 3 − + ( ) 4 3 ( ) y y 4 3 ( ) 3 1 ( ) y y ( ) 3 1 − + 3 1 ( ) y y 3 1 2 a Factorise each of the following. i 12 6 2 x x 6 x x x x x x ii y y 2 13 y y 13 y y 42 − + y y − + y y 13 − + y y 13 y y − + 13 iii d2 196 − b Solve the following equations. i 12 6 0 2 x x 6 0 x x 6 0 6 0 − = 6 0 x x − = x x 6 0 x x 6 0 − = x x ii y y 2 13 y y 13 y y 30 12 − + y y − + y y 13 − + y y 13 y y − + 13 = − iii d2 196 0 − = 196 − = Past paper questions 1 x y 5 0 4 3 2 1 B L 2 1 –2 –3 –4 –5 –6 –1 –2 –3 –4 4 3 6 5 –1 a On the grid mark the point (5, 1). Label it A. [1] b Write down the co-ordinates of the point B. [1] c Find the gradient of the line L. [2] [Cambridge IGCSE Mathematics 0580 Paper 13 Q19 October/November 2012] e s s - R e v i e w C o p y - C a m b r i d g e U n i v e r s i t y P r e s s - R e v i e w C o p y R e v i e w C o p y - C a m b r i d g e U n i v e r s i t y P r e s s - R e v i e w C o p y R e v i e w C o p y - C a m b r i d g e U n i v e r s i t y P r e s s - R e v i e w C o p y R e v i e w C o p y - C a m b r i d g e U n i v e r s i t y Copyright Material - Review Only - Not for Redistribution
- 235. 225 Unit 3: Algebra 2 y x l P 0 NOT TO SCALE The equation of the line l in the diagram is y = 5 − x. a The line cuts the y-axis at P. Write down the co-ordinates of P. [1] b Write down the gradient of the line l. [1] [Cambridge IGCSE Mathematics 0580 Paper 22 Q5 May/June 2014] 3 Factorise 9w2 − 100, [Cambridge IGCSE Mathematics 0580 Paper 22 Q15 (a) October/November 2015] 4 Factorise mp + np − 6mq − 6nq. [2] [Cambridge IGCSE Mathematics 0580 Paper 22 Q15(b) October/November 2015] E e s s - R e v i e w C o p y - C a m b r i d g e U n i v e r s i t y P r e s s - R e v i e w C o p y R e v i e w C o p y - C a m b r i d g e U n i v e r s i t y P r e s s - R e v i e w C o p y R e v i e w C o p y - C a m b r i d g e U n i v e r s i t y P r e s s - R e v i e w C o p y R e v i e w C o p y - C a m b r i d g e U n i v e r s i t y Copyright Material - Review Only - Not for Redistribution
- 236. Unit 3: Shape, space and measures 226 Chapter 11: Pythagoras’ theorem and similar shapes • Right angle • Hypotenuse • Similar • Corresponding sides • Corresponding angles • Scale factor of lengths • Scale factor of volumes • Scale factor of areas • Congruent • Included side • Included angle Key words In this chapter you will learn how to: • use Pythagoras’ theorem to find unknown sides of a right-angled triangles • learn how to use Pythagoras’ theorem to solve problems • decide whether or not triangles are mathematically similar • use properties of similar triangles to solve problems • find unknown lengths in similar figures • use the relationship between sides and areas of similar figures to find missing values • recognise similar solids • calculate the volume and surface area of similar solids • decide whether or not shapes are congruent. • use the basic conditions for congruency in triangles Right-angled triangles appear in many real-life situations, including architecture, engineering and nature. Many modern buildings have their sections manufactured off-site and so it is important that builders are able to accurately position the foundations on to which the parts will sit so that all the pieces will fit smoothly together. Many properties of right-angled triangles were first used in ancient times and the study of these properties remains one of the most significant and important areas of Mathematics. One man – Pythagoras of Samos – is usually credited with the discovery of the Pythagorean theorem, but there is evidence to suggest that an entire group of religious mathematicians would have been involved. EXTENDED EXTENDED e s s - R e v i e w C o p y - C a m b r i d g e U n i v e r s i t y P r e s s - R e v i e w C o p y R e v i e w C o p y - C a m b r i d g e U n i v e r s i t y P r e s s - R e v i e w C o p y R e v i e w C o p y - C a m b r i d g e U n i v e r s i t y P r e s s - R e v i e w C o p y R e v i e w C o p y - C a m b r i d g e U n i v e r s i t y Copyright Material - Review Only - Not for Redistribution
- 237. Unit 3: Shape, space and measures 227 11 Pythagoras’ theorem and similar shapes 11.1 Pythagoras’ theorem Centuries before the theorem of right-angled triangles was credited to Pythagoras, the Egyptians knew that if they tied knots in a rope at regular intervals, as in the diagram on the left, then they would produce a perfect right angle. In some situations you may be given a right-angled triangle and then asked to calculate the length of an unknown side. You can do this by using Pythagoras’ theorem if you know the lengths of the other two sides. Learning the rules Pythagoras’ theorem describes the relationship between the sides of a right-angled triangle. The longest side – the side that does not touch the right angle – is known as the hypotenuse. For this triangle, Pythagoras’ theorem states that: a b c 2 2 a b 2 2 a b 2 + = a b + = a b 2 2 + = a b 2 2 + = a b 2 2 In words this means that the square on the hypotenuse is equal to the sum of the squares on the other two sides. Notice that the square of the hypotenuse is the subject of the equation. This should help you to remember where to place each number. You will be expected to remember Pythagoras' theorem. Tip a b c = hypotenuse RECAP You should already be familiar with the following number and shape work: Squares and square roots (Chapter 1) To square a number, multiply it by itself. 72 = 7 × 7 = 49. You can also use the square function on your calculator x2 . To find the square root of a number use the square root function on your calculator 121 11 = . Pythagoras’ theorem (Stage 9 Mathematics) Pythagoras’ theorem states that in a right-angled triangle, the square of the hypotenuse is equal to the sum of the two shorter sides. For this triangle: a b c hypotenuse a2 + b2 = c2 The hypotenuse is the longest side and it is always opposite the right angle. Worked example 1 Worked example 1 Find the value of x in each of the following triangles, giving your answer to one decimal place. a 5 cm 3 cm x cm b 8 cm 17 cm x cm e s s - R e v i e w C o p y - C a m b r i d g e U n i v e r s i t y P r e s s - R e v i e w C o p y R e v i e w C o p y - C a m b r i d g e U n i v e r s i t y P r e s s - R e v i e w C o p y R e v i e w C o p y - C a m b r i d g e U n i v e r s i t y P r e s s - R e v i e w C o p y R e v i e w C o p y - C a m b r i d g e U n i v e r s i t y Copyright Material - Review Only - Not for Redistribution
- 238. Unit 3: Shape, space and measures Cambridge IGCSE Mathematics 228 Checking for right-angled triangles You can also use the theorem to determine if a triangle is right-angled or not. Substitute the values of a, b and c of the triangle into the formula and check to see if it fits. If a2 + b2 does not equal c2 then it is not a right-angled triangle. Worked example 2 Use Pythagoras’ theorem to decide whether or not the triangle shown below is right-angled. 4.2 m 3.1 m 5.3 m Check to see if Pythagoras’ theorem is satisfied: 3 c a b 2 2 c a 2 2 c a 2 = + c a = + c a 2 2 = + c a 2 2 = + 2 2 . .1 Pythagoras’ theorem is not 2 + = = ≠ 4 2 + = 4 2 + = 27 25 5 3 28 = ≠ 28 = ≠ 09 = ≠ 09 = ≠ 27 25 2 + = + = 2 . . + = . . 4 2 . . 4 2 + = 4 2 + = . . + = 4 2 27 . . = ≠ . . = ≠ . . = ≠ . . 5 3 . . 5 3 = ≠ 28 = ≠ . . 28 . satisfied, so the triangle is s satisfied, so the triangle is s not right-angled. The symbol ‘≠’ means ‘does not equal’. Exercise 11.1 For all the questions in this exercise, give your final answer correct to three significant figures where appropriate. 1 Find the length of the hypotenuse in each of the following triangles. a x cm 6 cm 8 cm b 12 cm 6 cm c h cm 1.2 cm 2.3 cm d p cm 1.5 cm 0.6 cm e t m 4 m 6 m You will notice that some of your answers need to be rounded. Many of the square roots you need to take produce irrational numbers. These were mentioned in chapter 9. REWIND Notice here the theorem is written as c2 = a2 + b2 ; you will see it written like this or like a2 + b2 = c2 in different places but it means the same thing. a a b c x x x x 2 2 a b 2 2 a b 2 2 2 2 2 2 3 5 2 2 3 5 2 2 9 25 34 34 5 8309 5 8 + = a b + = a b 2 2 + = a b 2 2 + = a b 2 2 + = 2 2 + = 3 5 + = 3 5 2 2 3 5 2 2 + = 2 2 3 5 + = 9 2 + = 9 25 + = ⇒ = x ⇒ = 2 ⇒ = = = = = 34 = = ≈ ( ) . . . . . c 5 8 . c 5 8 m ( ) 1dp ( ) Notice that the final answer needs to be rounded. b a b c x x x x 2 2 a b 2 2 a b 2 2 2 2 2 2 2 8 1 x 8 1 2 2 8 17 64 289 289 64 225 225 15 + = a b + = a b 2 2 + = a b 2 2 + = a b 2 2 8 1 + = 8 1 x 8 1 + = 8 1 2 2 8 1 + = 2 2 8 1 x 2 2 8 1 2 2 + = 2 2 8 1 2 2 + = x + = 2 + = = − 289 = − = = = = = 225 = = cm (1dp) Notice that a shorter side needs to be found so, after writing the Pythagoras formula in the usual way, the formula has to be rearranged to make x2 the subject. e s s - R e v i e w C o p y - C a m b r i d g e U n i v e r s i t y P r e s s - R e v i e w C o p y R e v i e w C o p y - C a m b r i d g e U n i v e r s i t y P r e s s - R e v i e w C o p y R e v i e w C o p y - C a m b r i d g e U n i v e r s i t y P r e s s - R e v i e w C o p y R e v i e w C o p y - C a m b r i d g e U n i v e r s i t y Copyright Material - Review Only - Not for Redistribution
- 239. Unit 3: Shape, space and measures 229 11 Pythagoras’ theorem and similar shapes 2 Find the values of the unknown lengths in each of the following triangles. a 8 m 3 m x m b 4.3 cm 2.3 cm y cm c 14 cm 11 cm t cm d 13 m p m 5 m e 10 cm a cm 8 cm 3 Find the values of the unknown lengths in each of the following triangles. a 2.3 cm 1.6 cm x cm b 4 cm 6 cm y cm c 4.2 cm 6 cm h cm d 8 km 3 km p km e 6 cm 12 cm k cm f 8 cm h cm 9 cm g 6 m 3 m d m 8 m h 12 m 3 m f m 4 m e s s - R e v i e w C o p y - C a m b r i d g e U n i v e r s i t y P r e s s - R e v i e w C o p y R e v i e w C o p y - C a m b r i d g e U n i v e r s i t y P r e s s - R e v i e w C o p y R e v i e w C o p y - C a m b r i d g e U n i v e r s i t y P r e s s - R e v i e w C o p y R e v i e w C o p y - C a m b r i d g e U n i v e r s i t y Copyright Material - Review Only - Not for Redistribution
- 240. Unit 3: Shape, space and measures Cambridge IGCSE Mathematics 230 4 Use Pythagoras’ theorem to help you decide which of the following triangles are right-angled. a 6 cm 10 cm 8 cm b 12 cm 6 cm c 5 cm 14 cm 12 cm d 6 km 3.6 km 4.8 km e 24 cm 25 cm 7 cm Applications of Pythagoras’ theorem This section looks at how Pythagoras’ theorem can be used to solve real-life problems. In each case look carefully for right-angled triangles and draw them separately to make the working clear. It is usually useful to draw the triangle that you are going to use as part of your working. Worked example 3 1.6 m 1.85 m The diagram shows a bookcase that has fallen against a wall. If the bookcase is 1.85m tall, and it now touches the wall at a point 1.6m above the ground, calculate the distance of the foot of the bookcase from the wall. Give your answer to 2 decimal places. 1.6 m 1.85 m x m Apply Pythagoras’ theorem: a2 + b2 = c2 x x x 2 2 2 2 2 2 1 6 2 2 1 6 2 2 1 85 1 8 2 2 1 8 2 2 5 1 2 2 5 1 2 2 6 3 4225 2 56 0 8625 0 8625 0 93 + = 2 2 + = 2 2 1 6 + = 2 2 1 6 2 2 + = 1 6 = − 1 8 = − 5 1 = − 5 1 = − 3 = − 4225 = − = = = = = 0 = = 8625 = = . . 1 6 . . 1 6 1 8 . . 1 8 + = . . 1 6 + = . . 1 6 + = . . 1 8 . . 1 85 1 . . . . 4225 . . 2 5 . . 2 5 . . . 8625 . . 0 9 . . 0 9 m ( m m ( m 2dp) Think what triangle the situation would make and then draw it. Label each side and substitute the correct sides into the formula. Worked example 4 Find the distance between the points A(3, 5) and B(−3, 7). C(3, 5) A B(–3, 7) y x –6 –4 –2 0 2 4 6 –2 2 4 6 8 AB = 7 − 5 = 2 units AC = 3 − −3 = 6 units BC BC 2 2 2 2 6 2 2 2 6 2 2 4 36 40 40 6 32 3 = + 2 2 = + 2 6 = + 2 6 2 2 2 6 2 2 = + 2 6 = + 4 3 = + 4 3 = = = So units sf . ( 6 3 . ( 6 32 3 . ( 2 3 units . ( 2 3 units 2 3 . ( units ) Difference between y-co-ordinates. Difference between x-co-ordinates. Apply Pythagoras’ theorem. It can be helpful to draw diagrams when you are given co-ordinates. e s s - R e v i e w C o p y - C a m b r i d g e U n i v e r s i t y P r e s s - R e v i e w C o p y R e v i e w C o p y - C a m b r i d g e U n i v e r s i t y P r e s s - R e v i e w C o p y R e v i e w C o p y - C a m b r i d g e U n i v e r s i t y P r e s s - R e v i e w C o p y R e v i e w C o p y - C a m b r i d g e U n i v e r s i t y Copyright Material - Review Only - Not for Redistribution
- 241. Unit 3: Shape, space and measures 231 11 Pythagoras’ theorem and similar shapes Exercise 11.2 1 48.6 inches 21.6 inches A B The size of a television screen is its longest diagonal. The diagram shows the length and breadth of a television set. Find the distance AB. 2 0.4 m 3 m The diagram shows a ladder that is leaning against a wall. Find the length of the ladder. 3 Sarah stands at the corner of a rectangular field. If the field measures 180m by 210m, how far would Sarah need to walk to reach the opposite corner in a straight line? 4 2 m 2 m 2.4 m height 3.2 m The diagram shows the side view of a shed. Calculate the height of the shed. 5 A B 6 m 86 m The diagram shows a bridge that can be lifted to allow ships to pass below. What is the distance AB when the bridge is lifted to the position shown in the diagram? (Note that the bridge divides exactly in half when it lifts open.) 6 Find the distance between the points A and B with co-ordinates: a A(3, 2) B(5, 7) b A(5, 8) B(6, 11) c A(−3, 1) B(4, 8) d A(−2, −3) B(−7, 6) 7 The diagonals of a square are 15cm. Find the perimeter of the square. 11.2 Understanding similar triangles Two mathematically similar objects have exactly the same shape and proportions, but may be different in size. When one of the shapes is enlarged to produce the second shape, each part of the original will correspond to a particular part of the new shape. For triangles, corresponding sides join the same angles. You generally won't be told to use Pythagoras' theorem to solve problems. Always check for right- angled triangles in the context of the problem to see if you can use the theorem to solve it. e s s - R e v i e w C o p y - C a m b r i d g e U n i v e r s i t y P r e s s - R e v i e w C o p y R e v i e w C o p y - C a m b r i d g e U n i v e r s i t y P r e s s - R e v i e w C o p y R e v i e w C o p y - C a m b r i d g e U n i v e r s i t y P r e s s - R e v i e w C o p y R e v i e w C o p y - C a m b r i d g e U n i v e r s i t y Copyright Material - Review Only - Not for Redistribution
- 242. Unit 3: Shape, space and measures Cambridge IGCSE Mathematics 232 All of the following are true for similar triangles: Corresponding angles are equal. A C D F B E ‘Internal’ ratios of sides are the same for both triangles. For example: AB BC DE EF = A C B D F E Ratios of corresponding sides are equal: AB DE BC EF AC DF = = = = If any of these things are true about two triangles, then all of them will be true for both triangles. Worked example 5 Explain why the two triangles shown in the diagram are similar and work out x and y. A C D F B E 108° 108° 27° 6 m 18 m y m x m 9 m 8 m 45° Angle ACB = 180° − 27° − 108° = 45° Angle FED = 180° − 45° − 108° = 27° So both triangles have exactly the same three angles and are, therefore, similar. Since the triangles are similar: DE AB EF BC DF AC = = = = So : y y 8 18 6 3 2 y 3 24 = = = = ⇒ = y ⇒ = 3 2 ⇒ = 3 2 y 3 2 ⇒ = 3 2 m and: 9 18 6 3 3 x 3 3 3 3 = = = = ⇒ = 3 3 ⇒ = 3 3 3 3 3 3 ⇒ = m You learned in chapter 2 that the angle sum in a triangle is always 180°. REWIND e s s - R e v i e w C o p y - C a m b r i d g e U n i v e r s i t y P r e s s - R e v i e w C o p y R e v i e w C o p y - C a m b r i d g e U n i v e r s i t y P r e s s - R e v i e w C o p y R e v i e w C o p y - C a m b r i d g e U n i v e r s i t y P r e s s - R e v i e w C o p y R e v i e w C o p y - C a m b r i d g e U n i v e r s i t y Copyright Material - Review Only - Not for Redistribution
- 243. Unit 3: Shape, space and measures 233 11 Pythagoras’ theorem and similar shapes Worked example 6 The diagram shows a tent that has been attached to the ground using ropes AB and CD. ABF and DCF are straight lines. Find the height of the tent. A G E H B C F 1.2 m 1.8 m 0.9 m D 1.2 m Consider triangles ABG and AEF: A G B 1.2 m A E F 0.9 m 1.2 m + 1.8 m = 3 m height Angle BAG = FAE Common to both triangles. Angle AGB = AEF = 90° Angle ABG = AFE BG and FE are both vertical, hence parallel lines. Angles correspond. Therefore triangle ABG is similar to triangle AEF. So: height height m 0 9 3 1 2 0 9 3 1 2 2 25 . . 0 9 . . 0 9 1 2 . . 1 2 0 9 0 9 1 2 1 2 2 2 2 2 = ⇒ = ⇒ = × = Exercise 11.3 1 For each of the following decide whether or not the triangles are similar in shape. Each decision should be explained fully. a 63° 63° 59° 58° b 3 m 4 m 5 m 6 m 8 m 10 m c 69° 30° 83° 30° d 6 cm 18 cm 5 cm 7 cm 22 cm 15 cm e 49° 54° 49° 77° f 18 km 27 km 21 km 9 km 7 km 6 km Always look for corresponding sides (sides that join the same angles). e s s - R e v i e w C o p y - C a m b r i d g e U n i v e r s i t y P r e s s - R e v i e w C o p y R e v i e w C o p y - C a m b r i d g e U n i v e r s i t y P r e s s - R e v i e w C o p y R e v i e w C o p y - C a m b r i d g e U n i v e r s i t y P r e s s - R e v i e w C o p y R e v i e w C o p y - C a m b r i d g e U n i v e r s i t y Copyright Material - Review Only - Not for Redistribution
- 244. Unit 3: Shape, space and measures Cambridge IGCSE Mathematics 234 g 7 m 8 m 10 m 60 m 44 m 48 m h 9.6 cm 12.3 cm 16.2 cm 5.4 cm 3.2 cm 4.1 cm i A B C E D triangles ABC and CDE j A B D E C triangles ABE and ACD 2 The pairs of triangles in this question are similar. Calculate the unknown (lettered) length in each case. a 6 cm 8 cm 9 cm x cm b 15 cm 8 cm 24 cm y cm c 9 m 12 m 16 m p m d 7 cm 3 cm 28 cm a cm e 4 m 2.1 m 1.6 m b cm f 7 cm 12 cm 3 cm c cm 3 The diagram shows triangle ABC. If AC is parallel to EF, find the length of AC. B F A E C 5.1 cm 7.3 cm 3.6 cm e s s - R e v i e w C o p y - C a m b r i d g e U n i v e r s i t y P r e s s - R e v i e w C o p y R e v i e w C o p y - C a m b r i d g e U n i v e r s i t y P r e s s - R e v i e w C o p y R e v i e w C o p y - C a m b r i d g e U n i v e r s i t y P r e s s - R e v i e w C o p y R e v i e w C o p y - C a m b r i d g e U n i v e r s i t y Copyright Material - Review Only - Not for Redistribution
- 245. Unit 3: Shape, space and measures 235 11 Pythagoras’ theorem and similar shapes E E 4 In the diagram AB is parallel to DE. Explain why triangle ABC is mathematically similar to triangle CDE and find the length of CE. A B C E D 6.84 cm 4.21 cm 7.32 cm 5 The diagram shows a part of a children’s climbing frame. Find the length of BC. A B D E C 0.82 m 2.23 m 1.73 m 6 Swimmer A and boat B, shown in the diagram, are 80m apart, and boat B is 1200m from the lighthouse C. The height of the boat is 12m and the swimmer can just see the top of the lighthouse at the top of the boat’s mast when his head lies at sea level. What is the height of the lighthouse? A 80 m 1200 m 12 m B C 7 The diagram shows a circular cone that has been filled to a depth of 18cm. Find the radius r of the top of the cone. 12 cm 18 cm 24 cm r cm r cm 8 The diagram shows a step ladder that is held in place by an 80cm piece of wire. Find x. 120 cm 80 cm 30 cm x cm e s s - R e v i e w C o p y - C a m b r i d g e U n i v e r s i t y P r e s s - R e v i e w C o p y R e v i e w C o p y - C a m b r i d g e U n i v e r s i t y P r e s s - R e v i e w C o p y R e v i e w C o p y - C a m b r i d g e U n i v e r s i t y P r e s s - R e v i e w C o p y R e v i e w C o p y - C a m b r i d g e U n i v e r s i t y Copyright Material - Review Only - Not for Redistribution
- 246. Unit 3: Shape, space and measures Cambridge IGCSE Mathematics 236 11. 3 Understanding similar shapes In the previous section you worked with similar triangles, but any shapes can be similar. A shape is similar if the ratio of corresponding sides is equal and the corresponding angles are equal. Similar shapes are therefore identical in shape, but they differ in size. You can use the ratio of corresponding sides to find unknown sides of similar shapes just as you did with similar triangles. Worked example 7 Ahmed has two rectangular flags. One measures 1000 mm by 500 mm, the other measures 500 mm by 350 mm. Are the flags similar in shape? 1000 500 2 = and 500 350 1 43 = 1 4 1 4 (Work out the ratio of corresponding sides.) 1000 500 ≠ 500 350 The ratio of corresponding sides is not equal, therefore the shapes are not similar. Worked example 8 Given that the two shapes in the diagram are mathematically similar, find the unknown length x. 8 m 20 m x m 12 m Using the ratios of corresponding sides: x x 12 20 8 2 5 12 2 5 30 = = = = ⇒ = x ⇒ = × = 2 5 × = 2 5 2 5 . m 2 5 . m 2 5 30 . m × = . m 2 5 × = . m 2 5 × = Exercise 11.4 1 Establish whether each pair of shapes is similar or not. Show your working. a 2 5 6 4 b x y c 5 4 4 3 d 45 60 80 60 e 12 9 8 6 f 60° 80° When trying to understand how molecules fit together, chemists will need to have a very strong understanding of shape and space. LINK e s s - R e v i e w C o p y - C a m b r i d g e U n i v e r s i t y P r e s s - R e v i e w C o p y R e v i e w C o p y - C a m b r i d g e U n i v e r s i t y P r e s s - R e v i e w C o p y R e v i e w C o p y - C a m b r i d g e U n i v e r s i t y P r e s s - R e v i e w C o p y R e v i e w C o p y - C a m b r i d g e U n i v e r s i t y Copyright Material - Review Only - Not for Redistribution
- 247. Unit 3: Shape, space and measures 237 11 Pythagoras’ theorem and similar shapes 2 In each part of this question the two shapes given are mathematically similar to one another. Calculate the unknown lengths in each case. a x cm 3 cm 5 cm 15 cm b 7 cm 11 cm y cm 22 cm c 7.28 m 3.62 cm p cm 1.64 cm d 10.3 cm 8.4 cm 11.6 cm y cm e 50 40 20 x y 40 40 f 8 21 x y 10 28 g 25 12 x y 15 24 h 120 x 267 80 Area of similar shapes Each pair of shapes below is similar: 5 10 8 4 Scale factor Area factor = = = = 10 5 2 40 10 4 Area = 10 Area = 40 Area = 5.29 Area = 47.61 2.3 6.9 Scale factor = Area factor = 6 9 2 3 47 61 5 29 9 . . . . = = 3 If you look at the diagrams and the dimensions you can see that there is a relationship between the corresponding sides of similar figures and the areas of the figures. In similar figures where the ratio of corresponding sides is a : b, the ratio of areas is a2 : b2 . In other words, scale factor of areas = (scale factor of lengths)2 The ratio that compares the measurements of two similar shapes is called the scale factor. E e s s - R e v i e w C o p y - C a m b r i d g e U n i v e r s i t y P r e s s - R e v i e w C o p y R e v i e w C o p y - C a m b r i d g e U n i v e r s i t y P r e s s - R e v i e w C o p y R e v i e w C o p y - C a m b r i d g e U n i v e r s i t y P r e s s - R e v i e w C o p y R e v i e w C o p y - C a m b r i d g e U n i v e r s i t y Copyright Material - Review Only - Not for Redistribution
- 248. Unit 3: Shape, space and measures Cambridge IGCSE Mathematics 238 Worked example 9 These two rectangles are similar. What is the ratio of the smaller area to the larger? 18 21 Ratio of sides = 18:21 Ratio of areas = (18)2 :(21)2 = 324:441 = 36:49 Worked example 10 Similar rectangles ABCD and MNOP have lengths in the ratio 3 : 5. If rectangle ABCD has area of 900 cm2 , find the area of MNOP. Area Area Area cm Area MNOP 25 9 2 MNOP ABCD MNOP = = = × = × 5 3 900 25 9 9 2 2 00 0 00 0 2500 = cm2 The area of MNOP is 2500 cm2 . Worked example 11 The shapes below are similar. Given that the area of ABCD = 48 cm2 and the area of PQRS = 108 cm2 , find the diagonal AC in ABCD. A P D S C R B Q 18 Let the length of the diagonal be x cm. 48 108 18 48 108 324 48 108 324 2 2 2 2 = = × = 324 × = x x x x2 = 144 x = 12 Diagonal AC is 12 cm long. E e s s - R e v i e w C o p y - C a m b r i d g e U n i v e r s i t y P r e s s - R e v i e w C o p y R e v i e w C o p y - C a m b r i d g e U n i v e r s i t y P r e s s - R e v i e w C o p y R e v i e w C o p y - C a m b r i d g e U n i v e r s i t y P r e s s - R e v i e w C o p y R e v i e w C o p y - C a m b r i d g e U n i v e r s i t y Copyright Material - Review Only - Not for Redistribution
- 249. Unit 3: Shape, space and measures 239 11 Pythagoras’ theorem and similar shapes Exercise 11.5 1 In each part of this question, the two figures are similar. The area of one figure is given. Find the area of the other. a 20 cm 30 cm Area =187.5 cm2 b Area =17.0 m2 15 m 7 m c Area = 4000 m2 80 m 50 m d Area = 135 cm2 15 cm 25 cm 2 In each part of this question the areas of the two similar figures are given. Find the length of the side marked x in each. Area = 333 cm2 32 cm x cm Area = 592 cm2 Area = 272.25 m2 16.5 m x m Area = 900 m2 Area = 4.4 cm2 Area = 6.875 cm2 2 cm x cm Area = 135 cm2 Area = 303.75 cm2 22.5 cm x cm 3 Clarissa is making a pattern using a cut out regular pentagon. How will the area of the pentagon be affected if she: a doubles the lengths of the sides? b trebles the lengths of the sides? c halves the lengths of the sides? 4 If the areas of two similar quadrilaterals are in the ratio 64 : 9, what is the ratio of matching sides? c a b d E e s s - R e v i e w C o p y - C a m b r i d g e U n i v e r s i t y P r e s s - R e v i e w C o p y R e v i e w C o p y - C a m b r i d g e U n i v e r s i t y P r e s s - R e v i e w C o p y R e v i e w C o p y - C a m b r i d g e U n i v e r s i t y P r e s s - R e v i e w C o p y R e v i e w C o p y - C a m b r i d g e U n i v e r s i t y Copyright Material - Review Only - Not for Redistribution
- 250. Unit 3: Shape, space and measures Cambridge IGCSE Mathematics 240 Similar solids Three-dimensional shapes (solids) can also be similar. Similar solids have the same shape, their corresponding angles are equal and all corresponding linear measures (edges, diameters, radii, heights and slant heights) are in the same ratio. As with similar two-dimensional shapes, the ratio that compares the measurements on the two shapes is called the scale factor. Volume and surface area of similar solids The following table shows the side length and volume of each of the cubes above. 2 2 2 2 8 × × = 4 4 4 4 64 × × = 10 10 10 10 1000 × × = × 2 × 5 × 125 × 8 Volume (units ) 3 Length of side (units) Notice that when the side length is multiplied by 2 the volume is multiplied by 23 = 8 Here, the scale factor of lengths is 2 and the scale factor of volumes is 23 . Also, when the side length is multiplied by 5 the volume is multiplied by 53 = 125. This time the scale factor of lengths is 5 and the scale factor of volumes is 53 . In fact this pattern follows in the general case: scale factor of volumes = (scale factor of lengths)3 By considering the surface areas of the cubes you will also be able to see that the rule from page 221 is still true: scale factor of areas = (scale factor of lengths)2 In summary, if two solids (A and B) are similar: • the ratio of their volumes is equal to the cube of the ratio of corresponding linear measures (edges, diameter, radii, heights and slant heights). In other words: Volume A ÷ Volume B = a b 3 • the ratio of their surface areas is equal to the square of the ratio of corresponding linear measures. In other words: Surface area A ÷ Surface area B = a b 2 The following worked examples show how these scale factors can be used. Sometimes you are given the scale factor of areas or volumes rather than starting with the scale factor of lengths. Use square roots or cube roots to get back to the scale factor of lengths as your starting point. E e s s - R e v i e w C o p y - C a m b r i d g e U n i v e r s i t y P r e s s - R e v i e w C o p y R e v i e w C o p y - C a m b r i d g e U n i v e r s i t y P r e s s - R e v i e w C o p y R e v i e w C o p y - C a m b r i d g e U n i v e r s i t y P r e s s - R e v i e w C o p y R e v i e w C o p y - C a m b r i d g e U n i v e r s i t y Copyright Material - Review Only - Not for Redistribution
- 251. Unit 3: Shape, space and measures 241 11 Pythagoras’ theorem and similar shapes Worked example 12 The cones shown in the diagram are mathematically similar. If the smaller cone has a volume of 40cm3 find the volume of the larger cone. 12 cm 3 cm Scale factor of lengths = = = = 12 3 4 ⇒ Scale factor of volumes = 43 = 64 So the volume of the larger cone = 64 × 40 = 2560cm3 Worked example 13 The two shapes shown in the diagram are mathematically similar. If the area of the larger shape is 216cm2 , and the area of the smaller shape is 24cm2 , find the length x in the diagram. x cm 12 cm Scale factor of areas = = = = 216 24 9 ⇒ (Scale factor of lengths)2 = 9 ⇒ Scale factor of lengths = 9 = 3 So: x = 3 × 12 = 36 cm Worked example 14 A shipping crate has a volume of 2000 cm3 . If the dimensions of the crate are doubled, what will its new volume be? Original volume New volume original dimensions new dimension = s s 3 2000 New volume = 1 2 3 2000 New volume = 1 8 New volume = 2000 × 8 New volume = 16 000 cm3 E e s s - R e v i e w C o p y - C a m b r i d g e U n i v e r s i t y P r e s s - R e v i e w C o p y R e v i e w C o p y - C a m b r i d g e U n i v e r s i t y P r e s s - R e v i e w C o p y R e v i e w C o p y - C a m b r i d g e U n i v e r s i t y P r e s s - R e v i e w C o p y R e v i e w C o p y - C a m b r i d g e U n i v e r s i t y Copyright Material - Review Only - Not for Redistribution
- 252. Unit 3: Shape, space and measures Cambridge IGCSE Mathematics 242 Exercise 11.6 1 Copy and complete the statement. When the dimensions of a solid are multiplied by k, the surface area is multiplied by __ and the volume is multiplied by __. 2 Two similar cubes A and B have sides of 20 cm and 5 cm respectively. a What is the scale factor of A to B? b What is the ratio of their surface areas? c What is the ratio of their volumes? 3 Pyramid A and pyramid B are similar. Find the surface area of pyramid A. Surface area = 600 cm2 6 cm 10 cm 4 Yu has two similar cylindrical metal rods. The smaller rod has a diameter of 4 cm and a surface area of 110 cm2 . The larger rod has a diameter of 5 cm. Find the surface area of the larger rod. 5 Cuboid X and cuboid Y are similar. The scale factor X to Y is 3 4 . a If a linear measure in cuboid X is 12 mm, what is the length of the corresponding measure on cuboid Y? b Cuboid X has a surface area of 88.8 cm2 . What is the surface area of cuboid Y? c If cuboid X has a volume of 35.1 cm3 , what is the volume of cuboid Y? Worked example 15 The two cuboids A and B are similar. The larger has a surface area of 608 cm2 . What is the surface area of the smaller? A B 8 cm 5 cm Surface area Surface area width width A B A B = 2 Surface area 608 A = 5 8 2 Surface area 608 A = 25 64 Surfacearea A = × = × 25 64 608 Surface area A = 237.5 cm2 Cuboid A has a surface area of 237.5 cm2 E e s s - R e v i e w C o p y - C a m b r i d g e U n i v e r s i t y P r e s s - R e v i e w C o p y R e v i e w C o p y - C a m b r i d g e U n i v e r s i t y P r e s s - R e v i e w C o p y R e v i e w C o p y - C a m b r i d g e U n i v e r s i t y P r e s s - R e v i e w C o p y R e v i e w C o p y - C a m b r i d g e U n i v e r s i t y Copyright Material - Review Only - Not for Redistribution
- 253. Unit 3: Shape, space and measures 243 11 Pythagoras’ theorem and similar shapes 6 For each part of this question, the solids are similar. Find the unknown volume. a Volume = 288 cm3 12 cm 5 cm b 3 mm 4 mm Volume = 9 mm3 c Volume = 0.384 m3 1.6 m 2 m d Volume = 80.64 m3 3.6 m 3.2 m 7 Find the unknown quantity for each of the following pairs of similar shapes. a Area = 21 cm2 cm x 2 Area = 3 cm 15 cm b 6 cm 42 cm Volume = cm y 3 Volume = cm 20 3 c 9 cm r cm Volume 10 cm = 3 Volume 640 cm = 3 d 28.5 cm x cm Area cm = 438 2 Area cm = 108 2 Applying your skills 8 Karen has this set of three Russian dolls. The largest doll is 13 cm tall, the next one is 2 cm shorter and the third one is 4 cm shorter. Draw up a table to compare the surface area and volume of the three dolls in algebraic terms. Organised tables and lists are a useful problem-solving strategy. Include headings for rows and/or columns to make sure your table is easy to understand. E e s s - R e v i e w C o p y - C a m b r i d g e U n i v e r s i t y P r e s s - R e v i e w C o p y R e v i e w C o p y - C a m b r i d g e U n i v e r s i t y P r e s s - R e v i e w C o p y R e v i e w C o p y - C a m b r i d g e U n i v e r s i t y P r e s s - R e v i e w C o p y R e v i e w C o p y - C a m b r i d g e U n i v e r s i t y Copyright Material - Review Only - Not for Redistribution
- 254. Unit 3: Shape, space and measures Cambridge IGCSE Mathematics 244 9 A manufacturer is making pairs of paper weights from metal cones that have been cut along a plane parallel to the base. The diagram shows a pair of these weights. If the volume of the larger (uncut) cone is 128cm3 and the volume of the smaller cone cut from the top is 42cm3 find the length x. 12 cm x cm 11.4 Understanding congruence If two shapes are congruent, we can say that: • corresponding sides are equal in length • corresponding angles are equal • the shapes have the same area. Look at these pairs of congruent shapes. The corresponding sides and angles on each shape are marked using the same colours and symbols. T S R Q H G F E C B A D M P N O When you make a congruency statement, you name the shape so that corresponding vertices are in the same order. For the shapes above, we can say that • ABCD is congruent to EFGH, and • MNOP is congruent to RQTS Exercise 11.7 1 These two figures are congruent. A B C D E F S R Q P M N O G a Which side is equal in length to: i AB ii EF iii MN A cone cut in this way produces a smaller cone and a solid called a frustum. E e s s - R e v i e w C o p y - C a m b r i d g e U n i v e r s i t y P r e s s - R e v i e w C o p y R e v i e w C o p y - C a m b r i d g e U n i v e r s i t y P r e s s - R e v i e w C o p y R e v i e w C o p y - C a m b r i d g e U n i v e r s i t y P r e s s - R e v i e w C o p y R e v i e w C o p y - C a m b r i d g e U n i v e r s i t y Copyright Material - Review Only - Not for Redistribution
- 255. Unit 3: Shape, space and measures 245 11 Pythagoras’ theorem and similar shapes b Which angle corresponds with: i BAG ii PQR iii DEF c Write a congruency statement for the two figures. 2 Which of the shapes in the box are congruent to each shape given below? Measure sides and angles if you need to. a b c d A E i j k l F G H B C D 3 For each set of shapes, state whether any shapes are congruent or similar. A B E F I J L K H G C D M N Q R O V U W X S T P A B C D E I J K L M N O Q R S T U V W X P F G H A B C M N P Q R O A D G B F E I H C a b c d e e s s - R e v i e w C o p y - C a m b r i d g e U n i v e r s i t y P r e s s - R e v i e w C o p y R e v i e w C o p y - C a m b r i d g e U n i v e r s i t y P r e s s - R e v i e w C o p y R e v i e w C o p y - C a m b r i d g e U n i v e r s i t y P r e s s - R e v i e w C o p y R e v i e w C o p y - C a m b r i d g e U n i v e r s i t y Copyright Material - Review Only - Not for Redistribution
- 256. Unit 3: Shape, space and measures Cambridge IGCSE Mathematics 246 E 4 Figure ABCDEF has AB = BC = CD = DE. A B C D E F Redraw the figure and show how you could split it into: a two congruent shapes b three congruent shapes c four congruent shapes Congruent triangles Triangles are congruent to each other if the following conditions are true. 110° 110° 3 cm 3 cm 6 cm 6 cm Two sides and the included angle (this is the angle that sits between the two given sides) are equal. This is remembered as SAS – Side Angle Side. 12 cm 14 cm 13 cm 13 cm 12 cm 14 cm There are three pairs of equal sides. Remember this as SSS – Side Side Side. 8 cm 8 cm Two angles and the included side (the included side is the side that is placed between the two angles) are equal. Remember this as ASA – Angle Side Angle. 5 cm 5 cm 13 cm 13 cm If you have right-angled triangles, the angle does not need to be included for the triangles to be congruent. The triangles must have the same length of hypotenuse and one other side equal. Remember this as RHS – Right-angle Side Hypotenuse. If any one of these conditions is satisfied then you have two congruent triangles. e s s - R e v i e w C o p y - C a m b r i d g e U n i v e r s i t y P r e s s - R e v i e w C o p y R e v i e w C o p y - C a m b r i d g e U n i v e r s i t y P r e s s - R e v i e w C o p y R e v i e w C o p y - C a m b r i d g e U n i v e r s i t y P r e s s - R e v i e w C o p y R e v i e w C o p y - C a m b r i d g e U n i v e r s i t y Copyright Material - Review Only - Not for Redistribution
- 257. Unit 3: Shape, space and measures 247 11 Pythagoras’ theorem and similar shapes E Worked example 16 For each of the following pairs of triangles, show that they are congruent. a 53° 49.24 cm 62.65 cm 53° 49.24 cm 62.65 cm P R V S T Q a Length PQ = Length ST PQ̂R = ST̂V Length QR = Length TV So the condition is SAS and the triangles are congruent. b 12 m 7 m 7 m 12 m 9 m 9 m b There are three pairs of equal sides. So the condition is SSS and the triangles are congruent. c 29° 29° A B C D P c Angle BAP = CDP (both are right angles) Angle AP = PD (given on diagram) Angle APB = CPD (vertically opposite) So the condition is ASA and the triangles are congruent. d 19.1 m 83° 50° 19.1 m 83° 50° A B C X Y Z d Angle BAC = YXZ = 83° Angle BCA = ZYX = 50° Angle ABC = XZY = 47° (angles in a triangle) Length AB = Length XZ So the condition is ASA and the triangles are congruent. Exercise 11.8 For each question show that the pair of shapes are congruent to one another. Explain each answer carefully and state clearly which of SAS, SSS, ASA or RHS you have used. 1 5.6 m 6.3 m 7.1 m 5.6 m 6.3 m 7.1 m A B C P Q R e s s - R e v i e w C o p y - C a m b r i d g e U n i v e r s i t y P r e s s - R e v i e w C o p y R e v i e w C o p y - C a m b r i d g e U n i v e r s i t y P r e s s - R e v i e w C o p y R e v i e w C o p y - C a m b r i d g e U n i v e r s i t y P r e s s - R e v i e w C o p y R e v i e w C o p y - C a m b r i d g e U n i v e r s i t y Copyright Material - Review Only - Not for Redistribution
- 258. Unit 3: Shape, space and measures Cambridge IGCSE Mathematics 248 E 2 6.3 m 6.3 m 76° 76° 51° 51° A B C P Q R 3 35° 35° 67 km 67 km A B C P Q R 4 4 cm 4 cm 3 cm 3 cm 5 cm 5 cm A Q B C P R 5 2.18 m 6.44 m 75° 2.18 m 6.44 m 75° 6 38 cm 38 cm 27° 27° A Q P R B C e s s - R e v i e w C o p y - C a m b r i d g e U n i v e r s i t y P r e s s - R e v i e w C o p y R e v i e w C o p y - C a m b r i d g e U n i v e r s i t y P r e s s - R e v i e w C o p y R e v i e w C o p y - C a m b r i d g e U n i v e r s i t y P r e s s - R e v i e w C o p y R e v i e w C o p y - C a m b r i d g e U n i v e r s i t y Copyright Material - Review Only - Not for Redistribution
- 259. Unit 3: Shape, space and measures 249 11 Pythagoras’ theorem and similar shapes E 7 38° 38° 11 cm 11 cm 12 cm 12 cm A Q P R B C 8 43° 43° 12.6 m 12.6 m A B C Q P R 9 In the figure, PR = SU and RTUQ is a kite. Prove that triangle PQR is congruent to triangle SQU. P S T R U Q 10 In the diagram, AM = BM and PM = QM. Prove that AP // QB. P A Q B M 11 Two airstrips PQ and MN bisect each other at O, as shown in the diagram. N M Q O P Prove that PM = NQ e s s - R e v i e w C o p y - C a m b r i d g e U n i v e r s i t y P r e s s - R e v i e w C o p y R e v i e w C o p y - C a m b r i d g e U n i v e r s i t y P r e s s - R e v i e w C o p y R e v i e w C o p y - C a m b r i d g e U n i v e r s i t y P r e s s - R e v i e w C o p y R e v i e w C o p y - C a m b r i d g e U n i v e r s i t y Copyright Material - Review Only - Not for Redistribution
- 260. Unit 3: Shape, space and measures Cambridge IGCSE Mathematics 250 Summary Do you know the following? • The longest side of a right-angled triangle is called the hypotenuse. • The square of the hypotenuse is equal to the sum of the squares of the two shorter sides of the triangle. • Similar shapes have equal corresponding angles and the ratios of corresponding sides are equal. • If shapes are similar and the lengths of one shape are multiplied by a scale factor of n: - then the areas are multiplied by a scale factor of n2 - and the volumes are multiplied by a scale factor of n3 . • Congruent shapes are exactly equal to each other. • There are four sets of conditions that can be used to test for congruency in triangles. If one set of conditions is true, the triangles are congruent. Are you able to …? • use Pythagoras’ theorem to find an unknown side of a right-angled triangle • use Pythagoras’ theorem to solve real-life problems • decide whether or not two objects are mathematically similar • use the fact that two objects are similar to calculate: - unknown lengths - areas or volumes • decide whether or not two shapes are congruent. • test for congruency in triangles. 12 A B C E F D Triangle FAB is congruent to triangle FED. Prove that BFDC is a kite. E E E E e s s - R e v i e w C o p y - C a m b r i d g e U n i v e r s i t y P r e s s - R e v i e w C o p y R e v i e w C o p y - C a m b r i d g e U n i v e r s i t y P r e s s - R e v i e w C o p y R e v i e w C o p y - C a m b r i d g e U n i v e r s i t y P r e s s - R e v i e w C o p y R e v i e w C o p y - C a m b r i d g e U n i v e r s i t y Copyright Material - Review Only - Not for Redistribution
- 261. 251 Unit 3: Shape, space and measures Examination practice Exam-style questions 1 Mohamed takes a short cut from his home (H) to the bus stop (B) along a footpath HB. How much further would it be for Mohamed to walk to the bus stop by going from H to the corner (C) and then from C to B? Give your answer in metres. 521 m 350 m C H B 2 A ladder is standing on horizontal ground and rests against a vertical wall. The ladder is 4.5m long and its foot is 1.6m from the wall. Calculate how far up the wall the ladder will reach. Give your answer correct to 3 significant figures. 1.6 m 4.5 m 3 A rectangular box has a base with internal dimensions 21cm by 28cm, and an internal height of 12cm. Calculate the length of the longest straight thin rod that will fit: a on the base of the box b in the box. 28 cm 21 cm 12 cm A B C D 4 24x cm 7x cm 150 cm NOT TO SCALE The right-angled triangle in the diagram has sides of length 7x cm , 24x cm and 150cm. a Show that x2 = 36 b Calculate the perimeter of the triangle. E e s s - R e v i e w C o p y - C a m b r i d g e U n i v e r s i t y P r e s s - R e v i e w C o p y R e v i e w C o p y - C a m b r i d g e U n i v e r s i t y P r e s s - R e v i e w C o p y R e v i e w C o p y - C a m b r i d g e U n i v e r s i t y P r e s s - R e v i e w C o p y R e v i e w C o p y - C a m b r i d g e U n i v e r s i t y Copyright Material - Review Only - Not for Redistribution
- 262. Unit 3: Shape, space and measures 252 E Past paper questions 1 5 cm 8 cm x cm NOT TO SCALE Calculate the value of x. [3] [Cambridge IGCSE Mathematics 0580 Paper 22 Q11 October/November 2015] 2 NOT TO SCALE The two containers are mathematically similar in shape. The larger container has a volume of 3456cm3 and a surface area of 1024cm2 . The smaller container has a volume of 1458cm3 . Calculate the surface area of the smaller container. [4] [Cambridge IGCSE Mathematics 0580 Paper 22 Q18 May/June 2014] 3 25 cm x cm 15 cm 7.2 cm NOT TO SCALE The diagram shows two jugs that are mathematically similar. Find the value of x. [2] [Cambridge IGCSE Mathematics 0580 Paper 22 Q21 October/November 2015] e s s - R e v i e w C o p y - C a m b r i d g e U n i v e r s i t y P r e s s - R e v i e w C o p y R e v i e w C o p y - C a m b r i d g e U n i v e r s i t y P r e s s - R e v i e w C o p y R e v i e w C o p y - C a m b r i d g e U n i v e r s i t y P r e s s - R e v i e w C o p y R e v i e w C o p y - C a m b r i d g e U n i v e r s i t y Copyright Material - Review Only - Not for Redistribution
- 263. Unit 3: Data handling 253 When you are asked to interpret data and draw conclusions you need to think carefully and to look at more than one element of the data. For example, if a student has a mean mark of 70% overall, you could conclude that the student is doing well. However if the student is getting 90% for three subjects and 40% for the other two, then that conclusion is not sound. Similarly, if the number of bullying incidents in a school goes down after a talk about bullying, it could mean the talk was effective, but it could also mean that the reporting of incidents went down (perhaps because the bullies threatened worse bullying if they were reported). It is important to remember the following: Correlation is not the same as causation. For example, if a company’s social media account suddenly gets lots of followers and at the same time their sales in a mall increase, they may (mistakenly) think the one event caused the other. Sometimes we only use the data that confirms our own biases (this is called confirmation bias). For example, if you were asked whether a marketing campaign to get more followers was successful and the data showed that more people followed you on Instagram, but there was no increase in your Facebook following, you could use the one data set to argue that the campaign was successful, especially if you believed it was. Sometimes you need to summarise data to make sense of it. You do not always need to draw a diagram; instead you can calculate numerical summaries of average and spread. Numerical summaries can be very useful for comparing different sets of data but, as with all statistics, you must be careful when interpreting the results. • Average • Mode • Mean • Spread • Median • Range • Discrete • Continuous • Grouped data • Estimated mean • Modal class • Percentiles • Upper quartile • Lower quartile • Interquartile range • Box-and-whisker plot Key words ACHIEVE ABOVE THE AVERAGE CHILDREN REQUIRED TO THE SUM The newspaper headline is just one example of a situation in which statistics have been badly misunderstood. It is important to make sure that you fully understand the statistics before you use it to make any kind of statement! EXTENDED In this chapter you will learn how to: • calculate the mean, median and mode of sets of data • calculate and interpret the range as a measure of spread • interpret the meaning of each result and compare data using these measures • construct and use frequency distribution tables for grouped data • identify the class that contains the median of grouped data • calculate and work with quartiles • divide data into quartiles and calculate the interquartile range • identify the modal class from a grouped frequency distribution. • Construct and interpret box- and-whisker plots. Chapter 12: Averages and measures of spread e s s - R e v i e w C o p y - C a m b r i d g e U n i v e r s i t y P r e s s - R e v i e w C o p y R e v i e w C o p y - C a m b r i d g e U n i v e r s i t y P r e s s - R e v i e w C o p y R e v i e w C o p y - C a m b r i d g e U n i v e r s i t y P r e s s - R e v i e w C o p y R e v i e w C o p y - C a m b r i d g e U n i v e r s i t y Copyright Material - Review Only - Not for Redistribution
- 264. Unit 3: Data handling Cambridge IGCSE Mathematics 254 12.1 Different types of average An average is a single value used to represent a set of data. There are three types of average used in statistics and the following shows how each can be calculated. The shoe sizes of 19 students in a class are shown below: 4 7 6 6 7 4 8 3 8 11 6 8 6 3 5 6 7 6 4 How would you describe the shoe sizes in this class? If you count how many size fours, how many size fives and so on, you will find that the most common (most frequent) shoe size in the class is six. This average is called the mode. What most people think of as the average is the value you get when you add up all the shoe sizes and divide your answer by the number of students: total of shoe sizes number of students d.p. = = = = 115 19 6 05 2 . ( 6 0 . ( 6 05 2 . ( 5 2 ) This average is called the mean. The mean value tells you that the shoe sizes appear to be spread in some way around the value 6.05. It also gives you a good impression of the general ‘size’ of the data. Notice that the value of the mean, in this case, is not a possible shoe size. The mean is sometimes referred to as the measure of ‘central tendency’ of the data. Another measure of central tendency is the middle value when the shoe sizes are arranged in ascending order. 3 3 4 4 4 5 6 6 6 6 6 6 7 7 7 8 8 8 11 Tip There is more than one ‘average’, so you should never refer to the average. Always specify which average you are talking about: the mean, median or mode. If you take the mean of n items and multiply it by n, you get the total of all n values. RECAP You should already be familiar with the following data handling work: Averages (Year 9 Mathematics) Mode − value that appears most often Median − middle value when data is arranged in ascending order Mean − sum of values number of values For the data set: 3, 4, 5, 6, 6, 10, 11, 12, 12, 12, 18 Mode = 12 Median = 10 Mean = 3 4 5 6 6 10 11 12 12 12 18 11 99 11 9 + + 3 4 + + 3 4 + + + 5 6 + + + 5 6 6 1 + + + 6 10 1 0 1 + + + + 1 1 + + + + 1 12 1 + + + + 2 12 1 + + + + 2 12 1 + + + + 2 1 = = = = Stem and leaf diagram (Chapter 4) 7 8 9 10 Back-to-back data set Ordered Leaves Ordered from Stem 9 0 1 2 3 7 4 4 8 9 2 3 7 4 3 9 8 7 2 1 0 9 9 3 1 1 Class A Class B Stem Class A Class B Key 7 | 9 = 79 3 | 7 = 73 Geographers use averages to summarise numerical results for large populations. This saves them from having to show every piece of numerical data that has been collected! LINK e s s - R e v i e w C o p y - C a m b r i d g e U n i v e r s i t y P r e s s - R e v i e w C o p y R e v i e w C o p y - C a m b r i d g e U n i v e r s i t y P r e s s - R e v i e w C o p y R e v i e w C o p y - C a m b r i d g e U n i v e r s i t y P r e s s - R e v i e w C o p y R e v i e w C o p y - C a m b r i d g e U n i v e r s i t y Copyright Material - Review Only - Not for Redistribution
- 265. Unit 3: Data handling 255 12 Averages and measures of spread If you now think of the first and last values as one pair, the second and second to last as another pair, and so on, you can cross these numbers off and you will be left with a single value in the middle. 3 3 3 3 3 3 4 4 4 4 4 4 4 4 4 4 4 4 5 5 6 6 6 6 6 6 6 6 6 6 6 6 6 6 7 6 6 7 6 6 7 6 6 7 7 7 8 7 7 8 7 7 8 7 7 8 8 8 8 8 8 8 11 11 This middle value, (in this case six), is known as the median. Crossing off the numbers from each end can be cumbersome if you have a lot of data. You may have noticed that, counting from the left, the median is the 10th value. Adding one to the number of students and dividing the result by two, ( ) ( ) 19 ( ) ( ) ( ) 2 ( ) ( ), also gives 10 as the median position. What if there had been 20 students in the class? For example, add an extra student with a shoe size of 11. Crossing off pairs gives this result: 3 3 3 3 3 3 4 4 4 4 4 4 4 4 4 4 4 4 5 5 6 6 6 6 6 6 6 6 6 6 6 6 6 6 6 7 6 7 6 7 7 7 8 7 7 8 7 7 8 7 7 8 8 8 8 8 8 8 11 11 11 11 You are left with a middle pair rather than a single value. If this happens then you simply find the mean of this middle pair: ( ) ( ) 6 6 ( ) 2 6 ( ) 6 6 ( ) 6 6 = . Notice that the position of the first value in this middle pair is 20 2 10 = . Adding an extra size 11 has not changed the median or mode in this example, but what will have happened to the mean? In summary: Mode The value that appears in your list more than any other. There can be more than one mode but if there are no values that occur more often than any other then there is no mode. Mean total of all data number of values . The mean may not be one of the actual data values. Median 1. Arrange the data into ascending numerical order. 2. If the number of data is n and n is odd, find n+1 2 and this will give you the position of the median. 3. If n is even, then calculate n 2 and this will give you the position of the first of the middle pair. Find the mean of this pair. Dealing with extreme values Sometimes you may find that your collection of data contains values that are extreme in some way. For example, if you were to measure the speeds of cars as they pass a certain point you may find that some cars are moving unusually slowly or unusually quickly. It is also possible that you may have made a mistake and measured a speed incorrectly, or just written the wrong numbers down! Suppose the following are speeds of cars passing a particular house over a five minute period (measured in kilometres per hour): 67.2 58.3 128.9 65.0 49.0 55.7 One particular value will catch your eye immediately. 128.9km/h seems somewhat faster than any other car. How does this extreme value affect your averages? You can check yourself that the mean of the above data including the extreme value is 70.7km/h. This is larger than all but one of the values and is not representative. Under these circumstances the mean can be a poor choice of average. If you discover that the highest speed was a mistake, you can exclude it from the calculation and get the much more realistic value of 59.0km/h (try the calculation for yourself). Tip You could be asked to give reasons for choosing the mean or median as your average. e s s - R e v i e w C o p y - C a m b r i d g e U n i v e r s i t y P r e s s - R e v i e w C o p y R e v i e w C o p y - C a m b r i d g e U n i v e r s i t y P r e s s - R e v i e w C o p y R e v i e w C o p y - C a m b r i d g e U n i v e r s i t y P r e s s - R e v i e w C o p y R e v i e w C o p y - C a m b r i d g e U n i v e r s i t y Copyright Material - Review Only - Not for Redistribution
- 266. Unit 3: Data handling Cambridge IGCSE Mathematics 256 If the extreme value is genuine and cannot be excluded, then the median will give you a better impression of the main body of data. Writing the data in rank order: 49.0 55.7 58.3 65.0 67.2 128.9 The median is the mean of 58.3 and 65.0, which is 61.7. Notice that the median reduces to 58.3 if you remove the highest value, so this doesn’t change things a great deal. There is no mode for these data. As there is an even number of speeds’, the median is the mean of the 3rd and 4th data points. Worked example 1 After six tests, Graham has a mean average score of 48. He takes a seventh test and scores 83 for that test. a What is Graham’s total score after six tests? b What is Graham’s mean average score after seven tests? a Since mean total of all data number of values = then, total of all data mean number of values = × mean = × = × = 48 = × 48 = × 6 288 b Total of all seven scores total of first six plus sevent = h h = + = 288 = + 288 = + 83 371 mean = = = = 371 7 53 Exercise 12.1 1 For each of the following data sets calculate: i the mode ii the median iii the mean. a 12 2 5 6 9 3 12 13 10 b 5 9 7 3 8 2 5 8 8 2 c 2.1 3.8 2.4 7.6 8.2 3.4 5.6 8.2 4.5 2.1 d 12 2 5 6 9 3 12 13 43 2 Look carefully at the lists of values in parts (a) and (d) above. What is different? How did your mean, median and mode change? 3 Andrew and Barbara decide to investigate their television watching patterns and record the number of minutes that they watch the television for 8 days: Andrew: 38 10 65 43 125 225 128 40 Barbara: 25 15 10 65 90 300 254 32 a Find the median number of minutes spent watching television for each of Andrew and Barbara. b Find the mean number of minutes spent watching television for each of Andrew and Barbara. 4 Find a list of five numbers with a mean that is larger than all but one of the numbers. Tip This is good example of where you need to think before you conclude that Graham is an average student (scoring 53%). He may have had extra tuition and will get above 80% for all future tests. e s s - R e v i e w C o p y - C a m b r i d g e U n i v e r s i t y P r e s s - R e v i e w C o p y R e v i e w C o p y - C a m b r i d g e U n i v e r s i t y P r e s s - R e v i e w C o p y R e v i e w C o p y - C a m b r i d g e U n i v e r s i t y P r e s s - R e v i e w C o p y R e v i e w C o p y - C a m b r i d g e U n i v e r s i t y Copyright Material - Review Only - Not for Redistribution
- 267. Unit 3: Data handling 257 12 Averages and measures of spread 5 A keen ten pin bowler plays five rounds in one evening. His scores are 98, 64, 103, 108 and 109. Which average (mode, mean or median) will he choose to report to his friends at the end of the evening? Explain your answer carefully, showing all your calculations clearly. 6 If the mean height of 31 children is 143.6cm, calculate the sum of the heights used to calculate the mean. 7 The mean mass of 12 bags of potatoes is 2.4kg. If a 13th bag containing 2.2kg of potatoes is included, what would the new mean mass of the 13 bags be? 8 The mean temperature of 10 cups of coffee is 89.6°C. The mean temperature of a different collection of 20 cups of coffee is 92.1°C. What is the mean temperature of all 30 cups of coffee? 9 Find a set of five numbers with mean five, median four and mode four. 10 Find a set of five different whole numbers with mean five and median four. 11 The mean mass of a group of m boys is X kg and the mean mass of a group of n girls is Y kg. Find the mean mass of all of the children combined. 12.2 Making comparisons using averages and ranges Having found a value to represent your data (an average) you can now compare two or more sets of data. However, just comparing the averages can sometimes be misleading. It can be helpful to know how consistent the data is and you do this by thinking about how spread out the values are. A simple measure of spread is the range. Range = largest value − smallest value The larger the range, the more spread out the data is and the less consistent the values are with one another. Worked example 2 Worked example 2 Two groups of athletes want to compare their 100m sprint times. Each person runs once and records his or her time as shown (in seconds). Team Pythagoras 14.3 16.6 14.3 17.9 14.1 15.7 Team Socrates 13.2 16.8 14.7 14.7 13.6 16.2 a Calculate the mean 100m time for each team. b Which is the smaller mean? c What does this tell you about the 100m times for Team Pythagoras in comparison with those for Team Socrates? d Calculate the range for each team. e What does this tell you about the performance of each team? a Team Pythagoras: Mean = 14 3 16 6 14 3 17 9 14 1 15 7 6 92 9 6 15 48 . . 3 1 . . 6 6 . . 6 6 . . 3 1 . . 7 9 . . 7 9 . . 1 1 . . 5 7 . . 5 7 . . + + 3 1 + + 3 16 6 + + . . + + 3 1 . . + + 3 1 . . 6 6 . . 6 6 + + . . + + 3 1 + + 3 17 9 + + . . + + 3 1 . . + + 3 1 . . 7 9 . . 7 9 + + . . 1 1 1 1 1 1 . . 1 1 . . = = = = seconds Team Socrates: Mean = 13 2 16 8 14 7 14 7 13 6 16 2 6 89 2 6 14 87 . . 2 1 . . 6 8 . . 6 8 . . . 7 1 . . . 4 7 . . . 4 7 13 . . . . . 6 2 . . 6 2 89 . . . 2 1 2 1 2 1 . . 2 1 . . + + + 14 + + + 7 1 + + + 7 14 7 + + + . . . + + + . . . 7 1 . . . + + + 7 1 . . . 4 7 . . . 4 7 + + + . . .6 1 6 1 = = = = seconds Tip Think about confirmation bias and how the player might ignore data that doesn’t support his claim to be a good player. e s s - R e v i e w C o p y - C a m b r i d g e U n i v e r s i t y P r e s s - R e v i e w C o p y R e v i e w C o p y - C a m b r i d g e U n i v e r s i t y P r e s s - R e v i e w C o p y R e v i e w C o p y - C a m b r i d g e U n i v e r s i t y P r e s s - R e v i e w C o p y R e v i e w C o p y - C a m b r i d g e U n i v e r s i t y Copyright Material - Review Only - Not for Redistribution
- 268. Unit 3: Data handling Cambridge IGCSE Mathematics 258 Tip When comparing means or ranges, make sure that you refer to the original context of the question. Exercise 12.2 1 Two friends, Ricky and Oliver, are picking berries. Each time they fill a carton its mass, in kg, is recorded. The masses are shown below: Ricky 0.145 0.182 0.135 0.132 0.112 0.155 0.189 0.132 0.145 0.201 0.139 Oliver 0.131 0.143 0.134 0.145 0.132 0.123 0.182 0.134 0.128 a For each boy calculate: i the mean mass of berries collected per box ii the range of masses. b Which boy collected more berries per load? c Which boy was more consistent when collecting the berries? 2 The marks obtained by two classes in a Mathematics test are show below. The marks are out of 20. Class Archimedes 12 13 4 19 20 12 13 13 16 18 12 Class Bernoulli 13 6 9 15 20 20 13 15 17 19 3 a Calculate the median score for each class. b Find the range of scores for each class. c Which class did better in the test overall? d Which class was more consistent? 3 Three shops sell light bulbs. A sample of 100 light bulbs is taken from each shop and the working life of each is measured in hours. The following table shows the mean time and range for each shop: Shop Mean (hours) Range (hours) Brightlights 136 18 Footlights 145 36 Backlights 143 18 Which shop would you recommend to someone who is looking to buy a new light bulb and why? 12.3 Calculating averages and ranges for frequency data So far, the lists of data that you have calculated averages for have been quite small. Once you start to get more than 20 pieces of data it is better to collect the data with the same value together and record it in a table. Such a table is known as a frequency distribution table or just a frequency distribution. b Team Socrates have the smaller mean 100m time. c The smaller time means that Team Socrates are slightly faster as a team than Team Pythagoras. d Team Pythagoras’ range = 17.9 – 14.1 = 3.8 seconds Team Socrates’ range = 16.8 – 13.2 = 3.6 seconds e Team Socrates are slightly faster as a whole and they are slightly more consistent. This suggests that their team performance is not improved significantly by one or two fast individuals but rather all team members run at more or less similar speeds. Team Pythagoras is less consistent and so their mean is improved by individuals. e s s - R e v i e w C o p y - C a m b r i d g e U n i v e r s i t y P r e s s - R e v i e w C o p y R e v i e w C o p y - C a m b r i d g e U n i v e r s i t y P r e s s - R e v i e w C o p y R e v i e w C o p y - C a m b r i d g e U n i v e r s i t y P r e s s - R e v i e w C o p y R e v i e w C o p y - C a m b r i d g e U n i v e r s i t y Copyright Material - Review Only - Not for Redistribution
- 269. Unit 3: Data handling 259 12 Averages and measures of spread Data shown in a frequency distribution table If you throw a single die 100 times, each of the six numbers will appear several times. You can record the number of times that each appears like this: Number showing on the upper face 1 2 3 4 5 6 Frequency 16 13 14 17 19 21 Mean You need to find the total of all 100 throws. Sixteen 1s appeared giving a sub-total of 1 × 16 = 16, thirteen 2s appeared giving a sub-total of 13 × 2 = 26 and so on. You can extend your table to show this: Number showing on the upper face Frequency Frequency × number on the upper face 1 16 1 × 16 = 16 2 13 2 × 13 = 26 3 14 3 × 14 = 42 4 17 17 × 4 = 68 5 19 19 × 5 = 95 6 21 21 × 6 = 126 The total of all 100 die throws is the sum of all values in this third column: = + + + + + = 16 = + 16 = + 26 42 + + 42 + + 68 95 + + 95 + +126 373 So the mean score per throw = = = = = total score total number of throws 373 100 3 73 3 7 3 7 Median There are 100 throws, which is an even number, so the median will be the mean of a middle pair. The first of this middle pair will be found in position 100 2 50 = The table has placed all the values in order. The first 16 are ones, the next 13 are twos and so on. Notice that adding the first three frequencies gives 16 + 13 + 14 = 43. This means that the first 43 values are 1, 2 or 3. The next 17 values are all 4s, so the 50th and 51st values will both be 4. The mean of both 4s is 4, so this is the median. Mode For the mode you simply need to find the die value that has the highest frequency. The number 6 occurs most often (21 times), so 6 is the mode. Range The highest and lowest values are known, so the range is 6 − 1 = 5 Data organised into a stem and leaf diagram You can determine averages and the range from stem and leaf diagrams. Tip You can add columns to a table given to you! It will help you to organise your calculations clearly. Sometimes you will need to retrieve the data from a diagram like a bar chart or a pictogram and then calculate a mean. These charts were studied in chapter 4. REWIND e s s - R e v i e w C o p y - C a m b r i d g e U n i v e r s i t y P r e s s - R e v i e w C o p y R e v i e w C o p y - C a m b r i d g e U n i v e r s i t y P r e s s - R e v i e w C o p y R e v i e w C o p y - C a m b r i d g e U n i v e r s i t y P r e s s - R e v i e w C o p y R e v i e w C o p y - C a m b r i d g e U n i v e r s i t y Copyright Material - Review Only - Not for Redistribution
- 270. Unit 3: Data handling Cambridge IGCSE Mathematics 260 Mean As a stem and leaf diagram shows all the data values, the mean is found by adding all the values and dividing them by the number of values in the same way you would find the mean of any data set. Median You can use an ordered stem and leaf diagram to determine the median. An ordered stem and leaf diagram has the leaves for each stem arranged in order from smallest to greatest. Mode An ordered stem and leaf diagram allows you see which values are repeated in each row. You can compare these to determine the mode. Range In an ordered stem and leaf diagram, the first value and the last value can be used to find the range. Worked example 3 Worked example 3 The ordered stem and leaf diagram shows the number of customers served at a supermarket checkout every half hour during an 8-hour shift. Key 0 | 2 = 2 customers 0 1 2 2 5 5 6 6 6 6 1 3 3 5 5 6 7 7 1 Leaf Stem a What is the range of customers served? b What is the modal number of customers served? c Determine the median number of customers served. d How many customers were served altogether during this shift? e Calculate the mean number of customers served every half hour. a The lowest number is 2 and the highest number is 21. The range is 21 – 2 = 19 customers. b 6 is the value that appears most often. c There are 16 pieces of data, so the median is the mean of the 8th and 9th values. ( ) 11 13 2 24 2 12 + = = d To calculate this, find the sum of all the values. Find the total for each row and then combine these to find the overall total. Row 1: 2 + 5 + 5 + 6 + 6 + 6 + 6 = 36 Row 2: 11 + 13 + 13 + 15 + 15 + 16 + 17 + 17 = 117 Row 3: 21 36 + 117 + 21 = 174 customers in total e Mean = sum of data values number of data values = 174 16 = 10.875 customers per half hour. e s s - R e v i e w C o p y - C a m b r i d g e U n i v e r s i t y P r e s s - R e v i e w C o p y R e v i e w C o p y - C a m b r i d g e U n i v e r s i t y P r e s s - R e v i e w C o p y R e v i e w C o p y - C a m b r i d g e U n i v e r s i t y P r e s s - R e v i e w C o p y R e v i e w C o p y - C a m b r i d g e U n i v e r s i t y Copyright Material - Review Only - Not for Redistribution
- 271. Unit 3: Data handling 261 12 Averages and measures of spread In summary: • Mode The value that has the highest frequency will be the mode. If more than one value has the same highest frequency then there is no single mode. • Mean total of all data number of values sum of frequency value to = × ta t ta t l frequency (Remember to extend the table so that you can fill in a column for calculating frequency × value in each case.) • Median – If the number of data is n and n is odd, find n+1 2 and this will give you the position of the median. – If n is even, then calculate n 2 and this will give you the position of the first of the middle pair. Find the mean of this pair. – Add the frequencies in turn until you find the value whose frequency makes you exceed (or equal) the value from one or two above. This is the median. Exercise 12.3 1 Construct a frequency table for the following data and calculate: a the mean b the median c the mode d the range. 3 4 5 1 2 8 9 6 5 3 2 1 6 4 7 8 1 1 5 5 2 3 4 5 7 8 3 4 2 5 1 9 4 5 6 7 8 9 2 1 5 4 3 4 5 6 1 4 4 8 2 Tickets for a circus were sold at the following prices: 180 at $6.50 each, 215 at $8 each and 124 at $10 each. a Present this information in a frequency table. b Calculate the mean price of tickets sold (give your answer to 3 significant figures). 3 A man kept count of the number of letters he received each day over a period of 60 days. The results are shown in the table below. Number of letters per day 0 1 2 3 4 5 Frequency 28 21 6 3 1 1 For this distribution, find: a the mode b the median c the mean d the range. 4 A survey of the number of children in 100 families gave the following distribution: Number of children in family 0 1 2 3 4 5 6 7 Number of families 4 36 27 21 5 4 2 1 For this distribution, find: a the mode b the median c the mean. 5 The distribution of marks obtained by the students in a class is shown in the table below. Mark obtained 0 1 2 3 4 5 6 7 8 9 10 Number of students 1 0 3 2 2 4 3 4 6 3 2 e s s - R e v i e w C o p y - C a m b r i d g e U n i v e r s i t y P r e s s - R e v i e w C o p y R e v i e w C o p y - C a m b r i d g e U n i v e r s i t y P r e s s - R e v i e w C o p y R e v i e w C o p y - C a m b r i d g e U n i v e r s i t y P r e s s - R e v i e w C o p y R e v i e w C o p y - C a m b r i d g e U n i v e r s i t y Copyright Material - Review Only - Not for Redistribution
- 272. Unit 3: Data handling Cambridge IGCSE Mathematics 262 Find: a the mode b the median c the mean. d The class teacher is asked to report on her class’s performance and wants to show them to be doing as well as possible. Which average should she include in her report and why? 6 The masses of 20 soccer players were measured to the nearest kilogram and this stem and leaf diagram was produced. Key 4 | 6 = 46 kilograms 4 5 5 6 6 7 6 4 0 0 7 8 9 5 3 0 1 1 3 2 6 8 6 9 4 0 Leaf Stem a Redraw the stem and leaf diagram to make an ordered data set. b How many players have a mass of 60 kilograms or more? c Why is the mode not a useful statistic for this data? d What is the range of masses? e What is the median mass of the players? 7 The number of electronic components produced by a machine every hour over a 24-period is: 143, 128, 121, 126, 134, 150, 128, 132, 140, 131, 146, 128 133, 138, 140, 125, 142, 129, 136, 130, 133, 142, 126, 129 a Using two intervals for each stem, draw an ordered stem and leaf diagram of the data. b Determine the range of the data. c Find the median. 12.4 Calculating averages and ranges for grouped continuous data Some data is discrete and can only take on certain values. For example, if you throw an ordinary die then you can only get one of the numbers 1, 2, 3, 4, 5 or 6. If you count the number of red cars in a car park then the result can only be a whole number. Some data is continuous and can take on any value in a given range. For example, heights of people, or the temperature of a liquid, are continuous measurements. Continuous data can be difficult to process effectively unless it is summarised. For instance, if you measure the heights of 100 children you could end up with 100 different results. You can group the data into frequency tables to make the process more manageable – this is now grouped data. The groups (or classes) can be written using inequality symbols. For example, if you want to create a class for heights (hcm) between 120cm and 130cm you could write: 120 h 130 This means that h is greater than or equal to 120 but strictly less than 130. The next class could be: 130 h 140 Notice that 130 is not included in the first class but is included in the second. This is to avoid any confusion over where to put values at the boundaries. E e s s - R e v i e w C o p y - C a m b r i d g e U n i v e r s i t y P r e s s - R e v i e w C o p y R e v i e w C o p y - C a m b r i d g e U n i v e r s i t y P r e s s - R e v i e w C o p y R e v i e w C o p y - C a m b r i d g e U n i v e r s i t y P r e s s - R e v i e w C o p y R e v i e w C o p y - C a m b r i d g e U n i v e r s i t y Copyright Material - Review Only - Not for Redistribution
- 273. Unit 3: Data handling 263 12 Averages and measures of spread Tip You may be asked to explain why your calculations only give an estimate. Remember that you don’t have the exact data, only frequencies and classes. Worked example 4 The heights of 100 children were measured in cm and the results recorded in the table below: Height in cm (h) Frequency (f) 120 h 130 12 130 h 140 16 140 h 150 38 150 h 160 24 160 h 170 10 Find an estimate for the mean height of the children, the modal class, the median class and an estimate for the range. None of the children’s heights are known exactly, so you use the midpoint of each group as a best estimate of the height of each child in a particular class. For example, the 12 children in the 120 h 130 class have heights that lie between 120cm and 130cm, and that is all that you know. Halfway between 120cm and 130cm is ( ) ( ) 120 ( ) ( ) 130 ( ) 2 125 ( ) ( ) = cm. A good estimate of the total height of the 12 children in this class is 12 × 125 (= frequency × midpoint). So, extend your table to include midpoints and then totals for each class: Height in cm (h) Frequency (f) Midpoint Frequency × midpoint 120 h 130 12 125 12 × 125 = 1500 130 h 140 16 135 16 × 135 = 2160 140 h 150 38 145 38 × 145 = 5510 150 h 160 24 155 24 × 155 = 3720 160 h 170 10 165 10 × 165 = 1650 An estimate for the mean height of the children is then: 1500 2160 5510 3720 1650 12 16 38 24 10 14540 100 145 4 + + + + 5510 + + + 3720 + + + + + 16 + + + + 24 + + = = = = . c 4 . cm To find the median class you need to find where the 50th and 51st tallest children would be placed. Notice that the first two frequencies add to give 28, meaning that the 28th child in an ordered list of heights would be the tallest in the 130 h 140 class. The total of the first three frequencies is 66, meaning that the 50th child will be somewhere in the 140 h 150 class. This then, makes 140 h 150 the median class. The class with the highest frequency is the modal class. In this case it is the same class as the median class: 140 h 150. The shortest child could be as small as 120cm and the tallest could be as tall as 170cm. The best estimate of the range is, therefore, 170 − 120 = 50cm. The following worked example shows how a grouped frequency table is used to find the estimated mean and range, and also to find the modal class and the median classes (i.e. the classes in which the mode and median lie). E e s s - R e v i e w C o p y - C a m b r i d g e U n i v e r s i t y P r e s s - R e v i e w C o p y R e v i e w C o p y - C a m b r i d g e U n i v e r s i t y P r e s s - R e v i e w C o p y R e v i e w C o p y - C a m b r i d g e U n i v e r s i t y P r e s s - R e v i e w C o p y R e v i e w C o p y - C a m b r i d g e U n i v e r s i t y Copyright Material - Review Only - Not for Redistribution
- 274. Unit 3: Data handling Cambridge IGCSE Mathematics 264 Exercise 12.4 1 The table shows the heights of 50 sculptures in an art gallery. Find an estimate for the mean height of the sculptures. Heights (hcm) Frequency (f) 130 h 135 7 135 h 140 13 140 h 145 15 145 h 150 11 150 h 155 4 Total ∑f = 50 2 The table shows the lengths of 100 telephone calls. Time (t minutes) Frequency (f ) 0 t 1 12 1 t 2 14 2 t 4 20 4 t 6 14 6 t 8 12 8 t 10 18 10 t 15 10 a Calculate an estimate for the mean time, in minutes, of a telephone call. b Write your answer in minutes and seconds, to the nearest second. 3 The table shows the temperatures of several test tubes during a Chemistry experiment. Temperature (T °C) Frequency ( f) 45 T 50 3 50 T 55 8 55 T 60 17 60 T 65 6 65 T 70 2 70 T 75 1 Calculate an estimate for the mean temperature of the test tubes. 4 Two athletics teams – the Hawks and the Eagles – are about to compete in a race. The masses of the team members are shown in the table below. Hawks Eagles Mass (Mkg) Frequency ( f ) 55 M 65 2 65 M 75 8 75 M 85 12 85 M 100 3 The symbol ∑ is the Greek letter capital ‘sigma’. It is used to mean ‘sum’. So, ∑f simply means, ‘the sum of all the frequencies’. Mass (Mkg) Frequency ( f ) 55 M 65 1 65 M 75 7 75 M 85 13 85 M 100 4 E e s s - R e v i e w C o p y - C a m b r i d g e U n i v e r s i t y P r e s s - R e v i e w C o p y R e v i e w C o p y - C a m b r i d g e U n i v e r s i t y P r e s s - R e v i e w C o p y R e v i e w C o p y - C a m b r i d g e U n i v e r s i t y P r e s s - R e v i e w C o p y R e v i e w C o p y - C a m b r i d g e U n i v e r s i t y Copyright Material - Review Only - Not for Redistribution
- 275. Unit 3: Data handling 265 12 Averages and measures of spread a Calculate an estimate for the mean mass of each team. b Calculate the range of masses of each team. c Comment on your answers for (a) and (b). 5 The table below shows the lengths of 50 pieces of wire used in a Physics laboratory. The lengths have been measured to the nearest centimetre. Find an estimate for the mean. Length 26–30 31–35 36–40 41–45 46–50 Frequency ( f ) 4 10 12 18 6 6 The table below shows the ages of the teachers in a secondary school to the nearest year. Age in years 21–30 31–35 36–40 41–45 46–50 51–65 Frequency ( f) 3 6 12 15 6 7 Calculate an estimate for the mean age of the teachers. 12.5 Percentiles and quartiles Fashkiddler’s accountancy firm is advertising for new staff to join the company and has set an entrance test to examine the ability of candidates to answer questions on statistics. In a statement on the application form the company states that, ‘All those candidates above the 80th percentile will be offered an interview.’ What does this mean? The median is a very special example of a percentile. It is placed exactly half way through a list of ordered data so that 50% of the data is smaller than the median. Positions other than the median can, however, also be useful. The tenth percentile, for example, would lie such that 10% of the data was smaller than its value. The 75th percentile would lie such that 75% of the values are smaller than its value. Quartiles Two very important percentiles are the upper and lower quartiles. These lie 25% and 75% of the way through the data respectively. Use the following rules to estimate the positions of each quartile within a set of ordered data: Q1 = lower quartile = value in position 1 4 ( ) 1 ( ) ( ) ( ) ( ) ( ) Q2 = median (as calculated earlier in the chapter) Q3 = upper quartile = value in position 3 4 ( ) 1 ( ) ( ) ( ) ( ) ( ) If the position does not turn out to be a whole number, you simply find the mean of the pair of numbers on either side. For example, if the position of the lower quartile turns out to be 5.25, then you find the mean of the 5th and 6th pair. Interquartile range As with the range, the interquartile range gives a measure of how spread out or consistent the data is. The main difference is that the interquartile range (IQR) avoids using extreme data by finding the difference between the lower and upper quartiles. You are, effectively, measuring the spread of the central 50% of the data. IQR = Q3 – Q1 If one set of data has a smaller IQR than another set, then the first set is more consistent and less spread out. This can be a useful comparison tool. Be careful when calculating the midpoints here. Someone who is just a day short of 31 will still be in the 21–30 class. What difference does this make? You will do further work with percentiles in chapter 20 when you learn about cumulative frequency curves. You will also find the solution to Fashkiddler’s problem. FAST FORWARD You will use quartiles and the interquartile range when you plot boxplots later in this chapter. FAST FORWARD E e s s - R e v i e w C o p y - C a m b r i d g e U n i v e r s i t y P r e s s - R e v i e w C o p y R e v i e w C o p y - C a m b r i d g e U n i v e r s i t y P r e s s - R e v i e w C o p y R e v i e w C o p y - C a m b r i d g e U n i v e r s i t y P r e s s - R e v i e w C o p y R e v i e w C o p y - C a m b r i d g e U n i v e r s i t y Copyright Material - Review Only - Not for Redistribution
- 276. Unit 3: Data handling Cambridge IGCSE Mathematics 266 Worked example 5 For each of the following sets of data calculate the median, upper and lower quartiles. In each case calculate the interquartile range. a 13 12 8 6 11 14 8 5 1 10 16 12 b 14 10 8 19 15 14 9 a First sort the data into ascending order. 1 5 6 8 8 10 11 12 12 13 14 16 There is an even number of items (12). So for the median, you find the value of the middle pair, the first of which is in position 12 2 6 = . So the median is ( ) . ( ) 10 ( ) ( ) 11 ( ) 2 10 5 ( ) ( ) = There are 12 items so, for the quartiles, you calculate the positions 1 4 1 3 25 ( ) 12 ( ) 1 3 ( ) 1 3. 1 3 + = 1 3 ( ) + = ( ) 1 3 ( ) 1 3 + = ( ) and 3 4 1 9 75 ( ) 12 ( ) 1 9 ( ) 1 9. 1 9 + = 1 9 ( ) + = ( ) 1 9 ( ) 1 9 + = ( ) Notice that these are not whole numbers, so the lower quartile will be the mean of the 3rd and 4th values, and the upper quartile will be the mean of the 9th and 10th values. Q1 2 7 = = ( ) 6 8 ( ) 6 8 6 8 ( ) and Q3 2 12 5 = = ( ) 12 ( ) 13 ( ) + ( ) . Thus, the IQR = 12.5 − 7 = 5.5 b The ordered data is: 8 9 10 14 14 15 19 The number of data is odd, so the median will be in position ( ) ( ) 7 1 ( ) 2 4 ( ) 7 1 ( ) 7 1 = . The median is 14. There are seven items, so calculate 1 4 2 ( ) 7 1 ( ) + = ( ) + = 7 1 ( ) + = 7 1 ( ) and 3 4 6 ( ) 7 1 ( ) + = ( ) + = 7 1 ( ) + = 7 1 ( ) These are whole numbers so the lower quartile is in position two and the upper quartile is in position six. So Q1 = 9 and Q3 = 15. IQR = 15 − 9 = 6 In chapter 20 you will learn about cumulative frequency graphs. These enable you to calculate estimates for the median when there are too many data to put into order, or when you have grouped data. FAST FORWARD Worked example 6 Two companies sell sunflower seeds. Over the period of a year, seeds from Allbright produce flowers with a median height of 98cm and IQR of 13cm. In the same year seeds from Barstows produce flowers with a median height of 95cm and IQR of 4cm. Which seeds would you buy if you wanted to enter a competition for growing the tallest sunflower and why? I would buy Barstows’ seeds. Although Allbright sunflowers seem taller (with a higher median) they are less consistent. So, whilst there is a chance of a very big sunflower there is also a good chance of a small sunflower. Barstows’ sunflowers are a bit shorter, but are more consistent in their heights so you are more likely to get flowers around the height of 95cm. E e s s - R e v i e w C o p y - C a m b r i d g e U n i v e r s i t y P r e s s - R e v i e w C o p y R e v i e w C o p y - C a m b r i d g e U n i v e r s i t y P r e s s - R e v i e w C o p y R e v i e w C o p y - C a m b r i d g e U n i v e r s i t y P r e s s - R e v i e w C o p y R e v i e w C o p y - C a m b r i d g e U n i v e r s i t y Copyright Material - Review Only - Not for Redistribution
- 277. Unit 3: Data handling 267 12 Averages and measures of spread Worked example 7 Worked example 7 The back-to-back stem and leaf diagram shows the concentration of low density lipoprotein (bad) cholesterol in the blood (milligrams per 100 ml of blood (mg/dl)) in 70 adults, half of whom are smokers and half of whom are non-smokers. 9 10 11 12 13 14 15 16 17 18 19 20 21 2 0 1 0 2 3 1 3 5 6 0 4 5 5 9 0 1 4 7 8 9 2 3 6 8 8 0 2 4 5 1 6 8 1 5 8 0 8 8 3 1 9 9 8 8 6 5 2 9 9 8 7 7 0 0 9 6 5 1 1 1 4 2 2 8 2 1 6 5 3 Leaf Leaf Stem Smokers Non-smokers Key Non-smokers 0 | 9 = 90 Smokers 11 | 2 = 112 a Determine the median for each group. b Find the range for: i Non-smokers ii Smokers c Determine the interquartile range for: i Non-smokers ii Smokers d LDL levels of 130 are desirable, levels of 130 – 160 are considered borderline high and levels 160 are considered high risk (more so for people with medical conditions that increase risk. Using these figures, comment on what the distribution on the stem and leaf diagram suggests. a The data is already ordered and there are 35 values in each set. 1 2 (35 + 1)th = 18, so median is the 18th value. Non smokers median = 128 Smokers median = 164 b i Range = 173 − 90 = 83 ii 215 − 112 = 103 c Determine the position of Q1 and Q3. The lower quartile = 1 4 (35 + 1)th = 9th value The upper quartile = 3 4 (35 + 1) th = 27th value i IQR = Q3 – Q1 = 142 – 116 = 26 for non-smokers ii IQR = Q3 – Q1 = 180 – 145 = 35 for smokers d For non-smokers the data is skewed toward the lower levels on the stem and leaf diagram. More than half the values are in the desirable range, with only three in the high risk range. For smokers, the data is further spread out. Only 3 values are in the desirable range, 12 are borderline high and 20 are in the high risk category, suggesting that smokers have higher levels of bad cholesterol in general. However, without considering other risk factors or medical history, you cannot say this for certain from one set of data. Tip Remember to count the data in ascending order when you work with the left hand side. The lowest values are closest to the stem in each row. e s s - R e v i e w C o p y - C a m b r i d g e U n i v e r s i t y P r e s s - R e v i e w C o p y R e v i e w C o p y - C a m b r i d g e U n i v e r s i t y P r e s s - R e v i e w C o p y R e v i e w C o p y - C a m b r i d g e U n i v e r s i t y P r e s s - R e v i e w C o p y R e v i e w C o p y - C a m b r i d g e U n i v e r s i t y Copyright Material - Review Only - Not for Redistribution
- 278. Unit 3: Data handling Cambridge IGCSE Mathematics 268 Exercise 12.5 1 Find the median, quartiles and interquartile range for each of the following. Make sure that you show your method clearly. a 5 8 9 9 4 5 6 9 3 6 4 b 12 14 12 17 19 21 23 c 4 5 12 14 15 17 14 3 18 19 18 19 14 4 15 d 3.1 2.4 5.1 2.3 2.5 4.2 3.4 6.1 4.8 e 13.2 14.8 19.6 14.5 16.7 18.9 14.5 13.7 17.0 21.8 12.0 16.5 Applying your skills Try to think about what the calculations in each question tell you about each situation. 2 Gideon walks to work when it is not raining. Each week for 15 weeks Gideon records the number of walks that he takes and the results are shown below: 5 7 5 8 4 2 9 9 4 7 6 4 6 12 4 Find the median, quartiles and interquartile range for this data. 3 Paavan is conducting a survey into the traffic on his road. Every Monday for eight weeks in the summer Paavan records the number of cars that pass by his house between 08.00 a.m. and 09.00 a.m. He then repeats the experiment during the winter. Both sets of results are shown below: Summer: 18 15 19 25 19 26 17 13 Winter: 12 9 14 11 13 9 12 10 a Find the median number of cars for each period. b Find the interquartile range for each period. c What differences do you notice? Try to explain why this might happen. 4 Julian and Aneesh are reading articles from different magazines. They count the number of words in a random selection of sentences from their articles and the results are recorded below: Julian (reading the Statistician): 23 31 12 19 23 13 24 Aneesh (reading the Algebraist): 19 12 13 16 18 15 18 21 22 a Calculate the median for each article. b Calculate the interquartile range for each article. c Aneesh claims that the editor of the Algebraist has tried to control the writing and seems to be aiming it at a particular audience. What do your answers from (a) and (b) suggest about this claim? E Tip Think carefully about possible restrictions before you answer part (c). e s s - R e v i e w C o p y - C a m b r i d g e U n i v e r s i t y P r e s s - R e v i e w C o p y R e v i e w C o p y - C a m b r i d g e U n i v e r s i t y P r e s s - R e v i e w C o p y R e v i e w C o p y - C a m b r i d g e U n i v e r s i t y P r e s s - R e v i e w C o p y R e v i e w C o p y - C a m b r i d g e U n i v e r s i t y Copyright Material - Review Only - Not for Redistribution
- 279. Unit 3: Data handling 269 12 Averages and measures of spread 5 The fuel economy (km/l of petrol) of 18 new car models was tested in both city traffic and open road driving conditions and the following stem and leaf diagram was produced. 8 9 10 11 12 13 14 15 16 17 5 5 9 1 1 2 7 3 6 5 6 7 2 7 9 0 1 4 0 4 2 1 0 5 3 1 1 8 3 2 7 6 4 1 5 2 Leaf Leaf Stem New car fuel economy (km/l) Open road City traffic Key 0 | 8 = 8.0 km/l 11 | 5 = 11.5 km/l a Find the range of kilometres per litre of petrol for (i) city traffic and (ii) open road conditions. b Find the median fuel economy for (i) city traffic and (ii) open road driving. c Determine the interquartile range for (i) city traffic and (ii) open road driving. d Compare and comment on the data for both city traffic and open road driving. 12.6 Box-and-whisker plots A box-and-whisker plot is a diagram that shows the distribution of a set of data at a glance. They are drawn using five summary statistics: the lowest and highest values (the range), the first and third quartiles (the interquartile range) and the median. Drawing box-and-whisker plots All box-and-whisker plots have the same basic features. You can see these on the diagram. Interquartile range Range WHISKER WHISKER Maximum Value Minimum Value Q3 Median Q1 BOX Stem and leaf diagrams are useful for organising up to 50 pieces of data, beyond that they become very clumsy and time consuming. Box-and-whisker plots are far more useful for summarising large data sets. Box-and-whisker plots (also called boxplots) are a standardised way of showing the range, the interquartile range and a typical value (the median). These five summary statistics are also called the 5-number summary. E Worked example 8 The masses in kilograms of 20 students were rounded to the nearest kilogram and listed in order: 48, 52, 54, 55, 55, 58, 58, 61, 62, 63, 63, 64, 65, 66, 66, 67, 69, 70, 72, 79. Draw a box-and-whisker plot to represent this data. The minimum and maximum values can be read from the data set. Minimum = 48 kg Maximum = 79 kg e s s - R e v i e w C o p y - C a m b r i d g e U n i v e r s i t y P r e s s - R e v i e w C o p y R e v i e w C o p y - C a m b r i d g e U n i v e r s i t y P r e s s - R e v i e w C o p y R e v i e w C o p y - C a m b r i d g e U n i v e r s i t y P r e s s - R e v i e w C o p y R e v i e w C o p y - C a m b r i d g e U n i v e r s i t y Copyright Material - Review Only - Not for Redistribution
- 280. Unit 3: Data handling Cambridge IGCSE Mathematics 270 E Box-and-whisker plots are very useful for comparing two or more sets of data. When you want to compare two sets of data, you plot the diagrams next to each other on the same scale. Calculate the median. There are 20 data values, so the median will lie halfway between the 10th and 11th values. In this data set they are both 63, so the median is 63 kg. Next, calculate the lower and upper quartiles (Q1 and Q3 ). Q1 is the mean of the 5th and 6th values and Q3 is the mean of the 15th and 16th values. Q1 = 55 58 2 + = 56.5 kg Q3 = 66 67 2 + = 66.5 kg To draw the box-and-whisker plot: • Draw a scale with equal intervals that allows for the minimum and maximum values. • Mark the position of the median and the lower and upper quartiles against the scale. • Draw a rectangular box with Q1 at one end and Q3 at the other. Draw a line parallel to Q1 and Q3 inside the box to show the position of the median. • Extend lines (the whiskers) from the Q1 and Q3 sides of the box to the lowest and highest values. 40 50 60 70 80 lower quartile 56.5kg minimum 48kg median 63kg maximum 79kg upper quartile 66.5kg Worked example 9 The heights of ten 13-year old boys and ten 13-year old girls (to the nearest cm) are given in the table. Girls 137 133 141 137 138 134 149 144 144 131 Boys 145 142 146 139 138 148 138 147 142 146 Draw a box-and-whisker plot for both sets of data and compare the interquartile range. First arrange the data sets in order. Then work out the five number summary for each data set: Girls: 131 Min Min Q1 Q1 Q3 Q3 Median 137 + 138 2 = 137.5 Max Max 133 134 137 137 138 141 144 144 149 Boys: 138 138 139 142 142 145 146 146 147 148 142 + 145 2 = 143.5 e s s - R e v i e w C o p y - C a m b r i d g e U n i v e r s i t y P r e s s - R e v i e w C o p y R e v i e w C o p y - C a m b r i d g e U n i v e r s i t y P r e s s - R e v i e w C o p y R e v i e w C o p y - C a m b r i d g e U n i v e r s i t y P r e s s - R e v i e w C o p y R e v i e w C o p y - C a m b r i d g e U n i v e r s i t y Copyright Material - Review Only - Not for Redistribution
- 281. Unit 3: Data handling 271 12 Averages and measures of spread E Interpreting box-and-whisker plots To interpret a box-and-whisker plot, you need to think about what information the diagram gives you about the dataset. This box-and-whisker plot shows the results of a survey in which a group of teenagers wore a fitness tracker to record the number of steps they took each day. 4000 0 5000 6000 25% of sample 7000 8000 9000 50% of sample 25% of sample The box-and-whisker plot shows that: • The number of steps ranged from 4000 to 9000 per day. • The median number of steps was 6000 steps per day. • 50% of the teenagers took 6000 or fewer steps per day (the data below the median value) • 25% of the teenagers took 5000 or fewer steps per day (the lower ‘whisker’ represents the lower 25% of the data) • 25% of the teenagers took more than 7000 steps per day (the upper ‘whisker’ shows the top 25% of the data) • The data is fairly regularly distributed because the median line is in the middle of the box (in other words, equally far from Q1 and Q3 ). Draw a scale that allows for the minimum and maximum values. Plot both diagrams and label them to show which is which. 130 0 132 134 136 138 140 Height (cm) Boys Girls 142 144 146 148 150 The IQR for girls (10 cm) is wider than that for boys (7 cm) showing that the data for girls is more spread out and varied. e s s - R e v i e w C o p y - C a m b r i d g e U n i v e r s i t y P r e s s - R e v i e w C o p y R e v i e w C o p y - C a m b r i d g e U n i v e r s i t y P r e s s - R e v i e w C o p y R e v i e w C o p y - C a m b r i d g e U n i v e r s i t y P r e s s - R e v i e w C o p y R e v i e w C o p y - C a m b r i d g e U n i v e r s i t y Copyright Material - Review Only - Not for Redistribution
- 282. Unit 3: Data handling Cambridge IGCSE Mathematics 272 E Exercise 12.6 1 Zara weighed the contents of fifteen different bags of nuts and recorded their mass to the nearest gram. 147 150 152 150 150 148 151 146 149 151 148 146 150 145 149 Draw a box-and-whisker plot to display the data. 2 The range and quartiles of a data set are given below. Use these figures to draw a box-and-whisker plot. Range: 76 – 28 = 48 Q1 = 41.5, Q2 = 46.5, Q3 = 53.5 3 The table shows the marks that the same group of ten students received for three consecutive assignments. TEST 1 34 45 67 87 65 56 34 55 89 77 TEST 2 19 45 88 75 45 88 64 59 49 72 TEST 3 76 32 67 45 65 45 66 57 77 59 a Draw three box-and-whisker plots on the same scale to display this data. b Use the diagrams to comment on the performance of this group of students in the three assignments. 4 The following box-and-whisker plot shows the distances in kilometres that various teachers travel to get to school each day. Worked example 10 The box-and-whisker plots below show the test results that the same group of students achieved for two tests. Test 2 was taken two weeks after Test 1. Comment on how the students performed in the two tests. 6 0 8 10 12 14 16 Height (cm) Test 1 18 20 22 24 26 28 30 Test 2 The highest and lowest marks were the same for both tests. The marks ranged from 7 to 27, a difference of 20 marks. Q3 is the same for both tests. This means that 75% of the students scored 22 30 or less on both tests. Only 25% of the students scored 22 or more. For the first test, Q1 was 12, so 75% of the students scored 12 or more marks. In the second test, Q1 increased from 12 to 15. This means that 75% of the students scored 15 or more marks in the second test, suggesting that the group did slightly better overall in the second test. e s s - R e v i e w C o p y - C a m b r i d g e U n i v e r s i t y P r e s s - R e v i e w C o p y R e v i e w C o p y - C a m b r i d g e U n i v e r s i t y P r e s s - R e v i e w C o p y R e v i e w C o p y - C a m b r i d g e U n i v e r s i t y P r e s s - R e v i e w C o p y R e v i e w C o p y - C a m b r i d g e U n i v e r s i t y Copyright Material - Review Only - Not for Redistribution
- 283. Unit 3: Data handling 273 12 Averages and measures of spread E 10 0 15 20 25 30 35 Distance travelled to school (km) 40 45 50 a What is the median distance travelled? b What is the furthest that a teacher has to travel? c What percentage of the teachers travel 30 or fewer kilometres to work? d What percentage of the teachers travel between 15 and 25 kilometres to work? e What is the IQR of this data set? What does it tell you? f What does the position of the median in the box tell you about the distribution of the data? 5 Two teams of friends have recorded their scores on a game and created a pair of box-and-whisker plots. 101 0 111 121 131 141 151 Height (cm) Team B Team A 161 171 181 191 a What is the interquartile range for Team A? b What is the interquartile range for Team B? c Which team has the most consistent scores? d To stay in the game, you must score at least 120. Which team seems most likely to stay in? e Which team gets the highest scores? Give reasons for your answer. 6 This diagram shows the time (in minutes) that two students spend doing homework each day for a term. What does this diagram tell you about the two students? 10 15 20 25 30 35 40 45 50 55 60 65 70 75 0 Malika Shamila Time spent doing homework (mins) e s s - R e v i e w C o p y - C a m b r i d g e U n i v e r s i t y P r e s s - R e v i e w C o p y R e v i e w C o p y - C a m b r i d g e U n i v e r s i t y P r e s s - R e v i e w C o p y R e v i e w C o p y - C a m b r i d g e U n i v e r s i t y P r e s s - R e v i e w C o p y R e v i e w C o p y - C a m b r i d g e U n i v e r s i t y Copyright Material - Review Only - Not for Redistribution
- 284. Unit 3: Data handling Cambridge IGCSE Mathematics 274 E Applying your skills 7 An engineering firm has three machines that produce specialised bolts for airplanes. The bolts must have a diameter of 16.85 mm (with a tolerance of +/− 0.1 mm). During a quality inspection, a sample of 50 bolts produced by each machine is tested and the following box- and-whisker plot is produced using the test data. 17 16.95 16.90 16.85 16.80 16.75 Height (cm) Machine C 16.70 16.65 16.60 16.55 16.50 Machine B Machine A Write a quality inspection report comparing the performance of the three machines. Summary Do you know the following? • Averages – the mode, median and mean – are used to summarise a collection of data. • There are two main types of numerical data – discrete and continuous. • Discrete data can be listed or arranged in a frequency distribution. • Continuous data can be listed or arranged into groups • The mean is affected by extreme data. • The median is less affected by extreme data. • The median is a special example of a percentile. • The lower quartile (Q1 ) lies 25% of the way through the data. • The upper quartile (Q3 ) lies 75% of the way through the data. • The interquartile range (IQR = Q3 − Q1 ) gives a measure of how spread out or consistent the data is. It is a measure of the spread of the central 50% of the data. • A box-and-whisker plot is a diagram that shows the distribution of a data set using five values: the minimum and maximum (range); the lower and upper quartiles (IQR) and the median. Are you able to …? • calculate the mean, median, mode and range of data given in a list • calculate the mean, median, mode and range of data given in a frequency distribution and a stem and leaf diagram • calculate an estimate for the mean of grouped data • find the median class for grouped data • find the modal class for grouped data • compare sets of data using summary averages and ranges • find the quartiles of data arranged in ascending order • find the interquartile range for listed data • construct and interpret box-and-whisker plots and use them to compare and describe two or more sets of data. E E e s s - R e v i e w C o p y - C a m b r i d g e U n i v e r s i t y P r e s s - R e v i e w C o p y R e v i e w C o p y - C a m b r i d g e U n i v e r s i t y P r e s s - R e v i e w C o p y R e v i e w C o p y - C a m b r i d g e U n i v e r s i t y P r e s s - R e v i e w C o p y R e v i e w C o p y - C a m b r i d g e U n i v e r s i t y Copyright Material - Review Only - Not for Redistribution
- 285. 275 Unit 3: Data handling Examination practice Past paper questions 1 The time, t seconds, taken for each of 50 chefs to cook an omelette is recorded. Time (t seconds) 20 t 25 25 t 30 30 t 35 35 t 40 40 t 45 45 t 50 Frequency 2 6 7 19 9 7 a Write down the modal time interval [1] b Calculate an estimate of the mean time. Show all your working [4] [Cambridge IGCSE Mathematics 0580 Paper 42 Q3 (a) (b) October/November 2014] 2 Shahruk plays four games of golf His four scores have a mean of 75, a mode of 78 and a median of 77 Work out his four scores [3] [Cambridge IGCSE Mathematics 0580 Paper 22 Q11 May/June 2016] 3 a A farmer takes a sample of 158 potatoes from his crop. He records the mass of each potato and the results are shown in the table. Mass (m grams) Frequency 0 m 40 6 40 m 80 10 80 m 120 28 120 m 160 76 160 m 200 22 200 m 240 16 Calculate an estimate of the mean mass. Show all your working. [4] b A new frequency table is made from the results shown in the table in part a. Mass (m grams) Frequency 0 m 80 80 m 200 200 m 240 16 i Complete the table above. [2] ii On the grid, complete the histogram to show the information in this new table. E E e s s - R e v i e w C o p y - C a m b r i d g e U n i v e r s i t y P r e s s - R e v i e w C o p y R e v i e w C o p y - C a m b r i d g e U n i v e r s i t y P r e s s - R e v i e w C o p y R e v i e w C o p y - C a m b r i d g e U n i v e r s i t y P r e s s - R e v i e w C o p y R e v i e w C o p y - C a m b r i d g e U n i v e r s i t y Copyright Material - Review Only - Not for Redistribution
- 286. Unit 3: Data handling 276 Frequency density Mass (grams) m 40 80 120 160 200 240 0 0.2 0.6 0.4 0.8 1.0 1.2 [3] c A bag contains 15 potatoes which have a mean mass of 136 g. The farmer puts 3 potatoes which have a mean mass of 130 g into the bag. Calculate the mean mass of all the potatoes in the bag. [3] [Cambridge IGCSE Mathematics 0580 Paper 42 Q5 October/November 2012] E e s s - R e v i e w C o p y - C a m b r i d g e U n i v e r s i t y P r e s s - R e v i e w C o p y R e v i e w C o p y - C a m b r i d g e U n i v e r s i t y P r e s s - R e v i e w C o p y R e v i e w C o p y - C a m b r i d g e U n i v e r s i t y P r e s s - R e v i e w C o p y R e v i e w C o p y - C a m b r i d g e U n i v e r s i t y Copyright Material - Review Only - Not for Redistribution
- 287. 277 Examination practice: structured questions for Units 1–3 Examination practice: structured questions for Units 1–3 Exam-style questions 1 a Factorise the expression 5 4 57 2 5 4 5 4 x x 5 4 x x 5 4 + − 5 4 + − 5 4 x x + − 5 4 x x + − 5 4 x x . b The shaded regions in diagrams A (a rectangle) and B (a square with a section cut out) are equal in area. (2x + 1) cm (x + 8) cm (3x + 7) cm x cm 3 cm A B i Show that the area of the shaded region in A is 6 17 7 2 6 1 6 1 x x 6 1 x x 6 17 7 x x 7 7 + + 6 1 + + 6 17 7 + + 7 7 x x + + 6 1 x x + + 6 1 x x 7 7 x x 7 7 + + x x cm2 . ii Show that the area of the shaded region in B is x x 2 13 x x 13 x x 64 + + x x + + x x 13 + + x x 13 x x + + 13 cm2 . iii Use your answers in (i) and (ii) to show that 5 4 57 0 2 5 4 5 4 x x 5 4 x x 5 4 + − 5 4 + − 5 4 x x + − 5 4 x x + − 5 4 x x = . iv Hence find the dimensions of rectangle A. 2 A bag contains n white tiles and five black tiles. The tiles are all equal in shape and size. A tile is drawn at random and is replaced. A second tile is then drawn. a Find: i the probability that the first tile is white ii the probability that both the first and second tiles are white. b You are given that the probability of drawing two white tiles is 7 22 . Show that: 3 17 28 0 2 3 1 3 1 n n 3 1 n n 3 17 2 n n 7 2 7 2 − − 7 2 n n − − 3 1 n n − − 3 1 n n 7 2 n n 7 2 − − n n 8 0 8 0. c Solve the equation, 3 17 28 0 2 3 1 3 1 n n 3 1 n n 3 17 2 n n 7 2 7 2 − − 7 2 n n − − 3 1 n n − − 3 1 n n 7 2 n n 7 2 − − n n 8 0 8 0, and hence find the probability that exactly one white and exactly one black tile is drawn. 3 p x = 2 and q y = 2 . a Find, in terms of p and q: i 2x y + x y x y ii 2 2 x y + − x y + − x y iii 23x . b You are now given that: p q 2 p q p q 16 = and q p 2 32 = . Find the values of x, y, p, and q. E e s s - R e v i e w C o p y - C a m b r i d g e U n i v e r s i t y P r e s s - R e v i e w C o p y R e v i e w C o p y - C a m b r i d g e U n i v e r s i t y P r e s s - R e v i e w C o p y R e v i e w C o p y - C a m b r i d g e U n i v e r s i t y P r e s s - R e v i e w C o p y R e v i e w C o p y - C a m b r i d g e U n i v e r s i t y Copyright Material - Review Only - Not for Redistribution
- 288. Examination practice: structured questions for Units 1–3 278 4 (x + 14) cm (x + 14) cm (x + 14) cm B C A D E F G H I (12 + 2x) cm (2x + 3) cm (x + 5) cm x cm a Find the perimeter of triangle ABC. Simplify your answer as fully as possible. b Find the distance EF in terms of x. c Find the distance FG in terms of x. d Find the perimeter of shape DEFGHI in terms of x. Simplify your answer. e You are given that the perimeters of both shapes are equal. Form an equation and solve it for x. f Find the perimeters of both shapes and the area of DEFGHI. 5 r h r r A B C r h The right cone, A, has perpendicular height hcm and base radius rcm. The sphere, B, has a radius of rcm. The cuboid, C, measures rcm × rcm× hcm. a You are given that cone A and sphere B are equal in volume. Write down an equation connecting r and h, and show that h = 4r. b The surface area of cuboid C is 98cm2 . Form a second equation connecting r and h. c Combine your answers to (a) and (b) to show that r = 7 3 . d Find h and, hence, the volume of the cuboid. 6 a Express 60 and 36 as products of primes. b Hence find the LCM of 60 and 36. c Planet Carceron has two moons, Anderon and Barberon. Anderon completes a full orbit of Carceron every 60 days, and Barberon completes a full single orbit of Carceron in 36 days. If Anderon, Barberon and Carceron lie on a straight line on 1 March 2010 on which date will this next be true? 7 a Factorise the expression x x 2 50 x x 50 x x 609 − + x x − + x x 50 − + x x 50 x x − + 50 . b Hence or otherwise solve the equation 2 100 1218 0 2 x x 100 x x − + 100 − + x x − + x x 100 x x − + x x = . e s s - R e v i e w C o p y - C a m b r i d g e U n i v e r s i t y P r e s s - R e v i e w C o p y R e v i e w C o p y - C a m b r i d g e U n i v e r s i t y P r e s s - R e v i e w C o p y R e v i e w C o p y - C a m b r i d g e U n i v e r s i t y P r e s s - R e v i e w C o p y R e v i e w C o p y - C a m b r i d g e U n i v e r s i t y Copyright Material - Review Only - Not for Redistribution
- 289. 279 Examination practice: structured questions for Units 1–3 A farmer wants to use 100m of fencing to build three sides of the rectangular pen shown in the diagram: A D C B x x c Find an expression for the length AD in terms of x. d Find an expression for the area of the pen in terms of x. e The farmer wants the area of the pen to be exactly 1218 square metres. Using your answer to (d), find and solve an equation for x and determine all possible dimensions of the pen. 8 If ℰ = {integers}, A = {x x x x x x is an integer and − 4 7 − 4 7 − 4 7 4 7 4 7 } and B = {x x x x x x is a positive multiple of three}: a list the elements of set A b find n(A∩B) c describe in words the set (A∩B)′. 9 Copy the diagram shown below twice and shade the sets indicated. A B a (A∩B)′ b (A∪B′)′∪(A∩B) 10 Mr Dane took a walk in the park and recorded the various types of birds that he saw. The results are shown in the pie chart below. Mynahs Crows Sparrows Other Starlings 100° 30° 50° y x There were 30 Sparrows and 72 Starlings in the park. a Calculate the number of Mynahs in the park. b Calculate the angle x. c Calculate the angle y. d Calculate the number of Crows in the park. E e s s - R e v i e w C o p y - C a m b r i d g e U n i v e r s i t y P r e s s - R e v i e w C o p y R e v i e w C o p y - C a m b r i d g e U n i v e r s i t y P r e s s - R e v i e w C o p y R e v i e w C o p y - C a m b r i d g e U n i v e r s i t y P r e s s - R e v i e w C o p y R e v i e w C o p y - C a m b r i d g e U n i v e r s i t y Copyright Material - Review Only - Not for Redistribution
- 290. Examination practice: structured questions for Units 1–3 280 Past paper questions 1 h g g f i j k m n P Q a Use the information in the Venn diagram to complete the following i P ∩ Q = { ......................} [1] ii P′∪Q = { ......................} [1] iii n(P∪Q)′ = { ......................} [1] b A letter is chosen at random from the set Q. Find the probability that it is also in the set P. [1] c On the Venn diagram shade the region P′∩ Q. [1] d Use a set notation symbol to complete the statement. {f, g, h}..............P [1] [Cambridge IGCSE Mathematics 0580 Paper 22 Q22 May/June 2014] 2 Here is a sequence of patterns made using identical polygons. Pattern 2 Pattern 3 Pattern 1 a Write down the mathematical name of the polygon in Pattern 1. [1] b Complete the table for the number of vertices (corners) and the number of lines in Pattern 3, Pattern 4 and Pattern 7. [5] Pattern 1 2 3 4 7 Number of vertices 8 14 Number of lines 8 15 c i Find an expression for the number of vertices in Pattern n. [2] ii Work out the number of vertices in Pattern 23. [1] d Find an expression for the number of lines in Pattern n. [2] e Work out an expression, in its simplest form, for (number of lines in Pattern n) – (number of vertices in Pattern n). [2] [Cambridge IGCSE Mathematics 0580 Paper 33 Q08 October/November 2013] 3 a Using only the integers from 1 to 50, find i a multiple of both 4 and 7, [1] ii a square number that is odd, [1] iii an even prime number, [1] iv a prime number which is one less than a multiple of 5. [1] b Find the value of i 2 ( ) ( ) 5 ( ) , [1] ii 2−3 × 63 . [2] [Cambridge IGCSE Mathematics 0580 Paper 33 Q03 October/November 2013] E e s s - R e v i e w C o p y - C a m b r i d g e U n i v e r s i t y P r e s s - R e v i e w C o p y R e v i e w C o p y - C a m b r i d g e U n i v e r s i t y P r e s s - R e v i e w C o p y R e v i e w C o p y - C a m b r i d g e U n i v e r s i t y P r e s s - R e v i e w C o p y R e v i e w C o p y - C a m b r i d g e U n i v e r s i t y Copyright Material - Review Only - Not for Redistribution
- 291. 281 Unit 4: Number Chapter 13: Understanding measurement • Metric • Lower bound • Upper bound • Imperial • Conversion • Exchange rate Key words Weather systems are governed by complex sets of rules. The mathematics that describes these rules can be highly sensitive to small changes or inaccuracies in the available numerical data. We need to understand how accurate our predictions may or may not be. The penalties for driving an overloaded vehicle can be expensive, as well as dangerous for the driver and other road users. If a driver is carrying crates that have a rounded mass value, he needs to know what the maximum mass could be before he sets off and, if necessary, put his truck onto a weighbridge as a precaution against fines and, worse, an accident. In this chapter you will learn how to: • convert between units in the metric system • find lower and upper bounds of numbers that have been quoted to a given accuracy • Solve problems involving upper and lower bounds • use conversion graphs to change units from one measuring system to another • use exchange rates to convert currencies. EXTENDED e s s - R e v i e w C o p y - C a m b r i d g e U n i v e r s i t y P r e s s - R e v i e w C o p y R e v i e w C o p y - C a m b r i d g e U n i v e r s i t y P r e s s - R e v i e w C o p y R e v i e w C o p y - C a m b r i d g e U n i v e r s i t y P r e s s - R e v i e w C o p y R e v i e w C o p y - C a m b r i d g e U n i v e r s i t y Copyright Material - Review Only - Not for Redistribution
- 292. Cambridge IGCSE Mathematics 282 Unit 4: Number RECAP You should already familiar with the following measurement work: Converting units of measurement (Stage 9 Mathematics) To convert between basic units you need to multiply or divide by powers of ten. Kilo- × 10 × 1000 ÷ 1000 ÷ 10 × by powers of ten ÷ by powers of ten Hecto- Deca- Deci- Metre Litre Gram Centi- Milli- Area is measured in square units so conversion factors are also squared. Volume is measured in cubic units so conversion factors are also cubed. For example: Basic units cm → mm × 10 Square units cm2 → mm2 × 102 Cubic units cm3 → mm3 × 103 Units of time can be converted as long as you use the correct conversion factors. For example 12 minutes = 12 × 60 seconds = 720 seconds. Money amounts are decimal. In general one main unit = 100 smaller units. A conversion graph can be used to convert one set of measurements to another. 0 1 2 3 4 5 6 7 8 9 10 11 12 13 14 15 16 0 1 2 3 4 5 6 7 8 Centimetres Inches e s s - R e v i e w C o p y - C a m b r i d g e U n i v e r s i t y P r e s s - R e v i e w C o p y R e v i e w C o p y - C a m b r i d g e U n i v e r s i t y P r e s s - R e v i e w C o p y R e v i e w C o p y - C a m b r i d g e U n i v e r s i t y P r e s s - R e v i e w C o p y R e v i e w C o p y - C a m b r i d g e U n i v e r s i t y Copyright Material - Review Only - Not for Redistribution
- 293. 283 Unit 4: Number 13 Understanding measurement 13.1 Understanding units Vishal has a 1m × 1m × 1m box and has collected a large number of 1cm × 1cm × 1cm building blocks. He is very tidy and decides to stack all of the cubes neatly into the box. Try to picture a 1m × 1m × 1m box: The lengths of each side will be 1m = 100cm. The total number of 1cm × 1cm × 1cm cubes that will fit inside will be 100 × 100 × 100 = 1000000. The main point of this example is that if you change the units with which a quantity is measured, the actual numerical values can be wildly different. Here, you have seen that one cubic metre is equivalent to one million cubic centimetres! 1 m = 100 cm 1 m = 100 cm 1 m = 100 cm Centimetres and metres are examples of metric measurements, and the table below shows some important conversions. You should work through the table and make sure that you understand why each of the conversions is as it is. Measure Units used Equivalent to . . . Length – how long (or tall) something is. Millimetres (mm) Centimetres (cm) Metres (m) Kilometres (km) 10mm = 1cm 100cm = 1m 1000m = 1km 1km = 1000000mm Mass – the amount of material in an object, (sometimes incorrectly called weight). Milligrams (mg) Grams (g) Kilograms (kg) Tonnes (t) 1000mg = 1g 1000g = 1kg 1000kg = 1t 1t = 1000000g Capacity – the inside volume of a container; how much it can hold. Millilitres (ml) Centilitres (cl) Litres (ℓ) 10ml = 1cl 100cl = 1ℓ 1ℓ = 1000ml Area – the amount of space taken up by a flat (two- dimensional) shape, always measured in square units. Square millimetre (mm2 ) Square centimetre (cm2 ) Square metre (m2 ) Square kilometre (km2 ) Hectare (ha) 100mm2 = 1cm2 10000cm2 = 1m2 1000000m2 = 1km2 1km2 = 100ha 1ha = 10000m2 Volume – the amount of space taken up by a three- dimensional object, always measured in cubic units (or their equivalent liquid measurements, e.g. ml). Cubic millimetre (mm3 ) Cubic centimetre (cm3 ) Cubic metre (m3 ) Millilitre (mℓ) 1000mm3 = 1cm3 1000000cm3 = 1m3 1m3 = 1000ℓ 1cm3 = 1mℓ The example on page 257 shows how these conversions can be used. You encountered these units in chapter 7 when working with perimeters, areas and volumes. REWIND Capacity is measured in terms of what something can contain, not how much it does contain. A jug can have a capacity of 1 litre but only contain 500ml. In the latter case, you would refer to the volume of the liquid in the container. Physicists need to understand how units relate to one another. The way in which we express masses, speeds, temperatures and a vast array of other quantities can depend on the units used. LINK e s s - R e v i e w C o p y - C a m b r i d g e U n i v e r s i t y P r e s s - R e v i e w C o p y R e v i e w C o p y - C a m b r i d g e U n i v e r s i t y P r e s s - R e v i e w C o p y R e v i e w C o p y - C a m b r i d g e U n i v e r s i t y P r e s s - R e v i e w C o p y R e v i e w C o p y - C a m b r i d g e U n i v e r s i t y Copyright Material - Review Only - Not for Redistribution
- 294. Cambridge IGCSE Mathematics 284 Unit 4: Number Worked example 1 Express: a 5km in metres b 3.2cm in mm c 2000000cm2 in m2 . a 1km = 1000m So, 5km = 5 × 1000m = 5000m b 1cm = 10mm So, 3.2cm = 3.2 × 10 = 32mm c 1m2 =100cm × 100cm = 10000cm2 So, 2000000cm2 = 2000000 10000 = 200m2 Exercise 13.1 1 Express each quantity in the unit given in brackets. a 4kg (g) b 5km (m) c 35mm (cm) d 81mm (cm) e 7.3g (mg) f 5760kg (t) g 2.1m (cm) h 2t (kg) i 140cm (m) j 2024g (kg) k 121mg (g) l 23m (mm) m 3cm 5mm (mm) n 8km 36m (m) o 9g 77mg (g) 2 Arrange in ascending order of size. 3.22m, 32 9 m, 32.4cm 3 Write the following volumes in order, starting with the smallest. 1 2 litre, 780ml, 125ml, 0.65 litres 4 How many 5ml spoonfuls can be obtained from a bottle that contains 0.3 litres of medicine? 5 Express each quantity in the units given in brackets. a 14.23m (mm, km) b 19.06g (mg, t) c 2 3 4 litres (ml, cl) d 4m2 (mm2 , ha) e 13cm2 (mm2 , ha) f 10cm3 (mm3 , m3 ) 6 A cube has sides of length 3m. Find the volume of the cube in: a m3 b cm3 c mm3 (give your answer in standard form). 7 The average radius of the Earth is 6378km. Find the volume of the Earth, using each of the following units. Give your answers in standard form to 3 significant figures. The volume of a sphere = 4 3 3 πr a km3 b m3 c mm3 radius 6378 km You will need to remind yourself how to calculate volumes of three-dimensional shapes in chapter 7. You also need to remember what you learned about standard form in chapter 5. REWIND e s s - R e v i e w C o p y - C a m b r i d g e U n i v e r s i t y P r e s s - R e v i e w C o p y R e v i e w C o p y - C a m b r i d g e U n i v e r s i t y P r e s s - R e v i e w C o p y R e v i e w C o p y - C a m b r i d g e U n i v e r s i t y P r e s s - R e v i e w C o p y R e v i e w C o p y - C a m b r i d g e U n i v e r s i t y Copyright Material - Review Only - Not for Redistribution
- 295. 285 Unit 4: Number 13 Understanding measurement 8 The dimensions of the cone shown in the diagram are given in cm. Calculate the volume of the cone in: a cm3 b mm3 c km3 Give your answers in standard form to 3 significant figures. 12 cm 3 cm Applying your skills 9 Miss Molly has a jar that holds 200 grams of flour. a How many 30 gram measures can she get from the jar? b How much flour will be left over? 10 This is a lift in an office building. WARNING Max Load 300 kg ! The lift won’t start if it holds more than 300kg. a Tomas (105kg), Shaz (65kg), Sindi (55kg), Rashied (80kg) and Mandy (70kg) are waiting for the lift. Can they all ride together? b Mandy says she will use the stairs. Can the others go safely into the lift? c Rashied says he will wait for the lift to come down again. Can the other four go together in the lift? 13.2 Time 12 2 1 3 4 5 6 7 8 9 10 11 24 14 13 15 16 17 18 19 20 21 22 23 You have already learned how to tell the time and you should know how to read and write time using the 12-hour and 24-hour system. The clock dial on the left shows you the times from 1 to 12 (a.m. and p.m. times). The inner dial shows what the times after 12p.m. are in the 24-hour system. You were given the formula for the volume of a cone in chapter 7: Volume = 1 3 πr2 h. Always read time problems carefully and show the steps you take to solve them. This is one context where working backwards is often a useful strategy. Scale and measurement is an important element of map skills. If you study geography you need to understand how to convert between units and work with different scales. LINK e s s - R e v i e w C o p y - C a m b r i d g e U n i v e r s i t y P r e s s - R e v i e w C o p y R e v i e w C o p y - C a m b r i d g e U n i v e r s i t y P r e s s - R e v i e w C o p y R e v i e w C o p y - C a m b r i d g e U n i v e r s i t y P r e s s - R e v i e w C o p y R e v i e w C o p y - C a m b r i d g e U n i v e r s i t y Copyright Material - Review Only - Not for Redistribution
- 296. Cambridge IGCSE Mathematics 286 Unit 4: Number Worked example 2 Sara and John left home at 2.15p.m. Sara returned at 2.50p.m. and John returned at 3.05p.m. How long was each person away from home? Sara: 2 hours 50 minutes – 2 hours 15 minutes = 0 h 35 min 2 hours − 2 hours = 0 hours 50 min − 15 min = 35 min Sara was away for 35 minutes. Think about how many hours you have, and how many minutes. 2.50p.m. is the same as 2 hours and 50 minutes after 12p.m., and 2.15p.m. is the same as 2 hours and 15 minutes after 12p.m. Subtract the hours separately from the minutes. John: 3 h 5 min = 2 h 65 min 2 h 65 min – 2 h 15 min = 0 h 50 min John was away for 50 minutes. 3.05p.m. is the same as 2 hours and 65 minutes after 12p.m.; do a subtraction like before. Note both times are p.m. See the next example for when one time is a.m. and the other p.m. You cannot subtract 15min from 5 min in the context of time (you can't have negative minute) so carry one hour over to the minutes so that 3 h 5min becomes 2 h 65mins. Worked example 3 A train leaves at 05.35 and arrives at 18.20. How long is the journey? 18.20 is equivalent to 17 hours and 80 minutes after 12 a.m. Again, 20–35 is not meaningful in the context of time, so carry one hour over to give 17h 80 min. 17h − 5h = 12h 80 min − 35 min = 45 min Now you can subtract the earlier time from the later time as before (hours and minutes separately). The journey took 12 hours and 45 minutes. Then add the hours and minutes together. Again note that you cannot simply do 18.20 – 05.35 because this calculation would not take into account that with time you work in jumps of 60 not 100. The methods in examples 1–3 are best used when you are dealing with time within the same day. But what happens when the time difference goes over one day? Worked example 4 How much time passes from 19.35 on Monday to 03.55 on Tuesday? 19.35 to 24.00 is one part and 00.00 to 03.55 the next day is the other part. The easiest way to tackle this problem is to divide the time into parts. Part one: 19.35 to 24.00. 24 h = 23 h 60 min (past 12 a.m.) 23 h 60 min – 19 h 35 min = 4 h 25 min 00–35 is not meaningful in time, so carry one hour over so that 24.00 becomes 23 h 60 min. Then do the subtraction as before (hours and minutes separately). Always remember that time is written in hours and minutes and that there are 60 minutes in an hour. This is very important when calculating time – if you put 1.5 hours into your calculator, it will assume the number is decimal and work with parts of 100, not parts of 60. So, you need to treat minutes and hours separately. e s s - R e v i e w C o p y - C a m b r i d g e U n i v e r s i t y P r e s s - R e v i e w C o p y R e v i e w C o p y - C a m b r i d g e U n i v e r s i t y P r e s s - R e v i e w C o p y R e v i e w C o p y - C a m b r i d g e U n i v e r s i t y P r e s s - R e v i e w C o p y R e v i e w C o p y - C a m b r i d g e U n i v e r s i t y Copyright Material - Review Only - Not for Redistribution
- 297. 287 Unit 4: Number 13 Understanding measurement Exercise 13.2 Applying your skills 1 Gary started a marathon race at 9.25a.m. He finished at 1.04p.m. How long did he take? Give your answer in hours and minutes. 2 Nick has a satellite TV decoder that shows time in 24-hour time. He wants to program the machine to record some programmes. Write down the timer settings for starting and finishing each recording. a 10.30 p.m. to 11.30p.m. b 9.15 a.m. to 10.45a.m. c 7.45 p.m. to 9.10p.m. 3 Yasmin’s car odometer shows distance travelled in kilometres. The odometer dial showed these two readings before and after a journey: 0 20 40 60 80 100 120 140 160 180 97263.25 0 20 40 60 80 100 120 140 160 180 97563.25 a How far did she travel? b The journey took 2 1 2 hours. What was her average speed in km/h? 4 Yvette records three songs onto her MP4 player. The time each of them lasts is three minutes 26 seconds, three minutes 19 seconds and two minutes 58 seconds. She leaves a gap of two seconds between each of the songs. How long will it take to play the recording? 5 A journey started at 17:30 hours on Friday, 7 February, and finished 57 hours later. Write down the time, day and date when the journey finished. 6 Samuel works in a bookshop. This is his time sheet for the week. Day Mon Tues Wed Thurs Fri Start 8:20 8:20 8:20 8:22 8:21 Lunch 12:00 12:00 12:30 12:00 12:30 Back 12:45 12:45 1:15 12:45 1:15 End 5:00 5:00 4:30 5:00 5:30 Total time worked Part two: 0.00 to 03.55 3h 55 min – 0 h 0 min = 3 h 55 min 03.55 is 3 hours and 55 minutes past 12a.m. (or 0.00) so this is simply a difference of + 3 hours and 55 minutes 4 h 25 min + 3 h 55 min = 7 h 80 min 80 min = 1 h 20 min 7 h 0 min + 1 h 20 min = 8 h 20 min 8 hours and 20 min passes. Add the result of the two parts together. Change the 80 minutes into hours and minutes. Add together. When dealing with time problems, consider what is being asked and what operations you will need to do to answer the question. e s s - R e v i e w C o p y - C a m b r i d g e U n i v e r s i t y P r e s s - R e v i e w C o p y R e v i e w C o p y - C a m b r i d g e U n i v e r s i t y P r e s s - R e v i e w C o p y R e v i e w C o p y - C a m b r i d g e U n i v e r s i t y P r e s s - R e v i e w C o p y R e v i e w C o p y - C a m b r i d g e U n i v e r s i t y Copyright Material - Review Only - Not for Redistribution
- 298. Cambridge IGCSE Mathematics 288 Unit 4: Number a Complete the bottom row of the time sheet. b How many hours in total did Samuel work this week? c Samuel is paid $5.65 per hour. Calculate how much he earned this week. Reading timetables Most travel timetables are in the form of tables with columns representing journeys. The 24-hour system is used to give the times. Here is an example: SX D D D MO D SX Anytown 06:30 07:45 12:00 16:30 17:15 18:00 20:30 Beecity 06:50 08:05 12:25 16:50 17:35 18:25 20:50 Ceeville 07:25 08:40 13:15 17:25 18:15 19:05 21:25 D – daily including Sundays, SX – daily except Saturdays, MO – Mondays only Make sure you can see that each column represents a journey. For example, the first column shows a bus leaving at 06:30 every day except Saturday (six times per week). It arrives at the next town, Beecity, at 06:50 and then goes on to Ceeville, where it arrives at 07:25. Exercise 13.3 Applying your skills 1 The timetable for evening trains between Mitchell’s Plain and Cape Town is shown below. Mitchell’s Plain 18:29 19:02 19:32 20:02 21:04 Nyanga 18:40 19:13 19:43 20:13 21:15 Pinelands 19:01 19:31 20:01 20:31 21:33 Cape Town 19:17 19:47 20:17 20:47 21:49 a Shaheeda wants to catch a train at Mitchell’s Plain and get to Pinelands by 8.45 p.m. What is the time of the latest train she should catch? b Calculate the time the 19:02 train from Mitchell’s Plain takes to travel to Cape Town. c Thabo arrives at Nyanga station at 6.50 p.m. How long will he have to wait for the next train to Cape Town? 2 The timetable for a bus service between Aville and Darby is shown below. Aville 10:30 10:50 and 18:50 Beeston 11:05 11:25 every 19:25 Crossway 11:19 11:39 20 minutes 19:39 Darby 11:37 11:57 until 19:57 a How many minutes does a bus take to travel from Aville to Darby? b Write down the timetable for the first bus on this service to leave Aville after the 10:50 bus. c Ambrose arrives at Beeston bus station at 2.15 p.m. What is the time of the next bus to Darby? e s s - R e v i e w C o p y - C a m b r i d g e U n i v e r s i t y P r e s s - R e v i e w C o p y R e v i e w C o p y - C a m b r i d g e U n i v e r s i t y P r e s s - R e v i e w C o p y R e v i e w C o p y - C a m b r i d g e U n i v e r s i t y P r e s s - R e v i e w C o p y R e v i e w C o p y - C a m b r i d g e U n i v e r s i t y Copyright Material - Review Only - Not for Redistribution
- 299. 289 Unit 4: Number 13 Understanding measurement 3 The tides for a two-week period are shown on this tide table. February High tide Low tide Morning Afternoon Morning Afternoon 1 Wednesday 2 Thursday 3 Friday 4 Saturday 5 Sunday 6 Monday 7 Tuesday 8 Wednesday 9 Thursday 10 Friday 11 Saturday 12 Sunday 13 Monday 14 Tuesday 1213 0017 0109 0152 0229 0303 0336 0411 0448 0528 0614 0706 0808 0917 -- 1257 1332 1404 1434 1505 1537 1610 1644 1718 1757 1845 1948 2111 0518 0614 0700 0740 0815 0848 0922 0957 1030 1104 1140 1222 0041 0141 1800 1849 1930 2004 2038 2111 2143 2215 2245 2316 2354 -- 1315 1425 a What is the earliest high tide in this period? b How long is it between high tides on day two? c How long is it between the first high tide and the first low tide on day seven? d Mike likes to go surfing an hour before high tide. i At what time would this be on Sunday 5 February? ii Explain why it would unlikely to be at 01:29. e Sandra owns a fishing boat. i She cannot go out in the mornings if the low tide occurs between 5 a.m. and 9 a.m. On which days did this happen? ii Sandra takes her boat out in the afternoons if high tide is between 11 a.m. and 2.30 p.m. On which days could she go out in the afternoons? 13.3 Upper and lower bounds Raeman has ordered a sofa and wants to work out whether or not it will fit through his door. He has measured both the door (47cm) and the sofa (46.9cm) and concludes that the sofa should fit with 1mm to spare. Unfortunately, the sofa arrives and doesn’t fit. What went wrong? Looking again at the value 47cm, Raeman realises that he rounded the measurement to the nearest cm. A new, more accurate measurement reveals that the door frame is, in fact, closer to 46.7cm wide. Raeman also realises that he has rounded the sofa measurement to the nearest mm. He measures it again and finds that the actual value is closer to 46.95cm, which is 2.5mm wider than the door! Finding the greatest and least possible values of a rounded measurement Consider again, the width of Raeman’s door. If 47cm has been rounded to the nearest cm it can be useful to work out the greatest and least possible values of the actual measurement. e s s - R e v i e w C o p y - C a m b r i d g e U n i v e r s i t y P r e s s - R e v i e w C o p y R e v i e w C o p y - C a m b r i d g e U n i v e r s i t y P r e s s - R e v i e w C o p y R e v i e w C o p y - C a m b r i d g e U n i v e r s i t y P r e s s - R e v i e w C o p y R e v i e w C o p y - C a m b r i d g e U n i v e r s i t y Copyright Material - Review Only - Not for Redistribution
- 300. Cambridge IGCSE Mathematics 290 Unit 4: Number If you place the measurement of 47cm on a number line, then you can see much more clearly what the range of possible values will be: 46 47 48 46.5 47.5 Notice at the upper end, that the range of possible values stops at 47.5cm. If you round 47.5cm to the nearest cm you get the answer 48cm. Although 47.5cm does not round to 47 (to the nearest cm), it is still used as the upper value. But, you should understand that the true value of the width could be anything up to but not including 47.5cm. The lowest possible value of the door width is called the lower bound. Similarly, the largest possible value is called the upper bound. Letting w represent the width of the sofa, the range of possible measurements can be expressed as: 46.5 w 47.5 This shows that the true value of w lies between 46.5 (including 46.5) and 47.5 (not including 47.5). Worked example 5 Find the upper and lower bounds of the following, taking into account the level of rounding shown in each case. a 10cm, to the nearest cm b 22.5, to 1 decimal place c 128000, to 3 significant figures. a Show 10cm on a number line with the two nearest whole number values. The real value will be closest to 10cm if it lies between the lower bound of 9.5cm and the upper bound of 10.5cm. 8 9 10 11 12 8.5 9.5 10.5 11.5 b Look at 22.5 on a number line. The real value will be closest to 22.5 if it lies between the lower bound of 22.45 and the upper bound of 22.55. 22.4 22.5 22.6 22.45 22.55 c 128000 is shown on a number line. 128000 lies between the lower bound of 127500 and the upper bound of 128500. 127 000 128 000 129 000 127 500 128 500 If you get confused when dealing with upper and lower bounds, draw a number line to help you. e s s - R e v i e w C o p y - C a m b r i d g e U n i v e r s i t y P r e s s - R e v i e w C o p y R e v i e w C o p y - C a m b r i d g e U n i v e r s i t y P r e s s - R e v i e w C o p y R e v i e w C o p y - C a m b r i d g e U n i v e r s i t y P r e s s - R e v i e w C o p y R e v i e w C o p y - C a m b r i d g e U n i v e r s i t y Copyright Material - Review Only - Not for Redistribution
- 301. 291 Unit 4: Number 13 Understanding measurement Exercise 13.4 1 Each of the following numbers is given to the nearest whole number. Find the lower and upper bounds of the numbers. a 12 b 8 c 100 d 9 e 72 f 127 2 Each of the following numbers is correct to 1 decimal place. Write down the lower and upper bounds of the numbers. a 2.7 b 34.4 c 5.0 d 1.1 e −2.3 f −7.2 3 Each of the numbers below has been rounded to the degree of accuracy shown in the brackets. Find the upper and lower bounds in each case. a 132 (nearest whole number) b 300 (nearest one hundred) c 405 (nearest five) d 15 million (nearest million) e 32.3 (1dp) f 26.7 (1dp) g 0.5 (1dp) h 12.34 (2dp) i 132 (3sf) j 0.134 (3sf) Applying your skills 4 Anne estimates that the mass of a lion is 300kg. Her estimate is correct to the nearest 100kg. Between what limits does the actual mass of the lion lie? 5 In a race, Nomatyala ran 100m in 15.3 seconds. The distance is correct to the nearest metre and the time is correct to one decimal place. Write down the lower and upper bounds of: a the actual distance Nomatyala ran b the actual time taken. 6 The length of a piece of thread is 4.5m to the nearest 10cm. The actual length of the thread is Lcm. Find the range of possible values for L, giving you answer in the form … L … Problem solving with upper and lower bounds Some calculations make use of more than one rounded value. Careful use of the upper and lower bounds of each value, will give correct upper and lower bounds for the calculated answer. Worked example 6 If a = 3.6 (to 1dp) and b = 14 (to the nearest whole number), find the upper and lower bounds for each of the following: a a + b b ab c b − a d a b e a b a a b a b Firstly, find the upper and lower bounds of a and b: 3.55 a 3.65 and 13.5 b 14.5 E e s s - R e v i e w C o p y - C a m b r i d g e U n i v e r s i t y P r e s s - R e v i e w C o p y R e v i e w C o p y - C a m b r i d g e U n i v e r s i t y P r e s s - R e v i e w C o p y R e v i e w C o p y - C a m b r i d g e U n i v e r s i t y P r e s s - R e v i e w C o p y R e v i e w C o p y - C a m b r i d g e U n i v e r s i t y Copyright Material - Review Only - Not for Redistribution
- 302. Cambridge IGCSE Mathematics 292 Unit 4: Number a Upper bound for upper bound of upper bound of ( ) a b ( ) a b ( ) a b upper bound of a b + = ( ) + = ( ) a b ( ) + = ( ) a b a b a b = + = = + = = 3 6 = + 3 6 = + 5 1 = + 5 1 = + 4 5 18 15 . . = + . . 3 6 . . 3 6 = + 3 6 = + . . = + 3 65 1 . . = + 5 1 = + . . 5 14 5 . . 4 5 . Lower bound for ( lower bound for lower bound fo ( l a b ( l a b r a b r lower bound fo a b r a b ( l + = ( l ( l a b ( l + = ( l a b a b a b r a b r a b ( l ( l ( l + = ( l + = . . . = + . . = + = 3 5 . . 3 5 . . = + 3 5 = + . . = + 3 5 . . = + 5 1 . . 5 1 . . = + 5 1 = + . . = + . . 5 1 . . = + 3 5 . . 3 5 . . 17 05 This can be written as: 17.05 (a + b) 18.15 b Upper bound for upper bound for upper bound fo ab a b upper bound fo a b r a b = × upper bound for = × a b = × a b = 3. . . 3. . . 3. . 65 . . 65 . . 14 . . 14 . .5 52 925 × . . . . = Lower bound for lower bound for lower bound fo 3 5 ab a b r l a b r lower bound fo a b r a b = × lower bound fo = × r l = × r l a b r l = × r l a b = . 5 3 5 . 5 3 55 . 5 5 . 5 13 5 × = . . 47 925 This can be written as: 47.925 ab 52.925 c Think carefully about b − a. To find the upper bound you need to subtract as small a number as possible from the largest possible number. So: Upper bound for ( upper bound for lower bound fo b a b a r b a r lower bound fo b a r b a − = b a − = b a = ) − = − = 14 1 14 1 5 3 55 10 95 . . 5 3 . . . 5 3 5 3 = Similarly, for the lower bound: Lower bound ( lower bound for upper bound for ( l b a ( l b a upper bound for b a ( l − = ( l ( l b a ( l − = ( l b a = ( l ( l ( l − = ( l − = . 13 5 3 5 5 3 5 65 9 85 – . 5 3 – . 5 3 9 8 9 8 = This can be written as: 9.85 (b − a) 10.95 d To find the upper bound of a b you need to divide the largest possible value of a by the smallest possible value of b: Upper bound upper bound for lower bound for = = = = = a b 3 65 13 5 0 3 6 3 6 . .2 2703 .2 2703 .2 0 3 . . . . ( 270 . ( = sf) sf sf Lower bound lower bound for upper bound for = = = = = a b 3 55 14 5 0 3 5 3 5 . .2 2448 .2 2448 .2 0 . . . . ( 245 . ( ) = 3sf This can be written as: 0.245 a b 0.270 e Upper bound of upper bound of lower bound of = = = a b + a b a a b + a b a 18 15 . 3 5 3 3 5 3 5 5 1126 5 11 3 3 5 3 5 . . . . . ( 5 1 . ( 5 11 3 . ( 1 3 ) = = 5 = = 1126 = = sf Lower bound of lower bound of upper bound of = = = a b + a b a a b + a b a 17 05 . 3 6 3 3 6 3 5 4 6712 4 67 3 3 6 3 6 . . . . . ( 4 6 . ( 4 67 3 . ( 7 3 ) = = 4 = = 6712 = = sf This can be written as: 4.67 a b a a b a b 5.11 E e s s - R e v i e w C o p y - C a m b r i d g e U n i v e r s i t y P r e s s - R e v i e w C o p y R e v i e w C o p y - C a m b r i d g e U n i v e r s i t y P r e s s - R e v i e w C o p y R e v i e w C o p y - C a m b r i d g e U n i v e r s i t y P r e s s - R e v i e w C o p y R e v i e w C o p y - C a m b r i d g e U n i v e r s i t y Copyright Material - Review Only - Not for Redistribution
- 303. 293 Unit 4: Number 13 Understanding measurement Exercise 13.5 1 You are given that: a = 5.6 (to 1dp) b = 24.1 (to 1dp) c = 145 (to 3sf) d = 0.34 (to 2dp) Calculate the upper and lower bounds for each of the following to 3 significant figures: a a2 b b3 c cd3 d a b 2 2 a b 2 2 a b a b a b a b 2 2 a b 2 2 e c b2 f ab cd g c a b d − h a d c b ÷ i dc a b + j dc a b − Applying your skills 2 Jonathan and Priya want to fit a new washing machine in their kitchen. The width of a washing machine is 79cm to the nearest cm. To fit in the machine, they have to make a space by removing cabinets. They want the space to be as small as possible. a What is the smallest space into which the washing machine can fit? b What is the largest space they might need for it to fit? 3 12kg of sugar are removed from a container holding 50kg. Each measurement is correct to the nearest kilogram. Find the lower and upper bounds of the mass of sugar left in the container. 4 The dimensions of a rectangle are 3.61cm and 2.57cm, each correct to 3 significant figures. a Write down the upper and lower bounds for each dimension. b Find the upper and lower bounds of the area of the rectangle. c Write down the upper and lower bounds of the area correct to 3 significant figures. 3.61 cm 2.57 cm 5 The mean radius of the Earth is 6378km, to the nearest km. Assume that the Earth is a sphere. Find upper and lower bounds for: a the surface area of the Earth in km2 b the volume of the Earth in km3 . 6 A cup holds 200ml to the nearest ml, and a large container holds 86 litres to the nearest litre. What is the largest possible number of cupfuls of water needed to fill the container? What is the smallest possible number of cupfuls? 7 A straight road slopes steadily upwards. If the road rises 8m (to the nearest metre) over a horizontal distance of 120m (given to the nearest 10m), what is the maximum possible gradient of the road? What is the minimum possible gradient? Give your answers to 3 significant figures. Look back at chapter 7 to remind yourself about calculating areas. REWIND Gradient was covered in chapter 10. REWIND E e s s - R e v i e w C o p y - C a m b r i d g e U n i v e r s i t y P r e s s - R e v i e w C o p y R e v i e w C o p y - C a m b r i d g e U n i v e r s i t y P r e s s - R e v i e w C o p y R e v i e w C o p y - C a m b r i d g e U n i v e r s i t y P r e s s - R e v i e w C o p y R e v i e w C o p y - C a m b r i d g e U n i v e r s i t y Copyright Material - Review Only - Not for Redistribution
- 304. Cambridge IGCSE Mathematics 294 Unit 4: Number 8 The two short sides of a right-angled triangle are 3.7cm (to nearest mm) and 4.5cm (to nearest mm). Calculate upper and lower bounds for: a the area of the triangle b the length of the hypotenuse. Give your answers to the nearest mm. 3.7 cm 4.5 cm 9 The angles in a triangle are x°, 38.4° (to 1 d.p.) and 78.1° (to 1 d.p.). Calculate upper and lower bounds for x. 38.4° x 78.1° 10 Quantity x is 45 to the nearest integer. Quantity y is 98 to the nearest integer. Calculate upper and lower bounds for x as a percentage of y to 1 decimal place. 11 The following five masses are given to 3 significant figures. 138kg 94.5kg 1090kg 345kg 0.354kg Calculate upper and lower bounds for the mean of these masses. 12 Gemma is throwing a biased die. The probability that she throws a five is 0.245 to 3 decimal places. If Gemma throws the die exactly 480 times, calculate upper and lower bounds for the number of fives Gemma expects to throw. Give your answer to 2 decimal places. 13 A cuboid of height, h, has a square base of side length, a. a In an experiment, a and h are measured as 4cm and 11cm respectively, each measured to the nearest cm. What are the minimum and maximum possible values of the volume in cm3 ? b In another experiment, the volume of the block is found to be 350cm3 , measured to the nearest 50cm3 , and its height is measured as 13.5cm, to the nearest 0.5cm. i What is the maximum and minimum possible values of the length a, in centimetres? ii How many significant figures should be used to give a reliable answer for the value of a? 13.4 Conversion graphs So far in this chapter, you have seen that it is possible to convert between different units in the metric system. Another widely used measuring system is the imperial system. Sometimes you might need to convert a measurement from metric to imperial, or the other way around. Similarly different countries use different currencies: dollars, yen, pounds, euros. When trading, it is important to accurately convert between them. Conversion graphs can be used when you need to convert from one measurement to another. For example from miles (imperial) to kilometres (metric) or from dollars to pounds (or any other currency!). Remind yourself about Pythagoras’ theorem from chapter 11. REWIND Generally speaking, the imperial equivalents of common metric units are shown below: metric imperial mm/cm inches metres feet/yards kilometres miles E e s s - R e v i e w C o p y - C a m b r i d g e U n i v e r s i t y P r e s s - R e v i e w C o p y R e v i e w C o p y - C a m b r i d g e U n i v e r s i t y P r e s s - R e v i e w C o p y R e v i e w C o p y - C a m b r i d g e U n i v e r s i t y P r e s s - R e v i e w C o p y R e v i e w C o p y - C a m b r i d g e U n i v e r s i t y Copyright Material - Review Only - Not for Redistribution
- 305. 295 Unit 4: Number 13 Understanding measurement Worked example 7 8km is approximately equal to five miles. If you travel no distance in kilometres then you also travel no distance in miles. These two points of reference enable you to draw a graph for converting between the two measurements. If the line is extended far enough you can read higher values. Notice, for example, that the line now passes through the point with co-ordinates (25, 40), meaning that 25 miles is approximately 40km. 0 5 10 15 20 25 10 20 30 40 Kilometres Miles Conversion graph, miles to kilometres Check for yourself that you can see that the following are true: 10 miles is roughly 16km 12 miles is roughly 19km 20km is roughly 12.5 miles, and so on. 0 5 10 15 20 25 10 20 30 40 Kilometres Miles Conversion graph, miles to kilometres Exercise 13.6 Applying your skills 1 The graph shows the relationship between temperature in degrees Celsius (°C) and degrees Fahrenheit (°F). Use the graph to convert: a 60°C to °F b 16°C to °F c 0°F to °C d 100°F to °C. 0 20 40 60 80 100 50 100 150 200 250 Temperature in °F Temperature in °C Conversion graph, Celsius to Fahrenheit –20 2 The graph is a conversion graph for kilograms and pounds. Use the graph to answer the questions below. a What does one small square on the horizontal axis represent? b What does one small square on the vertical axis represent? c Change 80 pounds to kilograms d The minimum mass to qualify as an amateur lightweight boxer is 57kg. What is this in pounds? The unit symbol for the imperial mass, pounds, is lb. 40 80 120 160 0 20 40 60 Kilograms Pounds Conversion graph, pounds to kilograms e s s - R e v i e w C o p y - C a m b r i d g e U n i v e r s i t y P r e s s - R e v i e w C o p y R e v i e w C o p y - C a m b r i d g e U n i v e r s i t y P r e s s - R e v i e w C o p y R e v i e w C o p y - C a m b r i d g e U n i v e r s i t y P r e s s - R e v i e w C o p y R e v i e w C o p y - C a m b r i d g e U n i v e r s i t y Copyright Material - Review Only - Not for Redistribution
- 306. Cambridge IGCSE Mathematics 296 Unit 4: Number e Which of the following conversions are incorrect? What should they be? i 30kg = 66 pounds ii 18 pounds = 40kg iii 60 pounds = 37kg iv 20 pounds = 9kg 3 The graph shows the conversion between UK pounds (£) and US dollars ($), as shown on a particular website in February, 2011. Use the graph to convert: a £25 to $ b £52 to $ c $80 to £ d $65 to £. 0 20 40 60 80 100 20 40 60 Pounds Dollars Conversion graph, US dollars to UK pounds 4 The cooking time (in minutes) for a joint of meat (in kilograms) can be calculated by multiplying the mass of the joint by 40 and then adding 30 minutes. The graph shows the cooking time for different masses of meat. Use the graph to answer the following questions. a If a joint of this meat has a mass of 3.4kg, approximately how long should it be cooked? b If a joint of meat is to be cooked for 220 minutes, approximately how much is its mass? c By calculating the mass of a piece of meat that takes only 25 minutes to cook, explain carefully why it is not possible to use this graph for every possible joint of meat. 1 2 3 4 5 0 50 100 150 200 250 Minutes Kilograms Cooking times for meat 5 You are told that Mount Everest is approximately 29000ft high, and that this measurement is approximately 8850m. a Draw a conversion graph for feet and metres on graph paper. b You are now told that Mount Snowdon is approximately 1085m high. What is this measurement in feet? Use your graph to help you. c A tunnel in the French Alps is 3400 feet long. Approximately what is the measurement in metres? 6 Mount Rubakumar, on the planet Ktorides is 1800 Squidges high. This measurement is equivalent to 3450 Splooges. a Draw a conversion graph for Squidges and Splooges. b If Mount Otsuki, also on planet Ktorides, is 1200 Splooges high, what is this measurement in Squidges? c There are, in fact, 80 Ploggs in a Splooge. If Mount Adil on planet Ktorides is 1456 Squidges high, what is the measurement in Ploggs ? ft is the abbreviation for the imperial unit foot (plural, feet). One foot is a little over 30cm. Mount Everest. e s s - R e v i e w C o p y - C a m b r i d g e U n i v e r s i t y P r e s s - R e v i e w C o p y R e v i e w C o p y - C a m b r i d g e U n i v e r s i t y P r e s s - R e v i e w C o p y R e v i e w C o p y - C a m b r i d g e U n i v e r s i t y P r e s s - R e v i e w C o p y R e v i e w C o p y - C a m b r i d g e U n i v e r s i t y Copyright Material - Review Only - Not for Redistribution
- 307. 297 Unit 4: Number 13 Understanding measurement 13.5 More money You have used graphs to convert from one currency to another. However, if you know the exchange rate, then you can make conversions without a graph. Working with money is the same as working with decimal fractions, because most money amounts are given as decimals. Remember though, that when you work with money you need to include the units ($ or cents) in your answers. Foreign currency The money a country uses is called its currency. Each country has its own currency and most currencies work on a decimal system (100 small units are equal to one main unit). The following table shows you the currency units of a few different countries. Country Main unit Smaller unit USA Dollar ($) = 100 cents Japan Yen (¥) = 100 sen UK Pound (£) = 100 pence Germany Euro (€) = 100 cents India Rupee (₹) = 100 paise Worked example 8 Convert £50 into Botswana pula, given that £1 = 9.83 pula. £1 = 9.83 pula £50 = 9.83 pula × 50 = 491.50 pula Worked example 9 Convert 803 pesos into British pounds given that £1 = 146 pesos. 146 pesos = £1 So 1 peso = £ 1 146 803 pesos = £ 1 146 803 × = £5.50 Exercise 13.7 Applying your skills 1 Find the cost of eight apples at 50c each, three oranges at 35c each and 5kg of bananas at $2.69 per kilogram. 2 How much would you pay for: 240 textbooks at $15.40 each, 100 pens at $1.25 each and 30 dozen erasers at 95c each? 3 If 1 Bahraini dinar = £2.13, convert 4000 dinar to pounds. 4 If US $1 = £0.7802, how many dollars can you buy with £300? 5 An American tourist visits South Africa with $3000. The exchange rate when she arrives is $1 = 12.90. She changes all her dollars into rands and then spends R900 per day for seven days. She changes the rands she has left back into dollars at a rate of $1 = R12.93. How much does she get in dollars? Before trying this section it will be useful to remind yourself about working with fractions from chapter 5. REWIND R is the symbol for Rands. e s s - R e v i e w C o p y - C a m b r i d g e U n i v e r s i t y P r e s s - R e v i e w C o p y R e v i e w C o p y - C a m b r i d g e U n i v e r s i t y P r e s s - R e v i e w C o p y R e v i e w C o p y - C a m b r i d g e U n i v e r s i t y P r e s s - R e v i e w C o p y R e v i e w C o p y - C a m b r i d g e U n i v e r s i t y Copyright Material - Review Only - Not for Redistribution
- 308. Cambridge IGCSE Mathematics 298 Unit 4: Number Summary Do you know the following? • There are several measuring systems, the most widely used being metric and imperial. • Every measurement quoted to a given accuracy will have both a lower bound and an upper bound. The actual value of a measurement is greater than or equal to the lower bound, but strictly less than the upper bound. • You can draw a graph to help convert between different systems of units. • Countries use different currencies and you can convert between them if you know the exchange rate. Are you able to …? • convert between various metric units • calculate upper and lower bounds for numbers rounded to a specified degree of accuracy • calculate upper and lower bounds when more than one rounded number is used in a problem • draw a conversion graph • use a conversion graph to convert between different units • convert between currencies when given the exchange rate. E e s s - R e v i e w C o p y - C a m b r i d g e U n i v e r s i t y P r e s s - R e v i e w C o p y R e v i e w C o p y - C a m b r i d g e U n i v e r s i t y P r e s s - R e v i e w C o p y R e v i e w C o p y - C a m b r i d g e U n i v e r s i t y P r e s s - R e v i e w C o p y R e v i e w C o p y - C a m b r i d g e U n i v e r s i t y Copyright Material - Review Only - Not for Redistribution
- 309. 299 Unit 4: Number Examination practice Exam-style questions 1 A cuboid has dimensions 14.5cm, 13.2cm and 21.3cm. These dimensions are all given to 1 decimal place. Calculate the upper and lower bounds for the volume of the cuboid in: a cm3 b mm3 Give your answers in standard form. 2 The graph shows the relationship between speeds in mph and km/h. 20 40 60 80 100 120 0 20 40 60 80 mph km/h Conversion graph, km/h to mph Use the graph to estimate: a the speed, in km/h, of a car travelling at 65mph b the speed, in mph, of a train travelling at 110km/h. 3 You are given that a = 6.54 (to 3 significant figures) and b = 123 (to 3 significant figures). Calculate upper and lower bounds for each of the following, give your answers to 3 significant figures: a a + b b ab c a b d b a − 1 Past paper questions 1 A carton contains 250 ml of juice, correct to the nearest millilitre. Complete the statement about the amount of juice, j ml, in the carton. …… j ….. [2] [Cambridge IGCSE Mathematics 0580 Paper 13 Q11 October/November 2012] 2 George and his friend Jane buy copies of the same book on the internet. George pays $16.95 and Jane pays £11.99 on a day when the exchange rate is $1 = £0.626. Calculate, in dollars, how much more Jane pays. [2] [Cambridge IGCSE Mathematics 0580 Paper 22 Q6 May/June 2013] 3 Joe measures the side of a square correct to 1 decimal place. He calculates the upper bound for the area of the square as 37.8225cm2 . Work out Joe’s measurement for the side of the square. [2] [Cambridge IGCSE Mathematics 0580 Paper 22 Q8 May/June 2013] E E E E e s s - R e v i e w C o p y - C a m b r i d g e U n i v e r s i t y P r e s s - R e v i e w C o p y R e v i e w C o p y - C a m b r i d g e U n i v e r s i t y P r e s s - R e v i e w C o p y R e v i e w C o p y - C a m b r i d g e U n i v e r s i t y P r e s s - R e v i e w C o p y R e v i e w C o p y - C a m b r i d g e U n i v e r s i t y Copyright Material - Review Only - Not for Redistribution
- 310. Unit 4: Number 300 4 The length, l metres, of a football pitch is 96m, correct to the nearest metre. Complete the statement about the length of this football pitch. …… j ….. [2] [Cambridge IGCSE Mathematics 0580 Paper 22 Q6 October/November 2014] 5 The base of a triangle is 9cm correct to the nearest cm. The area of this triangle is 40cm2 correct to the nearest 5cm2 . Calculate the upper bound for the perpendicular height of this triangle. [3] [Cambridge IGCSE Mathematics 0580 Paper 22 Q13 May/June 2016] E e s s - R e v i e w C o p y - C a m b r i d g e U n i v e r s i t y P r e s s - R e v i e w C o p y R e v i e w C o p y - C a m b r i d g e U n i v e r s i t y P r e s s - R e v i e w C o p y R e v i e w C o p y - C a m b r i d g e U n i v e r s i t y P r e s s - R e v i e w C o p y R e v i e w C o p y - C a m b r i d g e U n i v e r s i t y Copyright Material - Review Only - Not for Redistribution
- 311. 301 Unit 4: Algebra • Intersection • Simultaneous • Linear inequalities • Region • Linear programming • Quadratic Key words Any two airliners must be kept apart by air traffic controllers. An understanding of how to find meeting points of straight paths can help controllers to avoid disaster! J37 J 5 5 J82 J 2 1 J97 DMG417 521 PML331 657 UMC347 135 Businesses have constraints on the materials they can afford, how many people they can employ and how long it takes to make a product. They wish to keep their cost low and their profits high. Being able to plot their constraints on graphs can help to make their businesses more cost effective. EXTENDED In this chapter you will learn how to: • derive and solve simultaneous linear equations graphically and algebraically • solve linear inequalities algebraically • derive linear inequalities and find regions in a plane • solve quadratic equations by completing the square • solve quadratic equations by using the quadratic formula • factorise quadratics where the coefficient of x2 is not 1 • simplify algebraic fractions. Chapter 14: Further solving of equations and inequalities e s s - R e v i e w C o p y - C a m b r i d g e U n i v e r s i t y P r e s s - R e v i e w C o p y R e v i e w C o p y - C a m b r i d g e U n i v e r s i t y P r e s s - R e v i e w C o p y R e v i e w C o p y - C a m b r i d g e U n i v e r s i t y P r e s s - R e v i e w C o p y R e v i e w C o p y - C a m b r i d g e U n i v e r s i t y Copyright Material - Review Only - Not for Redistribution
- 312. Cambridge IGCSE Mathematics 302 Unit 4: Algebra RECAP You should be familiar with the following work on equations and inequalities: Equations (Chapter 6) To solve equations: Remove brackets and/or fractions Perform inverse operations to collect terms that include the variable on the same side Add or subtract like terms to solve the equation Remember to do the same things to both sides of the equation to keep it balanced. Drawing straight line graphs (Chapter 10) When you have two simultaneous equations each with two unknowns x and y you use a pair of equations to find the values. You can also draw two straight line graphs and the coordinates of the point where they meet give the solution of the equations. Inequalities (Year 9 Mathematics) An inequality shows the relationship between two unequal expressions. The symbols , , , and ≠ all show inequalities. Inequalities can be shown on a number line using these conventions: x 12 x 12 12 12 12 12 x 12 x 12 e s s - R e v i e w C o p y - C a m b r i d g e U n i v e r s i t y P r e s s - R e v i e w C o p y R e v i e w C o p y - C a m b r i d g e U n i v e r s i t y P r e s s - R e v i e w C o p y R e v i e w C o p y - C a m b r i d g e U n i v e r s i t y P r e s s - R e v i e w C o p y R e v i e w C o p y - C a m b r i d g e U n i v e r s i t y Copyright Material - Review Only - Not for Redistribution
- 313. 303 Unit 4: Algebra 14 Further solving of equations and inequalities 14.1 Simultaneous linear equations Graphical solution of simultaneous linear equations A little girl looks out of her window and notices that she can see some goats and some geese. From the window she can see some heads and then, when she looks out of the cat flap, she can see some feet. She knows that each animal has one head, goats have four feet and geese have two feet. Suppose that the girl counts eight heads and 26 feet. How many goats are there? How many geese are there? If you let x = the number of goats and y = the number of geese, then the number of heads must be the same as the total number of goats and geese. So, x + y = 8 Each goat has four feet and each goose has two feet. So the total number of feet must be 4x + 2y and this must be equal to 26. So you have, x y x y + = x y + = x y + = x y + = x y 8 4 2 x y 4 2 + = 4 2 + = x y + = x y 4 2 x y + = 26 The information has two unknown values and two different equations can be formed. Each of these equations is a linear equation and can be plotted on the same pair of axes. There is only one point where the values of x and y are the same for both equations – this is where the lines cross (the intersection). This is the simultaneous solution. 0 1 2 3 4 5 6 7 8 1 2 3 4 5 6 7 8 x y x + y = 8 4x + 2y = 26 Notice that the point with co-ordinates (5, 3) lies on both lines so, x = 5 and y = 3 satisfy both equations. You can check this by substituting the values into the equations: x + y = 5 + 3 = 8 and 4x + 2y = 4(5) + 2(3) = 20 + 6 = 26 This means that the girl saw five goats and three geese. You plotted and drew straight line (linear) graphs in chapter 10. REWIND Simultaneous means, ‘at the same time.’ With simultaneous linear equations you are trying to find the point where two lines cross. i.e. where the values of x and y are the same for both equations. It is essential that you remember to work out both unknowns. Every pair of simultaneous linear equations will have a pair of solutions. Tip Simultaneous equations are used to solve many problems involving the momentum of particles in physics. LINK e s s - R e v i e w C o p y - C a m b r i d g e U n i v e r s i t y P r e s s - R e v i e w C o p y R e v i e w C o p y - C a m b r i d g e U n i v e r s i t y P r e s s - R e v i e w C o p y R e v i e w C o p y - C a m b r i d g e U n i v e r s i t y P r e s s - R e v i e w C o p y R e v i e w C o p y - C a m b r i d g e U n i v e r s i t y Copyright Material - Review Only - Not for Redistribution
- 314. Cambridge IGCSE Mathematics 304 Unit 4: Algebra Exercise 14.1 1 Draw the lines for each pair of equations and then use the point of intersection to find the simultaneous solution. The axes that you should use are given in each case. a x y x y + = x y + = x y 2 1 + = 2 1 + = x y + = 2 1 x y + = 1 2 1 x y 2 1 + = 2 1 x y + = x y 2 1 + = 0 (x from 0 to 11 and y from 0 to 10) b x y x y − = x y − = x y −1 2 4 x y 2 4 + = 2 4 x y + = x y 2 4 + = (x from −2 to 3 and y from 0 to 4) c 5 4 1 2 10 x y 5 4 x y 5 4 x y 2 1 x y 2 1 − = x y − = 5 4 x y − = 5 4 x y − 2 1 + = 2 1 2 1 x y 2 1 + = 2 1 x y (x from −1 to 5 and y from 0 to 10) 2 Use the graphs supplied to find the solutions to the following pairs of simultaneous equations. a y = x b y = x c y = 4 – 2x y = −2 y = 3x − 6 y = −2 d y = 4 − 2x e y = −2 f y = x y + 7x + 1 = 0 y + 7x + 1 = 0 y = 4 – 2x Worked example 1 By drawing the graphs of each of the following equations on the same pair of axes, find the simultaneous solutions to the equations. x y x y x y − = x y 3 6 x y 3 6 x y − = 3 6 x y − = 3 6 x y − = 2 5 x y 2 5 + = 2 5 x y + = x y 2 5 + = 1 2 3 4 5 6 0 1 2 3 4 5 –2 –1 x y 2x + y = 5 x – 3y = 6 For the first equation: if x = 0, −3y = 6 ⇒ y = −2 and, if y = 0, x = 6 So this line passes through the points (0, −2) and (6, 0). For the second equation: if x = 0, y = 5 and, if y = 0, 2 5 5 2 x x 2 5 x x 2 5 = ⇒ 2 5 = ⇒ x x = ⇒ x x 2 5 x x = ⇒ 2 5 x x = So this line passes through the points (0, 5) and 5 2 0 , . Plot the pairs of points and draw lines through them. Notice that the two lines meet at the point with co-ordinates (3, −1) So, the solution to the pair of equations is x = 3 and y = −1 You learned how to plot lines from equations in chapter 10. REWIND Throughout this chapter you will need to solve basic linear equations as part of the method. Remind yourself of how this was done in chapter 6. REWIND 0 y –2 –3 –4 –5 –6 –1 2 1 3 4 5 6 7 y = x y = –2 –2 –3 –4 –5 –1 1 2 3 4 5 x y = 4 – 2x y = 3x – 6 y + 7x + 1= 0 e s s - R e v i e w C o p y - C a m b r i d g e U n i v e r s i t y P r e s s - R e v i e w C o p y R e v i e w C o p y - C a m b r i d g e U n i v e r s i t y P r e s s - R e v i e w C o p y R e v i e w C o p y - C a m b r i d g e U n i v e r s i t y P r e s s - R e v i e w C o p y R e v i e w C o p y - C a m b r i d g e U n i v e r s i t y Copyright Material - Review Only - Not for Redistribution
- 315. 305 Unit 4: Algebra 14 Further solving of equations and inequalities 3 For each pair of equations, find three points on each line and draw the graphs on paper. Use your graphs to estimate the solution of each pair of simultaneous equations. a 3y = −4x + 3 b 2 – x = − y c 4x = 1 + 6y d 3x + 2y = 7 x = 2y + 1 8x + 4y = 7 4x – 4 = 3y 4x = 2 + 3y 4 a Explain why the graphical method does not always give an accurate and correct answer. b How can you check whether a solution you obtained graphically is correct or not? Algebraic solution of simultaneous linear equations The graphical method is suitable for whole number solutions but it can be slow and, for non- integer solutions, may not be as accurate as you need. You have already learned how to solve linear equations with one unknown using algebraic methods. You now need to look at how to solve a pair of equations in which there are two unknowns. You are going to learn two methods of solving simultaneous equations: • solving by substitution • solving by elimination. Solving by substitution You can solve the equations by substitution when one of the equations can be solved for one of the variables (i.e. solved for x or solved for y). The solution is then substituted into the other equation so it can be solved. The equations have been numbered so that you can identify each equation efficiently. You should always do this. Worked example 2 Solve simultaneously by substitution. 3x – 2y = 29 (1) 4x + y = 24 (2) 4x + y = 24 y = 24 – 4x (3) Solve equation (2) for y. Label the new equation (3). 3x – 2y = 29 (1) 3x – 2(24 – 4x) = 29 Substitute (3) into (1) by replacing y with 24 – 4x. 3x – 48 + 8x = 29 Remove brackets. 3x + 8x = 29 + 48 Subtract 8x and add 48 to both sides. 11x = 77 Add like terms. x = 7 Divide both sides by 11. So, x = 7 y = 24 – 4(7) y = 24 – 28 y = −4 Now, substitute the value of x into any of the equations to find y. Equation (3) will be easiest, so use this one. x = 7 and y = −4 Write out the solutions. e s s - R e v i e w C o p y - C a m b r i d g e U n i v e r s i t y P r e s s - R e v i e w C o p y R e v i e w C o p y - C a m b r i d g e U n i v e r s i t y P r e s s - R e v i e w C o p y R e v i e w C o p y - C a m b r i d g e U n i v e r s i t y P r e s s - R e v i e w C o p y R e v i e w C o p y - C a m b r i d g e U n i v e r s i t y Copyright Material - Review Only - Not for Redistribution
- 316. Cambridge IGCSE Mathematics 306 Unit 4: Algebra Solving by elimination You can also solve the equations by eliminating (getting rid of) one of the variables by adding the two equations together. Worked example 3 Solve the following pair of equations using elimination: x − y = 4 (1) x + y = 6 (2) x y − = x y − = x y 4 (1) x y + = x y + = x y 6 2 1 x 2 1 = 2 10 (2) You can add the two equations together by adding the left-hand sides and adding the right-hand sides. 2 10 10 2 5 2 1 2 1 x 2 1 2 1 ⇒ = x ⇒ = = Notice that the equation that comes from this addition no longer contains a ‘y’ term, and that it is now possible to complete the calculation by solving for x. x = 5 x y y y + = x y + = x y ⇒ + = 6 5 6 y 5 6 ⇒ + 5 6 ⇒ + = 5 6 1 As you saw in the previous section you will need a y value to go with this. Substitute x into equation (2). x − y = 5 − 1 = 4 Check that these values for x and y work in equation (1). Both equations are satisfied by the pair of values x = 5 and y = 1. The following worked examples look at different cases where you may need to subtract, instead of add, the equations or where you may need to multiply one, or both, equations before you consider addition or subtraction. Worked example 4 Solve the following pairs of simultaneous equations: 2x − 3y = −8 (1) 5x + 3y = 1 (2) 2 3 8 5 3 1 7 7 x y 2 3 x y 2 3 x y 5 3 x y 5 3 7 7 7 7 − = x y − = 2 3 x y − = 2 3 x y + = 5 3 + = 5 3 x y + = 5 3 x y + = 5 3 x y 7 7 7 7 − 7 7 7 7 ⇒ x = −1 (1) + (2) Notice that these equations have the same coefficient of y in both equations, though the signs are different. If you add these equations together, you make use of the fact that −3y + 3y = 0 2 3 8 2 1 3 8 6 3 0 3 6 2 x y 2 3 x y 2 3 y 3 8 3 8 y y 3 6 3 6 y − = x y − = 2 3 x y − = 2 3 x y ⇒ − 2 1 ⇒ − − = 3 8 − = 3 8 3 8 3 8 − = − = 6 3 − = 6 3y − = 3 6 3 6 = − 3 8 3 8 ( ) 2 1 ( ) 2 1 ⇒ − ( ) ⇒ − 2 1 ⇒ − 2 1 ( ) 2 1 ⇒ − Substitute in (1) Now that you have the value of x, you can substitute this into either equation and then solve for y. 5x + 3y = 5(−1) + 3(2) = −5 + 6 = 1 Now you should check these values in equation (2) to be sure. The second equation is also satisfied by these values so x = −1 and y = 2. Always ‘line up’ ‘x’s with ‘x’s, ‘y’s with ‘y’s and ‘=‘ with ‘=‘. It will make your method clearer. Remind yourself about dealing with directed numbers from chapter 1. REWIND e s s - R e v i e w C o p y - C a m b r i d g e U n i v e r s i t y P r e s s - R e v i e w C o p y R e v i e w C o p y - C a m b r i d g e U n i v e r s i t y P r e s s - R e v i e w C o p y R e v i e w C o p y - C a m b r i d g e U n i v e r s i t y P r e s s - R e v i e w C o p y R e v i e w C o p y - C a m b r i d g e U n i v e r s i t y Copyright Material - Review Only - Not for Redistribution
- 317. 307 Unit 4: Algebra 14 Further solving of equations and inequalities Manipulating equations before solving them Sometimes you need to manipulate or rearrange one or both of the equations before you can solve them simultaneously by elimination. Worked examples 6 to 8 show you how this is done. Worked example 5 Solve simultaneously: 4x + y = −1 (1) 7x + y = −4 (2) 7 4 4 1 3 3 x y 7 4 x y 7 4 x y 4 1 x y 4 1 3 3 3 3 7 4 + = 7 4 7 4 x y 7 4 + = 7 4 x y 4 1 + = 4 1 4 1 x y 4 1 + = 4 1 x y 3 3 3 3 7 4 7 4 4 1 4 1 3 3 3 3 ⇒ x = −1 (2) − (1) Notice this time that you have the same coefficient of y again, but this time the ‘y’ terms have the same sign. You now make use of the fact that y − y = 0 and so subtract one equation from the other. There are more ‘x’s in (2) so, consider (2) – (1). 4 1 4 1 1 3 x y 4 1 x y 4 1 y y 4 1 + = 4 1 4 1 x y 4 1 + = 4 1 x y ⇒ + 4 1 ⇒ + ⇒ + = = 4 1 4 1 − − y − − ⇒ + − − = − − ( ) 4 1 ( ) 4 1 ( ) ⇒ + ( ) ⇒ + 4 1 ⇒ + ( ) 4 1 ⇒ + ⇒ + − − ( ) ⇒ + − − 4 1 ⇒ + − − 4 1 ⇒ + ( ) ⇒ + 4 1 − − ⇒ + Substitute in (1) 7x + y = 7(−1) + = −7 + 3 = −4 Now check that the values x = −1 and y = 3 work in equation (2). Equation (2) is also satisfied by these values, so x = −1 and y = 3. Always make it clear which equation you have chosen to subtract from which. Here, you have used the fact that −4 − (−1) = −3. Worked example 6 Solve simultaneously: 2x − 5y = 24 (1) 4x + 3y = −4 (2) 2 × (1) 4x − 10y = 48 (3) With this pair of simultaneous equations notice that neither the coefficient of x nor the coefficient of y match. But, if you multiply equation (1) by 2, you can make the coefficient of x the same in each. 4x + 3y = −4 (2) 4x − 10y = 48 (3) This equation, now named (3), has the same coefficient of x as equation (2) so write both of these equations together and solve as before. 4 3 4 4 10 48 13 52 x y 4 3 x y 4 3 x y 4 1 x y 4 10 4 x y 0 4 y + = 4 3 + = 4 3 x y + = 4 3 x y + = 4 3 x y 0 4 − = 0 4 x y − = 4 1 x y − = 4 1 x y 0 4 x y 0 4 − = x y = − − ⇒ y = −4 (2) − (3) 2 5 24 2 5 4 24 2 20 24 2 x y 2 5 x y 2 5 2 5 2 5 2 2 2 2 x − = x y − = 2 5 x y − = 2 5 x y ⇒ − 2 5 ⇒ − 2 5 2 5 2 5 ⇒ − 4 2 − = 4 2 + = 2 2 + = 2 20 2 + = 0 2 = ( ) 4 2 ( ) 4 2 − = ( ) 4 2 − = ( ) 4 2 − = Substitute in (1) 4x + 3y = 4(2) + 3(−4) = 8 − 12 = −4 Check using equation (2). So the pair of values x = 2 and y = −4 satisfy the pair of simultaneous equations. e s s - R e v i e w C o p y - C a m b r i d g e U n i v e r s i t y P r e s s - R e v i e w C o p y R e v i e w C o p y - C a m b r i d g e U n i v e r s i t y P r e s s - R e v i e w C o p y R e v i e w C o p y - C a m b r i d g e U n i v e r s i t y P r e s s - R e v i e w C o p y R e v i e w C o p y - C a m b r i d g e U n i v e r s i t y Copyright Material - Review Only - Not for Redistribution
- 318. Cambridge IGCSE Mathematics 308 Unit 4: Algebra Worked example 8 Solve simultaneously: 3 4 2 10 x y 3 4 x y 3 4 3 4 x y 3 4 x y = (1) 3 2 4 2 x y 3 2 x y 3 2 3 2 3 2 3 2 x y 3 2 x y = (2) 3 4 20 x y 3 4 x y 3 4 − = x y − = 3 4 x y − = 3 4 x y (3) In this pair of equations it makes sense to remove the fractions before you work with them. Multiply both sides of equation (1) by 2. 3x + 2y = 8 (4) Multiply both sides of equation (2) by 4. 3x – 4y = 20 (3) 3x + 2y = 8 (4) −6y = 12 y = −2 Subtract equation (4) from equation (3). 3x – 4(–2) = 20 3x + 8 = 20 3x = 12 x = 4 Substitute the value for y into equation (3). 3(4) + 2(–2) = 12 – 4 = 8 Check using equation (4). So x = 4 and y = −2 Worked example 7 Solve simultaneously: 2x – 21 = 5y 3 + 4y = −3x 2x − 5y = 21 (1) 3x + 4y = −3 (2) Before you can work with these equations you need to rearrange them so they are in the same form. In this pair, not only is the coefficient of x different but so is the coefficient of y. It is not possible to multiply through just one equation to solve this problem. 4 × (1) ⇒ 8x − 20y = 84 (3) 5 × (2) ⇒ 15x + 20y = −15 (4) Here, you need to multiply each equation by a different value so that the coefficient of x or the coefficient of y match. It is best to choose to do this for the ‘y’ terms here because they have different signs and it is simpler to add equations rather than subtract! 8 20 84 15 20 15 23 69 x y 8 2 x y 8 20 8 x y 0 8 x y 20 x y x 0 8 − = 0 8 x y − = 8 2 x y − = 8 2 x y 0 8 x y 0 8 − = x y + = 20 + = x y + = x y 20 x y + = x y = − (3) + (4) x = 3 2 5 21 2 3 5 21 5 15 3 x y 2 5 x y 2 5 y 5 2 5 2 y 5 1 5 1 y − = x y − = 2 5 x y − = 2 5 x y ⇒ − 2 3 ⇒ − 5 2 5 2 5 1 5 1 = ( ) 2 3 ( ) 2 3 ⇒ − ( ) ⇒ − 2 3 ⇒ − ( ) 2 3 ⇒ − 5 1 5 1 − Substitute for x in (1). 3x + 4y = 3(3) + 4(−3) = 9 − 12 = −3 Check using equation (2). So x = 3 and y = −3 satisfy the pair of simultaneous equations. e s s - R e v i e w C o p y - C a m b r i d g e U n i v e r s i t y P r e s s - R e v i e w C o p y R e v i e w C o p y - C a m b r i d g e U n i v e r s i t y P r e s s - R e v i e w C o p y R e v i e w C o p y - C a m b r i d g e U n i v e r s i t y P r e s s - R e v i e w C o p y R e v i e w C o p y - C a m b r i d g e U n i v e r s i t y Copyright Material - Review Only - Not for Redistribution
- 319. 309 Unit 4: Algebra 14 Further solving of equations and inequalities Exercise 14.2 1 Solve for x and y by substitution. Check each solution. a y + x = 7 b y = 1 – x c 2x + y = −14 d x – 8 = 2y y = x + 3 x – 5 = y y = 6 x + y = −2 e 3x – 2 = −2y f 3x + y = 6 g 4x – 1 = 2y h 3x – 4y = 1 2x – y = −8 9x + 2y = 1 x + 1 = 3y 2x = 4 – 3y 2 Solve for x and y by elimination. Check each solution. a 2 4 5 24 x y 2 4 x y 2 4 x y 5 2 x y 5 2 2 4 − = 2 4 2 4 x y 2 4 − = 2 4 x y 5 2 + = 5 2 5 2 x y 5 2 + = 5 2 x y b −3 2 6 3 5 36 x y 3 2 x y 3 2 x y 3 5 x y 3 5 + = 3 2 + = 3 2 x y + = 3 2 x y + = 3 2 x y + = 3 5 + = 3 5 x y + = 3 5 x y + = 3 5 x y c 2 5 12 2 3 8 x y 2 5 x y 2 5 x y 2 3 x y 2 3 + = 2 5 + = 2 5 x y + = 2 5 x y + = 2 5 x y + = 2 3 + = 2 3 x y + = 2 3 x y + = 2 3 x y d 5 2 27 3 2 13 x y 5 2 x y 5 2 x y 3 2 x y 3 2 − = x y − = 5 2 x y − = 5 2 x y + = 3 2 + = 3 2 x y + = 3 2 x y + = 3 2 x y e x y x y + = x y + = x y + = x y + = x y 2 1 + = 2 1 + = x y + = 2 1 x y + = 1 3 1 x y 3 1 x y + = 3 1 + = x y + = 3 1 x y + = 5 f −2 5 13 2 3 11 x y 2 5 x y 2 5 x y 2 3 x y 2 3 + = 2 5 + = 2 5 x y + = 2 5 x y + = 2 5 x y + = 2 3 + = 2 3 x y + = 2 3 x y + = 2 3 x y g 4 27 3 15 x y 4 2 x y 4 2 x y 3 1 x y 3 1 4 2 + = 4 2 4 2 x y 4 2 + = 4 2 x y 3 1 − = 3 1 3 1 x y 3 1 − = 3 1 x y h 4 16 6 26 x y 4 1 x y 4 1 x y 6 2 x y 6 2 4 1 − = 4 1 4 1 x y 4 1 − = 4 1 x y 6 2 − = 6 2 6 2 x y 6 2 − = 6 2 x y i 6 5 9 2 5 23 x y 6 5 x y 6 5 x y 2 5 x y 2 5 − = x y − = 6 5 x y − = 6 5 x y + = 2 5 + = 2 5 x y + = 2 5 x y + = 2 5 x y j 6 18 4 10 x y 6 1 x y 6 1 x y 4 1 x y 4 1 6 1 − = 6 1 6 1 x y 6 1 − = 6 1 x y 4 1 − = 4 1 4 1 x y 4 1 − = 4 1 x y k x y x y + = x y + = x y 12 5 2 x y 5 2 − = 5 2 x y − = x y 5 2 − = 4 l 4 3 22 4 18 x y 4 3 x y 4 3 x y 4 1 x y 4 1 + = 4 3 + = 4 3 x y + = 4 3 x y + = 4 3 x y 4 1 + = 4 1 4 1 x y 4 1 + = 4 1 x y 3 Solve simultaneously. Use the method you find easiest. Check all solutions. a 5 3 22 10 16 x y 5 3 x y 5 3 x y + = 5 3 + = 5 3 x y + = 5 3 x y + = 5 3 x y − = x y − = x y b 4 3 25 9 31 x y 4 3 x y 4 3 x y 9 3 x y 9 3 + = 4 3 + = 4 3 x y + = 4 3 x y + = 4 3 x y + = 9 3 + = 9 3 x y + = x y 9 3 x y 9 3 + = x y c − − − 3 5 6 5 − − 6 5 − −20 x y 3 5 x y 3 5 x y 6 5 x y 6 5 − − 6 5 x y − − 6 5 3 5 + = 3 5 3 5 x y 3 5 + = 3 5 x y + = − − + = 6 5 + = 6 5 x y + = − − x y − − + = x y 6 5 x y + = 6 5 x y − − 6 5 − − x y 6 5 + = − − 6 5 − − x y 6 5 d x y x y + = x y + = x y + = x y + = 10 3 5 x y 3 5 x y + = 3 5 + = x y + = x y 3 5 x y + = 40 e 6 11 2 2 1 x y 6 1 x y 6 1 x y 2 2 x y 2 2 6 1 + = 6 1 6 1 x y 6 1 + = 6 1 x y + = 2 2 + = 2 2 x y + = 2 2 x y + = 2 2 x y − f 4 3 11 5 9 2 x y 4 3 x y 4 3 x y 5 9 x y 5 9 − = x y − = 4 3 x y − = 4 3 x y − = x y − = 5 9 x y − = 5 9 x y − g 6 2 9 7 4 12 x y 6 2 x y 6 2 x y 7 4 x y 7 4 + = 6 2 + = 6 2 x y + = 6 2 x y + = 6 2 x y + = 7 4 + = 7 4 x y + = 7 4 x y + = 7 4 x y h 12 13 34 3 26 19 x y 13 x y x y 3 2 x y 3 26 1 x y 6 1 − = x y − = x y 13 x y − = x y 6 1 − = 6 1 x y − = 3 2 x y − = 3 2 x y 6 1 x y 6 1 − = x y i 5 17 3 25 19 45 x y 5 1 x y 5 17 3 x y 7 3 x y 19 x y 7 3 − = 7 3 x y − = 5 1 x y − = 5 1 x y 7 3 x y 7 3 − = x y − = x y − = x y 19 x y − = x y 7 3 7 3 − j 3 3 13 4 12 6 x y 3 3 x y 3 3 x y 4 1 x y 4 12 6 x y 2 6 − = x y − = 3 3 x y − = 3 3 x y 2 6 − = 2 6 x y − = 4 1 x y − = 4 1 x y 2 6 x y 2 6 − = x y 2 6 2 6 k 10 2 2 2 7 1 x y 2 2 x y y x 2 7 y x 2 7 x y = − x y 2 2 x y = − 2 2 x y − − y x − − 2 7 y x − − 2 7 y x 2 7 y x 2 7 y x l − = 2 1 − = 2 1 − = 7 4 4 2 y x 2 1 y x 2 1 − = 2 1 y x − = 2 1 7 y x x y 4 4 x y 4 4 = 4 4 x y 4 4 2 x y y x y x x y x y y x y x + x y x y m x y x y x y x y x y x y 12 x y 12 x y 2 + x y x y x y x y 3 x y x y n 3 4 3 10 2 x y 3 4 x y 3 4 x y 3 1 x y 3 10 2 x y + = 3 4 + = 3 4 x y + = 3 4 x y + = 3 4 x y − + = 3 1 + = 3 10 2 + = x y + = 3 1 x y + = 3 1 x y 0 2 x y + = 0 2 x y 1 o 2 7 11 2 x y 2 7 x y 2 7 x y 2 x y 2 7 + = 2 7 2 7 x y 2 7 + = 2 7 x y + = x y + = x y 4 Solve simultaneously. a 3 7 37 5 6 39 x y 3 7 x y 3 7 x y 5 6 x y 5 6 + = 3 7 + = 3 7 x y + = 3 7 x y + = 3 7 x y + = 5 6 + = 5 6 x y + = 5 6 x y + = 5 6 x y b 2 5 16 3 5 14 x y 2 5 x y 2 5 x y 3 5 x y 3 5 − = x y − = 2 5 x y − = 2 5 x y − − = x y − = 3 5 x y − = 3 5 x y − c − + = − + = 7 4 − + 7 4 − + 41 5 6 − + 5 6 − + 45 x y 7 4 x y 7 4 − + 7 4 x y − + 7 4 x y 5 6 x y 5 6 − + 5 6 x y − + 5 6 d 7 4 54 2 3 21 x y 7 4 x y 7 4 x y 2 3 x y 2 3 + = 7 4 + = 7 4 x y + = 7 4 x y + = 7 4 x y + = 2 3 + = 2 3 x y + = 2 3 x y + = 2 3 x y e 2 1 3 5 34 x y 2 1 x y 2 1 x y 3 5 x y 3 5 2 1 − = 2 1 2 1 x y 2 1 − = 2 1 x y + = 3 5 + = 3 5 x y + = 3 5 x y + = 3 5 x y f 3 4 25 3 15 x y 3 4 x y 3 4 x y 3 1 x y 3 1 − = x y − = 3 4 x y − = 3 4 x y 3 1 − = 3 1 x y − = x y 3 1 x y 3 1 − = x y g 7 4 23 4 5 35 x y 7 4 x y 7 4 x y 4 5 x y 4 5 − = x y − = 7 4 x y − = 7 4 x y + = 4 5 + = 4 5 x y + = 4 5 x y + = 4 5 x y h 3 2 3 5 26 x y 3 2 x y 3 2 x y 3 5 x y 3 5 3 2 − = 3 2 3 2 x y 3 2 − = 3 2 x y + = 3 5 + = 3 5 x y + = 3 5 x y + = 3 5 x y i 2 7 25 5 x y 2 7 x y 2 7 x y + = 2 7 + = 2 7 x y + = 2 7 x y + = 2 7 x y + = x y + = x y j x y x y + = x y + = x y 3 x y x y + = + = x y + = x y + = 4 7 x y 4 7 + = 4 7 x y + = x y 4 7 + = − 4 7 k 3 11 2 4 x y 3 1 x y 3 1 x y 2 4 x y 2 4 + = 3 1 + = 3 11 + = x y + = x y 3 1 x y + = 3 1 x y 1 x y + = x y x y x y − + 2 4 − + 2 4 2 4 x y 2 4 − + 2 4 x y 2 4 2 4 l y x x y y x = − y x − = x y − = − 6 1 y x 6 1 y x = − 6 1 y x = − 6 1 y x = − 4 3 x y 4 3 x y x y − = x y 4 3 x y − = 4 m 2 3 8 0 4 5 x y 2 3 x y 2 3 x y 4 5 x y 4 5 + − 2 3 + − 2 3 x y + − 2 3 x y + − 2 3 x y 8 0 8 0 + = 4 5 + = 4 5 x y + = x y 4 5 x y + = 4 5 x y n y x y x = + y x = + y x y x = + − = y x − = 2 3 y x y x y x = + y x = + 6 2 4 y x 2 4 y x y x − = y x 2 4 y x − = 20 o 8 5 0 13 8 1 x y 8 5 x y 8 5 x y 8 1 x y 8 1 − = x y − = 8 5 x y − = 8 5 x y = + 8 1 = + 8 1 x y = + x y 8 1 x y 8 1 = + x y Remember from chapter 1 that adding a negative is the same as subtracting a positive. REWIND Remember that you need either the same coefficient of x or the same coefficient of y. If both have the same sign, you should then subtract one equation from the other. If they have a different sign, then you should add. e s s - R e v i e w C o p y - C a m b r i d g e U n i v e r s i t y P r e s s - R e v i e w C o p y R e v i e w C o p y - C a m b r i d g e U n i v e r s i t y P r e s s - R e v i e w C o p y R e v i e w C o p y - C a m b r i d g e U n i v e r s i t y P r e s s - R e v i e w C o p y R e v i e w C o p y - C a m b r i d g e U n i v e r s i t y Copyright Material - Review Only - Not for Redistribution
- 320. Cambridge IGCSE Mathematics 310 Unit 4: Algebra 5 Solve each pair of equations simultaneously. a 1 2 2 3 1 5 3 4 1 7 3 5 6 13 x y 3 x y x y 7 x y + = x y + = x y x y + = − = x y − = x y x y − = b 3 7 5 8 1 3 1 2 33 64 17 12 x y 8 x y x y 17 x y − = x y − = x y x y − = − = x y − = x y 17 x y − = x y c 456 987 1 233 94 4 2 17 3 4 13 22 2 3 x y 987 x y 4 x y x y 94 x y 3 x y + = 987 + = x y + = x y x y + = 987 x y + = x y 4 x y + = x y − = x y − = x y x y − = 94 x y − = x y d 3 2 3 0 2 4 14 x y x y + = + = y + = − = − = y − = e 4 5 0 5 y x 4 5 y x 4 5 y x 4 5 + + 4 5 4 5 y x 4 5 + + 4 5 y x = = − y x = − y x f 3 3 2 2 6 3 3 3 3 2 3 3 3 3 y 3 3 3 3 y x 3 3 + = 3 3 3 3 + = 3 3 3 3 + = 3 3 3 3 − = − = g 2 2 3 6 2 x y x y 6 2 x y 6 2 + = + = y + = 6 2 x y = − 6 2 x y h y x x y y x = − y x + = + = y + = − 3 6 y x 3 6 y x = − 3 6 y x = − 3 6 y x = − 2 3 7 5 i 3 7 2 13 5 1 3 3 5 x y 2 x y x y 3 x y − = − = x y − = + = x y + = x y x y + = 3 x y + = x y 6 Form a pair of simultaneous equations for each situation below, and use them to solve the problem. Let the unknown numbers be x and y. a The sum of two numbers is 120 and one of the numbers is 3 times the other. Find the value of the numbers. b The sum of two numbers is −34 and their difference is 5. Find the numbers. c A pair of numbers has a sum of 52 and a difference of 11. Find the numbers. d The combined ages of two people is 34. If one person is 6 years younger than the other, find their ages. 7 A computer store sold 4 hard drives and 10 pen drives for $200. and 6 hard drives and 14 pen drives for $290. Find the cost of a hard drive and the cost of a pen drive. 8 A large sports stadium has 21 000 seats. The seats are organised into blocks of either 400 or 450 seats. There are three times as many blocks of 450 seats as there are blocks of 400 seats. How many blocks are there? 14.2 Linear inequalities The work earlier in the book on linear equations led to a single solution for a single variable. Sometimes however, there are situations where there are a range of possible solutions. This section extends the previous work on linear equations to look at linear inequalities. Number lines Suppose you are told that x 4. You will remember from chapter 1 that this means each possible value of x must be less than 4. Therefore, x can be 3, 2, 1, 0, −1, −2 . . . but that is not all. 3.2 is also less than 4, as is 3.999, 2.43, −3.4, −100 . . . If you draw a number line, you can use an arrow to represent the set of numbers: 0 1 2 3 4 5 –5 –4 –3 –2 –1 x x 4 This allows you to show the possible values of x neatly without writing them all down (there is an infinite number of values, so you can’t write them all down!). Notice that the ‘open circle’ above the four is not filled in. This symbol is used because it is not possible for x to be equal to four. Now suppose that x −2. This now tells you that x can be greater than, or equal to −2. You can show that that x can be equal to −2 by ‘filling in’ the circle above −2 on the number line: 0 1 2 3 4 5 –5 –4 –3 –2 –1 x x ≥ –2 Think carefully about these problems and consider how you can recognise problems involving simultaneous equations if you are not told to use this method to solve them. Remind yourself how inequality symbols were used for grouped data in chapter 12. REWIND You will find it useful to review inequalities before you tackle histograms in chapter 20. FAST FORWARD If an equation contains fractions, you can make everything much easier by multiplying each term by a suitable number (a common denominator). ‘Clear’ the fractions first. E e s s - R e v i e w C o p y - C a m b r i d g e U n i v e r s i t y P r e s s - R e v i e w C o p y R e v i e w C o p y - C a m b r i d g e U n i v e r s i t y P r e s s - R e v i e w C o p y R e v i e w C o p y - C a m b r i d g e U n i v e r s i t y P r e s s - R e v i e w C o p y R e v i e w C o p y - C a m b r i d g e U n i v e r s i t y Copyright Material - Review Only - Not for Redistribution
- 321. 311 Unit 4: Algebra 14 Further solving of equations and inequalities Exercise 14.3 1 Draw a number line to represent the possible values of the variable in each case. a x 5 b x 2 c p 6 d y −8 e q −5 f x −4 g 1.2 x 3.5 h −3.2 x 2.9 i −4.5 k −3.1 2 Write down all integers that satisfy each of the following inequalities. a 3 b 33 b 7 h 19 c 18 e 27 d −3 f 0 e −3 f 0 f 2.5 m 11.3 g −7 g −4 h π r 2π i 5 1 5 18 5 1 5 1 5 1 5 1 5 1 5 1 The following worked examples show that more than one inequality symbol can appear in a question. Worked example 9 Show the set of values that satisfy each of the following in equalities on a number line. a x 3 b 4 y 8 c −1.4 x 2.8 d List all integers that satisfy the inequality 4.2 x 10.4 a The values of x have to be larger than 3. x cannot be equal to 3, so do not fill in the circle. ‘Greater than’ means ‘to the right’ on the number line. 0 1 2 3 4 5 –5 –4 –3 –2 –1 x x 3 b Notice that y is now being used as the variable and this should be clearly labelled on your number line. Also, two inequality symbols have been used. In fact there are two inequalities, and both must be satisfied. 4 y tells you that y is greater than (but not equal) to 4. y 8 tells you that y is also less than (but not equal to) 8. So y lies between 4 and 8 (not inclusive): 0 1 2 3 4 5 6 7 8 9 10 y 4 y 8 c This example has two inequalities that must both be satisfied. x is greater than (but not equal to) −1.4, and x is less than or equal to 2.8: ±[” [ ± ± ± ± ± d Here x must be greater than, but not equal to 4.2. So the smallest possible value of x is 5. x must also be less than or equal to 10.4. The largest that x can be is therefore 10. So the possible values of x are 5, 6, 7, 8, 9 or 10. E e s s - R e v i e w C o p y - C a m b r i d g e U n i v e r s i t y P r e s s - R e v i e w C o p y R e v i e w C o p y - C a m b r i d g e U n i v e r s i t y P r e s s - R e v i e w C o p y R e v i e w C o p y - C a m b r i d g e U n i v e r s i t y P r e s s - R e v i e w C o p y R e v i e w C o p y - C a m b r i d g e U n i v e r s i t y Copyright Material - Review Only - Not for Redistribution
- 322. Cambridge IGCSE Mathematics 312 Unit 4: Algebra Solving inequalities algebraically Consider the inequality 3x 6. Now, suppose that x = 2, then 3x = 6 but this doesn’t quite satisfy the inequality! Any value of x that is larger than 2 will work however. For example: If x = 2.1, then 3x = 6.3, which is greater than 6. In the same way that you could divide both sides of an equation by 3, both sides of the inequality can be divided by 3 to get the solution: 3 6 3 3 6 3 2 3 6 3 6 x x 3 6 3 6 Notice that this solution is a range of values of x rather than a single value. Any value of x that is greater than 2 works! In fact you can solve any linear inequality in much the same way as you would solve a linear equation, though there are important exceptions, and this is shown in the ‘warning’ section on page 283. Most importantly, you should simply remember that what you do to one side of the inequality you must do to the other. Worked example 10 Find the set of values of x for which each of the following inequalities holds. a 3x − 4 14 b 4(x − 7) 16 c 5x − 3 2x + 18 d 4 − 7x 53 a 3x − 4 14 3x 18 Add 4 to both sides. 3 3 18 3 x Divide both sides by 3. So, x 6 b 4(x − 7) 16 4x − 28 16 Expand the brackets. 4x 44 Add 28 to both sides. 4 4 44 4 x Divide both sides by 4. So, x 11 4(x − 7) 16 Notice that you can also solve this inequality by dividing both sides by 4 at the beginning: x − 7 4 Divide both sides by 4. x 11 Add 7 to both sides to get the same answer as before. c 5x − 3 2x + 18 5x − 3 − 2x 2x + 18 − 2x Subtract the smaller number of ‘x’s from both sides (2x). 3x − 3 18 Simplify. 3x 21 Add 3 to both sides. x 7 Divide both sides by 3. E e s s - R e v i e w C o p y - C a m b r i d g e U n i v e r s i t y P r e s s - R e v i e w C o p y R e v i e w C o p y - C a m b r i d g e U n i v e r s i t y P r e s s - R e v i e w C o p y R e v i e w C o p y - C a m b r i d g e U n i v e r s i t y P r e s s - R e v i e w C o p y R e v i e w C o p y - C a m b r i d g e U n i v e r s i t y Copyright Material - Review Only - Not for Redistribution
- 323. 313 Unit 4: Algebra 14 Further solving of equations and inequalities A warning Before working through the next exercise you should be aware that there is one further rule to remember. Consider this inequality: 3 5 18 5 15 − 3 5 − 3 5 ⇒ −5 1 5 1 x − − 5 1 5 1 If you divide both sides of this by −5 it appears that the solution will be, x −3 This is satisfied by any value of x that is greater than −3, for example −2, −1, 2.4, 3.5, 10 . . . If you calculate the value of 3 − 5x for each of these values you get 13, 8, −9, −14.5, −47 . . . and not one of these works in the original inequality as they are all smaller than 18. But here is an alternate solution: 3 5 18 3 18 5 15 5 3 − 3 5 − 3 5 ⇒ 3 1 ⇒ 3 18 5 8 5 − 15 − − 3 − x − − x x x or, x −3 This is a correct solution, and the final answer is very similar to the ‘wrong’ one above. The only difference is that the inequality symbol has been reversed. You should remember the following: If you multiply or divide both sides of an inequality by a negative number then you must reverse the direction of the inequality. Exercise 14.4 Solve each of the following inequalities. Some of the answers will involve fractions. Leave your answers as fractions in their simplest form where appropriate. 1 a 18x 36 b 13x 39 c 15y 14 d 7y −14 e 4 + 8c 20 f 2x + 1 9 g x 3 2 h 5p − 3 12 i x 3 7 2 + 7 2 + 7 2 j 12g − 14 34 k 22(w − 4) 88 l 10 − 10k 3 2 a y + 6 4 9 b 10q − 12 48 + 5q c 3g − 7 5g − 18 d 3(h − 4) 5(h − 10) e y + 6 4 9 f 1 2 5 2 ( ) 5 2 ( ) 5 2 ( ) ( ) ( ) ( ) 5 2 5 2 g 3 − 7h 6 − 5h h 2(y − 7) + 6 5(y + 3) + 21 i 6(n − 4) − 2(n + 1) 3(n + 7) + 1 j 5(2v − 3) − 2(4v − 5) 8(v + 1) If you can avoid negatives, by adding or subtracting terms, then try to do so. d 4 − 7x 53 4 53 + 7x Add 7x to both sides −49 7x Subtract 53 from both sides. −7 x And, x −7. Divide both sides by 7. Notice that the x is on the right-hand side of the inequality in this answer. This is perfectly acceptable. You can reverse the entire inequality to place the x on the left without changing its meaning, but you must remember to reverse the actual inequality symbol! E e s s - R e v i e w C o p y - C a m b r i d g e U n i v e r s i t y P r e s s - R e v i e w C o p y R e v i e w C o p y - C a m b r i d g e U n i v e r s i t y P r e s s - R e v i e w C o p y R e v i e w C o p y - C a m b r i d g e U n i v e r s i t y P r e s s - R e v i e w C o p y R e v i e w C o p y - C a m b r i d g e U n i v e r s i t y Copyright Material - Review Only - Not for Redistribution
- 324. Cambridge IGCSE Mathematics 314 Unit 4: Algebra k z − − 2 3 7 1 − 7 1 − 3 l 3 1 7 7 7 k 3 1 3 1 3 1 3 1 − 7 7 − 7 7 m 2 1 9 7 6 e 2 1 2 1 e 2 1 2 1 − 7 6 − 7 6 3 a 2 2 1 3 12 t t 2 1 2 1 − 2 1 2 1 b 2 3 2 1 9 12 t t 2 1 2 1 − 2 1 2 1 c 2 7 2 1 9 12 t t 2 1 2 1 − 2 1 2 1 d r 2 1 3 2 + + e 3 8 1 3 2 9 1 4 2 8 7 ( ) 2 ( ) 3 ( ) ( ) ( ) 2 8 ( ) 2 8 d d d d 1 d d 2 d d ( ) d d ( ) ( ) d d 1 ( ) d d ( ) ( ) d d ( ) 7 3 ( ) d d ( ) d d ( ) ( ) 2 8 ( ) 2 8 ( ) d d − − d d ( ) d d − − ( ) d d ( ) d d − − d d − + − + − + ( ) − + ( ) d d ( ) − + d d 7 3 ( ) d d ( ) − + 7 3 ( ) 7 3 d d ( ) d − + 2 8 ( ) 2 8 ( ) − + − + 4 a = 6.2, correct to 1 decimal place. b = 3.86, correct to 2 decimal places. Find the upper and lower bounds of the fraction a b ab a b a b . Give your answers correct to 2 decimal places. 14.3 Regions in a plane So far, you have only considered one variable and inequalities along a number line. You can, however, have two variables connected with an inequality, in which case you end up with a region on the Cartesian plane. Diagram A shows a broken line that is parallel to the x-axis. Every point on the line has a y co-ordinate of 3. This means that the equation of the line is y = 3. All of the points above the line y = 3 have y co-ordinates that are greater than 3. The region above the line thus represents the inequality y 3. Similarly, the region below the line represents the inequality y 3. These regions are shown on diagram B. In diagram C, the graph of y = 2x + 1 is shown as a broken line. Every point on the line has co-ordinates (x, y) which satisfy y = 2x + 1. Q is a point on the line. Point P has a y co-ordinate that is greater than the y co-ordinate of Q. P and Q have the same x co-ordinate. This means that for any point P in the region above the line, y 2x + 1. –1 0 1 2 3 4 1 2 3 4 –4 –3 –2 –1 y = 3 x y A –1 0 1 2 3 4 y = 3 x 1 2 3 4 –4 –3 –2 –1 B y y 3 y 3 –1 0 1 2 3 4 5 x y C y = 2x + 1 Q P 1 2 3 4 –4 –3 –2 –1 6 7 Upper and Lower bounds are covered in chapter 13. REWIND You will need to think about how the fraction could be re-written Tip E e s s - R e v i e w C o p y - C a m b r i d g e U n i v e r s i t y P r e s s - R e v i e w C o p y R e v i e w C o p y - C a m b r i d g e U n i v e r s i t y P r e s s - R e v i e w C o p y R e v i e w C o p y - C a m b r i d g e U n i v e r s i t y P r e s s - R e v i e w C o p y R e v i e w C o p y - C a m b r i d g e U n i v e r s i t y Copyright Material - Review Only - Not for Redistribution
- 325. 315 Unit 4: Algebra 14 Further solving of equations and inequalities The region above the line represents the inequality y 2x + 1. Similarly the region below the line represents the inequality y 2x + 1. You can see this on diagram D. y 2x + 1 y 2x + 1 –1 1 2 3 4 5 6 7 x y D y = 2x + 1 Q P 0 1 2 3 4 –4 –3 –2 –1 If the equation of the line is in the form y = mx + c, then: • the inequality y mx + c is above the line • the inequality y mx + c is below the line. If the equation is not in the form y = mx + c, you have to find a way to check which region represents which inequality. Worked example 11 In a diagram, show the regions that represent the inequalities 2x − 3y 6 and 2x − 3y 6. 2x – 3y 6 2x – 3y 6 –3 –2 –1 0 1 2 3 x y 1 2 3 4 5 –3 –2 –1 2x – 3y = 6 The boundary between the two required regions is the line 2x − 3y = 6. This line crosses the x-axis at (3, 0) and the y-axis at (0, –2). It is shown as a broken line in this diagram. Consider any point in the region above the line. The easiest point to use is the origin (0, 0). When x = 0 and y = 0, 2x − 3y = 0. Since 0 is less than 6, the region above the line represents the inequality 2x − 3y 6. E e s s - R e v i e w C o p y - C a m b r i d g e U n i v e r s i t y P r e s s - R e v i e w C o p y R e v i e w C o p y - C a m b r i d g e U n i v e r s i t y P r e s s - R e v i e w C o p y R e v i e w C o p y - C a m b r i d g e U n i v e r s i t y P r e s s - R e v i e w C o p y R e v i e w C o p y - C a m b r i d g e U n i v e r s i t y Copyright Material - Review Only - Not for Redistribution
- 326. Cambridge IGCSE Mathematics 316 Unit 4: Algebra Worked example 12 By shading the unwanted region, show the region that represents the inequality 3x − 5y 15. –3 –2 –1 0 1 2 3 x y 1 2 3 4 5 6 7 –2 –1 3x – 5y = 15 The boundary line is 3x − 5y = 15 and it is included in the region (because the inequality includes equal to). This line crosses the x-axis at (5, 0) and crosses the y-axis at (0, –3). It is shown as a solid line in this diagram. When x = 0 and y = 0, 3x − 5y = 0. Since 0 is less than 15, the origin (0, 0) is in the required region. (Alternatively, rearrange 3x − 5y 15 to get y x ≥ − y x ≥ − y x y x ≥ − 3 ≥ − ≥ − y x ≥ − y x ≥ − 5 y x y x y x ≥ − y x ≥ − 3 and deduce that the required region is above the line.) The unshaded region in this diagram represents the inequality, 3x − 5y 15. Sometimes it is better to shade out the unwanted region. Worked example 13 By shading the unwanted region, show the region that represents the inequality 3x − 2y 0. –2 –1 1 3 4 x y 0 1 2 3 4 –2 –1 P 3x – 2y = 0 2 You cannot take the origin as the check-point because it lies on the boundary line. Instead take the point P (0, 2) which is above the line. When x = 0 and y = 2, 3x − 2y = − 4, which is less than 0. Hence P is not in the required region. The boundary line is 3x − 2y = 0 and it is included in the region. It is shown as a solid line in this diagram. Rules about boundaries and shading of regions You have already seen inequalities are not always or . They may also be or . Graphical representations have to show the difference between these variations. When the inequality includes equal to ( or ), the boundary line must be included in the graphical representation. It is therefore shown as a solid line. When the inequality does not include equal to ( or ), the boundary line is not included in the graphical representation, so it is shown as a broken line. E e s s - R e v i e w C o p y - C a m b r i d g e U n i v e r s i t y P r e s s - R e v i e w C o p y R e v i e w C o p y - C a m b r i d g e U n i v e r s i t y P r e s s - R e v i e w C o p y R e v i e w C o p y - C a m b r i d g e U n i v e r s i t y P r e s s - R e v i e w C o p y R e v i e w C o p y - C a m b r i d g e U n i v e r s i t y Copyright Material - Review Only - Not for Redistribution
- 327. 317 Unit 4: Algebra 14 Further solving of equations and inequalities Exercise 14.5 For questions 1 to 3, show your answers on a grid with x- and y-axes running from −3 to +4. 1 By shading the unwanted region, show the region that represents the inequality 2y − 3x 6. 2 By shading the unwanted region, show the region that represents the inequality x + 2y 4. 3 By shading the unwanted region, show the region that represents the inequality x − y 0. 4 Shade the region that represents each inequality. a y 3 – 3x b 3x – 2y 6 c x 5 d y 3 e x + 3y 10 f − 3 x 5 g 0 x 2 5 Copy and complete these statements by choosing the correct option: a If y mx + c, shade the unwanted region above/below the graph of y = mx + c. b If y mx + c, shade the unwanted region above/below the graph of y = mx + c. c For y m1 x + c1 and y m2 x + c2 , shade the unwanted region above/below the graph of y = m1 x + c1 and/or above/below the graph of y = m2 x + c2 . 6 For each of the following diagrams, find the inequality that is represented by the unshaded region. a –3 –2 –1 0 1 2 3 4 5 –2 –1 1 2 3 4 5 6 x y b –3 –2 –1 1 2 3 –2 –1 0 1 2 3 4 x y c –3 –2 –1 0 1 2 3 –2 –3 –1 2 3 4 x y 1 d –3 –2 –1 0 1 2 3 –2 –3 –1 1 2 3 x y Worked example 14 Find the inequality that is represented by the unshaded region in this diagram. –2 –1 1 2 3 4 5 x y P –3 –2 –1 0 1 2 3 4 First find the equation of the boundary. Its gradient = − = − 4 2 2 and its intercept on the y-axis is y = 4. Hence the boundary line is y = −2x + 4 or this can be re-written as y + 2x = 4. Take P (3, 2) in the unshaded region as the check-point: 2 + 6 = 8. Note that 8 is greater than 4, hence, the unshaded region represents y + 2x 4. As the boundary is a broken line, it is not included, and thus the sign is not . E e s s - R e v i e w C o p y - C a m b r i d g e U n i v e r s i t y P r e s s - R e v i e w C o p y R e v i e w C o p y - C a m b r i d g e U n i v e r s i t y P r e s s - R e v i e w C o p y R e v i e w C o p y - C a m b r i d g e U n i v e r s i t y P r e s s - R e v i e w C o p y R e v i e w C o p y - C a m b r i d g e U n i v e r s i t y Copyright Material - Review Only - Not for Redistribution
- 328. Cambridge IGCSE Mathematics 318 Unit 4: Algebra Representing simultaneous inequalities When two or more inequalities have to be satisfied at the same time, they are called simultaneous inequalities. These can also be represented graphically. On the diagram in worked example 15 the inequalities are represented by regions on the same diagram. The unwanted regions are shaded or crossed out. The unshaded region will contain all the co-ordinates (x, y) that satisfy all the inequalities simultaneously. Worked example 15 By shading the unwanted regions, show the region defined by the set of inequalities y x + 2, y 4 and x 3. y = x + 2 x = 3 y = 4 5 6 4 5 –3 –2 –1 0 1 2 3 –2 –1 1 2 3 4 x y The boundaries of the required region are y = x + 2 (broken line), y = 4 (solid line) and x = 3 (solid line). The unshaded region in the diagram represents the set of inequalities y x + 2, y 4 and x 3. Notice that this region does not have a finite area – it is not ‘closed’. Exercise 14.6 1 By shading the unwanted regions, show the region defined by the set of inequalities x + 2y 6, y x and x 4. 2 By shading the unwanted regions, show the region defined by the set of inequalities x + y 5, y 2 and y 0. 3 a On a grid, draw the lines x = 4, y = 3 and x + y = 5. b By shading the unwanted regions, show the region that satisfies all the inequalities x 4, y 3 and x + y 5. Label the region R. 4 Write down the three inequalities that define the unshaded triangular region R. 5 6 –2 –1 1 2 3 4 x y R 4 –2 –1 0 1 2 3 E e s s - R e v i e w C o p y - C a m b r i d g e U n i v e r s i t y P r e s s - R e v i e w C o p y R e v i e w C o p y - C a m b r i d g e U n i v e r s i t y P r e s s - R e v i e w C o p y R e v i e w C o p y - C a m b r i d g e U n i v e r s i t y P r e s s - R e v i e w C o p y R e v i e w C o p y - C a m b r i d g e U n i v e r s i t y Copyright Material - Review Only - Not for Redistribution
- 329. 319 Unit 4: Algebra 14 Further solving of equations and inequalities 5 The unshaded region in diagram represents the set of inequalities y 0, y + 2x 2 and x + y 4. Write down the pairs of integers (x, y) that satisfy all the inequalities. 6 Draw graphs to show the solution sets of these inequalities: y 4, y x + 2 and 3x + y 4. Write down the integer co-ordinates (x, y) that satisfy all the inequalities in this case. 14.4 Linear programming Many of the applications of mathematics in business and industry are concerned with obtaining the greatest profits or incurring the least cost subject to constraints (restrictions) such as the number of workers, machines available or capital available. When these constraints are expressed mathematically, they take the form of inequalities. When the inequalities are linear (such as 3x + 2y 6), the branch of mathematics you would use is called linear programming. Greatest and least values. The expression 2x + y has a value for every point (x, y) in the Cartesian plane. Values of 2x + y at some grid points are shown in the diagram. y x –1 5 –1 –8 12 11 10 9 8 7 10 9 8 7 8 7 5 6 3 4 1 2 –1 0 –3 –2 6 4 2 0 –4 –2 6 4 2 0 –4 –2 –5 –5 –7 –6 6 4 2 0 –4 –2 –6 –8 4 2 0 –4 –2 –6 –9 5 3 1 –3 –7 5 3 1 –1 –3 –5 3 1 –3 –8 –4 –6 –9 –7 –11 –12–10 –10 –5 If points that give the same value of 2x + y are joined, they result in a set of contour lines. These contour lines are straight lines; their equations are in the form 2x + y = k (k is the constant). You can see that as k increases, the line 2x + y moves parallel to itself towards the top right-hand side of the diagram. As k decreases, the line moves parallel to itself towards the bottom left-hand side of the diagram. (Only the even numbered contours are shown here.) y x 2 x + y = – 1 2 2 x + y = – 1 0 2 x + y = – 8 2 x + y = – 6 2 x + y = – 4 2 x + y = – 2 2 x + y = 0 2 x + y = 2 2 x + y = 4 2x + y = 6 2x + y = 8 2x + y = 10 2x + y = 12 5 6 4 5 –2 –1 0 1 2 3 –2 –1 1 2 3 4 x y x + y = 4 y + 2x = 2 y = 0 E e s s - R e v i e w C o p y - C a m b r i d g e U n i v e r s i t y P r e s s - R e v i e w C o p y R e v i e w C o p y - C a m b r i d g e U n i v e r s i t y P r e s s - R e v i e w C o p y R e v i e w C o p y - C a m b r i d g e U n i v e r s i t y P r e s s - R e v i e w C o p y R e v i e w C o p y - C a m b r i d g e U n i v e r s i t y Copyright Material - Review Only - Not for Redistribution
- 330. Cambridge IGCSE Mathematics 320 Unit 4: Algebra The expression 2x + y has no greatest or least value if there are no restrictions on the values of x and y. When there are restrictions on the values, there is normally a greatest and/or a least value for the expression. Worked example 16 The numbers x and y satisfy all the inequalities x + y 4, y 2x − 2 and y x − 2. Find the greatest and least possible values of the expression 2x + y. –2 –1 1 2 3 4 5 –2 –1 0 1 2 3 4 5 y x y + x = 4 2x + y = k y = 2x – 2 y = x – 2 You only have to consider the values of 2x + y for points in the unshaded region. If 2x + y = k, then y = −2x + k. Draw a line with gradient equal to −2. (The dashed line in this example has k = 3.) Using a set square and a ruler, place one edge of your set square on the dashed line you have drawn and your ruler against one of the other sides. If you slide your set square along the ruler, the original side will remain parallel to your dashed line. Moving to the right, when your set square is just about to leave the unshaded region (at the point (3, 1)), 2x + y will have its greatest value. Substituting x = 3 and y = 1 into 2x + y gives a greatest value of 7. Similarly, moving to the left will give a least value of −2 (at co-ordinates (0, −2)). Exercise 14.7 1 In the diagram, the unshaded region represents the set of inequalities x 6, 0 y 6 and x + y 4. Find the greatest and least possible values of 3x + 2y subject to these inequalities. 0 –2 –1 1 2 3 4 5 y x 6 x + y = 4 y = 6 y = 0 x = 6 –2 –1 1 2 3 4 5 6 2 a On a grid, shade the unwanted regions to indicate the region satisfying all the inequalities y x, x + y 6 and y 0. b What is the greatest possible value of 2x + y if x and y satisfy all these inequalities? 3 The whole numbers x and y satisfy all the inequalities y 1, y x + 3 and 3x + y 6. Find the greatest and least possible values of the expression, x + y. 4 An IGCSE class is making school flags and T-shirts to sell to raise funds for the school. Due to time constraints, the class is able to make at most 150 flags and 120 T-shirts. The fabric is donated and they have enough to make 200 items in total. A flag sells for $2 and a T-shirt sells for $5. How many of each item should they make to maximise their income from sales? E e s s - R e v i e w C o p y - C a m b r i d g e U n i v e r s i t y P r e s s - R e v i e w C o p y R e v i e w C o p y - C a m b r i d g e U n i v e r s i t y P r e s s - R e v i e w C o p y R e v i e w C o p y - C a m b r i d g e U n i v e r s i t y P r e s s - R e v i e w C o p y R e v i e w C o p y - C a m b r i d g e U n i v e r s i t y Copyright Material - Review Only - Not for Redistribution
- 331. 321 Unit 4: Algebra 14 Further solving of equations and inequalities 5 A school principal wants to buy some book cases for the school library. She can choose between two types of book case. Type A costs $10 and it requires 0.6 m2 of floor space and holds 0.8m3 of books. Type B costs $20 and it requires 0.8 m2 of floor space and holds 1.2 m3 of books. The maximum floor space available is 7.2 m2 and the budget is $140 (but the school would prefer to spend less). What number and type of book cases should the principal buy to get the largest possible storage space for books? 14.5 Completing the square It can be helpful to re-write quadratic expressions in a slightly different form. Although this first method will be used to solve quadratic equations, it can be used to find the co- ordinates of maximums or minimums in a quadratic. An application of this method to the general form of a quadratic will produce the quadratic formula that is used in the next section. Remember that when you expand ( ) ( ) ( ) ( ) ( ) ( ) ( )2 you get: ( )( ) ( ) x a ( )( ) x a ( ) x ax a + + ( ) + + ( )( ) + + ( ) ( ) x a ( ) + + ( ) x a ( ) x a ( ) + + ( ) x a = + x a = + x a + x a x a 2 2 = + 2 2 = + + 2 2 2 x a x a 2 2 2 2 Most importantly you will see that the value of ‘a’ is doubled and this gives the coefficient of x in the final expansion. This is the key to the method. Now consider x x 2 6 1 x x 6 1 x x + + x x + + x x 6 1 + + 6 1 x x 6 1 x x + + 6 1 and compare with ( ) ( )( ) ( ) x x ( ) ( ) x x ( ) x ( ) + = ( ) ( ) x x + = ( ) x x + + ( ) + + ( ) + + ( ) ( ) x x ( ) + + ( ) x x + 3 3 ( ) 3 3 ( ) ( ) 3 3 ( ) x x 3 3 ( ) x x 3 3 ( ) x x ( ) x x ( ) 3 3 x x + = 3 3 ( ) + = 3 3 ( ) + = x x + = x x 3 3 + = ( ) x x + = x x 3 3 ( ) x x ( ) + = x x ( ) + + ( ) 3 3 ( ) + + 3 6 ( ) 3 6 ( ) x x 3 6 ( ) x x 3 6 ( ) x x = + 3 6 x x = + x x 3 6 = + 9 2 2 ( ) 2 2 ( ) 2 2 + + 2 2 ( ) + + 2 2 + + ( ) + + ( ) 2 2 + + 3 3 2 2 3 3 ( ) 3 3 ( ) 2 2 3 3 + = 3 3 2 2 + = 3 3 ( ) + + ( ) 3 3 ( ) + + 2 2 + + ( ) 3 3 + + 3 6 2 2 3 6 ( ) 3 6 ( ) 2 2 3 6 = + 3 6 2 2 = + 3 6 . The ‘3’ has been chosen as it is half of the number of ‘x’s in the original expression. This latter expression is similar, but there is constant term of 9 rather than 1. So, to make the new expression equal to the original, you must subtract 8. x x 2 2 6 1 x x 6 1 x x 2 2 6 1 2 2 3 8 2 2 3 8 + + x x + + x x 2 2 + + 2 2 6 1 + + 6 1 x x 6 1 x x + + 6 1 2 2 6 1 2 2 + + 2 2 6 1= + 2 2 = + 3 8 3 8 ( ) x ( ) 2 2 ( ) 2 2 3 8 ( ) 3 8 2 2 3 8 2 2 ( ) 2 2 3 8 = + ( ) = + x = + ( ) = + 2 2 = + 2 2 ( ) 2 2 = + This method of re-writing the quadratic is called completing the square. Worked example 17 Rewrite the expression x x 2 x x x x 4 1 x x 4 1 x x 1 − + x x − + x x 4 1 − + 4 1 x x 4 1 x x − + 4 1 in the form ( ) ( ) x a ( ) b + + ( ) + + ( ) ( ) x a ( ) + + ( ) x a 2 + + + + . The number of ‘x’s is −4. Half of this is −2. ( ) ( ) x x ( ) x ( ) x x − = ( ) x x − + x − + 2 4 ( ) 2 4 ( ) x x 2 4 ( ) x x 2 4 ( ) x x x x − = x x 2 4 − = ( ) x x − = x x 2 4 ( ) x x ( ) − = x x − + 2 4 − + 4 2 2 2 4 2 2 2 4 x x 2 4 2 2 x x 2 4 The constant term is too small by 7, so x x 2 2 x x 2 2 x x 4 1 x x 4 1 2 2 4 1 2 2 1 2 2 2 1 2 2 2 7 x x − + x x 2 2 − + x x 2 2 − + 2 2 4 1 − + 4 1 x x 4 1 x x − + 4 1 2 2 4 1 2 2 − + 2 2 4 1 x x 2 2 4 1 x x 2 2 − + 2 2 x x 4 1 2 2 1 2 = − 1 2 + ( ) 2 2 ( ) 2 2 1 2 ( ) 1 2 x 1 2 ( ) 1 2 2 2 1 2 2 2 ( ) 2 2 1 2 x 2 2 1 2 2 2 ( ) 2 2 1 2 2 2 1 2 = − 1 2 ( ) 1 2 = − x 1 2 = − 1 2 ( ) 1 2 = − 1 2 In chapter 10 you solved quadratic equations like x x 2 7 1 x x 7 1 x x 2 0 − + x x − + x x 7 1 − + 7 1 x x 7 1 x x − + 7 12 0 2 0 by factorisation. But some quadratic equations cannot be factorised. In such cases, you can solve the equation by completing the square. Quadratic expressions contain an x2 term as the highest power. You learned how to solve quadratic equations by factorising in chapter 10. REWIND The completing the square method can only be used when the coefficient of x2 = 1. Use this method when the trinomial (expression with three terms) cannot be factorised. Worked example 18 Solve x x 2 x x x x 4 6 x x 4 6 x x 0 + − x x + − x x 4 6 + − 4 6 x x 4 6 x x + − 4 6 = , giving your answer to two decimal places. x x 2 x x x x 4 6 x x 4 6 x x 0 + − x x + − x x 4 6 + − 4 6 x x 4 6 x x + − 4 6 = This equation cannot be factorised. x x 2 x x x x 4 6 x x 4 6 x x + = x x + = x x 4 6 + = 4 6 x x 4 6 x x + = 4 6 Add 6 to both sides. A can have both a positive and negative value, which leads to the two solutions for a quadratic. E e s s - R e v i e w C o p y - C a m b r i d g e U n i v e r s i t y P r e s s - R e v i e w C o p y R e v i e w C o p y - C a m b r i d g e U n i v e r s i t y P r e s s - R e v i e w C o p y R e v i e w C o p y - C a m b r i d g e U n i v e r s i t y P r e s s - R e v i e w C o p y R e v i e w C o p y - C a m b r i d g e U n i v e r s i t y Copyright Material - Review Only - Not for Redistribution
- 332. Cambridge IGCSE Mathematics 322 Unit 4: Algebra Exercise 14.8 1 Write each of the following expressions in the form ( ) ( ) x a ( ) b + + ( ) + + ( ) ( ) x a ( ) + + ( ) x a 2 + + + + . a x x 2 6 1 x x 6 1 x x 4 + + x x + + x x 6 1 + + 6 1 x x 6 1 x x + + 6 1 b x x 2 8 1 x x 8 1 x x + + x x + + x x 8 1 + + 8 1 x x 8 1 x x + + 8 1 c x x 2 12 20 + + x x + + x x 12 + + x x 12 x x + + 12 d x x 2 6 5 x x 6 5 x x + + x x + + x x 6 5 + + 6 5 x x 6 5 x x + + 6 5 e x x 2 4 12 − + x x − + x x 4 1 − + 4 1 x x 4 1 x x − + 4 1 f x x 2 2 1 x x 2 1 x x 7 x x − − x x 2 1 − − 2 1 x x 2 1 x x − − 2 1 g x x 2 5 1 x x 5 1 x x + + x x + + x x 5 1 + + 5 1 x x 5 1 x x + + 5 1 h x x 2 7 2 x x 7 2 x x + − x x + − x x 7 2 + − 7 2 x x 7 2 x x + − 7 2 i x x 2 3 3 x x 3 3 x x x x − − x x 3 3 − − 3 3 x x 3 3 x x − − 3 3 j x x 2 7 8 x x 7 8 x x + − x x + − x x 7 8 + − 7 8 x x 7 8 x x + − 7 8 k x2 – 13x + 1 l x2 – 20x + 400 2 Solve the following quadratic equations by the method of completing the square, giving your final answer to 2 decimal places. a x x 2 6 5 x x 6 5 x x 0 + − x x + − x x 6 5 + − 6 5 x x 6 5 x x + − 6 5 = b x x 2 8 4 x x 8 4 x x 0 + + x x + + x x 8 4 + + 8 4 x x 8 4 x x + + 8 4 = c x x 2 4 2 0 − + x x − + x x 4 2 − + 4 2 x x 4 2 x x − + 4 2 = d x x 2 5 7 x x 5 7 x x 0 + − x x + − x x 5 7 + − 5 7 x x 5 7 x x + − 5 7 = e x x 2 3 2 x x 3 2 x x 0 − + x x − + x x 3 2 − + 3 2 x x 3 2 x x − + 3 2 = f x2 – 12x + 1 = 0 3 Solve each equation by completing the square. a x2 – x – 10 = 0 b x2 + 3x – 6 = 0 c x(6 + x) = 1 d 2x2 + x = 8 e 5x = 10 – 1 x f x – 5 = 2 x g (x – 1)(x + 2) – 1 = 0 h (x – 4)(x + 2) = −5 i x2 = x + 1 14.6 Quadratic formula In the previous section the coefficient of x2 was always 1. Applying the completing the square method when the coefficient of x2 is not 1 is more complex but if you do apply it to the general form of a quadratic equation (ax bx c 2 0 + + bx + + = ), the following result is produced: If ax bx c 2 0 + + bx + + = then x b b b b ac a = − ± b b − ± b b − 2 4 2 This is known as the quadratic formula. Notice the ‘±’ symbol. This tells you that you should calculate two values: one with a ‘+’ and one with a ‘−’ in the position occupied by the ‘±’. The quadratic formula can be used for all quadratic equations that have real solutions even if the quadratic expression cannot be factorised. The advantage of the quadratic formula over completing the square is that you don’t have to worry when the coefficient of x2 is not 1. You saw in chapter 2 that the coefficient of a variable is the number that multiplies it. This is still true for quadratic equations: a is the coefficient of x2 and b is the coefficient of x. c is the constant term. REWIND ( ) ( ) ( ) ( ) + − ( ) = 2 4 ( ) 2 4 ( ) + − 2 4 ( ) + − 2 4 ( ) + − 6 2 2 4 2 4 + − 2 4 + − 2 4 Complete the square by writing x2 + 4x in the form (x + a)2 + b. Half of 4 is 2 so try (x + 2)2 = x2 + 4x + 4. The constant of +4 is too big, so it becomes (x + 2)2 − 4. ( ) ( ) ( ) ( ) + = ( ) 2 1 ( ) 2 1 ( ) + = 2 1 ( ) + = 2 1 ( ) + = 0 2 2 1 2 1 + = 2 1 + = 2 1 Add 4 to both sides. x + = 2 1 2 1 + = 2 1 + = ± 2 10 Take the square root of both sides. x = −2 1 2 1 ± 2 10 Subtract 2 from each side. x = 1.1622… or −5.1622… Solve for both options. x = 1.16 or −5.16 (2 d.p.) Round your solutions. E e s s - R e v i e w C o p y - C a m b r i d g e U n i v e r s i t y P r e s s - R e v i e w C o p y R e v i e w C o p y - C a m b r i d g e U n i v e r s i t y P r e s s - R e v i e w C o p y R e v i e w C o p y - C a m b r i d g e U n i v e r s i t y P r e s s - R e v i e w C o p y R e v i e w C o p y - C a m b r i d g e U n i v e r s i t y Copyright Material - Review Only - Not for Redistribution
- 333. 323 Unit 4: Algebra 14 Further solving of equations and inequalities Worked example 19 Solve the following quadratic equations, giving your answers to 3 significant figures. a x x 2 x x x x 4 3 x x 4 3 x x 0 + + x x + + x x 4 3 + + 4 3 x x 4 3 x x + + 4 3 = b x x 2 x x x x 7 1 x x 7 1 x x 1 0 − + x x − + x x 7 1 − + 7 1 x x 7 1 x x − + 7 11 0 1 0 c 3 2 1 0 2 3 2 3 2 x x 3 2 x x 3 2 3 2 3 2 x x − − x x − − 3 2 x x − − 3 2 x x 1 0 1 0 a Compare the quadratic equation x x 2 x x x x 4 3 x x 4 3 x x 0 + + x x + + x x 4 3 + + 4 3 x x 4 3 x x + + 4 3 = with ax bx c 2 0 + + bx + + = . From this you should see that a = 1, b = 4 and c = 3. x b b b b ac a = − ± b b − ± b b − = − ± − × × = − ± = − ± = − ± 2 2 2 2 ac 2 2 − ± 2 2 4 2 2 2 2 2 4 4 4 4 − ± 4 4 − ± 2 2 4 4 2 2 2 2 4 4 − ± 2 2 4 4 − ± 2 2 4 1 − × 4 1 − × 3 2 1 × 2 1 4 1 4 1 − ± 4 1 − ± 6 1 − 6 12 2 4 4 4 4 − ± 4 4 − ± 2 4 2 − ± 4 2 − ± 2 So, x = − + = − = − 4 2 − + 4 2 − + 2 2 2 1 or x = − − = − = − 4 2 − − 4 2 − − 2 6 2 3 Notice that the original quadratic equation can be factorised to give (x + 1)(x + 3) = 0 and the same solutions. If you can factorise the quadratic then you should because the method is much simpler. b x x 2 x x x x 7 1 x x 7 1 x x 1 0 − + x x − + x x 7 1 − + 7 1 x x 7 1 x x − + 7 11 0 1 0, a = 1, b = −7 and c = 11. x = − − − × × = ± − = ( ) − − ( ) − − ( ) 7 7 7 7 ± − 7 7 ± − 7 7 ( ) 7 7 ( ) ( ) 7 7 ( ) ± − ( ) ± − 7 7 ( ) 4 1 − × 4 1 − × 11 2 1 × 2 1 7 4 7 4 ± − 7 4 ± − ± − 7 49 4 ± − 9 4 ± − 4 2 7 5 7 5 ± 7 5 2 2 So, x = = 7 5 7 5 + 7 5 2 4 6180 . . 6180 . . . . or x = = 7 5 7 5 − 7 5 2 2 3819 . . . . x ≈ 4.62 or 2.38 (3sf) c For this example you should note that a is not 1! 3 2 1 0 2 3 2 3 2 x x 3 2 x x 3 2 3 2 3 2 x x − − x x − − 3 2 x x − − 3 2 x x 1 0 1 0, a = 3, b = −2 and c = −1. x = − − − × × − = ± + = = ( ) − − ( ) − − ( ) ( ) × − ( ) × − 2 2 2 2 ± − 2 2 ± − 2 2 ( ) 2 2 ( ) ( ) 2 2 ( ) ± − ( ) ± − 2 2 ( ) 4 3 − × 4 3 − × ( ) ( ) 2 3 × 2 3 2 4 2 4 ± + 2 4 ± + ± + 2 4 12 6 2 1 2 1 ± 2 16 6 2 4 ± 2 4 6 2 So, x = = = = = 2 4 + 2 4 6 6 6 1 or x = = − = − 2 4 − 2 4 6 2 6 1 3 Notice that there are brackets around the −7. If you miss these the calculation becomes −72 = −49 rather than +49. If b is negative ALWAYS use brackets to make sure that you square it correctly. Most modern calculators will allow you to input these fractions exactly as they appear here. Here you need to take particular care. BODMAS always applies and you should check the order of your working, and your solution, carefully. Tip E e s s - R e v i e w C o p y - C a m b r i d g e U n i v e r s i t y P r e s s - R e v i e w C o p y R e v i e w C o p y - C a m b r i d g e U n i v e r s i t y P r e s s - R e v i e w C o p y R e v i e w C o p y - C a m b r i d g e U n i v e r s i t y P r e s s - R e v i e w C o p y R e v i e w C o p y - C a m b r i d g e U n i v e r s i t y Copyright Material - Review Only - Not for Redistribution
- 334. Cambridge IGCSE Mathematics 324 Unit 4: Algebra Exercise 14.9 1 Each of the following quadratics will factorise. Solve each of them by factorisation and then use the quadratic formula to show that you get the same answers in both cases. a x x 2 7 1 x x 7 1 x x 2 0 + + x x + + x x 7 1 + + 7 1 x x 7 1 x x + + 7 12 0 2 0 b x x 2 8 1 x x 8 1 x x 2 0 + + x x + + x x 8 1 + + 8 1 x x 8 1 x x + + 8 12 0 2 0 c x x 2 11 28 0 + + x x + + x x 11 + + x x 11 x x + + 11 = d x x 2 4 5 x x 4 5 0 + − x x + − x x 4 5 + − 4 5 x x 4 5 x x + − 4 5 = e x x 2 6 1 x x 6 1 x x 6 0 + − x x + − x x 6 1 + − 6 1 x x 6 1 x x + − 6 16 0 6 0 f x x 2 12 160 0 + − x x + − x x 12 + − x x 12 x x + − 12 = g x x 2 6 8 x x 6 8 x x 0 − + x x − + x x 6 8 − + 6 8 x x 6 8 x x − + 6 8 = h x x 2 3 2 x x 3 2 x x 8 0 x x − − x x 3 2 − − 3 2 x x 3 2 x x − − 3 28 0 8 0 i x x 2 5 2 x x 5 2 x x 4 0 x x − − x x 5 2 − − 5 2 x x 5 2 x x − − 5 24 0 4 0 j x x 2 12 32 0 − + x x − + x x 12 − + x x 12 x x − + 12 = k x x 2 2 9 x x 2 9 x x 9 0 x x − − x x 2 9 − − 2 9 x x 2 9 x x − − 2 99 0 9 0 l x x 2 9 3 x x 9 3 x x 6 0 x x − − x x 9 3 − − 9 3 x x 9 3 x x − − 9 36 0 6 0 m x x 2 10 x x 10 x x 24 0 − + x x − + x x 10 − + x x 10 x x − + 10 = n x2 − 12x + 35 = 0 o x2 + 9x − 36 = 0 2 Solve each of the following equations by using the quadratic formula. Round your answers to 3 significant figures where necessary. These quadratic expressions do not factorise. a x x 2 6 1 x x 6 1 x x 0 + − x x + − x x 6 1 + − 6 1 x x 6 1 x x + − 6 1= b x x 2 5 5 x x 5 5 x x 0 + + x x + + x x 5 5 + + 5 5 x x 5 5 x x + + 5 5 = c x x 2 7 1 x x 7 1 x x 1 0 + + x x + + x x 7 1 + + 7 1 x x 7 1 x x + + 7 11 0 1 0 d x x 2 4 2 0 + + x x + + x x 4 2 + + 4 2 x x 4 2 x x + + 4 2 = e x x 2 3 1 x x 3 1 x x 0 x x − − x x 3 1 − − 3 1 x x 3 1 x x − − 3 1= f x x 2 4 2 0 − + x x − + x x 4 2 − + 4 2 x x 4 2 x x − + 4 2 = g x x 2 8 6 x x 8 6 x x 0 − + x x − + x x 8 6 − + 8 6 x x 8 6 x x − + 8 6 = h x x 2 2 2 x x 2 2 x x 0 x x − − x x 2 2 − − 2 2 x x 2 2 x x − − 2 2 = i x2 − 6x − 4 = 0 j x x 2 8 2 x x 8 2 x x 0 x x − − x x 8 2 − − 8 2 x x 8 2 x x − − 8 2 = k x2 − 9x + 7 = 0 l x2 + 11x + 7 = 0 3 Solve each of the following equations by using the quadratic formula. Round your answers to 3 significant figures where necessary. Take particular note of the coefficient of x2 . a 2 4 1 0 2 2 4 2 4 x x 2 4 x x 2 4 − + 2 4 − + x x − + 2 4 x x − + 2 4 x x 1 0 1 0 b 3 3 1 0 2 3 3 3 3 x x 3 3 x x 3 3 − − x x − − 3 3 x x − − 3 3 x x 1 0 1 0 c 4x2 + 2x − 5 = 0 d − + + = 2 3 − + 2 3 − + 4 0 + = 4 0 + = 2 2 3 2 3 − + 2 3 − + 2 3 x x 2 3 x x 2 3 − + 2 3 x x − + 2 3 e − − + = 2 2 − − 2 2 − − 1 0 + = 1 0 + = 2 2 2 2 2 x x 2 2 x x 2 2 − − 2 2 x x − − 2 2 f 5 3 0 2 5 3 5 3 5 3 x x 5 3 5 3 + − 5 3 5 3 x x 5 3 + − 5 3 x x = 4 Solve each of the following equations by using the quadratic formula. Round your answers to 3 significant figures where necessary. You must make sure that your equation takes the form of a quadratic expression equal to zero. If it does not, then you will need to collect all terms on to one side so that a zero appears on the other side! a 2 6 4 5 2 2 6 2 6 2 6 x x 2 6 4 5 4 5 2 6 − + 2 6 2 6 x x 2 6 − + 2 6 x x = + 4 5 = + 4 5 4 5 4 5 = + b 7 3 6 3 7 2 7 3 7 3 x x 7 3 x x 7 3 x − − x x − − 7 3 x x − − 7 3 x x = − 6 3 = − 6 3x = − c x(6x − 3) − 2 = 0 d 0 5 0 8 2 0 2 . . 0 5 . . 0 5x x 0 8 x x . . x x . . 0 8 . . 0 8 x x . . + − 0 8 + − x x + − x x 0 8 x x + − x x . . x x + − . . x x 0 8 . . 0 8 x x . . + − . . 0 8 x x . . 2 0 2 0 e ( x + 7)(x + 5) = 9 f 1 7 x x + = x + = 5 A rectangle has area 12cm2 . If the length of the rectangle is (x + 1) cm and the width of the rectangle is (x + 3) cm, find the possible value(s) of x. 6 A biologist claims that the average height, h metres, of trees of a certain species after t months is given by h t t = + h t = + h t h t = + 1 h t h t 5 1 3 2 3 = + = + 1 3 For this model a Find the average height of trees of this species after 64 months. b Find, to 3 significant figures, the number of months that the trees have been growing when the model would predict an average height of 10 metres. 14.7 Factorising quadratics where the coefficient of x2 is not 1 The quadratic equation in worked example 19 (c) gave two solutions that could have been obtained by factorisation. It turns out that ( )( ) ( ) x x ( )( ) x x ( ) x x ( ) − + ( ) − + ( ) ( ) x x − + ( ) x x ( ) x x ( ) − + x x = − x x = − x x 1 3 ( ) 1 3 ( )( ) 1 3 ( ) x x 1 3 ( ) x x 1 3 ( ) x x ( ) x x 1 3 ( ) x x − + 1 3 ( ) − + 1 3 ( ) − + ( ) − + 1 3 ( ) − + x x − + 1 3 − + ( ) x x − + x x 1 3 ( ) x x ( ) − + x x ( ) x x − + x x 1 3 ( ) x x ( ) − + x x 1 3 ( ) 1 3 ( ) = − 1 3 = − 2 1 x x 2 1 x x − 2 1 2 (you can check this by expanding the brackets). In general, if the coefficient of x2 in a quadratic is a number other than 1 it is harder to factorise, but there are some tips to help you. Worked example 20 Factorise each of the following expressions: a 2 3 1 2 2 3 2 3 x x 2 3 x x 2 3 2 3 2 3 x x + + 2 3 + + 2 3 x x + + 2 3 x x + + 2 3 x x b 3 14 8 2 3 1 3 1 x x 3 1 x x 3 14 8 x x 4 8 3 1 3 1 x x − + 3 1 − + 4 8 − + 4 8 x x − + 3 1 x x − + 3 1 x x 4 8 x x 4 8 − + x x c 10 11 8 2 x x 11 x x 2 x x + − 11 + − x x + − x x 11 x x + − x x a 2 3 1 2 2 3 2 3 x x 2 3 x x 2 3 2 3 2 3 x x + + 2 3 + + 2 3 x x + + 2 3 x x + + 2 3 x x 2 3 1 2 2 2 3 2 3 x x 2 3 x x 2 3 2 3 2 3 x x x x + + 2 3 + + 2 3 x x + + 2 3 x x + + 2 3 x x 1 2 1 2 ( ) 1 2 ( ) 1 2x x ( ) x x ( ) x x ( ) x x The only way to produce the term 2 2 x is to multiply 2x and x. These two terms are placed at the front of each bracket. There are blank spaces in the brackets because you don’t yet know what else needs to be included. The clue lies in the constant term at the end, which is obtained by multiplying these two unknown values together. Let x t = 1 3 . Form and solve a quadratic in x E e s s - R e v i e w C o p y - C a m b r i d g e U n i v e r s i t y P r e s s - R e v i e w C o p y R e v i e w C o p y - C a m b r i d g e U n i v e r s i t y P r e s s - R e v i e w C o p y R e v i e w C o p y - C a m b r i d g e U n i v e r s i t y P r e s s - R e v i e w C o p y R e v i e w C o p y - C a m b r i d g e U n i v e r s i t y Copyright Material - Review Only - Not for Redistribution
- 335. 325 Unit 4: Algebra 14 Further solving of equations and inequalities The constant term is 1, so the only possible values are +1 or −1. Since the constant term is positive, the unknown values must be either both −1 or both +1. Try each of these combinations systematically: ( )( ) ( ) 2 1 ( ) 1 2 ( ) 1 2 ( ) 3 1 2 x x ( ) x x ( ) x x ( ) ( ) 2 1 ( ) x x ( ) 2 1 x x 3 1 x x 3 1 2 x x ( ) − − ( ) x x − − ( ) x x − − x x ( ) x x ( ) − − x x ( ) 2 1 ( ) x x 2 1 − − ( ) 2 1 ( ) x x 2 1 = − 1 2 = − 1 2x x = − x x 3 1 3 1 The coefficient of x is wrong. ( )( ) ( ) 2 1 ( ) 1 2 ( ) 1 2 ( ) 3 1 2 x x ( ) x x ( ) x x ( ) ( ) 2 1 ( ) x x ( ) 2 1 x x 3 1 x x 3 1 + + ( ) + + ( ) + + ( ) ( ) 2 1 ( ) + + ( ) 2 1 x x + + ( ) x x + + x x ( ) x x ( ) + + x x ( ) 2 1 ( ) x x 2 1 + + ( ) 2 1 ( ) x x 2 1 = + 1 2 = + 1 2 2 = + x x = + x x 2 x x = + x x 3 1 3 1 This is correct. So, 2 3 1 2 1 1 2 2 3 2 3 x x 2 3 x x 2 3 2 3 2 3 x x 1 1 x x + + 2 3 + + 2 3 x x + + 2 3 x x + + 2 3 x x 1 2 = + 1 2 ( ) 1 2 ( ) 1 2 1 1 ( ) 1 1 ( ) 1 2 ( ) 1 2x x ( ) 1 1 x x ( ) 1 1 x x = + ( ) 1 2 = + ( ) 1 2 = + x x = + x x ( ) = + ( ) 1 1 ( ) 1 1 1 1 x x 1 1 ( ) 1 1 x x 1 1 1 1 ( ) b 3 14 8 2 3 1 3 1 x x 3 1 x x 3 14 8 x x 4 8 3 1 3 1 x x − + 3 1 − + 4 8 − + 4 8 x x − + 3 1 x x − + 3 1 x x 4 8 x x 4 8 − + x x Start by writing 3 14 8 2 3 1 3 1 x x 3 1 x x 3 14 8 x x 3 1 3 1 x x x x − + 3 1 − + 4 8 − + 4 8 x x − + 3 1 x x − + 3 1 x x 4 8 x x 4 8 − + x x = ( ) 3 ( ) x x ( ) x x ( ) x x ( ) x x . The two unknown terms must multiply to give 8. Since the constant term is positive, the unknowns must have the same sign. The possible pairs are: 8 and 1 2 and 4 −8 and −1 −2 and −4 Try each pair in turn, remembering that you can reverse the order: ( )( ) ( ) 3 8 ( ) 1 3 ( ) 1 3 ( ) 3 8 8 3 11 8 2 2 3 8 2 2 8 3 2 2 x x ( ) x x ( ) x x ( ) ( ) 3 8 ( ) x x ( ) 3 8 x x 3 8 x x 3 8 2 2 x x 3 8 2 2 x x 3 8 2 2 x x 8 3 x x 2 2 x x 8 3 2 2 x x 2 2 x + + ( ) + + ( ) + + ( ) ( ) 3 8 ( ) + + ( ) 3 8 x x + + ( ) x x + + x x ( ) x x ( ) + + x x ( ) 3 8 ( ) x x 3 8 + + ( ) 3 8 ( ) x x 3 8 = + 1 3 = + 1 3 2 2 = + 2 2 x x = + x x 2 2 x x = + 2 2 x x + + 3 8 + + 3 8 2 2 + + 2 2 3 8 2 2 + + 3 8 2 2 x x + + x x 2 2 x x 2 2 + + 2 2 x x = + 2 2 = + 8 3 2 2 = + 2 2 x x = + 8 3 x x = + 8 3 x x 2 2 x x 2 2 = + x x 8 3 2 2 x x 2 2 = + 2 2 8 3 x x 2 2 + Incorrect ( )( ) ( ) 3 1 ( ) 8 3 ( ) 8 3 ( ) 8 3 25 8 2 2 24 2 2 8 3 2 2 x x ( ) x x ( ) x x ( ) ( ) 3 1 ( ) x x ( ) 3 1 x x 24 x x 2 2 x x 2 2 24 2 2 x x 2 2 x x 8 3 x x 2 2 x x 8 3 2 2 x x 2 2 x + + ( ) + + ( ) + + ( ) ( ) 3 1 ( ) + + ( ) 3 1 x x + + ( ) x x + + x x ( ) x x ( ) + + x x ( ) 3 1 ( ) x x 3 1 + + ( ) 3 1 ( ) x x 3 1 = + 8 3 = + 8 3 2 2 = + 2 2 x x = + x x 2 2 x x = + 2 2 x x + + 2 2 + + 2 2 x x + + x x 2 2 x x 2 2 + + 2 2 x x = + 2 2 = + 8 3 2 2 = + 2 2 x x = + 8 3 x x = + 8 3 x x 2 2 x x 2 2 = + x x 8 3 2 2 x x 2 2 = + 2 2 8 3 x x 2 2 + Incorrect ( )( ) ( ) 3 2 ( ) 4 3 ( ) 4 3 ( ) 2 8 3 14 8 2 2 12 2 2 2 8 2 2 3 1 2 2 3 1 x x ( ) x x ( ) x x ( ) ( ) 3 2 ( ) x x ( ) 3 2 x x 12 x x 2 2 x x 2 2 12 2 2 x x 2 2 x x 2 8 x x 2 8 3 1 x x 3 1 2 2 x x 2 8 2 2 x x 2 2 4 8 4 8 + + ( ) + + ( ) + + ( ) ( ) 3 2 ( ) + + ( ) 3 2 x x + + ( ) x x + + x x ( ) x x ( ) + + x x ( ) 3 2 ( ) x x 3 2 + + ( ) 3 2 ( ) x x 3 2 = + 4 3 = + 4 3 2 2 = + 2 2 x x = + x x 2 2 x x = + 2 2 x x + + 2 8 + + 2 2 + + 2 2 2 8 2 2 + + 2 8 2 2 2 8 x x 2 8 + + 2 8 x x 2 8 2 2 x x 2 8 2 2 + + 2 8 2 2 2 8 x x 2 2 3 1 = + 3 1 2 2 = + 3 1 2 2 3 1 = + 2 2 x x = + x x 3 1 x x 3 1 = + x x 2 2 x x = + x x 3 1 2 2 x x 3 1 2 2 = + 2 2 3 1 x x 2 2 4 8 4 8 Incorrect This last one is very close. You just need to change the sign of the ‘x’ term. This can be done by jumping to the last pair: −2 and −4. ( )( ) ( ) 3 2 ( ) 4 3 ( ) 4 3 ( ) 2 8 3 14 8 2 2 12 2 2 2 8 2 2 3 1 2 2 3 1 x x ( ) x x ( ) x x ( ) ( ) 3 2 ( ) x x ( ) 3 2 x x 12 x x 2 2 x x 2 2 12 2 2 x x 2 2 x x 2 8 x x 2 8 3 1 x x 3 1 2 2 x x 2 8 2 2 x x 2 2 3 1 2 2 x x 3 1 2 2 4 8 4 8 ( ) − − ( ) x x − − ( ) x x − − x x ( ) x x ( ) − − x x ( ) 3 2 ( ) x x 3 2 − − ( ) 3 2 ( ) x x 3 2 = − 4 3 = − 4 3x x = − x x − + 2 8 − + 2 2 − + 2 8 2 2 − + 2 8 2 2 2 8 x x 2 8 − + 2 8 x x 2 8 2 2 x x 2 8 2 2 − + 2 8 2 2 2 8 x x 2 2 3 1 = − 3 1 x x = − x x 3 1 x x 3 1 = − x x 4 8 4 8 Correct So, 3 14 8 2 3 1 3 1 x x 3 1 x x 3 14 8 x x 3 1 3 1 x x x x − + 3 1 − + 4 8 − + 4 8 x x − + 3 1 x x − + 3 1 x x 4 8 x x 4 8 − + x x = − ( ) 3 2 ( ) x x ( ) x x 3 2 x x 3 2 ( ) x x = − ( ) = − 3 2 = − ( ) = − 3 2 x x 3 2 = − 3 2 x x ( ) x x 3 2 = − x x ( ) 4 ( ) x x ( ) x x − ( ) c 10 11 8 2 x x 11 x x 2 x x + − 11 + − x x + − x x 11 x x + − x x This question is rather more difficult because there is more than one way to multiply two expressions to get 10 2 x : 2x and 5x or 10x and x. Each possibility needs to be tried. Start with 10 11 8 1 2 x x 11 x x 2 x x x x + − 11 + − x x + − x x 11 x x + − x x 8 1 8 1 ( ) 8 1 ( ) 8 10 ( ) x x ( ) x x ( ) x x ( ) x x . Factor pairs that multiply to give −8 are: −8 and 1 8 and −1 2 and −4 −2 and 4 Remember that you will need to try each pair with the two values in either order. For this particular quadratic you will find that none of the eight possible combinations works! Instead, you must now try: 10 11 8 5 2 x x 11 x x 2 x x x x + − 11 + − x x + − x x 11 x x + − x x 8 5 8 5 ( ) 8 5 ( ) 8 5x x ( ) x x ( ) 2 ( ) x x ( ) x x 2 x x ( ) x x . Trying the above set of pairs once again you will eventually find that: 10 11 8 5 8 2 2 x x 11 x x 2 x x 8 2 x x + − 11 + − x x + − x x 11 x x + − x x 8 5 = + 8 5 ( ) 8 5 ( ) 8 5 8 2 ( ) 8 2 ( ) 8 5 ( ) 8 5 8 2 ( ) 8 2 x x ( ) 8 2 x x ( ) 8 2 x x = + ( ) 8 5 = + ( ) 8 5 = + x x = + x x ( ) = + ( ) 8 2 ( ) 8 2 1 ( ) x x ( ) 8 2 x x ( ) 8 2 x x − ( ) This process does appear to be long but with practice you will find ways of making the process faster. After the following exercise is another worked example. This shows an alternative, systematic method of solving these more complex quadratics, but you should try to get a feel for the problems before you use it. E e s s - R e v i e w C o p y - C a m b r i d g e U n i v e r s i t y P r e s s - R e v i e w C o p y R e v i e w C o p y - C a m b r i d g e U n i v e r s i t y P r e s s - R e v i e w C o p y R e v i e w C o p y - C a m b r i d g e U n i v e r s i t y P r e s s - R e v i e w C o p y R e v i e w C o p y - C a m b r i d g e U n i v e r s i t y Copyright Material - Review Only - Not for Redistribution
- 336. Cambridge IGCSE Mathematics 326 Unit 4: Algebra Exercise 14.10 1 Factorise each of the following expressions. a 3 14 8 2 3 1 3 1 x x 3 1 x x 3 14 8 x x 4 8 + + 3 1 + + 3 14 8 + + 4 8 x x + + 3 1 x x + + 3 1 x x 4 8 x x 4 8 + + x x b 2 3 2 2 3 2 3 2 3 x x 2 3 2 3 + − 2 3 2 3 x x 2 3 + − 2 3 x x c 6 2 2 6 2 6 2 6 2 x x 6 2 6 2 + − 6 2 6 2 x x 6 2 + − 6 2 x x d 3 14 16 2 3 1 3 1 x x 3 1 x x 3 1 + + 3 1 + + 3 14 1 + + 4 1 x x + + 3 1 x x + + 3 1 x x 4 1 x x 4 1 + + x x e 2 10 2 2 1 2 1 x x 2 1 x x 2 1 2 1 − − 2 1 2 1 x x 2 1 − − 2 1 x x f 16 32 9 2 x x 32 x x + − 32 + − x x + − x x 32 x x + − x x g 3 16 5 2 3 1 3 1 x x 3 1 x x 3 16 5 x x 6 5 + + 3 1 + + 3 16 5 + + 6 5 x x + + 3 1 x x + + 3 1 x x 6 5 x x 6 5 + + x x h 8 2 1 2 8 2 8 2 x x 8 2 x x 8 2 + − 8 2 + − 8 2 x x + − 8 2 x x + − 8 2 x x i 2 6 2 2 6 2 6 2 6 x x 2 6 2 6 − − 2 6 2 6 x x 2 6 − − 2 6 x x j 2 9 9 2 2 9 2 9 x x 2 9 x x 2 9 + + 2 9 + + 2 9 x x + + 2 9 x x + + 2 9 x x k 3 2 16 2 3 2 3 2 x x 3 2 x x 3 2 + − 3 2 + − 3 2 x x + − 3 2 x x + − 3 2 x x l 10 3 2 x x − − x x − − x x m 5 6 1 2 5 6 5 6 x x 5 6 x x 5 6 + + 5 6 + + 5 6 x x + + 5 6 x x + + 5 6 x x n 2 19 9 2 2 1 2 1 x x 2 1 x x 2 19 9 x x 9 9 − + 2 1 − + 9 9 − + 9 9 x x − + 2 1 x x − + 2 1 x x 9 9 x x 9 9 − + x x o 12x2 + 8x − 15 Here is another method for factorising a quadratic like those in the previous exercise. Worked example 21 Factorise 10 11 8 2 x x 11 x x 2 x x + − 11 + − x x + − x x 11 x x + − x x . 10 × −8 = −80 Multiply the coefficient of x2 by the constant term. −1, 80 (no) −2, 40 (no) −4, 20 (no) −5, 16 (yes) List the factor pairs of −80 until you obtain a pair that totals the coefficient of x (11) (note as 11 is positive and −80 is negative, the larger number of the pair must be positive and the other negative). 10 5 16 8 2 x x 5 1 x x 5 1 2 x x 6 8 6 8 − + 5 1 − + 5 1 x x − + x x 5 1 x x 5 1 − + x x 6 8 6 8 Re-write the x term using this factor pair. 5x(2x − 1) + 8(2x − 1) Factorise pairs of terms. (Be careful with signs here so that the second bracket is the same as the first bracket.) (5x + 8)(2x − 1) Factorise, using the bracket as the common term. Exercise 14.11 1 Now go back to Exercise 14.10 and try to factorise the expressions using this new method. 2 Factorise completely. You may need to remove a common factor before factorising the trinomials. a 6x2 – 5x – 21 b −2x2 – 13x – 15 c 4x2 + 12xy + 9y2 d 6x2 – 19xy – 7y2 e x4 – 13x2 + 36 f 6x2 – 38xy + 40y2 g 6x2 + 7x + 2 h 3x2 – 13x + 12 i 3x2 – 39x + 120 j (x + 1)2 – 5(x + 1) + 6 k (2x + 1)2 – 8(2x + 1) + 15 l 3(2x + 5)2 – 17(2x + 5) + 10 14.8 Algebraic fractions You will now use several of the techniques covered so far in this chapter to simplify complex algebraic fractions. You already know that you can simplify fractions by dividing the numerator and denominator by a common factor. This can also be done with algebraic fractions. A trinomial is an algebraic expression that contains three terms: an x2 term, an x term and a constant term. E e s s - R e v i e w C o p y - C a m b r i d g e U n i v e r s i t y P r e s s - R e v i e w C o p y R e v i e w C o p y - C a m b r i d g e U n i v e r s i t y P r e s s - R e v i e w C o p y R e v i e w C o p y - C a m b r i d g e U n i v e r s i t y P r e s s - R e v i e w C o p y R e v i e w C o p y - C a m b r i d g e U n i v e r s i t y Copyright Material - Review Only - Not for Redistribution
- 337. 327 Unit 4: Algebra 14 Further solving of equations and inequalities Worked example 22 Simplify each of the following fractions as far as possible: a 3 6 x b y y 2 5 c 12 16 3 7 p p d x x x x 2 x x x x 2 x x x x 4 3 x x 4 3 7 1 x x 7 1 x x 2 − + x x − + x x 4 3 − + 4 3 x x 4 3 x x − + 4 3 − + x x − + x x 7 1 − + 7 1 x x 7 1 x x − + 7 1 a 3 6 x 3 6 3 3 6 3 2 x x 3 3 x x 3 3 x = 3 3 3 3 6 3 6 3 = The highest common factor of 3 and 6 is 3. b y y 2 5 y y y y y y y 2 5 2 2 y y 2 2 y y 5 2 y y 5 2 y y 3 1 = y y y y y y 2 2 y y 2 2 y y y y y y 5 2 y y 5 2 = The highest common factor of y2 and y5 is y2 . c 12 16 3 7 p p 12 16 3 4 3 7 3 7 p p p p = Consider the constants first. The HCF of 12 and 16 is 4, so you can divide both 12 and 16 by 4. 12 16 3 4 3 3 7 3 7 4 4 7 4 p p p p p 4 p p 7 4 p p 7 4 4 7 4 p p 7 4 = = = = Now note that the HCF of p3 and p7 is p3 . You can divide both the numerator and the denominator by this HCF. d x x x x 2 x x x x 2 x x x x 4 3 x x 4 3 7 1 x x 7 12 − + x x − + x x 4 3 − + 4 3 x x 4 3 x x − + 4 3 − + x x − + x x 7 1 − + 7 1 x x 7 1 x x − + 7 1 x x x x 2 x x x x 2 x x x x 4 3 x x 4 3 x x 7 1 x x 7 1 x x 2 3 1 x x 3 1 3 4 x x 3 4 − + x x − + x x 4 3 − + 4 3 x x 4 3 x x − + 4 3 − + x x − + x x 7 1 − + 7 1 x x 7 1 x x − + 7 1 = x x 3 1 − − 3 1 x x 3 4 − − 3 4 ( ) x x ( ) 3 1 ( ) 3 1 x x 3 1 x x ( ) x x 3 1 x x − − x x ( ) − − x x 3 1 x x − − 3 1 ( ) x x 3 1 x x − − 3 1 ( ) 3 1 ( ) 3 1 x x 3 1 ( ) x x 3 1 3 1 − − 3 1 ( ) − − x x 3 1 − − 3 1 ( ) x x 3 1 x x − − 3 1 ( ) x x ( ) 3 4 ( ) 3 4 x x 3 4 x x ( ) x x 3 4 x x − − x x ( ) − − x x 3 4 x x − − 3 4 ( ) x x 3 4 x x − − 3 4 ( ) 3 4 ( ) 3 4 x x 3 4 ( ) x x 3 4 3 4 − − 3 4 ( ) − − x x 3 4 − − 3 4 ( ) x x 3 4 x x − − 3 4 Notice that you can factorise both the numerator and the denominator. = = ( ) ( )( ) ( ) ( )( ) ( ) − ( ) ( ) − ( ) ( ) x x ( ) ( ) x x ( ) − − ( ) x x ( ) − − ( ) x x ( ) ( ) x x ( ) ( ) x x ( ) − − ( ) x x ( ) − − ( ) x x ( ) ( ) ( ) ( ) ( ) 3 1 ( ) 3 1 ( ) ( ) 3 1 ( )( ) 3 1 ( ) − − ( ) 3 1 ( ) x x 3 1 − − x x 3 1 x x ( ) x x 3 1 ( ) x x ( ) x x 3 1 x x − − ( ) − − x x ( ) 3 1 − − ( ) − − x x ( )( ) x x ( ) 3 1 x x − − ( ) − − x x − − ( ) 3 1 ( ) − − x x ( ) 3 4 ( ) 3 4 ( ) ( ) 3 4 ( )( ) 3 4 ( ) − − ( ) 3 4 ( ) x x 3 4 − − x x 3 4 x x ( ) x x 3 4 ( ) x x ( ) x x 3 4 x x − − ( ) − − x x ( ) 3 4 − − ( ) − − x x ( )( ) x x ( ) 3 4 x x − − ( ) − − x x − − ( ) 3 4 ( ) − − x x ( ) ( ) ( ) ( ) ( ) You can see that (x − 3) is a factor of both the numerator and the denominator, so you can cancel this common factor. You might need to recap the laws of indices that you learned in chapter 2. REWIND Exercise 14.12 Simplify each of the following fractions by dividing both the numerator and the denomi- nator by their HCF. 1 a 2 4 x b 3 12 y c 5x x d 10y y e 6 36 t f 9 27 u g 5 50 t h 4 8 y i 15 20 z j 16 12 t 2 a 5 15 xy b 3 12 x y c 17 34 ab ab d 9 18 xy x e 25 5 2 x x f 21 7 2 b b g 14 21 2 x xy h 12 4 2 ab ab i 20 30 2 2 de d e 2 2 d e j 5 20 2 a ab E e s s - R e v i e w C o p y - C a m b r i d g e U n i v e r s i t y P r e s s - R e v i e w C o p y R e v i e w C o p y - C a m b r i d g e U n i v e r s i t y P r e s s - R e v i e w C o p y R e v i e w C o p y - C a m b r i d g e U n i v e r s i t y P r e s s - R e v i e w C o p y R e v i e w C o p y - C a m b r i d g e U n i v e r s i t y Copyright Material - Review Only - Not for Redistribution
- 338. Cambridge IGCSE Mathematics 328 Unit 4: Algebra 3 a 7 35 2 2 3 a b 2 2 a b 2 2 ab b ( ) ab ( ) ab ( ) ab 2 c 18 36 abc ac d 13 52 2 a b 2 a bc ab e 12 24 2 2 2 a b 2 2 a b 2 2 c abc f 36 16 2 2 2 ( ) ab ( ) ab ( ) c a b 2 2 a b 2 2 c g ( ) ab ( ) ab ( ) ( ) ( ) abc 3 h 9 12 2 3 3 2 x y 2 3 x y x y 3 2 x y 3 2 i 20 15 3 2 2 3 x y 3 2 x y z xy z j ( ) ( ) ( ) 3 3 3 y ( ) ( ) y 4 a 18 17 2 3 3 2 ( ) ( ) 3 2 ( ) 3 2 xy ( ) xy ( ) z 2 3 2 3 xy ( ) xy ( ) ( ) ( ) b 334 668 4 7 3 8 2 x y 4 7 x y z xy z 8 2 8 2 c 249 581 3 3 2 7 u v u v 3 2 u v 3 2 w ( ) u v ( ) u vw ( ) d x x x x 2 2 3 x x x x 4 x x x x + x x x x + x x x x e x x x x 2 2 3 x x x x 7 1 x x 7 1 x x 2 + x x x x + + x x + + x x 7 1 + + 7 1 x x 7 1 x x + + 7 1 f y y y y 3 4 y y 3 4 y y 2 2 1 y y y y 3 4 3 4 y y 3 4 y y 3 4 + + y y + + y y 2 1 + + 2 1 y y 2 1 y y + + 2 1 g x x x x 2 2 8 1 x x 8 1 x x 2 6 8 x x 6 8 x x − + x x − + x x 8 1 − + 8 1 x x 8 1 x x − + 8 1 − + x x − + x x 6 8 − + 6 8 x x 6 8 x x − + 6 8 h x x x x 2 2 9 2 x x 9 2 x x 0 12 + + x x + + x x 9 2 + + 9 2 x x 9 2 x x + + 9 2 + − x x + − x x i 24 8 3 2 2 x x 8 x x x x + x x x x + x x x x j 3 10 8 3 14 8 2 3 1 3 1 2 3 1 3 1 x x 3 1 x x 3 10 8 x x 0 8 x x 3 1 x x 3 14 8 x x 4 8 0 8 − − 0 8 x x − − 3 1 x x − − 3 1 x x 0 8 x x 0 8 − − x x − + 3 1 − + 4 8 − + 4 8 x x − + 3 1 x x − + 3 1 x x 4 8 x x 4 8 − + x x k x x x 2 2 9 5 2 x x 5 2 x x 4 − + − x x + − x x 5 2 + − 5 2 x x 5 2 x x + − 5 2 l 2 3 2 1 2 2 3 2 3 2 2 3 x x 2 3 x x 2 3 − − 2 3 2 3 x x 2 3 − − 2 3 x x + + 2 1 + + 2 1 x x + + x x 2 1 x x 2 1 + + x x m 7 29 4 8 16 2 7 2 7 2 2 x x 7 2 x x 7 29 4 x x 9 4 x x 8 1 x x 8 1 − + 7 2 − + 9 4 − + 9 4 x x − + 7 2 x x − + 7 2 x x 9 4 x x 9 4 − + x x − + 8 1 − + 8 1 x x − + x x 8 1 x x 8 1 − + x x n 10 3 4 2 13 7 2 2 2 1 2 1 y y 3 4 y y 3 4 y y 2 1 y y 2 13 7 y y 3 7 3 4 − − 3 4 y y − − y y 3 4 y y 3 4 − − y y 3 7 − − 3 7 y y − − 2 1 y y − − 2 1 y y 3 7 y y 3 7 − − y y o 6 11 7 10 3 4 2 6 1 6 1 2 x x 6 1 x x 6 11 7 x x 1 7 x x 3 4 x x 3 4 1 7 − − 1 7 x x − − 6 1 x x − − 6 1 x x 1 7 x x 1 7 − − x x 3 4 − − 3 4 x x − − x x 3 4 x x 3 4 − − x x 5 a 6 35 36 14 61 9 2 6 3 6 3 2 x x 6 3 x x 6 35 3 x x 5 3 x x 61 x x − + 6 3 − + 5 3 − + 5 3 x x − + 6 3 x x − + 6 3 x x 5 3 x x 5 3 − + x x − − x x − − x x 61 x x − − x x b x y x y x y 2 2 ( ) x y ( ) x y 2 ( ) x y x y ( ) x y ( ) x y2 ( ) − + ( ) x y ( ) − + ( ) − + x y − + x y ( ) − + ( ) x y ( ) − + ( ) − + x y − + x y ( ) − + c x x ( ) 3 d x x x 4 2 2 2 1 4 2 2 1 4 2 1 + + x x + + x x 4 2 + + 4 2 2 1 + + 2 1 x x 2 1 x x + + 2 1 4 2 2 1 4 2 + + 2 1 + e ( )( ) ( )( ) ( ) x x ( )( ) x x ( ) ( ) x x ( )( ) x x ( ) 2 2 ( ) 2 2 ( )( ) 2 2 ( ) 2 2 ( ) 2 2 ( )( ) 2 2 ( ) ( ) 7 1 ( ) ( ) x x ( ) 7 1 ( ) x x ( ) 2 2 7 1 ( ) 2 2 2 8 ( ) 2 8 ( )( ) 2 8 ( ) ( ) x x ( ) 2 8 ( ) x x 2 2 2 8 ( ) 2 2 2 8 ( ) 2 2 ( ) 2 2 ( ) 2 8 2 2 ( ) 12 ( ) ( ) 9 1 ( ) ( ) x x ( ) 9 1 ( ) x x ( ) 2 2 9 1 ( ) 2 2 8 6 ( ) 8 6 ( )( ) 8 6 ( ) ( ) x x ( ) 8 6 ( ) x x 2 2 8 6 ( ) 2 2 8 6 ( ) 2 2 ( ) 2 2 ( ) 8 6 2 2 ( ) ( ) ( ) + + ( ) ( ) x x + + ( ) x x ( ) 2 2 + + ( ) 2 2 ( ) 7 1 ( ) + + ( ) 7 1 ( ) x x ( ) 7 1 ( ) x x + + x x ( ) 7 1 x x ( ) 2 2 7 1 ( ) 2 2 + + ( ) 2 2 ( ) 7 1 2 2 ( ) + + ( ) ( ) x x ( ) + + x x ( ) 2 8 ( ) + + ( ) 2 8 ( ) x x 2 8 ( ) x x + + ( ) x x ( ) 2 8 x x ( ) + + ( ) ( ) x x + + ( ) x x ( ) 2 2 + + ( ) 2 2 ( ) 9 1 ( ) + + ( ) 9 1 ( ) x x ( ) 9 1 ( ) x x + + x x ( ) 9 1 x x ( ) 2 2 9 1 ( ) 2 2 + + ( ) 2 2 ( ) 9 1 2 2 ( ) + + ( ) ( ) x x ( ) + + x x ( ) 8 6 ( ) + + ( ) 8 6 ( ) x x 8 6 ( ) x x + + ( ) x x ( ) 8 6 x x f x y 3 3 3 x y 3 3 x y ( ) ( ) x y ( ) 3 3 ( ) x y 3 3 x y ( ) 3 3 x y x y ( ) 3 3 3 3 ( ) x y 3 3 x y 3 3 ( ) 3 3 x y 3 3 x y x y 3 3 3 3 x y 3 3 x y 3 3 Multiplying and dividing algebraic fractions You can use the ideas explored in the previous section when multiplying or dividing algebraic fractions. Consider the following multiplication: x y y x 2 4 3 × You already know that the numerators and denominators can be multiplied in the usual way: x y y x xy y x 2 4 3 4 2 3 y x 2 3 y x × = × = y × = 3 × = Now you can see that the HCF of the numerator and denominator will be xy2 . If you divide through by xy2 you get: x y y x y x 2 4 3 2 2 × = × = y × = 3 × = The following worked examples will help you to understand the process for slightly more complicated multiplications and divisions. Worked example 23 Simplify each of the following. a 4 3 14 16 2 3 2 x x y × b 3 16 12 9 3 2 7 9 2 7 ( ) ( ) 2 7 ( ) 2 7 x y ( ) x y ( ) z z x y ( ) x y ( ) 2 7 ( ) x y 2 7 ( ) ( ) ( ) ( ) x y ( ) x y × 2 7 2 7 2 7 ( ) 2 7 ( ) ( ) x y ( ) x y 2 7 ( ) x y ( ) 2 7 ( ) 2 7 x y ( ) c 14 9 7 18 4 3 2 x y 4 3 x y 4 3 x y 2 x y ÷ a 4 3 14 16 2 3 2 x x y × 4 3 14 16 4 14 3 1 56 48 7 6 2 3 2 3 2 2 3 1 2 2 3 16 2 2 3 2 2 2 x x y x x y 3 1 x y 3 16 x y 2 2 x y 2 2 3 1 2 2 3 1 x y 2 2 6 2 2 x y 2 2 x x y 2 2 x y 2 2 x y × = × = 2 × = 4 1 4 1 3 1 x y 3 1 x y 3 1 2 2 x y 2 2 3 1 2 2 3 1 x y 2 2 = = = = You can simply multiply numerators and denominators and then simplify using the methods in the previous section. b 3 16 12 9 3 2 7 9 2 7 ( ) ( ) 2 7 ( ) 2 7 x y ( ) x y ( ) z z x y ( ) x y ( ) 2 7 ( ) x y 2 7 ( ) ( ) ( ) ( ) x y ( ) x y × 2 7 2 7 2 7 ( ) 2 7 ( ) ( ) x y ( ) x y 2 7 ( ) x y ( ) 2 7 ( ) 2 7 x y ( ) 3 16 12 9 36 144 1 4 3 2 7 9 2 7 3 7 2 4 ( ) ( ) 2 7 ( ) 2 7 ( ) ( ) ( ) x y ( ) x y ( ) z z x y ( ) x y ( ) 2 7 ( ) x y 2 7 ( ) x y ( ) x y ( ) z x y ( ) x y ( ) z x 4 z x 7 2 z x 7 2 ( ) z x ( ) y z 4 y z ( ) y z ( ) ( ) ( ) ( ) x y ( ) x y × 2 7 2 7 2 7 ( ) 2 7 ( ) ( ) x y ( ) x y 2 7 ( ) x y ( ) 2 7 ( ) 2 7 x y ( ) = ( ) ( ) ( ) x y ( ) x y ( ) ( ) ( ) x y ( ) x y = ( ) ( ) E e s s - R e v i e w C o p y - C a m b r i d g e U n i v e r s i t y P r e s s - R e v i e w C o p y R e v i e w C o p y - C a m b r i d g e U n i v e r s i t y P r e s s - R e v i e w C o p y R e v i e w C o p y - C a m b r i d g e U n i v e r s i t y P r e s s - R e v i e w C o p y R e v i e w C o p y - C a m b r i d g e U n i v e r s i t y Copyright Material - Review Only - Not for Redistribution
- 339. 329 Unit 4: Algebra 14 Further solving of equations and inequalities Exercise 14.13 Write each of the following as a single fraction in its lowest terms. 1 a 2 3 3 8 x x 3 x x × b 3 4 2 7 y y 2 y y × y y y y c 2 7 3 4 z z 3 z z × d 5 9 9 15 t t 9 t t × e 2 5 5 2 2 2 x x × f 7 12 4 14 2 2 x x × g 12 11 33 24 2 2 3 e f f e × h 18 16 36 4 2 4 3 g h h g × i 3 4 3 8 y y 3 y y ÷ y y y y j 3 8 3 4 3 y y 3 y y ÷ y y y y k 4 7 16 8 2 cd c ÷ l 8 16 2 2 2 pq 8 1 pq 8 1 r p q 2 2 p q r ÷ 2 a 24 8 3 2 zt x xt z ÷ b 8 12 3 2 3 2 × × × × 2 × × x t t x c 9 27 3 12 81 27 9 3 2 3 2 3 × × × × 3 × × × x y y x d 3 8 64 27 3 8 3 2 2 3 4 × ÷ × ÷ × ÷ × × 3 4 3 4 ÷ × ÷ × ÷ × ÷ × ÷ × ÷ × ÷ × ÷ × ÷ × ÷ × ÷ × ÷ × ÷ × ÷ × t y 3 2 t y 3 2 t y t t y 3 4 e x y x y x y x y + x y x y ( ) x y x y ( ) × x y x y ( ) + x y x y ( ) 2 3 2 7 33 44 f 3 12 2 2 ( ) 3 1 ( ) 3 1 ( ) 3 1 ( ) 3 1 ( ) ( ) ( ) a b ( ) a b ( ) 3 1 ( ) a b 3 1 ( ) a b ( ) a b ( ) 3 1 ( ) a b 3 1 ( ) a b ( ) a b ( ) a b ( ) a b ( ) a b ( ) a b ( ) 3 1 + − 3 1 ( ) 3 1 + − ( ) 3 1 ( ) 3 1 + − ( ) 3 1 ( ) a b 3 1 ( ) + − 3 1 ( ) 3 1 a b ( ) 3 1 ( ) a b 3 1 ( ) + − 3 1 ( ) 3 1 a b ( ) ( ) a b ( ) a b ÷ ( ) a b ( ) a b ( ) a b ( ) a b g 3 24 18 2 2 2 2 2 2 2 3 x y z t 2 2 z t 2 2 x y + 2 2 2 2 x y x y z t z t 2 2 z t 2 2 z t ( ) 2 2 ( ) z t ( ) 2 2 z t 2 2 ( ) z t z t z t ( ) 2 2 z t 2 2 z t ( ) z t 2 2 z t + 2 2 2 2 x y x y ( ) × h 3 18 10 12 108 10 19 4 3 2 x y x y x y z y x y z t + x y x y ( ) ( ) z t ( ) z t z t ( ) × + x y x y ( )( ) z t ( ) z t z t ( ) + x y x y ( ) z y z y ( ) × + x y x y ( ) z t z t ( ) ) ( ) + ( ) 20 4 10 15( ) z t ( ) − ( ) z t ( ) x y + x y Adding and subtracting algebraic fractions You can use common denominators when adding together algebraic fractions, just as you do with ordinary fractions. c 14 9 7 18 4 3 2 x y 4 3 x y 4 3 x y 2 x y ÷ 14 9 7 18 14 9 18 7 14 18 9 7 4 4 3 2 4 14 2 4 3 2 4 3 2 2 2 x y 4 3 x y 4 3 x y 2 4 x y 2 4 x y 2 4 x y 2 4 x y 2 x y x y 4 3 x y 4 3 x y 2 x y x y 2 2 x y 2 2 ÷ = ÷ = x y ÷ = × = × = 2 × = × 9 7 9 7 = Worked example 24 Write as a single fraction in its lowest terms, 1 1 x y + . 1 1 x y y xy x xy y x xy + = + = = + = y = + = + y x y x The lowest common multiple of x and y is xy. This will be the common denominator. E e s s - R e v i e w C o p y - C a m b r i d g e U n i v e r s i t y P r e s s - R e v i e w C o p y R e v i e w C o p y - C a m b r i d g e U n i v e r s i t y P r e s s - R e v i e w C o p y R e v i e w C o p y - C a m b r i d g e U n i v e r s i t y P r e s s - R e v i e w C o p y R e v i e w C o p y - C a m b r i d g e U n i v e r s i t y Copyright Material - Review Only - Not for Redistribution
- 340. Cambridge IGCSE Mathematics 330 Unit 4: Algebra Worked example 25 Write as a single fraction in its lowest terms, 1 1 1 2 x x 1 x x + x x x x + + . The lowest common multiple of (x + 1) and (x + 2) is (x + 1)(x + 2) 1 1 1 2 2 1 2 1 1 2 2 1 1 2 2 x x 1 x x x 1 2 x x x 1 2 x x x x 2 1 x x 2 1 1 2 x x x + x x x x + + = + 1 2 + + 1 2 x x + + x x + + 1 2 + + 1 2 x x + + x x = + + 2 1 + + 2 1 x x + + x x 2 1 x x + + 2 1 x x 2 1 2 1 1 2 + + 1 2 x x + + x x = ( ) 1 2 ( ) 1 2 x x ( ) 1 2 x x ( ) 1 2 x x + + ( ) 1 2 + + ( ) 1 2 + + x x + + x x ( ) + + 1 2 x x + + x x ( ) 1 2 x x 1 2 + + x x ( ) 1 2 ( ) 1 2 1 2 x x 1 2 ( ) 1 2 x x 1 2 + + 1 2 ( ) 1 2 + + 1 2 x x 1 2 + + x x ( ) 1 2 x x 1 2 + + x x ( ) 1 2 ( ) 1 2 x x ( ) 1 2 x x ( ) 1 2 x x + + ( ) 1 2 + + ( ) 1 2 + + x x + + x x ( ) + + 1 2 x x + + x x ( ) 1 2 x x 1 2 + + x x ( ) 1 2 ( ) 1 2 1 2 x x 1 2 ( ) 1 2 x x 1 2 + + 1 2 ( ) 1 2 + + 1 2 x x 1 2 + + x x ( ) 1 2 x x 1 2 + + x x ( ) 1 2 ( ) 1 2 x x ( ) 1 2 x x ( ) 1 2 x x + + ( ) 1 2 + + ( ) 1 2 + + x x + + x x ( ) + + 1 2 x x + + x x ( ) 1 2 x x 1 2 + + x x ( ) 1 2 ( ) 1 2 1 2 x x 1 2 ( ) 1 2 x x 1 2 + + 1 2 ( ) 1 2 + + 1 2 x x 1 2 + + x x ( ) 1 2 x x 1 2 + + x x + + 3 1 2 + + 1 2 ( ) + + ( ) 1 2 ( ) 1 2 + + 1 2 + + ( ) + + 1 2 ( ) 1 2 ( ) 1 2 + + 1 2 ( ) + + 1 2 1 2 x x + + 1 2 x x 1 2 ( ) x x ( ) + + ( ) x x ( ) 1 2 ( ) 1 2 x x ( ) + + 1 2 + + ( ) + + 1 2 x x 1 2 + + ( ) 1 2 1 2 ( ) 1 2 x x 1 2 ( ) + + 1 2 ( ) + + 1 2 x x + + 1 2 + + ( ) 1 2 Worked example 26 Write as a single fraction in its lowest terms, 3 4 6 1 3 2 3 4 3 4 x x 2 x x x 3 4 3 4 + − x x + − x x − + . First you should factorise the quadratic expression: 3 4 6 1 3 3 4 3 2 1 2 3 4 3 4 x x 2 x x x 3 4 3 4 3 2 x x 3 4 3 4 + − x x + − x x − + = 3 4 3 4 3 2 + − 3 2 x x + − x x − ( ) 3 2 ( ) 3 2 x x ( ) 3 2 x x ( ) 3 2 x x + − ( ) 3 2 + − ( ) 3 2 + − x x + − x x ( ) + − 3 2 x x + − x x ( ) 3 2 x x 3 2 + − x x ( ) 3 2 ( ) 3 2 3 2 x x 3 2 ( ) 3 2 x x 3 2 + − 3 2 ( ) 3 2 + − 3 2 x x 3 2 + − x x ( ) 3 2 x x 3 2 + − x x ( ) 3 ( ) x ( ) + ( ) The two denominators have a common factor of (x + 3), and the lowest common multiple of these two denominators is (x + 3)(x − 2): 3 4 6 1 3 3 4 3 2 1 3 4 3 2 2 3 4 3 4 x x 2 x x x 3 4 3 4 3 2 x x 3 4 3 4 3 2 x x 3 4 3 4 + − x x + − x x − + = 3 4 3 4 3 2 + − 3 2 x x + − x x − = 3 4 3 4 3 2 + − 3 2 x x + − x x − ( ) 3 2 ( ) 3 2 x x ( ) 3 2 x x ( ) 3 2 x x + − ( ) 3 2 + − ( ) 3 2 + − x x + − x x ( ) + − 3 2 x x + − x x ( ) 3 2 x x 3 2 + − x x ( ) 3 2 ( ) 3 2 3 2 x x 3 2 ( ) 3 2 x x 3 2 + − 3 2 ( ) 3 2 + − 3 2 x x 3 2 + − x x ( ) 3 2 x x 3 2 + − x x ( ) 3 ( ) x ( ) + ( ) ( ) 3 2 ( ) 3 2 x x ( ) 3 2 x x ( ) 3 2 x x + − ( ) 3 2 + − ( ) 3 2 + − x x + − x x ( ) + − 3 2 x x + − x x ( ) 3 2 x x 3 2 + − x x ( ) 3 2 ( ) 3 2 3 2 x x ( ) 3 2 x x 3 2 + − 3 2 ( ) 3 2 + − 3 2 x x 3 2 + − x x ( ) 3 2 x x 3 2 + − x x ( ) 2 ( ) x ( ) − ( ) ( ) ( ( ) ( ( ) ( ) ( )( ) ( )( ) ( ( ) x x ( ) x x ( ) x x ( ) ( ) x x ( ) x x ( ) x x ( ) x ( ) + − ( ) ( ) x x + − ( ) x x = + − x x + − x x ( ) ( ) ( ) + − ( ) ( ) x x + − ( ) x x = + − x x + − x x + ( ) + − ( ) ( ) x x + − ( ) x x = 3 2 ( ) 3 2 ( )( ) 3 2 ( ) x x 3 2 ( ) x x 3 2 ( ) x x ( ) x x 3 2 x x + − 3 2 ( ) + − 3 2 ( ) + − ( ) + − ( ) 3 2 + − x x + − 3 2 + − ( ) x x + − x x 3 2 ( ) x x ( ) + − x x ( ) x x ( ) + − x x 3 2 x x ( ) + − x x 3 4 x x 3 4 x x + − 3 4 + − x x + − x x 3 4 x x + − ( ) ( ) 3 2 ( ) 3 2 ( )( ) 3 2 ( ) x x 3 2 ( ) x x 3 2 ( ) x x ( ) x x ( ) 3 2 x x + − 3 2 ( ) + − 3 2 ( ) + − ( ) + − ( ) 3 2 + − x x + − 3 2 + − ( ) x x + − x x 3 2 ( ) x x ( ) + − x x ( ) x x ( ) + − x x 3 2 x x ( ) + − x x 3 4 x x 3 4 x x + − 3 4 + − x x + − x x 3 4 x x + − 2 3 2 ( ) 3 2 ( )( ) 3 2 ( ) x x 3 2 ( ) x x 3 2 ( ) x x ( ) x x ( ) 3 2 x x + − 3 2 ( ) + − 3 2 ( ) + − ( ) + − ( ) 3 2 + − x x + − 3 2 + − ( ) x x + − x x 3 2 ( ) x x ( ) + − x x ( ) x x ( ) + − x x 3 2 x x ( ) + − x x 2 6 x 2 6 + 2 6 + − + + − + 3 2 + − 3 2 3 2 + − 3 2 + − )( 3 2 )( 3 2 + − 3 2 )( + − 3 2) 3 2 3 2 + − 3 2 + − 3 2 This may appear to be the final answer but if you factorise the numerator you will find that more can be done! 3 4 6 1 3 2 6 3 2 2 3 3 2 2 2 3 4 3 4 x x 2 x x x 2 6 2 6 3 2 x x 3 2 x x 3 4 3 4 + − x x + − x x − + = 2 6 2 6 3 2 + − 3 2 x x + − x x = 3 2 + − 3 2 x x + − x x = ( ) 3 2 ( ) 3 2 x x ( ) 3 2 x x ( ) 3 2 x x + − ( ) 3 2 + − ( ) 3 2 + − x x + − x x ( ) + − 3 2 x x + − x x ( ) 3 2 x x 3 2 + − x x ( ) 3 2 ( ) 3 2 3 2 x x ( ) 3 2 x x 3 2 + − 3 2 ( ) 3 2 + − 3 2 x x 3 2 + − x x ( ) 3 2 x x 3 2 + − x x ( ) 2 3 ( ) 2 3 2 3 2 3 ( ) 2 3 2 3 ( ) ( ) 3 2 ( ) 3 2 x x ( ) 3 2 x x ( ) 3 2 x x + − ( ) 3 2 + − ( ) 3 2 + − x x + − x x ( ) + − 3 2 x x + − x x ( ) 3 2 x x 3 2 + − x x ( ) 3 2 ( ) 3 2 3 2 x x 3 2 ( ) 3 2 x x 3 2 + − 3 2 ( ) 3 2 + − 3 2 x x 3 2 + − x x ( ) 3 2 x x 3 2 + − x x ( ) 2 ( ) x ( ) − ( ) Always check to see if your final numerator factorises. If it does, then there may be more stages to go. E e s s - R e v i e w C o p y - C a m b r i d g e U n i v e r s i t y P r e s s - R e v i e w C o p y R e v i e w C o p y - C a m b r i d g e U n i v e r s i t y P r e s s - R e v i e w C o p y R e v i e w C o p y - C a m b r i d g e U n i v e r s i t y P r e s s - R e v i e w C o p y R e v i e w C o p y - C a m b r i d g e U n i v e r s i t y Copyright Material - Review Only - Not for Redistribution
- 341. 331 Unit 4: Algebra 14 Further solving of equations and inequalities Exercise 14.14 Write each of the following as a single fraction in its lowest terms. 1 a y y 2 4 + y y y y b t t 3 5 + c u u 7 5 + d z z 7 14 − e ( ) ( ) x y ( ) x y ( ) x y ( ) x y ( ) ( ) ( ) ( ) x y ( ) x y + ( ) ( ) ( ) x y ( ) x y 3 12 f 2 3 5 6 x x 5 x x + g 3 4 5 8 y y 5 y y + y y y y h 2 5 3 8 a a 3 a a − i 2 7 3 14 a a 3 a a + j x y 9 2 7 + 2 a 5 1 7 3 1 8 2 2 x x 3 1 x x ( ) 5 1 ( ) 5 1 x x ( ) x x 5 1 x x 5 1 ( ) x x 5 1 5 1 ( ) 5 1 x x 5 1 x x ( ) x x 5 1 x x − ( ) 3 1 ( ) 3 1 3 1 x x 3 1 ( ) 3 1 x x 3 1 3 1 ( ) b 10 17 3 8 pqr p 3 r pqr − c 3 5 3 7 3 10 p p p 3 p p p 3 p p p + + + + p p p + + p p p d 2 3 3 7 4 x x 3 x x x + − + − e 8 9 3 7 3 2 2 3 2 2 2 x x 3 x x x + − + − f 5 2 3 3 3 9 − − + x x x 3 x x x 3 x x x − x x x − x x x 3 a x a a + 3 b 2 3 5 4 a a 4 a a + c 3 2 5 3 x y x y + d 3 2 2 a a + e 3 2 4 3 x x 3 x x + f 5 4 3 20 e e 20 e e + 4 a 1 1 1 4 x x 1 x x + x x x x + + b 3 2 2 1 x x 2 x x x x x x + − c 5 2 2 7 x x 2 x x + x x x x + + d 3 1 2 x x 2 x x − e 5 2 4 3 xy xy − f 2 x x + g x x + + + 1 2 2 1 h 3 1 7 2 1 9 2 2 2 1 2 2 2 ( ) 3 1 ( ) 3 1 2 2 ( ) 2 2 3 1 2 2 3 1 ( ) 2 2 ( ) 2 1 ( ) 2 1 2 2 ( ) 2 2 2 1 2 2 2 1 ( ) 2 1 2 2 3 1 ( ) 3 1 ( ) y ( ) ( ) 2 1 ( ) 2 1 ( ) y 3 1 ( ) 3 1 ( ) − 2 1 ( ) 2 1 ( ) i 1 2 2 x x y − j x z y z xy + − + y z y z 1 3 1 z 3 12 2 3 1 3 1 k 1 1 3 2 ( ) 2 ( ) ( ) 3 2 ( ) 3 2 ( ) 3 2 ( ) 3 2 x x ( ) x x ( ) 2 ( ) x x ( ) ( ) x x ( ) 3 2 ( ) 3 2 ( ) ( ) ( ) ( ) x x ( ) x x − 3 2 + + ( ) + + ( ) 3 2 ( ) 3 2 + + ( ) 3 2 ( ) 3 2 + + 3 2 ( ) 3 2 ( ) 3 2 ( ) + + ( ) 3 2 ( ) l 2 1 2 3 2 2 x x 1 x x 3 2 3 2 + x x x x − + + 3 2 + + 3 2 3 2 3 2 + + Summary Do you know the following? • Simultaneous means at the same time. • The intersection of two straight lines is the simultaneous solution of their equations. • Simultaneous linear equations can be solved graphically or algebraically. • Inequalities represent a range of solutions. • Inequalities in one variable can be represented on a number line and in two variables as a region on a plane. • A quadratic expression, x bx c 2 x b x b + + x b + + x bx c + + x c can be written in the completed square form, x b b c + b b b b b b b b b b b b − b b b b b b b b b b b b + 2 2 2 2 2 2 2 2 2 2 2 2 b b 2 2 b b 2 2 b b b b 2 2 2 2 . • Quadratic equations that do not factorise can be solved by the method of completing the square or by use of the quadratic formula. • Complex algebraic fractions can be simplified by factorising and cancelling like terms. Are you able to …? • solve simultaneous linear equations graphically • solve simultaneous linear equations algebraically • show an inequality in one variable on a number line • show an inequality in two variables as a region in the Cartesian plane • show a region in the Cartesian plane that satisfies more than one inequality • use linear programming to find the great and least values to an expression in a region • rewrite a quadratic in completed square form • solve a quadratic using the completed square or the quadratic formula • simplify complex algebraic fractions. E E E e s s - R e v i e w C o p y - C a m b r i d g e U n i v e r s i t y P r e s s - R e v i e w C o p y R e v i e w C o p y - C a m b r i d g e U n i v e r s i t y P r e s s - R e v i e w C o p y R e v i e w C o p y - C a m b r i d g e U n i v e r s i t y P r e s s - R e v i e w C o p y R e v i e w C o p y - C a m b r i d g e U n i v e r s i t y Copyright Material - Review Only - Not for Redistribution
- 342. Unit 4: Algebra 332 Examination practice Exam-style questions 1 The quadratic equation x2 – 5x – 3 = 0 has solutions a and b. Find the value of: i a – b ii a + b Leave your answers in exact form. 2 a By shading the unwanted regions on a diagram, show the region that satisfies all the inequalities y x y x y x y x 1 y x y x 2 y x y x 1 + , 5x + 6y 30 and y x. b Given that x and y satisfy these three inequalities, find the greatest possible value of x + 2y. Past paper questions 1 Solve the inequality x 3 5 2 + 5 2 + 5 2. [2] [Cambridge IGCSE Mathematics 0580 Paper 22 Q8 May/June 2016] 2 Find the co-ordinates of the point of intersection of the two lines. 2x − 7y = 2 4x + 5y = 42 [3] [Cambridge IGCSE Mathematics 0580 Paper 22 Q15 October/November 2013] 3 x is a positive integer and 15x – 43 5x + 2. Work out the possible values of x. [3] [Cambridge IGCSE Mathematics 0580 Paper 22 Q6 May/June 2012] 4 Write the following as a single fraction in its simplest form. [3] x x + x x x x − + 2 x x x x 3 2 1 x x 2 1 x x − 2 1 4 1 [Cambridge IGCSE Mathematics 0580 Paper 23 Q13 October/November 2012] 5 Jay makes wooden boxes in two sizes. He makes x small boxes and y large boxes. He makes at least 5 small boxes. The greatest number of large boxes he can make is 8. The greatest total number of boxes is 14. The number of large boxes is at least half the number of small boxes. a i Write down four inequalities in x and y to show this information. [4] ii Draw four lines on the grid and write the letter R in the region which represents these inequalities. E E E e s s - R e v i e w C o p y - C a m b r i d g e U n i v e r s i t y P r e s s - R e v i e w C o p y R e v i e w C o p y - C a m b r i d g e U n i v e r s i t y P r e s s - R e v i e w C o p y R e v i e w C o p y - C a m b r i d g e U n i v e r s i t y P r e s s - R e v i e w C o p y R e v i e w C o p y - C a m b r i d g e U n i v e r s i t y Copyright Material - Review Only - Not for Redistribution
- 343. 333 Unit 4: Algebra x y 2 1 3 4 5 6 7 8 9 10 11 12 13 14 15 0 1 2 3 4 5 6 7 8 9 10 11 12 13 14 15 [5] b The price of the small box is $20 and the price of the large box is $45. i What is the greatest amount of money he receives when he sells all the boxes he has made? [2] ii For this amount of money, how many boxes of each size did he make? [1] [Cambridge IGCSE Mathematics 0580 Paper 42 Q7 October/November 2012] 6 Simplify the following. h h h 2 h h h h 2 20 25 − − h h − − h h − [4] [Cambridge IGCSE Mathematics 0580 Paper 23 Q21 October/November 2012] 7 Simplify. x x 2 6 7 x x 6 7 x x 3 2 x 3 21 + − x x + − x x 6 7 + − 6 7 x x 6 7 x x + − 6 7 3 2 3 2 [4] [Cambridge IGCSE Mathematics 0580 Paper 22 Q19 May/June 2014] 8 a Write as a single fraction in its simplest form. 3 2 1 1 2 x x 2 1 x x 2 1 2 1 x x 2 1 x x − + [3] b Simplify. 4 16 2 6 56 2 4 1 4 1 2 2 6 2 6 x x 4 1 x x 4 16 x x x x 2 6 x x 2 6 4 1 x x 4 1 x x + − 2 6 + − 2 6 x x + − 2 6 x x + − 2 6 x x [4] [Cambridge IGCSE Mathematics 0580 Paper 22 Q21 October/Novermber 2014] E e s s - R e v i e w C o p y - C a m b r i d g e U n i v e r s i t y P r e s s - R e v i e w C o p y R e v i e w C o p y - C a m b r i d g e U n i v e r s i t y P r e s s - R e v i e w C o p y R e v i e w C o p y - C a m b r i d g e U n i v e r s i t y P r e s s - R e v i e w C o p y R e v i e w C o p y - C a m b r i d g e U n i v e r s i t y Copyright Material - Review Only - Not for Redistribution
- 344. Unit 4: Algebra 334 9 Solve the equation 5x2 − 6x − 3 = 0. Show all your working and give your answers correct to 2 decimal places. [4] [Cambridge IGCSE Mathematics 0580 Paper 22 Q19 October/November 2015] 10 y = x2 + 7x − 5 can be written in the form y = (x + a)2 + b. Find the value of a and the value of b. [3] [Cambridge IGCSE Mathematics 0580 Paper 22 Q15 May/June 2016] 11 Solve the simmultaneous equations. Show all your working. 3x + 4y = 14 5x + 2y = 21 [3] [Cambridge IGCSE Mathematics 0580 Paper 22 Q16 May/June 2016] E e s s - R e v i e w C o p y - C a m b r i d g e U n i v e r s i t y P r e s s - R e v i e w C o p y R e v i e w C o p y - C a m b r i d g e U n i v e r s i t y P r e s s - R e v i e w C o p y R e v i e w C o p y - C a m b r i d g e U n i v e r s i t y P r e s s - R e v i e w C o p y R e v i e w C o p y - C a m b r i d g e U n i v e r s i t y Copyright Material - Review Only - Not for Redistribution
- 345. Unit 4: Shape, space and measures 335 • Scale drawing • Bearing • Hypotenuse • Adjacent • Opposite • Tangent ratio • Inverse function • Sine ratio • Cosine ratio • Sine rule • Cosine rule • Projection Key words A full understanding of how waves strengthen or destroy one another can help to save countless lives. Such an understanding begins with the study of trigonometry. To ‘get your bearings’ is to find out the direction you need to move from where you are. Sat Navs and the GPS can take a lot of the effort out of finding where you are going but their software uses the basic mathematical principles of calculating angles. EXTENDED In this chapter you will learn how to: • make scale drawings • interpret scale drawings • calculate bearings • calculate sine, cosine and tangent ratios for right-angled triangles • use sine, cosine and tangent ratios to calculate the lengths of sides and angles of right-angled triangles • solve trigonometric equations finding all the solutions between 0° and 360° • apply the sine and cosine rules to calculate unknown sides and angles in triangles that are not right-angled • calculate the area of a triangle that is not right- angled using the sine ratio • use the sine, cosine and tangent ratios, together with Pythagoras’ theorem in three-dimensions. Chapter 15: Scale drawings, bearings and trigonometry e s s - R e v i e w C o p y - C a m b r i d g e U n i v e r s i t y P r e s s - R e v i e w C o p y R e v i e w C o p y - C a m b r i d g e U n i v e r s i t y P r e s s - R e v i e w C o p y R e v i e w C o p y - C a m b r i d g e U n i v e r s i t y P r e s s - R e v i e w C o p y R e v i e w C o p y - C a m b r i d g e U n i v e r s i t y Copyright Material - Review Only - Not for Redistribution
- 346. Unit 4: Shape, space and measures Cambridge IGCSE Mathematics 336 RECAP You should already be familiar with the following work on bearings and scale drawings: Bearings (Year 9 Mathematics, Chapter 3) Bearings are measured from north (0°) in a clockwise direction to 360° (which is the same bearing as north). You measure bearings using your protractor and write them using three digits, so you would write a bearing of 88 degrees as 088°. Scale diagrams (Year 9 Mathematics) Accurately reduced (or enlarged) diagrams are called scale diagrams. The scale by which the diagram is reduced (or enlarged) can be given as a fraction or a ratio. For example, 1 200 or 1 : 200. The scale factor tells you how much smaller (or larger) the diagram is than the reality it represents. 15.1 Scale drawings Later in this chapter you will be learning how to use the trigonometric ratios to accurately calculate missing angles and sides. For this you will need the use of a calculator. Missing lengths and angles can also be found using scale drawings; although this is less accurate, it is still valid. For scale drawings you will need a ruler, a protractor and a sharp pencil. Sometimes you have to draw a diagram to represent something that is much bigger than you can fit on the paper or so small that it would be very difficult to make out any detail. Examples include a plan of a building, a map of a country or the design of a microchip. These accurate diagrams are called a scale drawings. The lines in the scale drawing are all the same fraction of the lines they represent in reality. This fraction is called the scale of the drawing. The scale of a diagram, or a map, may be given as a fraction or a ratio such as 1 50000 or 1 : 50 000. A scale of 1 50000 means that every line in the diagram has a length which is 1 50000 of the length of the line that it represents in real life. Hence, 1cm in the diagram represents 50000cm in real life. In other words, 1cm represents 500m or 2cm represents 1km. Some of the construction skills from chapter 3 will be useful for scale drawings. REWIND Scale drawings are often used to plan the production of items in design technology subjects. Many problems involving the fitting together of different shapes can be solved by using a good quality scale drawing. Maps in geography are also scale drawings and enable us to represent the real world in a diagram of manageable size. LINK O° N P Bearing from P to Q = 110° 110° Bearing from Q to P = 290° 290° Q O° N e s s - R e v i e w C o p y - C a m b r i d g e U n i v e r s i t y P r e s s - R e v i e w C o p y R e v i e w C o p y - C a m b r i d g e U n i v e r s i t y P r e s s - R e v i e w C o p y R e v i e w C o p y - C a m b r i d g e U n i v e r s i t y P r e s s - R e v i e w C o p y R e v i e w C o p y - C a m b r i d g e U n i v e r s i t y Copyright Material - Review Only - Not for Redistribution
- 347. Unit 4: Shape, space and measures 337 15 Scale drawings, bearings and trigonometry Exercise 15.1 1 On the plan of a house, the living room is 3.4cm long and 2.6cm wide. The scale of the plan is 1cm to 2m. Calculate the actual length and width of the room. 2 The actual distance between two villages is 12km. Calculate the distance between the villages on a map whose scale is: a 1cm to 4km b 1cm to 5km. 3 A car ramp is 28m long and makes an angle of 15° with the horizontal. A scale drawing is to be made of the ramp using a scale of 1cm to 5m. a How long will the ramp be on the drawing? b What angle will the ramp make with the horizontal on the drawing? Angle of elevation and angle of depression Scale drawing questions often involve the observation of objects that are higher than you or lower than you, for example, the top of a building, an aeroplane or a ship in a harbour. In these cases, the angle of elevation or depression is the angle between the horizontal and the line of sight of the object. angle of elevation horizontal line of sight horizontal line of sight angle of depression Angles of elevation are always measured from the horizontal. Worked example 1 A rectangular field is 100m long and 45m wide. A scale drawing of the field is made with a scale of 1cm to 10m. What are the length and width of the field in the drawing? 10m is represented by 1cm ∴ 100m is represented by (100 ÷ 10)cm = 10cm and 45m is represented by (45 ÷ 10)cm = 4.5cm So, the dimensions on the drawing are: length = 10cm and width = 4.5cm. E Draughtspeople, architects and designers all draw accurate scaled diagrams of buildings and other items using pencils, rulers and compasses. LINK e s s - R e v i e w C o p y - C a m b r i d g e U n i v e r s i t y P r e s s - R e v i e w C o p y R e v i e w C o p y - C a m b r i d g e U n i v e r s i t y P r e s s - R e v i e w C o p y R e v i e w C o p y - C a m b r i d g e U n i v e r s i t y P r e s s - R e v i e w C o p y R e v i e w C o p y - C a m b r i d g e U n i v e r s i t y Copyright Material - Review Only - Not for Redistribution
- 348. Unit 4: Shape, space and measures Cambridge IGCSE Mathematics 338 Drawing a scale diagram Here are some clues and tips for drawing diagrams to scale: • Draw a rough sketch, showing all details as given in the question. • If you are told to use a particular scale you must use it! If you are not given a scale try to choose one that will make your diagram fit neatly onto a page. • Make a clean, tidy and accurate scale drawing using appropriate geometrical instruments. Show on it the given lengths and angles. Write the scale next to the drawing. • Measure lengths and angles in the drawing to find the answers to the problem. Remember to change the lengths to full size using the scale. Remember that the full size angles are the same as the angles in the scale drawing. Exercise 15.2 1 The diagram is a rough sketch of a field ABCD. a Using a scale of 1cm to 20m, make an accurate scale drawing of the field. b Find the sizes of BĈD and AD̂C at the corners of the field. c Find the length of the side CD of the field. 120 m 100 m 90 m 75° 80° A B C D 2 A ladder of length 3.6m stands on horizontal ground and leans against a vertical wall at an angle of 70° to the horizontal (see diagram). a What is the size of the angle that the ladder makes with the wall (a)? b Draw a scale drawing using a scale of 1cm to 50cm, to find how far the ladder reaches up the wall (b). ground b 3.6 m 70° a 70° 3 The accurate scale diagram represents the vertical wall TF of a building that stands on horizontal ground. It is drawn to a scale of 1cm to 8m. a Find the height of the building. b Find the distance from the point A to the foot (F) of the building. c Find the angle of elevation of the top (T) of the building from the point A. ground building 35° T A F 35° A scale drawing is similar to the real object, so the sides are in proportion and corresponding angles are equal. e s s - R e v i e w C o p y - C a m b r i d g e U n i v e r s i t y P r e s s - R e v i e w C o p y R e v i e w C o p y - C a m b r i d g e U n i v e r s i t y P r e s s - R e v i e w C o p y R e v i e w C o p y - C a m b r i d g e U n i v e r s i t y P r e s s - R e v i e w C o p y R e v i e w C o p y - C a m b r i d g e U n i v e r s i t y Copyright Material - Review Only - Not for Redistribution
- 349. Unit 4: Shape, space and measures 339 15 Scale drawings, bearings and trigonometry 15.2 Bearings You have now used scale drawings to find distances between objects and to measure angles. When you want to move from one position to another, you not only need to know how far you have to travel but you need to know the direction. One way of describing directions is the bearing. This description is used around the world. The angle 118°, shown in the diagram, is measured clockwise from the north direction. Such an angle is called a bearing. All bearings are measured clockwise from the north direction. Here the bearing of P from O is 118°. 118° North O P If the angle is less than 100° you still use three figures so that it is clear that you mean to use a bearing. Here the bearing of Q from O is 040°. 40° North O Q Since you always measure clockwise from north it is possible for your bearing to be a reflex angle. Here the bearing of R from O is 315°. North O R 315° You may sometimes need to use angle properties from previous chapters to solve bearings problems. One degree of bearing does not seem like a lot but it can represent a huge distance in the real world. This is why you will need to use the trigonometry you will learn later in this chapter to calculate angles accurately. FAST FORWARD You saw in chapter 3 that a reflex angle is 180° but 360°. REWIND Worked example 2 The bearing of town B from city A is 048°. What is the bearing of city A from town B? North North city A town B θ North city A town B 48° In the second diagram, the two north lines are parallel. Hence angle θ = 48° (using the properties of corresponding angles). The bearing of city A from town B = 48°+180° = 228°. Notice that the difference between the two bearings (48° and 228°) is 180°. Always make sure that you draw a clear diagram and mark all north lines clearly. This is an example of a ‘back’ bearing. If you know the bearing of point X from point Y then, to find the bearing to return to point Y from point X, you add 180° to the original bearing (or subtract 180° if adding would give a value greater than 360°). You should remind yourself how to deal with alternate and corresponding angles from chapter 3. REWIND e s s - R e v i e w C o p y - C a m b r i d g e U n i v e r s i t y P r e s s - R e v i e w C o p y R e v i e w C o p y - C a m b r i d g e U n i v e r s i t y P r e s s - R e v i e w C o p y R e v i e w C o p y - C a m b r i d g e U n i v e r s i t y P r e s s - R e v i e w C o p y R e v i e w C o p y - C a m b r i d g e U n i v e r s i t y Copyright Material - Review Only - Not for Redistribution
- 350. Unit 4: Shape, space and measures Cambridge IGCSE Mathematics 340 Exercise 15.3 1 Give the three-figure bearing corresponding to: a west b south-east c north-east 2 Write down the three figure bearings of A from B for each of the following: a N A 82° B b N A 45° B 3 Use the map of Southern Africa to find the three-figure bearing of: a Johannesburg from Windhoek b Johannesburg from Cape Town c Cape Town from Johannesburg d Lusaka from Cape Town e Kimberley from Durban. ANGOLA ZAMBIA ZIMBABWE MOZAMBIQUE BOTSWANA NAMIBIA SOUTH AFRICA LESOTHO SWAZILAND MALAWI 0 1000 200 400 600 800 km Cape Town Kimberley Windhoek Lusaka Johannesburg Durban N 4 Townsville is 140km west and 45km north of Beeton. Using a scale drawing with a scale of 1cm to 20km, find: a the bearing of Beeton from Townsville b the bearing of Townsville from Beeton c the direct distance from Beeton to Townsville. 5 Village Q is 7km from village P on a bearing of 060°. Village R is 5km from village P on a bearing of 315°. Using a scale drawing with a scale of 1cm to 1km, find: a the direct distance from village Q to village R b the bearing of village Q from village R. 15.3 Understanding the tangent, cosine and sine ratios Trigonometry is the use of the ratios of the sides of right-angled triangles. The techniques covered in the following sections will help you to make much more precise calculations with bearings. Throughout the remainder of this chapter you must make sure that your calculator is set in degrees mode. A small letter ‘D’ will usually be displayed. If this is not the case, or if your calculator displays a ‘G’ or an ‘R’, then please consult your calculator manual. e s s - R e v i e w C o p y - C a m b r i d g e U n i v e r s i t y P r e s s - R e v i e w C o p y R e v i e w C o p y - C a m b r i d g e U n i v e r s i t y P r e s s - R e v i e w C o p y R e v i e w C o p y - C a m b r i d g e U n i v e r s i t y P r e s s - R e v i e w C o p y R e v i e w C o p y - C a m b r i d g e U n i v e r s i t y Copyright Material - Review Only - Not for Redistribution
- 351. Unit 4: Shape, space and measures 341 15 Scale drawings, bearings and trigonometry Labelling the sides of a right-angled triangle You will have already learned that the longest side of a right-angled triangle is called the hypotenuse. If you take one of the two non right-angles in the triangle for reference then you can also ‘name’ the two shorter sides: A opposite adjacent hypotenuse Notice that the adjacent is the side of the triangle that touches the angle A, but is not the hypotenuse. The third side does not meet with angle A at all and is known as the opposite. Throughout the remainder of the chapter, opp(A) will be used to mean the length of the opposite side, and adj(A) to mean the length of the adjacent. The hypotenuse does not depend upon the position of angle A, so is just written as ‘hypotenuse’ (or hyp). Exercise 15.4 1 For each of the following triangles write down the letters that correspond to the length of the hypotenuse and the values of opp(A) and adj(A). a c a b A b A x y z c A r p q d A l m n e A c d e f A e f g 2 In each case copy and complete the statement written underneath the triangle. a 30° 5.7 cm opp(30°) = .......... cm b opp(40°) = .......... cm adj(50°) = .......... cm 40° 50° x cm y cm c 25° 65° p m r m q m .......(65°) = q m .......(25°) = p m ............... = r m Investigation You will now explore the relationship between the opposite, adjacent and hypotenuse and the angles in a right-angled triangle. For this investigation you will need to draw four different scale copies of the diagram opposite. The right angle and 30° angle must be drawn as accurately as possible, and all four triangles should be of different sizes. Follow the instructions listed on the next page. The hypotenuse was introduced with the work on Pythagoras’ theorem in chapter 11. REWIND You will need to use the skills you learned for constructing accurate drawings of triangles in chapter 3. REWIND e s s - R e v i e w C o p y - C a m b r i d g e U n i v e r s i t y P r e s s - R e v i e w C o p y R e v i e w C o p y - C a m b r i d g e U n i v e r s i t y P r e s s - R e v i e w C o p y R e v i e w C o p y - C a m b r i d g e U n i v e r s i t y P r e s s - R e v i e w C o p y R e v i e w C o p y - C a m b r i d g e U n i v e r s i t y Copyright Material - Review Only - Not for Redistribution
- 352. Unit 4: Shape, space and measures Cambridge IGCSE Mathematics 342 30° 60° 1 Label the opp(30°), adj(30°) and hypotenuse clearly. 2 Measure the length of opp(30°) and write it down. 3 Measure the length of the adj(30°) and write it down. 4 Calculate opp adj ad ( ) ( ) ( ) 30 ( ) ( ) 30 ( ) ( ) ( ) ( ) ( ) in each case. 5 What do you notice about your answers? 6 Ask a friend to draw some triangles (with the same angles) and make the same calculations. What do you notice? 7 Now repeat the investigation using a triangle with different angles. Record any observations that you make. Tangent ratio It turns out that opp adj ad ( ) ( ) ( ) ( ) ( ) ( ) is constant for any given angle A. opp adj ad ( ) ( ) ( ) ( ) ( ) ( ) depends on the angle only, and not the actual size of the triangle. The ratio opp adj ad ( ) ( ) ( ) ( ) ( ) ( ) is called the tangent ratio and you write: tan ( ) ( ) A ( ) ( ) ( ) ( ) = opp adj ad Your calculator can work out the tangent ratio for any given angle and you can use this to help work out the lengths of unknown sides of a right-angled triangle. For example, if you wanted to find the tangent of the angle 22° you enter: 0.404026225835157 2 2 tan = Notice that the answer has many decimal places. When using this value you must make sure that you don’t round your answers too soon. Now, consider the right-angled triangle shown below. 22° x cm 12 cm You can find the unknown side, x cm, by writing down what you know about the tangent ratio: tan ( ) ( ) 22 ( ) 22 ( ) ( ) 22 ( ) 12 ° = ( ) ( ) ( ) ( ) = opp adj ad x ⇒ = ° ∴ = ≈ ( ) ⇒ = ⇒ = x ∴ = ∴ = x 12 22 4 848314 4 8 tan( ) . ... . c 4 8 . c 4 8 m 1 ( ) m 1 ( ) ( ) dp ( ) Look back at the work on calculating gradients in chapter 10 and compare it with the tangent ratio. What connection do you notice? REWIND e s s - R e v i e w C o p y - C a m b r i d g e U n i v e r s i t y P r e s s - R e v i e w C o p y R e v i e w C o p y - C a m b r i d g e U n i v e r s i t y P r e s s - R e v i e w C o p y R e v i e w C o p y - C a m b r i d g e U n i v e r s i t y P r e s s - R e v i e w C o p y R e v i e w C o p y - C a m b r i d g e U n i v e r s i t y Copyright Material - Review Only - Not for Redistribution
- 353. Unit 4: Shape, space and measures 343 15 Scale drawings, bearings and trigonometry Worked example 3 Calculate the value of: a tan40° b tan15.4° a tan 4 0 = b tan 1 5 . 4 = Remind yourself how to deal with equations that involve fractions from chapter 6. REWIND Worked example 4 Find the value of x in the diagram. Give your answer to the nearest mm. 56° x mm 22.1 mm Opp(56°) = x Adj 56° = 22.1mm tan . 56 22 1 ° = x ⇒ = ( ) ° ( ) = ≈ ( ) x ⇒ = ⇒ = 22 1 5 ( ) 1 5 ( ) ( ) ( ) 32 76459 33 . t 1 5 . t 1 5 an 1 5 an 1 5 . … mm nearest mm Worked example 5 The angle of approach of an airliner should be 3°. If a plane is 305 metres above the ground, how far should it be from the airfield? 3° 305 m x tan3° = 305 x ⇒ x tan3° = 305 ⇒ = ° = ≈ x ⇒ = ⇒ = 305 3 5819 74 5820 tan . … (nearest metre) e s s - R e v i e w C o p y - C a m b r i d g e U n i v e r s i t y P r e s s - R e v i e w C o p y R e v i e w C o p y - C a m b r i d g e U n i v e r s i t y P r e s s - R e v i e w C o p y R e v i e w C o p y - C a m b r i d g e U n i v e r s i t y P r e s s - R e v i e w C o p y R e v i e w C o p y - C a m b r i d g e U n i v e r s i t y Copyright Material - Review Only - Not for Redistribution
- 354. Unit 4: Shape, space and measures Cambridge IGCSE Mathematics 344 Exercise 15.5 1 Calculate the value of these tangent ratios, giving your answers to 3 significant figures where necessary. a tan 35° b tan 46° c tan 18° d tan 45° e tan 15.6° f tan 17.9° g tan 0.5° h tan 0° 2 For each of the following triangles find the required tangent ratio as a fraction in the lowest terms. a tan A = A 2 cm 1 cm A b tan A = A 4 cm 6 cm A c tan A = tan B = 2 m 8 m B A B A d tan x = x 3.6 2.4 e tan z = tan y = y z m n f tan C = a2 a C C g tan D = D p3 p5 D 3 Find the length of the lettered side in each case. Give your answers to 3 significant figures where necessary. a x cm 60° 3 cm b 8 m y m 30° c z m 70° 13 m d 3.8 km p km 43° e q cm 45° 18 cm f r cm 43° 11 cm e s s - R e v i e w C o p y - C a m b r i d g e U n i v e r s i t y P r e s s - R e v i e w C o p y R e v i e w C o p y - C a m b r i d g e U n i v e r s i t y P r e s s - R e v i e w C o p y R e v i e w C o p y - C a m b r i d g e U n i v e r s i t y P r e s s - R e v i e w C o p y R e v i e w C o p y - C a m b r i d g e U n i v e r s i t y Copyright Material - Review Only - Not for Redistribution
- 355. Unit 4: Shape, space and measures 345 15 Scale drawings, bearings and trigonometry 4 Calculate the lettered length in each case. In some cases you are expected to calculate the length of the adjacent. Make sure that you are careful when substituting lengths into the tangent ratio formula. a x cm 12 cm 30° b 15 cm y cm 43° c 18 cm z cm 27° d 10.8 cm p cm 54° e 13.2 cm q cm 72° f 83.3 m r m 36° g 12.3 m f m 12° h 38.7 km g km 22° i 19.4 m h m 64° 5 47° 30 m M O T a Use your calculator to find the value of tan47° correct to 4 decimal places. b The diagram shows a vertical tree, OT, whose base, O, is 30m horizontally from point M. The angle of elevation of T from M is 47°. Calculate the height of the tree. 6 Melek wants to estimate the width of a river which has parallel banks. He starts at point A on one bank directly opposite a tree on the other bank. He walks 80m along the bank to point B and then looks back at the tree. He finds that the line between B and the tree makes an angle of 22° with the bank. Calculate the width of the river. tree river 80 m 22° A B 7 The right-angled ΔABC has BÂC = 30°. Taking the length of BC to be one unit: a work out the length of AC b use Pythagoras’ theorem to obtain the length of AB. A C B 30° hypotenuse adj(30°) opp(30°) E e s s - R e v i e w C o p y - C a m b r i d g e U n i v e r s i t y P r e s s - R e v i e w C o p y R e v i e w C o p y - C a m b r i d g e U n i v e r s i t y P r e s s - R e v i e w C o p y R e v i e w C o p y - C a m b r i d g e U n i v e r s i t y P r e s s - R e v i e w C o p y R e v i e w C o p y - C a m b r i d g e U n i v e r s i t y Copyright Material - Review Only - Not for Redistribution
- 356. Unit 4: Shape, space and measures Cambridge IGCSE Mathematics 346 8 The diagram shows a ladder that leans against a brick wall. If the angle between the ladder and the floor is 82°, and the ladder reaches 3.2m up the wall, find the distance d m of the foot of the ladder from the bottom of the wall. Give your answer to the nearest cm. 3.2 m d m 82º 9 Adi and Sarah are taking part in a Maypole dance. Adi claims that the pole is 4 metres tall but Sarah thinks he is wrong. Adi and Sarah each pull a piece of maypole ribbon tight and pin it to the ground. The points A and B represent where the ribbon was pinned to the ground; Adi and Sarah measure this distance as 2.4m. Use the diagram to decide if Adi is right or not. D B A C 42° 42° 4.5 m 4.5 m 2.4 m Calculating angles Your calculator can also ‘work backwards’ to find the unknown angle associated with a particular tangent ratio. You use the inverse tangent function tan-1 on the calculator. Generally this function uses the same key as the tangent ratio, but is placed above. If this is the case you will need to use 2ndF or shift before you press the tan button. Worked example 6 Find the acute angle with the tangents below, correct to 1 decimal place: a 0.1234 b 5 c 2.765 a shift tan 0 . 1 2 3 4 = So the angle is 7.0° b shift tan 5 = So the angle is 78.7° c shift tan 2 . 7 6 5 = So the angle is 70.1° You need to be able to work out whether a problem can be solved using trigonometry or whether you can use Pythagoras' theorem. Look at these two problems carefully. Can you see why you can't use Pythagoras' theorem to solve 8, but you could use it to solve 9? ‘Functions’ are dealt with more thoroughly in chapter 22. FAST FORWARD e s s - R e v i e w C o p y - C a m b r i d g e U n i v e r s i t y P r e s s - R e v i e w C o p y R e v i e w C o p y - C a m b r i d g e U n i v e r s i t y P r e s s - R e v i e w C o p y R e v i e w C o p y - C a m b r i d g e U n i v e r s i t y P r e s s - R e v i e w C o p y R e v i e w C o p y - C a m b r i d g e U n i v e r s i t y Copyright Material - Review Only - Not for Redistribution
- 357. Unit 4: Shape, space and measures 347 15 Scale drawings, bearings and trigonometry Worked example 7 Calculate, correct to 1 decimal place, the lettered angles. a 4 cm 5 cm 3 cm a b 12 cm 5 cm 13 cm b c 24 m 7 m 25 m c d a tan ( ) ( ) a ( ) ( ) ( ) ( ) = = = = = opp adj 3 4 0 7 . 0 75 a a = = = ° tan ( − n ( . ) . . ( = ° . ( ) 1 n ( n (0 7 . ) 0 7 . ) . ) . ) 36 869897 36 = ° 36 = ° 9 1 . ( 9 1 . ( = ° . ( 9 1 = ° . ( … dp b tan ( ) ( ) b b ( ) ( ) b ( ) ( ) = = = = = opp adj 12 5 2 4 . 2 4 b b = = = ° tan ( . ) − n ( . ) . . ( = ° . ( ) 1 n ( . ) n ( . ) n ( . ) 2 4 n ( . ) 67 380135 67 = ° 67 = ° 4 1 . ( 4 1 . ( = ° . ( 4 1 = ° . ( … dp c tan ( ) ( ) c ( ) ( ) ( ) ( ) = = = = opp adj 24 7 c c = = = ° − tan . . ( = ° . ( ) 1 24 7 73 739795 73 = ° 73 = ° 7 1 . ( 7 1 . ( = ° . ( 7 1 = ° . ( … dp To find the angle d, you could use the fact that the angle sum in a triangle is 180°. This gives d = 180° - (90° + 73.7°) = 16.3°. Alternatively, you could use the tangent ratio again but with the opp and adj re-assigned to match this angle: tan ( ) ( ) d d ( ) ( ) d ( ) ( ) = = = = opp adj 7 24 d d = = = ° − tan . . ( = ° . ( ) 1 7 24 16 260204 16 = ° 16 = ° 3 1 . ( 3 1 . ( = ° . ( 3 1 = ° . ( … dp e s s - R e v i e w C o p y - C a m b r i d g e U n i v e r s i t y P r e s s - R e v i e w C o p y R e v i e w C o p y - C a m b r i d g e U n i v e r s i t y P r e s s - R e v i e w C o p y R e v i e w C o p y - C a m b r i d g e U n i v e r s i t y P r e s s - R e v i e w C o p y R e v i e w C o p y - C a m b r i d g e U n i v e r s i t y Copyright Material - Review Only - Not for Redistribution
- 358. Unit 4: Shape, space and measures Cambridge IGCSE Mathematics 348 Exercise 15.6 1 Find, correct to 1 decimal place, the acute angle that has the tangent ratio: a 0.85 b 1.2345 c 3.56 d 10. 2 Find, correct to the nearest degree, the acute angle that has the tangent ratio: a 2 5 b 7 9 c 25 32 d 2 3 4 3 Find, correct to 1 decimal place, the lettered angles in these diagrams. a a 7 cm 10 cm b b 2 cm 9 cm c c 4 m 5 m d d e 12 cm 36 cm e 1 cm f 3 cm 4 A ladder stands on horizontal ground and leans against a vertical wall. The foot of the ladder is 2.8m from the base of the wall and the ladder reaches 8.5m up the wall. Calculate the angle the ladder makes with the ground. ladder 2.8 m 8.5 m 5 The top of a vertical cliff is 68m above sea level. A ship is 175m from the foot of the cliff. Calculate the angle of elevation of the top of the cliff from the ship. sea level 175 m 68 m Draw a clear diagram. e s s - R e v i e w C o p y - C a m b r i d g e U n i v e r s i t y P r e s s - R e v i e w C o p y R e v i e w C o p y - C a m b r i d g e U n i v e r s i t y P r e s s - R e v i e w C o p y R e v i e w C o p y - C a m b r i d g e U n i v e r s i t y P r e s s - R e v i e w C o p y R e v i e w C o p y - C a m b r i d g e U n i v e r s i t y Copyright Material - Review Only - Not for Redistribution
- 359. Unit 4: Shape, space and measures 349 15 Scale drawings, bearings and trigonometry 6 O is the centre of a circle with OM = 12cm. a Calculate AM. b Calculate AB. 12 cm 42° O A M B 7 The right-angled triangle ABC has hypotenuse AC = 7cm and side BC = 3cm. Calculate the length AB and hence the angle ACB. Sine and cosine ratios You will have noticed that the tangent ratio only makes use of the opposite and adjacent sides. What happens if you need to use the hypotenuse? In fact, there are three possible pairs of sides that you could include in a ratio: • opposite and adjacent (already used with the tangent ratio) • opposite and hypotenuse • or adjacent and hypotenuse. This means that you need two more ratios: the sine ratio is written as sin( ) opp( ) hyp hy hy A A = the cosine ratio is written as cos( ) adj( ) hyp hy hy A A = . The abbreviation ‘cos’ is pronounced ‘coz’ and the abbreviation ‘sin’ is pronounced ‘sine’ or ‘sign’. As with the tangent ratio, you can use the sin and cos keys on your calculator to find the sine and cosine ratios associated with given angles. You can also use the shift sin or sin-1 and shift cos or cos-1 ‘inverse’ functions to find angles. Before looking at some worked examples you should note that with three possible ratios you need to know how to pick the right one! ‘SOHCAHTOA’ might help you to remember: S O H C A H T O A The word ‘SOHCAHTOA’ has been divided into three triangles of letters, each representing one of the three trigonometric ratios. The first letter in each trio tells you which ratio it represents (sine, cosine or tangent), the second letter (at the top) tells you which side’s length goes on the top of the ratio, and the third letter tells you which side’s length goes on the bottom. S = sine O = opposite H = hypotenuse C = cosine A = adjacent T = tan e s s - R e v i e w C o p y - C a m b r i d g e U n i v e r s i t y P r e s s - R e v i e w C o p y R e v i e w C o p y - C a m b r i d g e U n i v e r s i t y P r e s s - R e v i e w C o p y R e v i e w C o p y - C a m b r i d g e U n i v e r s i t y P r e s s - R e v i e w C o p y R e v i e w C o p y - C a m b r i d g e U n i v e r s i t y Copyright Material - Review Only - Not for Redistribution
- 360. Unit 4: Shape, space and measures Cambridge IGCSE Mathematics 350 For example, if a problem involves the opposite and hypotenuse you simply need to find the triangle of letters that includes ‘O’ and ‘H’: SOH. The ‘S’ tells you that it is the sine ratio, the ‘O’ at the top of the triangle sits on top of the fraction, and the lower ‘H’ sits on the bottom. The use of ‘SOHCAHTOA’ is shown clearly in the following worked examples. The tangent ratio has been included again in these examples to help show you how to decide which ratio should be used. Worked example 8 Find the length of the sides lettered in each of the following diagrams. a x cm 11 cm 55° b p cm 13.2 cm 32° c h cm 35.2 cm 50° a opp(55°) = x hyp = 11cm So sin ( ) 55 ( ) 55 ( ) 11 ° = ( ) ( ) = opp hyp x ⇒ x = 11 sin55° ⇒ x = 9.0 cm (to 1dp) Identify the sides that you are going to consider clearly: S O H x cm 11 cm 55° S = O H b adj(32°) = 13.2cm hyp = p cm So cos ( ) . 32 ( ) 32 ( ) 13 2 ° = ( ) ( ) = adj hyp p ⇒ p cos32° = 13.2 ⇒ = ° p ⇒ = ⇒ = 13 2 32 . cos ⇒ p = 15.6 cm (to 1dp) p cm 13.2 cm 32° C A H C = A H c opp(50°) = hcm adj(50°) = 35.2cm So tan ( ) ( ) . 50 ( ) 50 ( ) ( ) 50 ( ) 35 2 ° = ( ) ( ) ( ) ( ) = opp adj h ⇒ h = 35.2 tan50° ⇒ h = 41.9 cm (to 1dp) h cm 35.2 cm 50° T O A T = O A S O H S = O ⇒ H e s s - R e v i e w C o p y - C a m b r i d g e U n i v e r s i t y P r e s s - R e v i e w C o p y R e v i e w C o p y - C a m b r i d g e U n i v e r s i t y P r e s s - R e v i e w C o p y R e v i e w C o p y - C a m b r i d g e U n i v e r s i t y P r e s s - R e v i e w C o p y R e v i e w C o p y - C a m b r i d g e U n i v e r s i t y Copyright Material - Review Only - Not for Redistribution
- 361. Unit 4: Shape, space and measures 351 15 Scale drawings, bearings and trigonometry Worked example 9 Find the size of the lettered angles in each of the following diagrams. a 8 cm 12 cm x b 63.2 m 31.4 m y a opp(x) = 8cm hyp = 12cm So sin ( ) x ( ) ( ) = = = = opp hyp 8 12 ⇒ = − x ⇒ = ⇒ = sin 1 8 12 ⇒ x = 41.8° (1dp) Once again, clearly identify the sides and ratio to be used: 8 cm 12 cm x S O H b adj(y) = 31.4m hyp = 63.2m So cos ( ) . . y y ( ) ( ) = = = = adj hyp 31 4 63 2 ⇒ = − y ⇒ = ⇒ = cos . . 1 31 4 63 2 ⇒ y = 60.2° (1dp) 63.2 m 31.4 m y C A H Worked example 10 A ladder 4.8m long leans against a vertical wall with its foot on horizontal ground. The ladder makes an angle of 70° with the ground. a How far up the wall does the ladder reach? b How far is the foot of the ladder from the wall? 70° 4.8 m C B A a In the diagram, AC is the hypotenuse of the right-angled ΔABC. AB is the distance that the ladder reaches up the wall. opp(70°) = AB hyp = 4.8m So sin ( ) 70 ( ) 70 ( ) 4 8 . 4 8 ° = ( ) ( ) = opp hyp AB ⇒ AB = 4.8 sin70° ⇒ AB = 4.5m (1dp) So the ladder reaches 4.5m up the wall. 4.8 m S A B C O H 70° e s s - R e v i e w C o p y - C a m b r i d g e U n i v e r s i t y P r e s s - R e v i e w C o p y R e v i e w C o p y - C a m b r i d g e U n i v e r s i t y P r e s s - R e v i e w C o p y R e v i e w C o p y - C a m b r i d g e U n i v e r s i t y P r e s s - R e v i e w C o p y R e v i e w C o p y - C a m b r i d g e U n i v e r s i t y Copyright Material - Review Only - Not for Redistribution
- 362. Unit 4: Shape, space and measures Cambridge IGCSE Mathematics 352 Exercise 15.7 1 For each of the following triangles write down the value of: i sinA ii cosA iii tanA a 12 16 20 A b 7 24 25 A c 12 5 13 A d 29 21 20 A e 8 15 17 A f 9 12 15 A g 84 13 85 A 2 Use your calculator to find the value of each of the following. Give your answers to 4 decimal places. a sin 5° b cos 5° c sin 30° d cos 30° e sin 60° f cos 60° g sin 85° h cos 85° 3 For each of the following triangles, use the letters of the sides to write down the given trigonometric ratio. a 42° e g f cos 42° b 60° a b c sin 60° c cos 25° 25° R Q P d θ sin θ° x y r ° e 48° p r q cos 48° f 30° d e f sin 30° g 35° H J I cos 35° h ° θ x y r ° θ cos Remember to check that your calculator is in degrees mode. There should be a small ‘D’ on the screen. b The distance of the foot of the ladder from the wall is BC. adj(70°) = BC hyp = 4.8m So cos ( ) 70 ( ) 70 ( ) 4 8 . 4 8 ° = ( ) ( ) = adj hyp BC ⇒ BC = 4.8 cos70° ⇒ BC = 1.64m (2dp) The foot of the ladder is 1.64m from the wall. 4.8 m C A B C A H 70° e s s - R e v i e w C o p y - C a m b r i d g e U n i v e r s i t y P r e s s - R e v i e w C o p y R e v i e w C o p y - C a m b r i d g e U n i v e r s i t y P r e s s - R e v i e w C o p y R e v i e w C o p y - C a m b r i d g e U n i v e r s i t y P r e s s - R e v i e w C o p y R e v i e w C o p y - C a m b r i d g e U n i v e r s i t y Copyright Material - Review Only - Not for Redistribution
- 363. Unit 4: Shape, space and measures 353 15 Scale drawings, bearings and trigonometry 4 For each of the following triangles find the length of the unknown, lettered side. (Again, some questions that require the tangent ratio have been included. If you use SOHCAHTOA carefully you should spot these quickly!) a 25° a m 2.0 m b 60° b 9 m c 35° c km 13 km d d cm 10 cm 27° e 28° e cm 12 cm f 28° f cm 18 cm g 70° g cm 15 cm h 65° h cm 45 cm i i cm 3 cm 37° j 36° j m 53 m k 71° k m 8 m l 47° l m 93.4 m 5 Use your calculator to find, correct to 1 decimal place: a an acute angle whose sine is 0.99 b an acute angle whose cosine is 0.5432 c an acute angle whose sine is 3 8 d an acute angle whose cosine is 3 2 . 6 Find, to 1 decimal place, the lettered angle in each of the following triangles. a a 7 16 b 12 17 b c 7 20 c d 60 61 d e e 3.4 6.7 f 15x 3x f e s s - R e v i e w C o p y - C a m b r i d g e U n i v e r s i t y P r e s s - R e v i e w C o p y R e v i e w C o p y - C a m b r i d g e U n i v e r s i t y P r e s s - R e v i e w C o p y R e v i e w C o p y - C a m b r i d g e U n i v e r s i t y P r e s s - R e v i e w C o p y R e v i e w C o p y - C a m b r i d g e U n i v e r s i t y Copyright Material - Review Only - Not for Redistribution
- 364. Unit 4: Shape, space and measures Cambridge IGCSE Mathematics 354 7 The diagram shows a ramp, AB, which makes an angle of 18° with the horizontal. The ramp is 6.25m long. Calculate the difference in height between A and B (this is the length BC in the diagram). 18° 6.25 m A C B 8 Village Q is 18km from village P, on a bearing of 056°. a Calculate the distance Q is north of P. b Calculate the distance Q is east of P. 56° 18 km P Q North 9 A 15m beam is resting against a wall. The base of the beam forms an angle of 70° with the ground. a At what height is the top of the beam touching the wall? b How far is the base of the beam from the wall? 10 A mountain climber walks 380m along a slope that is inclined at 65° to the horizontal, and then a further 240m along a slope inclined at 60° to the horizontal. Calculate the total vertical distance through which the climber travels. 65° 60° 380 m 240 m 11 Calculate the unknown, lettered side(s) in each of the following shapes. Give your answers to 2 decimal places where necessary. a 60° 40° 11 cm x cm b 62° 35° 8 cm y cm c 48° 84 m 21° A B D C Find length AD. d 34° 51° 47° 23.2 cm a cm b cm e s s - R e v i e w C o p y - C a m b r i d g e U n i v e r s i t y P r e s s - R e v i e w C o p y R e v i e w C o p y - C a m b r i d g e U n i v e r s i t y P r e s s - R e v i e w C o p y R e v i e w C o p y - C a m b r i d g e U n i v e r s i t y P r e s s - R e v i e w C o p y R e v i e w C o p y - C a m b r i d g e U n i v e r s i t y Copyright Material - Review Only - Not for Redistribution
- 365. Unit 4: Shape, space and measures 355 15 Scale drawings, bearings and trigonometry 12 For each of the following angles calculate: i tan x ii sin cos x x a x = 30° b x = 48° c x = 120° d x = 194° What do you notice? 13 Calculate: a (sin 30°)2 + (cos 30°)2 b (sin 48°)2 + (cos 48°)2 . c Choose another angle and repeat the calculation. d What do you notice? 14 The diagrams show a right-angled isosceles triangle and an equilateral triangle. A B C 1 m 1 m x D F E y z G 2 m 2 m 2 m a Write down the value of angle ACB. b Use Pythagoras’ theorem to calculate length AC, leaving your answer in exact form. c Copy triangle ABC, including your answers to (a) and (b). d Use your diagram to find the exact values of sin 45°, cos 45° and tan 45°. e Write down the value of angle y. f Write down the value of angle z. g Use Pythagoras’ theorem to calculate the length EG, leaving your answer in exact form. h Copy the diagram, including your answers to (e), (f) and (g). i Use your diagram to find the exact values of sin 30°, cos 30°, tan 30°, sin 60°, cos 60°, tan 60°. j Copy and complete the table below, using your answers from previous parts of this question. Angle x sin x cos x tan x 30° 60° 45° 15.4 Solving problems using trigonometry You may need to make use of more than one trigonometric ratio when solving problems that involve right-angled triangles. To make it clear which ratio to use and when, you should follow these guidelines. • If the question does not include a diagram, draw one. Make it clear and large. • Draw any triangles that you are going to use separately and clearly label angles and sides. Exact form You have already met irrational numbers in chapter 9. An example was 2 . This is called a ‘surd’. Written like this it is exact, but if you put it through a calculator and then use a rounded value, your answer is an approximation. The same is true for recurring decimals like 2 3 . When a question asks for an answer in exact form it intends you to leave any surds in root form and any recurring decimals as fractions. So, any recurring decimals as fractions. 5 2 5 2 is exact but putting it through a calculator and writing 7.07 (2 d.p.) is not. Similarly 2 3 is exact but 0.67 (2 d.p.) is not. It will be useful to remind yourself about general angle properties of triangles from chapter 3. REWIND E e s s - R e v i e w C o p y - C a m b r i d g e U n i v e r s i t y P r e s s - R e v i e w C o p y R e v i e w C o p y - C a m b r i d g e U n i v e r s i t y P r e s s - R e v i e w C o p y R e v i e w C o p y - C a m b r i d g e U n i v e r s i t y P r e s s - R e v i e w C o p y R e v i e w C o p y - C a m b r i d g e U n i v e r s i t y Copyright Material - Review Only - Not for Redistribution
- 366. Unit 4: Shape, space and measures Cambridge IGCSE Mathematics 356 • Identify any right-angled triangles that may be useful to you. • Identify any sides or angles that you already know. • Write down which of the opposite, adjacent and hypotenuse are going to be used, and then use SOHCAHTOA to help you decide which ratio to use. • Write down the ratio and solve, either for an angle or a side. • If you need to use a side or angle that you have calculated for another part of a question, try hard to use the unrounded value that you have in your calculator memory. This will help to avoid rounding errors later on. Calculating distances In mathematics, when you are asked to calculate the distance from a point to a line you are expected to find the shortest distance between the point and the line. This distance is equal to the length of a perpendicular from the point to the line. In this diagram, the distance from P to the line AB is 5 units. This is the shortest distance A B P Any other line from the point to the line creates a right-angled triangle and the line itself becomes the hypotenuse of that triangle. Any hypotenuse must be longer than the perpendicular line, so, all the other distances from P to the line are longer than 5 units. There are different ways of working out the distance between a point and a line. The method you choose will depend on the information you are given. For example, if you were asked to find the distance between point A and line BD given the information on the diagram below, you could draw in the perpendicular and use trigonometry to find the lengths of the other sides of the triangle. 40° 4.6cm B D A The following worked example shows you how trigonometry is used to find the distance between point A and the line BD and then how to use it to solve the problem given. It also shows you how the solution to a trigonometry problem could be set out. If you are given the equation of the line (y = mx + c) and the coordinates of the point (x, y), you can use what you know about coordinate geometry and simultaneous equations to work out the distance. • Determine the equation of the line perpendicular to the given line that goes through (x, y). (Remember that if the gradient of one line is a/b, then the gradient of a line perpendicular to it is –b/a.) • Solve the two equations simultaneously to find the point of intersection. • Calculate the distance between the point of intersection and the given point. You will use the distance between a point and a line again when you deal with circles in chapter 19. FAST FORWARD E e s s - R e v i e w C o p y - C a m b r i d g e U n i v e r s i t y P r e s s - R e v i e w C o p y R e v i e w C o p y - C a m b r i d g e U n i v e r s i t y P r e s s - R e v i e w C o p y R e v i e w C o p y - C a m b r i d g e U n i v e r s i t y P r e s s - R e v i e w C o p y R e v i e w C o p y - C a m b r i d g e U n i v e r s i t y Copyright Material - Review Only - Not for Redistribution
- 367. Unit 4: Shape, space and measures 357 15 Scale drawings, bearings and trigonometry Worked example 11 The diagram shows an isosceles trapezium ABDC. Calculate the area of the trapezium. B C A D 4.6 cm 4.6 cm 8.2 cm 60° 60° The area of a trapezium = (mean of the parallel sides) × (perpendicular distance between them) In this diagram, perpendiculars have been added to form right-angled triangles so that trigonometry can be used. B C A D 4.6 cm 4.6 cm 8.2 cm 60° 60° M N AC = MN and you can find the length of MN if you calculate the lengths of BM and ND. In ΔABM, sin 60° = opp hyp ( ) ( ) 60 ( ) 4 6 . 4 6 ( ) ( ) = AM and cos 60° = adj hyp ( ) ( ) 60 ( ) 4 6 . 4 6 ( ) ( ) = BM Hence, AM = 4.6 × sin 60° and BM = 4.6 × cos 60° AM = 3.983716…cm and BM = 2.3cm By symmetry, ND = BM = 2.3cm and ∴ MN = 8.2 - (2.3 + 2.3) = 3.6cm Hence, AC = 3.6cm and AM = CN = 3.983716…cm The area of + 3 983716 ABDC AC BD AM = × = + × 2 3 6 8 2 2 . . + . . 3 6 . . 3 6 8 2 . . 8 2 . … … … cm 23 3929 cm 2 2 = . 0 5 . 0 Area of ABDC = 23.5cm2 (to 3sf) Worked example 12 The span between the towers of Tower Bridge in London is 76m. When the arms of the bridge are raised to an angle of 35°, how wide is the gap between their ends? 76 76 76 m m Give your answer to 3 significant figures if no degree of accuracy is specified. Tip Trigonometry is used to work out lengths and angles when they can't really be measured. For example in navigation, surveying, engineering, construction and even the placement of satellites and receivers. LINK e s s - R e v i e w C o p y - C a m b r i d g e U n i v e r s i t y P r e s s - R e v i e w C o p y R e v i e w C o p y - C a m b r i d g e U n i v e r s i t y P r e s s - R e v i e w C o p y R e v i e w C o p y - C a m b r i d g e U n i v e r s i t y P r e s s - R e v i e w C o p y R e v i e w C o p y - C a m b r i d g e U n i v e r s i t y Copyright Material - Review Only - Not for Redistribution
- 368. Unit 4: Shape, space and measures Cambridge IGCSE Mathematics 358 Exercise 15.8 Applying your skills 1 The diagram represents a ramp AB for a lifeboat. AC is vertical and CB is horizontal. a Calculate the size of angle ABC correct to 1 decimal place. b Calculate the length of BC correct to 3 significant figures. 18.6 m C A B 5.2 m 2 AB is a chord of a circle, centre O, radius 8cm. Angle AOB = 120°. Calculate the length of AB. O A B 120° 8 cm 8 cm 3 The diagram represents a tent in the shape of a triangular prism. The front of the tent, ABD, is an isosceles triangle with AB = AD. The width, BD, is 1.8m and the supporting pole AC is perpendicular to BD and 1.5m high. The tent is 3m long. Calculate: a the angle between AB and BD b the length of AB c the capacity inside the tent (i.e. the volume). 3 m 1.8 m B D C 1.5 m A Look at chapter 7 and remind yourself about the formula for the volume of a prism. REWIND Here is a simplified labelled drawing of the bridge, showing the two halves raised to 35°. B C A D 76 m 35° 35° M N gap The gap = BD = MN and MN = AC - (AM + NC). The right-angled triangles ABM and CDN are congruent, so AM = NC. When the two halves are lowered, they must meet in the middle. ∴ AB = CD = 76 2 = 38m In ΔABM, cos 35° = adj hyp ( ) ( ) 35 ( ) 38 ( ) ( ) = AM AM = × ° = 38 = × 38 = × cos 35 311277...m . ∴ = + ( ) = – . . + . . . MN ∴ = MN ∴ = 76 311277 . . 1277 . . . . ... . . 31 . . 31 . .1277 ... 13 744 ...m The gap BD = 13.7m (to 3sf) Drawing a clear, labelled sketch can help you work out what mathematics you need to do to solve the problem. e s s - R e v i e w C o p y - C a m b r i d g e U n i v e r s i t y P r e s s - R e v i e w C o p y R e v i e w C o p y - C a m b r i d g e U n i v e r s i t y P r e s s - R e v i e w C o p y R e v i e w C o p y - C a m b r i d g e U n i v e r s i t y P r e s s - R e v i e w C o p y R e v i e w C o p y - C a m b r i d g e U n i v e r s i t y Copyright Material - Review Only - Not for Redistribution
- 369. Unit 4: Shape, space and measures 359 15 Scale drawings, bearings and trigonometry 4 Calculate the angles of an isosceles triangle that has sides of length 9cm, 9cm and 14cm. 14 cm B C N A 9 cm 9 cm 5 The sketch represents a field PQRS on level ground. The sides PQ and SR run due east. a Write down the bearing of S from P. b Calculate the perpendicular (shortest) distance between SR and PQ. c Calculate, in square metres, the area of the field PQRS. 70° 300 m 250 m 450 m North P Q R S 6 In the isosceles triangle DEF, E = F = 35° and side EF = 10m. a Calculate the perpendicular (shortest) distance from D to EF. b Calculate the length of the side DE. 35° 35° E F D 10 m 7 Find the length of a diagonal (QT) of a regular pentagon that has sides of length 10cm. Give your answer to the nearest whole number. 10 cm 10 cm 108° P Q R S T 8 The diagram shows a regular pentagon with side 2cm. O is the centre of the pentagon. a Find angle AOE. b Find angle AOM. c Use trigonometry on triangle AOM to find the length OM. d Find the area of triangle AOM. e Find the area of the pentagon. 2 cm B A E D C O M 9 Using a similar method to that described in question 8 find the area of a regular octagon with side 4cm. 10 Find the area of a regular pentagon with side 2a metres. 11 Find the area of a regular polygon with n sides, each of length 2a metres. Areas of two-dimensional shapes were covered in chapter 7. REWIND e s s - R e v i e w C o p y - C a m b r i d g e U n i v e r s i t y P r e s s - R e v i e w C o p y R e v i e w C o p y - C a m b r i d g e U n i v e r s i t y P r e s s - R e v i e w C o p y R e v i e w C o p y - C a m b r i d g e U n i v e r s i t y P r e s s - R e v i e w C o p y R e v i e w C o p y - C a m b r i d g e U n i v e r s i t y Copyright Material - Review Only - Not for Redistribution
- 370. Unit 4: Shape, space and measures Cambridge IGCSE Mathematics 360 15.5 Sines, cosines and tangents of angles more than 90° You have now seen that we can find the sine, cosine or tangent of an angle in a triangle by using your calculator. It is possible to find sines, cosines and tangents of angles of any size. Investigation Use a calculator to find each of the following. sin 30° and sin 150° sin 10° and sin 170° sin 60° and sin 120° sin 5° and sin 175° What did you notice? What is the relationship between the two angles in each pair. Now do the same for these pairs. cos 30° and cos 330° tan 30° and tan 210° cos 60° and cos 300° tan 60° and tan 240° cos 50° and cos 310° tan 15° and tan 195° cos 15° and cos 345° tan 100 and tan 280° The pattern is different for each of sine, cosine and tangent. You will now explore the graphs of y = sin θ, y = cos θ and y = tan θ to see why. The graph of y = sin θ If you plot several values of sin θ against θ you will get the following: x –180° 360° 720° 900° 1 –1 y 450° 540° 630° 180° 810° 270° 90° The graph repeats itself every 360° in both the positive and negative directions. Notice that the section of the graph between 0 and 180° has reflection symmetry, with the line of reflection being θ = 90°. This means that sin θ = sin (180° - θ), exactly as you should have seen in the investigation above. It is also very important to notice that the value of sin θ is never larger than 1 nor smaller than -1. sinθ, cosθ and tanθ are actually functions. Functions take input values and give you a numerical output. For example, if you use your calculator to find sin30° you will get the answer 1 2 . Your calculator takes the input 30°, finds the sine of this angle and gives you the output 1 2 . You will learn more about functions in Chapter 22. FAST FORWARD E e s s - R e v i e w C o p y - C a m b r i d g e U n i v e r s i t y P r e s s - R e v i e w C o p y R e v i e w C o p y - C a m b r i d g e U n i v e r s i t y P r e s s - R e v i e w C o p y R e v i e w C o p y - C a m b r i d g e U n i v e r s i t y P r e s s - R e v i e w C o p y R e v i e w C o p y - C a m b r i d g e U n i v e r s i t y Copyright Material - Review Only - Not for Redistribution
- 371. Unit 4: Shape, space and measures 361 15 Scale drawings, bearings and trigonometry The graph of y = cosθ If you plot several values of cos θ against θ you will get a similar shape, but the line of symmetry is in a different place: 90° y –1 x –180° 360° 720° 900° 450° 540° 630° –90° 270° 180° 1 810° The graph repeats itself every 360° in both the positive and negative directions. Here the graph is symmetrical from 0 to 360°, with the reflection line at θ = 180°. This means that cosθ = cos(360° - θ), again you should have seen this in the investigation above. By experimenting with some angles you will also see that cosθ = -cos(180° - θ) It is also very important to notice that the value of cosθ is never larger than 1 nor smaller than -1. The graph of y = tanθ Finally, if you plot values of tanθ against θ you get this graph: y x –90° –60° –30° 30° 60° 90° 120° 150° 180° 210° 240° 270° 300° 330° 360° 390° 420° 450° 1 1.5 2 2.5 0.5 0° –0.5 –1 –1.5 –2 –2.5 The vertical dotted lines are approached by the graph, but it never touches nor crosses them. Notice that this graph has no reflection symmetry, but it does repeat every 180°. This means that tanθ = tan(180° + θ). Note that, unlike sinθ and cosθ, tanθ is not restricted to being less than 1 or greater than -1. The shapes of these three graphs means that equations involving sine, cosine or tangent will have multiple solutions. The following examples show you how you can find these. In each case the question is done using a sketch graph to help. A line that is approached by a graph in this way is known as an asymptote. You will learn more about asymptotes in Chapter 18. FAST FORWARD E e s s - R e v i e w C o p y - C a m b r i d g e U n i v e r s i t y P r e s s - R e v i e w C o p y R e v i e w C o p y - C a m b r i d g e U n i v e r s i t y P r e s s - R e v i e w C o p y R e v i e w C o p y - C a m b r i d g e U n i v e r s i t y P r e s s - R e v i e w C o p y R e v i e w C o p y - C a m b r i d g e U n i v e r s i t y Copyright Material - Review Only - Not for Redistribution
- 372. Unit 4: Shape, space and measures Cambridge IGCSE Mathematics 362 Worked example 13 Which acute angle has the same sine as 120°? sin(180° - θ) = sin θ But in this case, θ = 120° 180° - θ = 120 180° - 120° = θ 60° = θ sin 60° = sin 120° Worked example 14 Express each of the following in terms of another angle between 0° and 180°. a cos 100° b -cos 35° a cos(180° - θ) = -cos θ In this case θ = 100° cos100° = -cos(180° - 100°) = -cos80° b -cos θ = cos(180° - θ) -cos 35° = cos 145° Worked example 15 Solve the following equations, giving all possible solutions in the range 0 to 360 degrees. a sinθ = 1 2 b tanθ = 3 c cosx = − 1 2 a Use your calculator to find one solution: sin− = ° 1 1 2 45 Now mark θ = 45 degrees on a sketch of the graph y = sin θ and draw the line y = 1 2 like this: 1 –1 y x –135° –90° –45° 45° 90° 135° 180° 225° 270° 315° 360° 0° y = 1 2 √ Using the symmetry of the graph, you can see that there is another solution at θ = 135°. Use your calculator to check that sin135 1 2 ° = . Notice that 135° = 180° - 45°. You can use this rule, but drawing a sketch graph always makes it easier to understand why there is a second solution. As well as θ, other variables can be used to represent the angle. In part cof the example, x is used. You work in exactly the same way whatever variable is used. This only needs to be a sketch and doesn’t need to be accurate. It should be just enough for you to see how the symmetry can help. Tip Note that you only need to sketch the part of the graph for 0 to 360°, because you are only looking for solutions between these two values of θ. There are more solutions, but in the range 0 to 360° the line y = 1 2 only meets the graph y = sin θ twice. E e s s - R e v i e w C o p y - C a m b r i d g e U n i v e r s i t y P r e s s - R e v i e w C o p y R e v i e w C o p y - C a m b r i d g e U n i v e r s i t y P r e s s - R e v i e w C o p y R e v i e w C o p y - C a m b r i d g e U n i v e r s i t y P r e s s - R e v i e w C o p y R e v i e w C o p y - C a m b r i d g e U n i v e r s i t y Copyright Material - Review Only - Not for Redistribution
- 373. Unit 4: Shape, space and measures 363 15 Scale drawings, bearings and trigonometry b Use your calculator to find one solution: tan . − = ° 1 3 71 6 . As before mark this on a sketch of the graph y = tan θ and draw the line y = 3. y x –180° –60° 71.6° 180° 251.6° 360° 480° 0° –4 –3 –2 –1 3 2 1 4 You can see that the second solution is 180° + 71.6° = 251.6°. More solutions can be found by adding 180 degrees over and over, but these will all be larger than 360 degrees, so they are not in the range that you want. c Use your calculator to find one solution: cos− − = ° 1 1 2 120 . Draw a sketch and mark the values: 1 –1 y x –180° –120° –60° 60° 180° 300° 360° 420° 480° 0° – 1 2 240° 120° You can now see that the second solution will be at 360° - 120° = 240°. Exercise 15.9 1 Express each of the following in terms of the same trig ratio of another angle between 0° and 180°. a cos 120° b sin 35° c cos 136° d sin 170° e cos 88° f -cos 140° g sin 121° h sin 99° i -cos 45° j -cos 150° 2 Solve each of the following equations, giving all solutions between 0 and 360 degrees. a b c d e f e f g sin s cos tan c sin . cos θ θ b c θ θ b c n s θ θ n s b c n s b c θ θ n s b c in b c θ θ in θ θ θ e f θ θ e f n c θ θ n c e f n c e f θ θ n c e f os e f θ θ os θ n . n . θ b c = = b c b c θ θ b c = = θ θ n s θ θ = = n s θ θ n s θ θ = = θ θ b c n s b c θ θ n s = = n s b c θ θ n s b c in b c θ θ in = = in b c θ θ in = e f = = e f e f θ θ e f = = θ θ n c θ θ = = θ θ e f n c e f θ θ n c = = n c e f θ θ n c e f os e f θ θ os = = os e f θ θ os n c θ θ = = n c θ θ − = e f − = e f e f − = si − = n . − = n . n . n . − = n . n . = − 1 θ θ θ θ 2 b c b c 2 2 θ θ θ θ n c θ θ n c θ θ n c θ θ = = θ θ n c θ θ n c = = θ θ 3 e f e f 2 0 2 n . 0 2 n . 1 3 h i h i h h i h ta h i ta h i n t h i n t h i θ θ h i θ θ h i h i θ θ θ θ θ θ n t θ θ n t n t θ θ h i n t θ θ h i n t h i n t θ θ n t h i n t θ θ n t = = h i n t h i θ θ n t h i n t θ θ n t = = n t h i θ θ n t 3 4 θ θ 3 4 h i θ θ 3 4 h i θ θ θ θ 3 4 n t θ θ 3 4 θ θ h i n t θ θ n t 3 4 h i n t h i θ θ n t n t θ θ 3 4 n t θ θ h i n t θ θ n t 3 4 h i n t h i θ θ n tan θ θ 3 4 θ θ = = 3 4 θ θ = = 3 4 = = n t θ θ = = θ θ 3 4 θ θ n t = = θ θ h i n t θ θ n t = = n t h i θ θ n t 3 4 h i n t θ θ n t = = n t θ θ n tan θ θ = = θ θ 3 4 θ θ an = = θ θ − 3 4 E e s s - R e v i e w C o p y - C a m b r i d g e U n i v e r s i t y P r e s s - R e v i e w C o p y R e v i e w C o p y - C a m b r i d g e U n i v e r s i t y P r e s s - R e v i e w C o p y R e v i e w C o p y - C a m b r i d g e U n i v e r s i t y P r e s s - R e v i e w C o p y R e v i e w C o p y - C a m b r i d g e U n i v e r s i t y Copyright Material - Review Only - Not for Redistribution
- 374. Unit 4: Shape, space and measures Cambridge IGCSE Mathematics 364 3 For each of the following find the smallest positive value of x for which a b c d e sin s b c s c b c b c os b c tan tan cos cos( ) sin x x b c x x b c n s x x n sin x x b c co b c x x co b c s c b c x x b c s c n t n t s c s c = ° n s = ° in = ° x x = ° x x n s x x = ° n s x x in x x = ° x x b c = ° b c b c s c b c = ° b c s c b c os b c = ° os = ° n t = ° n tan = ° = − s c = − s cos = − ( ) = − ( ) ( ) ( ) x x 135 x x = ° 135 = ° x x = ° 135 x x = ° b c 120 b c b c = ° 120 b c = ° 235 = ° 235 = ° ( ) 45 ( ) x x x x x x x x = ° x x = ° x x = ° − ° x x − ° x x = ° x x = ° x x x x si x x = ° si = ° x x = ° si x x = ° n t x x n t x x = ° n t = ° x x = ° x x n t x x = ° an x x an x x ta = ° ta = ° n = ° = ° sin( ) s x x ) s x x = ° ) s = ° x x = ° x x ) s x x = ° x x in x x = ° in = ° x x = ° in x x = ° cos( x x cos( x x) c = ) cos( = ° 270 = ° x x n t 270 x x n t = ° n t 270 = ° n t x x = ° n t = ° 270 x x = ° x x n t = ° 840 = ° 840 = ° x x 30 x x − ° 30 − ° x x − ° 30 x x − ° x x 240 x x = ° 240 = ° x x = ° 240 x x = ° 2 x x x x 540 f n t n t x x n t x x n t g h x x x x ° ° = − ° ) tan tan( = − tan( = − ) ) t ) t x 6 476 4 Solve, giving all solutions between 0 and 360 degrees: ( ) si ( ) n ( ) x ( ) = 2 1 4 5 Solve, giving all solutions between 0 and 360 degrees: 8 3 0 2 (cos ) c 10 ) c 2 ) c x x ) c x x 10 ) c x x ) cos x x − + ) c − + 10 ) c − + ) c x x − + ) c x x − + ) c x x 10 ) c x x ) c − + ) c 10 x x ) cos x x − + x x 3 0 3 0 15.6 The sine and cosine rules The sine and cosine ratios are not only useful for right- angled triangles. To understand the following rules you must first look at the standard way of labelling the angles and sides of a triangle. Look at the triangle shown in the diagram. a c b A B C Notice that the sides are labelled with lower case letters and the angles are labelled with upper case letters. The side that is placed opposite angle A is labelled ‘a’, the side that is placed opposite angle B is labelled ‘b’ and so on. The sine rule For the triangle shown above, the following are true: sin sin A n s n s a B b = and sin sin A n s n s a C c = and sin sin B n s n s b C c = These relationships are usually expressed in one go: sin sin sin A n s n s a B b C c = = = = This is the sine rule. This version of the rule, with the sine ratios placed on the tops of the fractions, is normally used to calculate angles. Write cos x = y and try to factorise Remember, the sine rule is used when you are dealing with pairs of opposite sides and angles. E e s s - R e v i e w C o p y - C a m b r i d g e U n i v e r s i t y P r e s s - R e v i e w C o p y R e v i e w C o p y - C a m b r i d g e U n i v e r s i t y P r e s s - R e v i e w C o p y R e v i e w C o p y - C a m b r i d g e U n i v e r s i t y P r e s s - R e v i e w C o p y R e v i e w C o p y - C a m b r i d g e U n i v e r s i t y Copyright Material - Review Only - Not for Redistribution
- 375. Unit 4: Shape, space and measures 365 15 Scale drawings, bearings and trigonometry The formulae can also be turned upside down when you want to calculate lengths: a A b B c C sin s A n sin sin = = = = You should remember that this represents three possible relationships. Notice that in each case, both the upper and lower case form of each letter is used. This means that each fraction that you use requires an angle and the length of its opposite side. Worked example 16 In ΔABC, A = 80°, B = 30° and side BC = 15cm. Calculate the size of C and the lengths of the sides AB and AC. A B C 15 cm 80° 30° To calculate the angle C, use the fact that the sum of the three angles in a triangle is always 180°. So, C + 80 + 30 = 180 ⇒ C = 180 - 30 - 80 = 70° Now think about the side AB. AB is opposite the angle C (forming an ‘opposite pair’) and side BC is opposite angle A, forming a second ‘opposite pair’. So, write down the version of the sine rule that uses these pairs: a A c C BC A AB C sin s A n sin sin s A n sin = ⇒ = ⇒ in = ⇒ = So, 15 80 70 15 80 70 14 3 sin s 80 n sin sin sin . 70 n . 14 n . ° n s n s = ° ⇒ = ° × ° 70 × ° × ° si × ° n . × ° n . 70 n . × ° n . n . n . AB AB ⇒ = AB ⇒ = cm(3sf) (3sf (3sf Similarly: AC forms an opposite pair with angle B, so once again use the pair BC and angle A: a A b B BC A AC B sin s A n sin sin s A n sin = ⇒ = ⇒ in = ⇒ = So, 15 80 30 15 80 30 7 62 sin s 80 n sin sin sin . 30 n . 7 6 n . 7 6 ° n s n s = ° ⇒ = ° × ° 30 × ° × ° si × ° n . × ° n . 30 n . × ° n . n . n . AC AC ⇒ = AC ⇒ = cm (3sf) (3sf (3sf The ambiguous case of the sine rule The special properties of the sine function can lead to more than one possible answer. The following example demonstrates how this may happen. E e s s - R e v i e w C o p y - C a m b r i d g e U n i v e r s i t y P r e s s - R e v i e w C o p y R e v i e w C o p y - C a m b r i d g e U n i v e r s i t y P r e s s - R e v i e w C o p y R e v i e w C o p y - C a m b r i d g e U n i v e r s i t y P r e s s - R e v i e w C o p y R e v i e w C o p y - C a m b r i d g e U n i v e r s i t y Copyright Material - Review Only - Not for Redistribution
- 376. Unit 4: Shape, space and measures Cambridge IGCSE Mathematics 366 Worked example 17 In ΔDEF, DF = 10cm, EF = 7cm and D̂= 34°. Calculate, to the nearest degree, the possible size of: a angle Ê b angle F̂. D F 10 cm 7 cm 34° E a Angle Ê is opposite a side of length 10cm. This forms one pair. Angle D̂is opposite a side of length 7cm. This forms the second pair. You are trying to find an angle, so choose the version of the sine rule with the value of sine ratios in the numerators: sin sin sin sin 34 n s 34 n s 7 10 10 34 7 ° n s n s = ⇒ = ⇒ = × 10 = × ° E E So, Ê = sin sin . − × ° = ° 1 10 34 7 53 = ° 53 = ° 0 = ° = ° But there is actually a second angle E such that sin sin E = × ° 10 = × 10 = × 34 7 . You can see this if you consider the sine graph. The values of both sin x and cos x repeat every 360°. This property of both functions is called 'periodicity', i.e., both sin x and cos x are periodic. The periodicity of the function tells you that the second possible value of Ê is 180 - 53.0 = 127.0°. Both of these are possible values of Ê because there are two ways to draw such a triangle. D F 10 cm 7 cm 7 cm 34° E2 E1 b Of course, the answers to part (a) must lead to two possible answers for part (b). If Ê = 127.0°, then F̂ = 180 - 127 - 34 = 19° (shown as E1 in the diagram). If Ê = 53.0°, then F̂ = 180 - 53 - 34 = 93° (shown as E2 in the diagram). (If asked for, this would also have led to two possible solutions for the length DE). You absolutely must take care to check that all possible answers have been calculated. Bear this in mind as you work through the following exercise. Exercise 15.10 1 Find the value of x in each of the following equations. a x sin 50 9 38 = sin b x sin 25 20 100 = sin c 20.6 sin 50 70 = x si 0 7 si 0 7 0 7 0 7 d sin x 11 4 63 16 2 . sin . = 2 Find the length of the side marked x in each of the following triangles. 50° 65° x 9 cm x 10 cm 33° 75° 72° 6 cm 35° 25° 120° x 6.2 cm 51° 65° x 10.5 cm x 102° 37° 226 mm x 107° 41° 32° E e s s - R e v i e w C o p y - C a m b r i d g e U n i v e r s i t y P r e s s - R e v i e w C o p y R e v i e w C o p y - C a m b r i d g e U n i v e r s i t y P r e s s - R e v i e w C o p y R e v i e w C o p y - C a m b r i d g e U n i v e r s i t y P r e s s - R e v i e w C o p y R e v i e w C o p y - C a m b r i d g e U n i v e r s i t y Copyright Material - Review Only - Not for Redistribution
- 377. Unit 4: Shape, space and measures 367 15 Scale drawings, bearings and trigonometry 3 Find the size of the angle marked θ in the following triangles. Give your answers correct to 1 decimal place. a 10 cm 65° θ 9 cm b 10 cm 12 cm 50° θ c 6.5 cm 6 cm 60° θ d θ 20° 10 cm 8 cm e 30° θ 3.5 cm 2.2 cm f 9.2 cm 37° θ 11.8 cm 4 In ΔABC, A = 72°, B = 45° and side AB = 20cm. Calculate the size of C and the lengths of the sides AC and BC. A C 20 cm 72° 45° B 5 In ΔDEF, D = 140°, E = 15° and side DF = 6m. Calculate the size of F and the lengths of the sides DE and EF. E D F 6 m 15° 140° 6 In ΔPQR, Q = 120°, side PQ = 8cm and side PR = 13cm. Calculate the size of R , the size of P, and the length of side QR. Give your answers to the nearest whole number. Q P R 120° 8 cm 13 cm 7 In ΔXYZ, X = 40°, side XZ = 12cm and side YZ = 15cm. a Explain why Y must be less than 40°. b Calculate, correct to 1 decimal place, Y and Z. c Calculate the length of the side XY. Y X Z 15 cm 12 cm 40° E e s s - R e v i e w C o p y - C a m b r i d g e U n i v e r s i t y P r e s s - R e v i e w C o p y R e v i e w C o p y - C a m b r i d g e U n i v e r s i t y P r e s s - R e v i e w C o p y R e v i e w C o p y - C a m b r i d g e U n i v e r s i t y P r e s s - R e v i e w C o p y R e v i e w C o p y - C a m b r i d g e U n i v e r s i t y Copyright Material - Review Only - Not for Redistribution
- 378. Unit 4: Shape, space and measures Cambridge IGCSE Mathematics 368 8 ABCD is a parallelogram with AB = 32 mm and AD = 40 mm and angle BAC = 77°. A B C D 32 mm 77° 40 mm a Find the size of angle BCA (to the nearest degree) b Find the size of angle ABC (to the nearest degree) c Find the length of diagonal AC correct to 2 decimal places. Cosine rule For the cosine rule, consider a triangle labelled in exactly the same way as that used for the sine rule. a c b A B C The cosine rule is stated as a single formula: a b c bc A 2 2 a b 2 2 a b 2 c b c b c b c b = + a b = + a b 2 2 = + a b 2 2 = + 2 2 c b c bc A co c A c A c A Notice the all three sides are used in the formula, and just one angle. The side whose square is the subject of the formula is opposite the angle used (hence they have the same letter but in a different case). This form of the cosine rule is used to find unknown sides. By rearranging the labels of angles (but making sure that opposite sides are still given the lower case version of the same letter for any given angle) the cosine rule can be stated in two more possible ways: b a c ac B 2 2 b a 2 2 b a 2 2 c a c a = + b a = + b a 2 2 = + b a 2 2 = + 2 2 c a c ac B co c B c B c B or c a b ab C 2 2 2 b a b a b a b a = + c a = + c a 2 2 = +b a b ab C co b C b C b C Notice, also, that you can take any version of the formula to make the cosine ratio the subject. This version can be used to calculate angles: a b c bc A a bc A b c bc A b c a A b 2 2 a b 2 2 a b 2 c b c b 2 2 a b 2 2 a bc A 2 2 b c 2 2 b c2 2 2 2 2 c b c b a b a b a b 2 2 a b 2 2 2 = + a b = + a b 2 2 = + a b 2 2 = + 2 2 c b c b ⇒ + a b ⇒ + a b a b 2 2 a b ⇒ + a b 2 2 = + b c = + b c 2 2 = + b c 2 2 b c = + 2 2 ⇒ = bc ⇒ = A b ⇒ = A b 2 ⇒ = + − c a + − c a 2 2 + − 2 2 ⇒ = A ⇒ = c A co c A c A c A c A co c A c A c A ⇒ = co ⇒ = ⇒ = ⇒ = ⇒ = co ⇒ = ⇒ = ⇒ = + − + + − + c a + − c a + − bc 2 2 + − 2 2 + − 2 Remember, if you know all three sides of a triangle, you can use the cosine rule to find any angle. If you know two sides, and the unknown side is opposite a known angle, then the cosine rule can be used to calculate the unknown side. Worked example 18 In ΔABC, B = 50°, side AB = 9cm and side BC = 18cm. Calculate the length of AC. 18 cm 9 cm C B A 50° E e s s - R e v i e w C o p y - C a m b r i d g e U n i v e r s i t y P r e s s - R e v i e w C o p y R e v i e w C o p y - C a m b r i d g e U n i v e r s i t y P r e s s - R e v i e w C o p y R e v i e w C o p y - C a m b r i d g e U n i v e r s i t y P r e s s - R e v i e w C o p y R e v i e w C o p y - C a m b r i d g e U n i v e r s i t y Copyright Material - Review Only - Not for Redistribution
- 379. Unit 4: Shape, space and measures 369 15 Scale drawings, bearings and trigonometry Worked example 19 In ΔDEF, F = 120°, side EF = 25m and side FD = 34m. Calculate the length of side DE. 34 m 25 m D F E 120° DE = f, so use the cosine rule in the form, f d e de F e de F e d 2 2 f d 2 2 f d 2 e d e d e d e de F cos e F = + f d = + f d 2 2 = + f d 2 2 = + 2 2 e d e d . f 2 2 2 25 2 2 25 2 2 34 625 1156 = + 2 2 = + 25 = + 2 2 25 2 2 = + 25 ( ) 2 2 ( ) 5 3 ( ) 4 ( ) cos 12 ( ) × × × ( ) 2 2 × × × 2 2 ( ) × × × 5 3 × × × 5 3 ( ) × × × 4 × × × ( ) × × × ° ( ) = + 625 = + ( ) 85 ( ) – – – ( ) – – ( ) ( ) ( ) ( ) ( ) 625 1156 85 2631 2631 512932 0 ( ) notice that ( ) cos 12 ( ) c cos 12 c ( ) cos 12 is negativ ( ) e ( ) 0 ( ) ° ( ) = + 625 = + + = ∴ = = . f ∴ = ∴ = … Length of DE = 51.3m (to 3 s.f.) Worked example 20 Combining the sine and cosine rules In ΔPQR, R = 100°, side PR = 8cm and side RQ = 5cm. a Calculate the length of side PQ. b Calculate, correct to the nearest degree, P and Q. 100° 5 cm 8 cm P Q R a PQ = r, so use the cosine rule in the form, r2 = p2 + q2 - 2pq cos R. r2 2 2 5 8 2 2 5 8 2 2 25 64 = + 2 2 = + 5 8 = + 5 8 2 2 5 8 2 2 = + 5 8 ( ) 2 5 ( ) 8 ( ) cos ( ) 1 ( ) × × ( ) 2 5 × × 2 5 ( ) × × × ° ( ) cos × ° ( ) × ° 1 × ° ( ) × ° = + 25 = + ( ) 13 ( ) 8918 ( ) – – – ( ) – – ( ) ( ) ( ) ( ) 00 ( ) × ° ( ) 00 × ° ( ) ( ) ( ) 1 2 8918 1 2 8918 1 1435 0 1 2 1 2 1 2 1 2 0 ( ) notice that co ( ) s 1 ( ) s s 1 s ( ) s 1 is negativ ( ) e ( ) 00 ( ) ° ( ) = = . . … ∴ … ∴ … 1 2 ∴ … 8918 ∴ … 0 ∴ … 1 2 1 2 ∴ … = ∴ … . ∴ … … r ∴ … ∴ … Length of PQ = 10.1cm (to 3 s.f.) If you need to use a previously calculated value for a new problem, leave unrounded answers in your calculator to avoid introducing rounding errors. Combining the sine and cosine rules The following worked examples show how you can combine the sine and cosine rules to solve problems. Notice that AC = b and you know that B = 50°. Use the cosine rule in the form, b a c ac B 2 2 b a 2 2 b a 2 c a c a 2 c a c a = + b a = + b a 2 2 = + b a 2 2 = + 2 2 c a c ac B cos c B b b 2 2 2 9 1 2 2 9 1 2 2 8 2 2 8 2 81 324 196 7368 = + 2 2 = + 9 1 = + 9 1 2 2 9 1 2 2 = + 9 1 ( ) 8 2 ( ) 8 2 9 1 ( ) 8 ( ) cos ( ) 5 ( ) × × ( ) 9 1 × × 9 1 ( ) × × × ° ( ) cos × ° ( ) × ° 5 × ° ( ) × ° = + 81 = + ( ) 2 8 ( ) 2631 ( ) = = 8 2 8 2 ( ) – . ( ) 2 8 ( ) – . ( ) – . ( ) – . 2 8 ( ) – . ( ) . ( ) ( ) × ° ( ) × ° ( ) 2 8 ( ) 2 8 ( ) ( ) ( ) 2 8 ( ) 2 8 ( ) 2 8 ( ) – . ( ) 2 8 ( ) 2 8 – . ( ) ( ) ( ) … ∴ 196 1 196 1 7368 14 262 . . … … = 0 Length of AC = 14.0cm (to 3 s.f.) 18 cm 9 cm C B A 50° E e s s - R e v i e w C o p y - C a m b r i d g e U n i v e r s i t y P r e s s - R e v i e w C o p y R e v i e w C o p y - C a m b r i d g e U n i v e r s i t y P r e s s - R e v i e w C o p y R e v i e w C o p y - C a m b r i d g e U n i v e r s i t y P r e s s - R e v i e w C o p y R e v i e w C o p y - C a m b r i d g e U n i v e r s i t y Copyright Material - Review Only - Not for Redistribution
- 380. Unit 4: Shape, space and measures Cambridge IGCSE Mathematics 370 Worked example 21 a Change the subject of the formula c a b ab C 2 2 c a 2 2 c a 2 b a b a b a b a = + c a = + c a 2 2 = + c a 2 2 = + 2 2 b a b ab C cos b C to cos C. b Use your answer to part (a) to find the smallest angle in the triangle which has sides of length 7m, 8m and 13m. a c a b ab C 2 2 c a 2 2 c a 2 b a b a b a b a = + c a = + c a 2 2 = + c a 2 2 = + 2 2 b a b ab C cos b C 2 2 2 2 2 2 2 2 ab C a b c 2 2 b c 2 2 C a b 2 2 a b 2 2 c ab cos cos = + 2 2 = + 2 2 C a = + C a b c b c = + − 2 2 + − a b + − a b 2 2 a b 2 2 + − 2 2 a b b The smallest angle in a triangle is opposite the shortest side. In the given triangle, the smallest angle is opposite the 7m side. Let this angle be C. Then c = 7 and take a = 8 and b = 13. Using the result of part (a): cosC = + − × × = + − = 8 1 + − 8 1 + − 3 7 + − 3 7 + − 2 8 × × 2 8 × ×13 64 169 + − 169 + − 49 208 184 208 2 2 + − 2 2 8 1 2 2 8 1 + − 8 1 + − 2 2 8 13 7 2 2 3 7 + − 3 7 + − 2 2 + − 3 72 C = = − cos . 1 184 208 27 7957…° The smallest angle of the triangle = 27.8° (to 1 d.p.) b Now you know the value of r as well as the value of R, you can make use of the sine rule: sin sin sin P n s n s p Q q R r = = = = sin sin sin . P Q n s P Q n sin P Q 5 8 10 1435 = = = = 100° … Using the first and third fractions, sinP = × = 5 100 10 1435 0 4853 sin . . ° … … R is obtuse so P is acute, and P = 29.0409…° P = 29° (to the nearest degree) To find Q you can use the angle sum of a triangle = 180°: Q = 180 - (100 + 29) ∴ Q = 51° (to the nearest degree) E e s s - R e v i e w C o p y - C a m b r i d g e U n i v e r s i t y P r e s s - R e v i e w C o p y R e v i e w C o p y - C a m b r i d g e U n i v e r s i t y P r e s s - R e v i e w C o p y R e v i e w C o p y - C a m b r i d g e U n i v e r s i t y P r e s s - R e v i e w C o p y R e v i e w C o p y - C a m b r i d g e U n i v e r s i t y Copyright Material - Review Only - Not for Redistribution
- 381. Unit 4: Shape, space and measures 371 15 Scale drawings, bearings and trigonometry Exercise 15.11 1 In ΔABC, B = 45°, side AB = 10cm and side BC = 12cm. Calculate the length of side AC. A C B 45° 10 cm 12 cm 2 In ΔDEF, F = 150°, side EF = 9m and side FD = 14m. Calculate the length of side DE. E D F 150° 9 m 14 m 3 In ΔPQR, side PQ = 11cm, side QR = 9cm and side RP = 8cm. Calculate the size of p correct to 1 decimal place. R Q P 9 cm 11 cm 8 cm p 4 In ΔSTU, S = 95°, side ST = 10m and side SU = 15m. a Calculate the length of side TU. b Calculate U. c Calculate T. S U T 10 m 15 m 95° 5 In ΔXYZ, side XY = 15cm, side YZ = 13cm and side ZX = 8cm. Calculate the size of: a X b Y c Z. Z Y X 15 cm 8 cm 13 cm 6 A boat sails in a straight line from Aardvark Island on a bearing of 060°. When the boat has sailed 8km it reaches Beaver Island and then turns to sail on a bearing of 150°. The boat remains on this bearing until it reaches Crow Island, 12km from Beaver Island. On reaching Crow Island the boat’s pilot decides to return directly to Aardvark Island. Calculate: a The length of the return journey. b The bearing on which the pilot must steer his boat to return to Aardvark Island. 7 Jason stands in the corner of a very large field. He walks, on a bearing of 030°, a distance of d metres. Jason then changes direction and walks twice as far on a new bearing of 120°. At the end of the walk Jason calculates both the distance he must walk and the bearing required to return to his original position. Given that the total distance walked is 120 metres, what answers will Jason get if he is correct? Look back at the beginning of this chapter and remind yourself about bearings. REWIND E e s s - R e v i e w C o p y - C a m b r i d g e U n i v e r s i t y P r e s s - R e v i e w C o p y R e v i e w C o p y - C a m b r i d g e U n i v e r s i t y P r e s s - R e v i e w C o p y R e v i e w C o p y - C a m b r i d g e U n i v e r s i t y P r e s s - R e v i e w C o p y R e v i e w C o p y - C a m b r i d g e U n i v e r s i t y Copyright Material - Review Only - Not for Redistribution
- 382. Unit 4: Shape, space and measures Cambridge IGCSE Mathematics 372 15.7 Area of a triangle You already know that the area of a triangle is given by the following formula: perpendicular height base Area base perpendicular height = × = × × 1 2 This method can be used if you know both the length of the base and perpendicular height but if you don’t have these values you need to use another method. You can calculate the area of any triangle by using trigonometry. Look at the triangle ABC shown in the diagram: A C B M c a h A C B b c a The second copy of the triangle is drawn with a perpendicular height that you don’t yet know. But if you draw the right-angled triangle BCM separately, you can use basic trigonometry to find the value of h. C B M a h Now note that opp(C) = h and the hypotenuse = a. Using the sine ratio: sin sin C n s n s h a h a n s h a n s C = ⇒ n s = ⇒ n s n s = ⇒ n s h a n s h a This means that you now know the perpendicular height and can use the base length b to calculate the area: Area base perpendicular height = Area = × = × × × × = 1 2 1 2 1 2 b a × × b a × × C ab C sin sin In fact you could use any side of the triangle as the base and draw the perpendicular height accordingly. This means that the area can also be calculated with: Area = 1 2 ac B sin or Area = 1 2 bc A sin In each case the sides used meet at the angle that has been included. The area of a triangle was first encountered in chapter 7. REWIND E e s s - R e v i e w C o p y - C a m b r i d g e U n i v e r s i t y P r e s s - R e v i e w C o p y R e v i e w C o p y - C a m b r i d g e U n i v e r s i t y P r e s s - R e v i e w C o p y R e v i e w C o p y - C a m b r i d g e U n i v e r s i t y P r e s s - R e v i e w C o p y R e v i e w C o p y - C a m b r i d g e U n i v e r s i t y Copyright Material - Review Only - Not for Redistribution
- 383. Unit 4: Shape, space and measures 373 15 Scale drawings, bearings and trigonometry Worked example 22 Calculate the areas of each of the following shapes. a A C B 8 cm 6 cm 68° b B A C 14 cm 17 cm 58° a Area cm (to 1dp) 2 = = × × × = 1 2 1 2 8 6 × × × 8 6 × × × 68 22 3 ab C sin sin . ° b Area cm (to 1dp) 2 = = × = × × × = 1 2 1 2 = × = ×17 14 × × 14 × × 58 100 9 ac B sin sin . ° Worked example 23 The diagram shows a triangle with area 20cm2 . Calculate the size of angle F. 9.2 cm 8.4 cm F Notice that the area = 1 2 8 4 9 2 20 × × 8 4 × × × = . . 8 4 . . 8 4 9 2 . . 9 2 × × . . 8 4 × × . . 8 4 × × si × = si × = n × = × = F × = × = sin F = × 2 2 × 2 20 8 4 9 2 . . × . . 8 4 . . 8 4 9 2 . . 9 2 So F = × = ° − sin . . × . . . ( = ° . ( ) 1 2 2 × 2 20 8 4 . . 8 4 . . 9 2 . . 9 2 . . 31 = ° 31 = ° 2 t . ( 2 t . ( = ° . ( 2 t = ° . ( o 1dp E e s s - R e v i e w C o p y - C a m b r i d g e U n i v e r s i t y P r e s s - R e v i e w C o p y R e v i e w C o p y - C a m b r i d g e U n i v e r s i t y P r e s s - R e v i e w C o p y R e v i e w C o p y - C a m b r i d g e U n i v e r s i t y P r e s s - R e v i e w C o p y R e v i e w C o p y - C a m b r i d g e U n i v e r s i t y Copyright Material - Review Only - Not for Redistribution
- 384. Unit 4: Shape, space and measures Cambridge IGCSE Mathematics 374 Exercise 15.12 1 Find the area of each triangle. a 5 cm 6 cm C A B 42° b 6.8 m 4.7 m F D E 110° c 15 cm 8 cm J G H 60° d 7 cm 5 cm M K L 80° e 8.4 m 5.5 m R P Q 100° f 7 cm U S T 8 cm 120° 2 Find the area of the parallelogram shown in the diagram. 95° 9 cm 12 cm A D C B 3 The diagram shows the dimensions of a small herb garden. Find the area of the garden. Give your answer correct to two decimal places. 0.8 m 1.1 m 1.2 m 63° 4 Find the area of PQRS. R S P Q 108° 83° 6.4 cm 5.6 cm 8.4 cm 6.0 cm 5 Find the area of each polygon. Give your answers to 1 decimal place. a 25° 40° 6 cm 9.5 cm b 11.2 cm c 0.6 m E e s s - R e v i e w C o p y - C a m b r i d g e U n i v e r s i t y P r e s s - R e v i e w C o p y R e v i e w C o p y - C a m b r i d g e U n i v e r s i t y P r e s s - R e v i e w C o p y R e v i e w C o p y - C a m b r i d g e U n i v e r s i t y P r e s s - R e v i e w C o p y R e v i e w C o p y - C a m b r i d g e U n i v e r s i t y Copyright Material - Review Only - Not for Redistribution
- 385. Unit 4: Shape, space and measures 375 15 Scale drawings, bearings and trigonometry 6 The diagonals of a parallelogram bisect each other at an angle of 42°. If the diagonals are 26 cm and 20 cm long, find: a the area of the parallelogram b the lengths of the sides. 7 25 cm 52 cm 63 cm P R Q The diagrams shows ΔPQR, which has an area of 630cm2 . a Use the formula Area = 1 2 pr Q sin to find Q correct to 1 decimal place. b Find P correct to 1 decimal place. 15.8 Trigonometry in three dimensions The final part of the trigonometry chapter looks at how to use the ratios in three dimensions. With problems of this kind you must draw and label each triangle as you use it. This will help you to organise your thoughts and keep your solution tidy. When you work with solids you may need to calculate the angle between an edge, or a diagonal, and one of the faces. This is called the angle between a line and a plane. Consider a line PQ, which meets a plane ABCD at point P. Through P draw lines PR1 , PR2 , PR3 , … in the plane and consider the angles QPR1 , QPR2 , QPR3 . . . A D Q C B R1 R2 R3 R4 R5 P • If PQ is perpendicular to the plane, all these angles will be right angles. • If PQ is not perpendicular to the plane, these angles will vary in size. It is the smallest of these angles which is called the angle between the line PQ and the plane ABCD. To identify this angle, do the following: • From Q draw a perpendicular to the plane. Call the foot of this perpendicular R. • The angle between the line PQ and the plane is angle QPR. A D Q C B R P PR is called the projection of PQ on the plane ABCD. The following worked example shows how a problem in three dimensions might be tackled. E e s s - R e v i e w C o p y - C a m b r i d g e U n i v e r s i t y P r e s s - R e v i e w C o p y R e v i e w C o p y - C a m b r i d g e U n i v e r s i t y P r e s s - R e v i e w C o p y R e v i e w C o p y - C a m b r i d g e U n i v e r s i t y P r e s s - R e v i e w C o p y R e v i e w C o p y - C a m b r i d g e U n i v e r s i t y Copyright Material - Review Only - Not for Redistribution
- 386. Unit 4: Shape, space and measures Cambridge IGCSE Mathematics 376 Worked example 24 The diagram represents a room which has the shape of a cuboid. AB = 6m, AD = 4m, and AP = 2m. Calculate the angle between the diagonal BS and the floor ABCD. 6 m 4 m 4 m 2 m A B C D P S R Q First identify the angle required. B is the point where the diagonal BS meets the plane ABCD. SD is the perpendicular from S to the plane ABCD and so DB is the projection of SB onto the plane. 6 m 4 m 4 m 2 m A B C D P S R Q The angle required is SBD. You know that ΔSBD has a right angle at D and that SD = 2m (equal to AP). To find angle SBD, you need to know the length of DB or the length of SB. You can find the length of BD by using Pythagoras’ theorem in ΔABD. BD BD 2 2 2 6 4 2 2 6 4 2 2 36 16 52 52 = + 2 2 = + 6 4 = + 6 4 2 2 6 4 2 2 = + 6 4 = + 36 = + = = 6 m 4 m A B D So, using right-angled triangle SBD: tanB B B SD BD = = = = opp(B opp( ) adj(B adj( ) = = = = = 2 52 Angle SBD ˆ tan . n . n . n . = n . n . n . n . n . n . n . n . n . n . n . n . n . n . n . n . n . n . n . n . n . n . n . n . n . n . −1 n . n . 2 52 15 n . 15 n .5013… B D S 52 2 m m The angle between diagonal BS and the floor ABCD = 15.5° (to 1 d.p.) Exercise 15.13 1 The diagram represents a triangular prism. The rectangular base, ABCD, is horizontal. AB = 20cm and BC = 15cm. The cross-section of the prism, BCE, is right-angled at C and angle EBC = 41°. a Calculate the length of AC. b Calculate the length of EC. c Calculate the angle which the line AE makes with the horizontal. B F D A 15 cm 41° C E 20 cm It can be helpful to use colour or shading in diagrams involving 3D situations. E e s s - R e v i e w C o p y - C a m b r i d g e U n i v e r s i t y P r e s s - R e v i e w C o p y R e v i e w C o p y - C a m b r i d g e U n i v e r s i t y P r e s s - R e v i e w C o p y R e v i e w C o p y - C a m b r i d g e U n i v e r s i t y P r e s s - R e v i e w C o p y R e v i e w C o p y - C a m b r i d g e U n i v e r s i t y Copyright Material - Review Only - Not for Redistribution
- 387. Unit 4: Shape, space and measures 377 15 Scale drawings, bearings and trigonometry 2 The cube shown in the diagram has sides of 5m. a Use Pythagoras’ theorem to calculate the distance EG. Leave your answer in exact form. b Use Pythagoras’ theorem to calculate the distance AG. Leave your answer in exact form. c Calculate the angle between the line AG and the plane EFGH. Give your answer to 1 decimal place. B E C A F G H D 5 m 5 m 5 m 3 The diagram shows a tetrahedron ABCD. M is the mid-point of CD. AB = 4m, AC = 3m, AD = 3m. a Calculate angle ACB. b Calculate BC. c Calculate CD. d Calculate the length of BM. e Calculate the angle BCD. 4 A cuboid is 14 cm long, 5 cm wide and 3 cm high. Calculate: a the length of the diagonal on its base b the length of its longest diagonal c the angle between the base and the longest diagonal. 5 ABCD is a tetrahedral drinks carton. Triangle ABC is the base and B is a right angle. D is vertically above A. Calculate the following in terms of the appropriate lettered side(s): a the length of AC b length of DA c the length of DC d the size of angle DAB e the size of angle BDC f the size of angle ADC. E C B A D 3 m 4 m 3 m M e s s - R e v i e w C o p y - C a m b r i d g e U n i v e r s i t y P r e s s - R e v i e w C o p y R e v i e w C o p y - C a m b r i d g e U n i v e r s i t y P r e s s - R e v i e w C o p y R e v i e w C o p y - C a m b r i d g e U n i v e r s i t y P r e s s - R e v i e w C o p y R e v i e w C o p y - C a m b r i d g e U n i v e r s i t y Copyright Material - Review Only - Not for Redistribution
- 388. Unit 4: Shape, space and measures Cambridge IGCSE Mathematics 378 Summary Do you know the following? • A scale drawing is an accurate diagram to represent something that is much bigger, or much smaller. • An angle of elevation is measured upwards from the horizontal. • An angle of depression is measured downwards from the horizontal. • Bearings are measured clockwise from north. • The ratio of any two lengths in a right-angled triangle depends on the angles in the triangle: – sin = opp hyp hy hy A n n ( ) A ( ). – cos = adj ad hyp hy hy A s s ( ) A ( ) . – tan = opp adj ad A n n ( ) A ( ) . • You can use these trigonometric ratios to calculate an unknown angle from two known sides. • You can use these trigonometric ratios to calculate an unknown side from a known side and a known angle. • The sine, cosine and tangent function can be extended beyond the angles in triangles. • The sine, cosine and tangent functions can be used to solve trigonometric equations. • The sine and cosine rules can be used to calculate unknown sides and angles in triangles that are not right-angled. • The sine rule is used for calculating an angle from another angle and two sides, or a side from another side and two known angles. The sides and angles must be arranged in opposite pairs. • The cosine rule is used for calculating an angle from three known sides, or a side from a known angle and two known sides. • You can calculate the area of a non right-angled triangle by using the sine ratio. Are you able to…..? • calculate angles of elevation • calculate angles of depression • use trigonometry to calculate bearings • identify which sides are the opposite, adjacent and hypotenuse • calculate the sine, cosine and tangent ratio when given lengths in a right-angled triangle • use the sine, cosine and tangent ratios to find unknown angles and sides • solve more complex problems by extracting right-angled triangles and combining sine, cosine and tangent ratios • use the sine and cosine rules to find unknown angles and sides in right-angled triangles • use the sine, cosine and tangent functions to solve trigonometric equations, finding all the solutions between 0 and 360° • use sine and cosine rules to find unknown angles and sides in triangles that are not right-angled • use trigonometry in three dimensions • find the area of a triangle that is not right-angled. E E E E e s s - R e v i e w C o p y - C a m b r i d g e U n i v e r s i t y P r e s s - R e v i e w C o p y R e v i e w C o p y - C a m b r i d g e U n i v e r s i t y P r e s s - R e v i e w C o p y R e v i e w C o p y - C a m b r i d g e U n i v e r s i t y P r e s s - R e v i e w C o p y R e v i e w C o p y - C a m b r i d g e U n i v e r s i t y Copyright Material - Review Only - Not for Redistribution
- 389. 379 Unit 4: Shape, space and measures Examination practice Exam-style questions 1 The diagram shows the cross-section of the roof of Mr Haziz’s house. The house is 12m wide, angle CAB = 35° and angle ACB = 90°. Calculate the lengths of the two sides of the roof, AC and BC. 12 m A B C 35° 2 The diagram shows a trapezium ABCD in which angles ABC = BCD = 90°. AB = 90mm, BC = 72mm and CD = 25mm. Calculate the angle DAB. 90 mm 72 mm 25 mm A B C D 3 A girl, whose eyes are 1.5m above the ground, stands 12m away from a tall chimney. She has to raise her eyes 35° upwards from the horizontal to look directly at the top of the chimney. Calculate the height of the chimney. 35° 12 m 1.5 m 4 The diagram shows the cross-section, PQRS, of a cutting made for a road. PS and QR are horizontal. PQ makes an angle of 50° with the horizontal. a Calculate the horizontal distance between P and Q (marked x in the diagram). b Calculate the angle which RS makes with the horizontal (marked y in the diagram). 5 A game warden is standing at a point P alongside a road which runs north–south. There is a marker post at the point X, 60m north of his position. The game warden sees a lion at Q on a bearing of 040° from him and due east of the marker post. 40° 60 m 200 m North P X Q R 72 m 50° y x 12 m 30 m R S P Q e s s - R e v i e w C o p y - C a m b r i d g e U n i v e r s i t y P r e s s - R e v i e w C o p y R e v i e w C o p y - C a m b r i d g e U n i v e r s i t y P r e s s - R e v i e w C o p y R e v i e w C o p y - C a m b r i d g e U n i v e r s i t y P r e s s - R e v i e w C o p y R e v i e w C o p y - C a m b r i d g e U n i v e r s i t y Copyright Material - Review Only - Not for Redistribution
- 390. Unit 4: Shape, space and measures 380 a i Show by calculation that the distance, QX, of the lion from the road is 50.3m, correct to 3 significant figures. ii Calculate the distance, PQ, of the lion from the game warden. b Another lion appears at R, 200m due east of the first one at Q. i Write down the distance XR. ii Calculate the distance, PR, of the second lion from the game warden. iii Calculate the bearing of the second lion from the game warden, correct to the nearest degree. 6 In the ΔOAB, angle AOB = 15°, OA = 3m and OB = 8m. Calculate, correct to 2 decimal places: a the length of AB b the area of ΔOAB. 7 A pyramid, VPQRS, has a square base, PQRS, with sides of length 8cm. Each sloping edge is 9cm long. P Q R S V 8 cm 9 cm a Calculate the perpendicular height of the pyramid. b Calculate the angle the sloping edge VP makes with the base. 8 The diagram shows the graph of y = sin x for 0 x 360. a Write down the co-ordinates of A, the point on the graph where x = 90°. b Find the value of sin270°. c On a copy of the diagram, draw the line y = − 1 2 for 0 x 360. d How many solutions are there for the equation sinx = − 1 2 for 0 x 360? 15° O B A 3 m 8 m 1 0.5 0 –0.5 –1 y y x = ° sin x 30 60 90 120 150 180 210 240 270 300 330 360 A B E e s s - R e v i e w C o p y - C a m b r i d g e U n i v e r s i t y P r e s s - R e v i e w C o p y R e v i e w C o p y - C a m b r i d g e U n i v e r s i t y P r e s s - R e v i e w C o p y R e v i e w C o p y - C a m b r i d g e U n i v e r s i t y P r e s s - R e v i e w C o p y R e v i e w C o p y - C a m b r i d g e U n i v e r s i t y Copyright Material - Review Only - Not for Redistribution
- 391. 381 Unit 4: Shape, space and measures 9 Two ships leave port P at the same time. One ship sails 60km on a bearing of 030° to position A. The other ship sails 100km on a bearing of 110° to position B. a Calculate: i the distance AB ii PÂB iii the bearing of B from A. b Both ships took the same time, t hours, to reach their positions. The speed of the faster ship was 20km/h. Write down: i the value of t ii the speed of the slower ship. North North P B A 30° 80° 100 km 60 km Past paper questions 1 The diagram shows a ladder of length 8 m leaning against a vertical wall. h 8 m 56° NOT TO SCALE Use trigonometry to calculate h. Give your answer correct to 2 significant figures. [3] [Cambridge IGCSE Mathematics 0580 Paper 11 Q19 October/November 2013] 2 8 cm 28° NOT TO SCALE B A C Calculate the length of AB. [2] [Cambridge IGCSE Mathematics 0580 Paper 22 Q4 May/June 2014] E e s s - R e v i e w C o p y - C a m b r i d g e U n i v e r s i t y P r e s s - R e v i e w C o p y R e v i e w C o p y - C a m b r i d g e U n i v e r s i t y P r e s s - R e v i e w C o p y R e v i e w C o p y - C a m b r i d g e U n i v e r s i t y P r e s s - R e v i e w C o p y R e v i e w C o p y - C a m b r i d g e U n i v e r s i t y Copyright Material - Review Only - Not for Redistribution
- 392. Unit 4: Shape, space and measures 382 3 In triangle ABC, AB = 6 cm, BC = 4 cm and angle BCA = 65°. Calculate a angle CAB, [3] b the area of triangle ABC. [3] [Cambridge IGCSE Mathematics 0580 Paper 22 Q21 October/November 2013] 4 The diagram shows a triangular prism. ABCD is a horizontal rectangle with DA = 10cm and AB = 5cm. BCQP is a vertical rectangle and BP = 6cm. Calculate a the length of DP, [3] b the angle between DP and the horizontal rectangle ABCD. [3] [Cambridge IGCSE Mathematics 0580 Paper 23 Q24 October/November 2012] 5 The diagram shows the positions of three towns A, B and C. The scale is 1 cm represents 2 km. North A North C North B Scale: 1cm = 2 km a i Find the distance in kilometres from A to B. [2] ii Town D is 9 km from A on a bearing of 135°. Mark the position of town D on the diagram. [2] iii Measure the bearing of A from C. [1] [Cambridge IGCSE Mathematics 0580 Paper 33 Q10 October/November 2012] E E 6 C A B NOT TO SCALE 110° Triangle ABC is isosceles with AB = AC. Angle BAC = 110° and the area of the triangle is 85 cm2 . Calculate AC. [3] [Cambridge IGCSE Mathematics 0580 Paper 22 Q13 October/November 2014] 4 cm 6 cm 65° A C B NOT TO SCALE 10 cm D A C Q P B NOT TO SCALE 6 cm 5 cm 382 Unit 4: Shape, space and measures e s s - R e v i e w C o p y - C a m b r i d g e U n i v e r s i t y P r e s s - R e v i e w C o p y R e v i e w C o p y - C a m b r i d g e U n i v e r s i t y P r e s s - R e v i e w C o p y R e v i e w C o p y - C a m b r i d g e U n i v e r s i t y P r e s s - R e v i e w C o p y R e v i e w C o p y - C a m b r i d g e U n i v e r s i t y Copyright Material - Review Only - Not for Redistribution
- 393. Unit 4: Data handling 383 Chapter 16: Scatter diagrams and correlation • Correlation • Bivariate data • Scatter diagram • Dependent variable • Positive correlation • Trend • Negative correlation • No correlation • Line of best fit • Extrapolation Key words In this chapter you will learn how to: • draw a scatter diagram for bivariate data • identify whether or not there is a positive or negative correlation between the two variables • decide whether or not a correlation is strong or weak • draw a line of best fit • use a line of best fit to make predictions • decide how reliable your predictions are • recognise the common errors that are often made with scatter diagrams. On a hot day it can be frustrating to go for an ice cream and find that the vendor has run out. Vendors know that there is a good link between the hours of sunshine and the number of ice creams they will need. A knowledge of how good the correlation is will help them ensure they have enough stock to keep everyone happy. The term ‘supply and demand’ may be something that you have already heard about. Manufacturers are more likely to deliver efficient services if they fully understand the connections between the demands of customers and the quantities of goods that must be produced to make the best profit. e s s - R e v i e w C o p y - C a m b r i d g e U n i v e r s i t y P r e s s - R e v i e w C o p y R e v i e w C o p y - C a m b r i d g e U n i v e r s i t y P r e s s - R e v i e w C o p y R e v i e w C o p y - C a m b r i d g e U n i v e r s i t y P r e s s - R e v i e w C o p y R e v i e w C o p y - C a m b r i d g e U n i v e r s i t y Copyright Material - Review Only - Not for Redistribution
- 394. Unit 4: Data handling Cambridge IGCSE Mathematics 384 16.1 Introduction to bivariate data So far you have seen how to summarise data and draw conclusions based on your calculations. In all cases the data has been a collection of single measurements or observations. Now think about the following problem. An ice cream parlour sells its good throughout the year and the manager needs to look into how sales change as the daily temperature rises or falls. He chooses 10 days at random, records the temperature and records the total takings at the tills. The results are shown in the table: Day A B C D E F G H I J Temperature (°C) 4 18 12 32 21 −3 0 10 22 31 Total takings (sales) ($) 123 556 212 657 401 23 45 171 467 659 Notice that two measurements are taken on each day and are recorded as pairs. This type of data is known as bivariate data. You can see this data much more clearly if you plot the values on a scatter diagram. Drawing a scatter diagram To draw a scatter diagram you first must decide which variable is the dependent variable. In other words, which variable depends on the other. In this case it seems sensible that the total takings will depend on the temperature because people are more likely to buy an ice cream if it is hot! You learned how to summarise data and draw conclusions on it in chapters 4 and 12. REWIND RECAP You should already be familiar with the following scatter diagram concepts: Scatter diagrams These graphs are used to compare two quantities (recorded in pairs). The diagram allows you to see whether the two sets of data are related (correlated) or not. Age 1 7 3 2 Height 0.6 1.1 0.8 0.7 Correlation The pattern of points on the scatter diagram shows whether there is a positive or negative correlation or no correlation between the variables. Positive correlation Negative correlation No correlation Points clustered around a ‘line’ sloping up to the right Points clustered around a ‘line’ sloping down to the right. Points are not in a line. 0 0.2 0.4 0.6 0.8 1 1.2 0 1 2 3 4 Age (years) Height (m) 5 6 7 8 (7, 1.1) x y Correlation is used to establish relationships between variables in biology. For example, what is the relationship between the length of a particular bone and the height of a person? LINK e s s - R e v i e w C o p y - C a m b r i d g e U n i v e r s i t y P r e s s - R e v i e w C o p y R e v i e w C o p y - C a m b r i d g e U n i v e r s i t y P r e s s - R e v i e w C o p y R e v i e w C o p y - C a m b r i d g e U n i v e r s i t y P r e s s - R e v i e w C o p y R e v i e w C o p y - C a m b r i d g e U n i v e r s i t y Copyright Material - Review Only - Not for Redistribution
- 395. Unit 4: Data handling 385 16 Scatter diagrams and correlation The scatter diagram will have a pair of axes, as shown below, with the dependent variable represented by the vertical axis. If the data in the table are treated as if they are co-ordinates, then the diagram begins to take shape: Sales ($) Temperature (°C) –10 10 20 30 40 0 200 400 600 100 300 500 700 Scatter diagram showing the relationship between ice cream sales and temperature Notice that there seems to be a relationship between the ice cream sales and the temperature. In fact, the sales rise as the temperature rises. This is called a positive correlation. The trend seems to be that the points roughly run from the bottom left of the diagram to the top right. Had the points been placed from the top left to bottom right you would conclude that the sales decrease as the temperature increases. Under these circumstances you would have a negative correlation. If there is no obvious pattern then you have no correlation. The clearer the pattern, the stronger the correlation. Examples of the ‘strength’ of the correlation: Strong positive Weak positive No correlation Weak negative Strong negative You should always be ready to state whether or not a correlation is positive, negative, strong or weak. Notice on the graph of ice cream sales that one of the results seems to stand outside of the general pattern. Unusually high sales were recorded on one day. This may have been a special event or just an error. Any such points should be noted and investigated. You can also show the general trend by drawing a line of best fit. In the diagram below a line has been drawn so that it passes as close to as many points as possible. e s s - R e v i e w C o p y - C a m b r i d g e U n i v e r s i t y P r e s s - R e v i e w C o p y R e v i e w C o p y - C a m b r i d g e U n i v e r s i t y P r e s s - R e v i e w C o p y R e v i e w C o p y - C a m b r i d g e U n i v e r s i t y P r e s s - R e v i e w C o p y R e v i e w C o p y - C a m b r i d g e U n i v e r s i t y Copyright Material - Review Only - Not for Redistribution
- 396. Unit 4: Data handling Cambridge IGCSE Mathematics 386 Sales ($) Temperature (°C) –10 10 20 30 40 0 200 400 600 100 300 500 700 Scatter diagram showing the relationship between ice cream sales and temperature This is the line of best fit and can be used to make predictions based on the collected data. For example, if you want to try to predict the ice cream sales on a day with an average temperature of 27°, you carry out the following steps: 1 Locate 27° on the temperature axis. 2 Draw a clear line vertically from this point to the line of best fit. 3 Draw a horizontal line to the sales axis from the appropriate point on the line of best fit. 4 Read the sales value from the graph. The diagram now looks like this: Sales ($) Temperature (°C) –10 10 20 30 40 0 200 400 600 100 300 500 700 Scatter diagram showing the relationship between ice cream sales and temperature e s s - R e v i e w C o p y - C a m b r i d g e U n i v e r s i t y P r e s s - R e v i e w C o p y R e v i e w C o p y - C a m b r i d g e U n i v e r s i t y P r e s s - R e v i e w C o p y R e v i e w C o p y - C a m b r i d g e U n i v e r s i t y P r e s s - R e v i e w C o p y R e v i e w C o p y - C a m b r i d g e U n i v e r s i t y Copyright Material - Review Only - Not for Redistribution
- 397. Unit 4: Data handling 387 16 Scatter diagrams and correlation Here, the estimated value is approximately $575. Worked example 1 Mr. Leatherfoot claims that a person’s height, in cm, can give a very good idea of the length of their foot. To investigate this claim, Mr. Leatherfoot collects the heights and foot lengths of 10 people and records the results in the table below: Person A B C D E F G H I J Foot length (cm) 28.2 31.1 22.5 28.6 25.4 13.2 29.9 33.4 22.5 19.4 Height (cm) 156.2 182.4 165.3 155.1 165.2 122.9 176.3 183.4 163.0 143.1 a Draw a scatter diagram, with Height on the horizontal axis and Foot length on the vertical axis. b State what type of correlation the diagram shows. c Draw a line of best fit. d Estimate the foot length of a person with height 164cm. e Estimate the height of a person with foot length 17cm. f Comment on the likely accuracy of your estimates in parts (d) and (e). a Foot length (cm) Height (cm) 120 140 160 180 200 0 10 20 30 5 15 25 35 Scatter diagram showing the relationship between heights and foot lengths of people (e) (e) (d) (d) b This is a strong positive correlation because foot length generally increases with height. c The line of best fit is drawn on the diagram. d The appropriate lines are drawn on the diagram. A height of 164cm corresponds to a foot length of approximately 26cm. e A foot length of 17cm corresponds to a height of approximately 132cm. f Most points are reasonably close to the line, so the correlation is fairly strong. This means that the line of best fit will allow a good level of accuracy when estimates are made. When commenting on correlation, always make sure that you refer back to the original context of the question. e s s - R e v i e w C o p y - C a m b r i d g e U n i v e r s i t y P r e s s - R e v i e w C o p y R e v i e w C o p y - C a m b r i d g e U n i v e r s i t y P r e s s - R e v i e w C o p y R e v i e w C o p y - C a m b r i d g e U n i v e r s i t y P r e s s - R e v i e w C o p y R e v i e w C o p y - C a m b r i d g e U n i v e r s i t y Copyright Material - Review Only - Not for Redistribution
- 398. Unit 4: Data handling Cambridge IGCSE Mathematics 388 Golden rule Before you try to draw and interpret some scatter diagrams for yourself you should be aware of an important rule: • never use a diagram to make predictions outside of the range of the collected data. For example, in the foot length/height diagram above, the data does not include any heights above 183.4cm. The trend may not continue or may change ‘shape’ for greater heights, so you should not try to predict the foot length for a person of height, say, 195cm without collecting more data. The process of extending the line of best fit beyond the collected data is called extrapolation. Prediction when correlation is weak If you are asked to comment on a prediction that you have made, always keep in mind the strength of the correlation as shown in the diagram. If the correlation is weak you should say that your prediction may not be very reliable. Stating answers in context It is good to relate all conclusions back to the original problem. Don’t just say ‘strong positive correlation’. Instead you might say that ‘it is possible to make good predictions of height from foot length’ or ‘good estimates of ice cream sales can be made from this data’. Exercise16.1 Applying your skills 1 What is the correlation shown by each of the following scatter diagrams? In each case you should comment on the strength of correlation. a 0 50 100 150 100 200 50 150 250 y x b 50 100 150 0 200 400 100 300 500 y x c 0 50 100 150 40 80 20 60 100 y x d 0 50 100 150 100 200 50 150 250 y x e s s - R e v i e w C o p y - C a m b r i d g e U n i v e r s i t y P r e s s - R e v i e w C o p y R e v i e w C o p y - C a m b r i d g e U n i v e r s i t y P r e s s - R e v i e w C o p y R e v i e w C o p y - C a m b r i d g e U n i v e r s i t y P r e s s - R e v i e w C o p y R e v i e w C o p y - C a m b r i d g e U n i v e r s i t y Copyright Material - Review Only - Not for Redistribution
- 399. Unit 4: Data handling 389 16 Scatter diagrams and correlation 2 The widths and lengths of the leaves (both measured in cm) on a particular tree are recorded in the table below. Width (cm) 14 25 67 56 26 78 33 35 14 36 13 36 25 62 25 Length (cm) 22 63 170 141 76 201 93 91 24 91 23 67 51 151 79 a Draw a scatter diagram for this data with the lengths of the leaves shown on the vertical axis. b Comment on the strength of correlation. c Draw a line of best fit for this data. d Estimate the length of a leaf that has width 20cm. 3 Emma is conducting a survey into the masses of dogs and the duration of their morning walk in minutes. She presents the results in the table below. Duration of walk (min) 23 45 12 5 18 67 64 15 28 39 Mass (kg) 22 5 12 32 13 24 6 38 21 12 a Draw a scatter diagram to show the mass of each dog against the duration of the morning walk in minutes. (Plot the mass of the dog on the vertical axis.) b How strong is the correlation between the masses of the dogs and the duration of their morning walks? c Can you think of a reason for this conclusion? 4 Mr. Bobby is investigating the relationship between the number of sales assistants working in a department store and the length of time (in seconds) he spends waiting in a queue to be served. His results are shown in the table below. Number of sales assistants 12 14 23 28 14 11 17 21 33 21 22 13 7 Waiting time (seconds) 183 179 154 150 224 236 221 198 28 87 77 244 266 a Draw a scatter diagram to show the length of time Mr. Bobby spends queuing and the number of sales assistants working in the store. b Describe the correlation between the number of sales assistants and the time spent queuing. c Draw a line of best fit for this data. d Mr. Bobby visits a very large department store and counts 45 sales assistants. What happens when Mr Bobby tries to extend and use his scatter diagram to predict his queuing time at this store? e s s - R e v i e w C o p y - C a m b r i d g e U n i v e r s i t y P r e s s - R e v i e w C o p y R e v i e w C o p y - C a m b r i d g e U n i v e r s i t y P r e s s - R e v i e w C o p y R e v i e w C o p y - C a m b r i d g e U n i v e r s i t y P r e s s - R e v i e w C o p y R e v i e w C o p y - C a m b r i d g e U n i v e r s i t y Copyright Material - Review Only - Not for Redistribution
- 400. Unit 4: Data handling Cambridge IGCSE Mathematics 390 5 Eyal is investigating the relationship between the amount of time spent watching television during a week and the score on a maths test taken a week later. The results for 12 students are shown on the scatter diagram below. Maths score (%) Time spent watching TV (minutes) 50 100 150 200 250 0 40 80 100 20 60 Scatter diagram showing the relationship between time watching TV and maths score The table shows some of Eyal’s results, but it is incomplete. TV watching (min) 34 215 54 78 224 236 121 74 63 Maths score (%) 64 30 83 76 78 41 55 91 83 27 a Copy the table and use the scatter diagram to fill in the missing values. b Comment on the correlation between the length of time spent watching television and the maths score. c Copy the diagram and draw a line of best fit. d Aneesh scores 67% on the maths test. Estimate the amount of time that Aneesh spent watching television. e Comment on the likely accuracy of your estimate in part (d). Summary Do you know the following? • You can use a scatter diagram to assess the strength of any relationship between two variables. • If one of the variables generally increases as the other variable increases, then you say that there is a positive correlation. • If one of the variables generally decreases as the other variable increases, then you say that there is a negative correlation. • The clearer the relationship, the stronger the correlation. • You can draw a line of best fit if the points seem to lie close to a straight line. • The line of best fit can be used to predict values of one variable from values of the other. • You should only make predictions using a line of best fit that has been drawn within the range of the data. Are you able to…..? • draw a scatter diagram • describe the relationship between the variables shown • use a scatter diagram to make predictions. e s s - R e v i e w C o p y - C a m b r i d g e U n i v e r s i t y P r e s s - R e v i e w C o p y R e v i e w C o p y - C a m b r i d g e U n i v e r s i t y P r e s s - R e v i e w C o p y R e v i e w C o p y - C a m b r i d g e U n i v e r s i t y P r e s s - R e v i e w C o p y R e v i e w C o p y - C a m b r i d g e U n i v e r s i t y Copyright Material - Review Only - Not for Redistribution
- 401. 391 Unit 4: Data handling Examination practice Exam-style questions 1 The table below shows the sizes (in square metres) and prices (in UK pounds) of several paintings on display in a gallery. Painting A B C D E F G H Painting area (m2 ) 1.4 2.3 0.8 0.1 0.7 2.2 3.4 2.6 Price ($) 2400 6565 1800 45 8670 4560 10150 8950 Painting I J K L M N O Painting area (m2 ) 1.1 1.3 3.7 1.5 0.4 1.9 0.6 Price ($) 3025 4560 11230 4050 1450 5420 1475 a Draw a scatter diagram for this data. The price should be represented by the vertical axis. b Which painting is unusually expensive? Explain your answer clearly. c Assuming that the unusually expensive painting is not to be included draw a line of best fit for this data. d A new painting is introduced to the collection. The painting measures 1.5m by 1.5m. Use your graph to estimate the price of the painting. e Another painting is introduced to the collection. The painting measures 2.1m by 2.1m. Explain why you should not try to use your scatter diagram to estimate the price of this painting. 2 A particular type of printing machine has been sold with a strong recommendation that regular maintenance takes place even when the machine appears to be working properly. Several companies are asked to provide the machine manufacturer with two pieces of information: (x) the number of hours spent maintaining the machine in the first year and (y) the number of minutes required for repair in the second year. The results are shown in the table below. Maintenance hours (x) 42 71 22 2 60 66 102 Repairs in second year (y) (minutes) 4040 2370 4280 4980 4000 3170 940 Maintenance hours (x) 78 33 39 111 45 12 Repairs in second year (y) (minutes) 1420 3790 3270 500 3380 4420 a Draw a scatter diagram to show this information. You should plot the second year repair times on the vertical axis. b Describe the correlation between maintenance time in the first year and repair time needed in the second year. c Draw a line of best fit on your scatter diagram. d Another company schedules 90 hours of maintenance for the first year of using their machine. Use your graph to estimate the repair time necessary in the second year. e Another company claims that they will schedule 160 hours of maintenance for the first year. Describe what happens when you try to predict the repair time for the second year of machine use. f You are asked by a manager to work out the maintenance time that will reduce the repair time to zero. Use your graph to suggest such a maintenance level and comment on the reliability of your answer. e s s - R e v i e w C o p y - C a m b r i d g e U n i v e r s i t y P r e s s - R e v i e w C o p y R e v i e w C o p y - C a m b r i d g e U n i v e r s i t y P r e s s - R e v i e w C o p y R e v i e w C o p y - C a m b r i d g e U n i v e r s i t y P r e s s - R e v i e w C o p y R e v i e w C o p y - C a m b r i d g e U n i v e r s i t y Copyright Material - Review Only - Not for Redistribution
- 402. 392 Unit 4: Data handling Past paper questions 1 On the first day of each month, a café owner records the midday temperature (°C) and the number of hot meals sold. Month J F M A M J J A S O N D Temperature (°C) 2 4 9 15 21 24 28 27 23 18 10 5 Number of hot meals 38 35 36 24 15 10 4 5 12 20 18 32 a Complete the scatter diagram. The results for January to June have been plotted for you. 0 5 10 15 20 Number of hot meals Temperature (°C) 25 30 35 40 5 10 15 20 25 30 [2] b On the grid, draw the line of best fit. [1] c What type of correlation does this scatter diagram show? [1] [Cambridge IGCSE Mathematics 0580 Paper 13 Q18 May/June 2013] e s s - R e v i e w C o p y - C a m b r i d g e U n i v e r s i t y P r e s s - R e v i e w C o p y R e v i e w C o p y - C a m b r i d g e U n i v e r s i t y P r e s s - R e v i e w C o p y R e v i e w C o p y - C a m b r i d g e U n i v e r s i t y P r e s s - R e v i e w C o p y R e v i e w C o p y - C a m b r i d g e U n i v e r s i t y Copyright Material - Review Only - Not for Redistribution
- 403. 393 Unit 4: Data handling 2 The scatter diagram shows the results of height plotted against shoe size for 8 people. 136 128 120 144 152 160 168 176 184 192 200 Height (cm) Shoe size 26 28 30 32 34 36 38 40 42 44 a Four more results are recorded. Shoe size 28 31 38 43 Height (cm) 132 156 168 198 Plot these 4 results on the scatter diagram. [2] b Draw a line of best fit on the scatter diagram. [1] c What type of correlation is shown by the scatter diagram? [1] [Cambridge IGCSE Mathematics 0580 Paper 12 Q17 October/November 2014] e s s - R e v i e w C o p y - C a m b r i d g e U n i v e r s i t y P r e s s - R e v i e w C o p y R e v i e w C o p y - C a m b r i d g e U n i v e r s i t y P r e s s - R e v i e w C o p y R e v i e w C o p y - C a m b r i d g e U n i v e r s i t y P r e s s - R e v i e w C o p y R e v i e w C o p y - C a m b r i d g e U n i v e r s i t y Copyright Material - Review Only - Not for Redistribution
- 404. Unit 5: Number 394 Knowing how to work well with money is an important skill that you will use again and again throughout your life. In this chapter you will learn how to: • calculate earnings (wages and salaries) in different situations • use and manipulate a formula to calculate simple interest payable and due on a range of loans and investments • solve problems related to simple and compound interest • apply what you already know about percentages to work out discounts, profit and loss in everyday contexts • use a calculator effectively to perform financial calculations • read and interpret financial data provided in tables and charts. During your life so far, you will have solved problems relating to money on a daily basis. You will continue to do this as you get older but the problems you have to solve may become more complicated as you start earning and spending money, borrowing money and saving money. In this chapter you will apply some of the maths skills you have already learned to solve real world problems. You will use your calculator to find the answers quickly and efficiently. • Earnings • Wages • Salary • Commission • Gross income • Deductions • Net income • Tax threshold • Interest • Simple interest • Interest rate • Principal • Compound interest • Cost price • Selling price • Profit • Loss • Discount Key words Chapter 17: Managing money e s s - R e v i e w C o p y - C a m b r i d g e U n i v e r s i t y P r e s s - R e v i e w C o p y R e v i e w C o p y - C a m b r i d g e U n i v e r s i t y P r e s s - R e v i e w C o p y R e v i e w C o p y - C a m b r i d g e U n i v e r s i t y P r e s s - R e v i e w C o p y R e v i e w C o p y - C a m b r i d g e U n i v e r s i t y Copyright Material - Review Only - Not for Redistribution
- 405. 395 Unit 5: Number 17 Managing money 17.1 Earning money When you are employed you earn money (get paid) for the work you do. Earnings can be worked out in different ways. Make sure you understand these terms: • Wages – pay based on a fixed number of hours worked, usually paid weekly. Extra hours of work are called overtime and these are paid at a higher rate. • Salary – pay based on a fixed yearly amount, usually paid monthly. Overtime may be paid, or workers may be given time off in exchange. • Piece work – pay based on the number of items produced. • Commission – pay is based on a percentage of sales made; sometimes a low wage, called a retainer, is paid as well as commission. RECAP You should already be familiar with the following number and formula work: Fractions and percentages (Chapter 5) You can convert percentages to equivalent fractions or decimals. 65% = 0.65 = 65 100 13 20 = You can increase or decrease quantities by a percentage. To increase $40 by 5% multiply by 100% + 5% = 105% 105 100 × $40 = $42 To decrease $45 by 10%, multiply by 100% − 10% = 90% 90 100 × $45 = $40.50 Formulae (Chapter 6) You can use a formula to calculate a value. For example, simple interest I = Prt Pr Pr 100 where P = amount invested r = rate of interest (percentage) t = time period If, P = $75, r = 3% and t = 5 years I = = = = (75 3 5) 100 $11.25 × × 5 3 × × 5 3 You can use inverse operations to change the subject of a formula. P = 100I rt r = 100I Pt t = 100I Pr e s s - R e v i e w C o p y - C a m b r i d g e U n i v e r s i t y P r e s s - R e v i e w C o p y R e v i e w C o p y - C a m b r i d g e U n i v e r s i t y P r e s s - R e v i e w C o p y R e v i e w C o p y - C a m b r i d g e U n i v e r s i t y P r e s s - R e v i e w C o p y R e v i e w C o p y - C a m b r i d g e U n i v e r s i t y Copyright Material - Review Only - Not for Redistribution
- 406. Cambridge IGCSE Mathematics 396 Unit 5: Number Worked example 2 Sanjay works as a sales representative for a company that sells mobile phones in the United Arab Emirates. He is paid a retainer of 800 dirhams (Dhs) per week plus a commission of 4.5% of all sales. a How much would he earn in a week if he made no sales? b How much would he earn if he sold four phones at Dhs3299 each in a week? a Dhs800 If he made no sales, he would earn no commission, only his retainer. b Commission of = × of = × ( = × = × ) = × = 4 5 = × 4 5 = × 3299 = × 3299 = × 4 0 = × = × 045 = × 045 = ×13 196 593 82 . % = × . % = × 4 5 . % 4 5 = × 4 5 = × . % = × 4 5 . = × = × . Earnings retainer commission Dhs Dhs Dhs = + s r = + s retainer = + = + Dhs = + = 800 = + 800 = + 593 82 1393 82 . . Calculate 4.5% of the total sales Sanjay made. Add this to the retainer of Dhs 800. The decimal equivalents of percentage were covered in chapter 5. REWIND Worked example 1 Emmanuel makes beaded necklaces for a curio stand. He is paid in South African rand at a rate of R14.50 per completed necklace. He is able to supply 55 necklaces per week. Calculate his weekly income. Income R = × = 55 = × 55 = ×14 50 797 50 . . Multiply items produced by the rate paid. Worked example 3 Josh’s hourly rate of pay is $12.50. He is paid ‘time-and-a-half’ for work after hours and on Saturdays and ‘double-time’ for Sundays and Public Holidays. One week he worked 5.5 hours on Saturday and 3 hours on Sunday. How much overtime pay would he earn? Saturday overtime = × × = 1 5 = × 1 5 = × 12 50 5 5 103 13 . . 12 . . . . = × . . 1 5 . . 1 5 = × 1 5 = × . . = × 1 5 5 5 5 5 . $ . . . . $ (time-and-a-half = 1.5 × normal time) Sunday overtime = × = 2 1 = × 2 1 = × 2 50 3 × 0 3 75 $ 2 1 2 1 $ 2 5 2 5 (double-time = 2 × normal time) Total overtime 1 178 13 e 1 = + e 1 = $ $ e 1 $ $ e 1 3 1 $ $ $ $ e 1 $ $ e 1 = + $ $ e 1 = + $ $ e 1 = + $ 0 0 3 7 0 0 5 0 0 $ $ 0 0 $ $ 3 1 $ $ 0 0 $ $ 3 7 $ $ 3 7 0 0 $ $ $ $ 0 0 $ $ 3 1 $ $ 0 0 $ $ 3 7 $ $ 3 7 0 0 $ $ = + $ $ 0 0 = + $ $ 3 1 = + $ $ = + 0 0 = + 3 1 $ $ = + 3 7 = + 3 7 $ $ = + 0 0 = + 3 7 $ $ = + 0 0 0 . . 0 0 3 7 0 0 . . 0 0 5 0 0 . . 0 0 $ $ 0 0 . . 0 0 3 1 $ $ 0 0 $ $ . . 3 1 $ $ 3 1 0 0 $ $ 3 7 $ $ 3 7 0 0 $ $ . . $ $ 3 7 0 0 $ $ = + $ $ 0 0 $ $ . . $ $ = + 0 0 $ $ 3 1 = + $ $ = + 0 0 = + 3 1 $ $ = + . . 3 1 = + $ $ = + 0 0 = + $ $ = + 3 7 = + 3 7 $ $ = + 0 0 = + 3 7 $ $ = + . . = + $ $ = + 0 0 = + $ $ = + . e s s - R e v i e w C o p y - C a m b r i d g e U n i v e r s i t y P r e s s - R e v i e w C o p y R e v i e w C o p y - C a m b r i d g e U n i v e r s i t y P r e s s - R e v i e w C o p y R e v i e w C o p y - C a m b r i d g e U n i v e r s i t y P r e s s - R e v i e w C o p y R e v i e w C o p y - C a m b r i d g e U n i v e r s i t y Copyright Material - Review Only - Not for Redistribution
- 407. 397 Unit 5: Number 17 Managing money Exercise 17.1 Applying your skills 1 A waiter earns $8.25 per hour. How much would she earn for a six-hour shift? 2 How much would a receptionist earn for working a 35-hour week if her rate of pay is $9.50 per hour? 3 Calculate the hourly rate for each of the following: a $67.50 for five hours b $245.10 for a 38-hour week c $126.23 for 13.5 hours d $394.88 for five 6 1 2-hour shifts e $71.82 for working five hours and 15 minutes. 4 A truck driver is paid $15.45 per tonne of wood pulp delivered to a factory in Malaysia. If he delivers 135 tonnes to the factory, how much will he earn? 5 A team of workers in a factory is paid $23.25 per pallet of goods produced. If a team of five workers produces 102 pallets in a shift, how much will each person in the team have earned that shift? 6 An estate agent is paid a retainer of $150 per week plus a commission on sales. The rate of commission is 2.5% on sales up to $150000 and 1.75% on amounts above that. How much would she earn in a week if she sold a house for $220000 and an apartment for $125000? 7 Here is the time sheet for five workers in a factory. Calculate each person’s income for the week if their standard rate of pay is $8.40 per hour. Worker Normal hours worked Hours overtime at time-and-a-half Hours overtime at double-time Annie 35 2 0 Bonnie 25 3 4 Connie 30 1.5 1.75 Donny 40 0 4 Elizabeth 20 3.75 2 8 The media in South Africa published a list of the annual earnings in Rands (R) of ten prominent CEOs in 2016. Here is the list: Name Annual salary (R million) Bernard Fornas 87.9 Hendrik du Toit 86.1 Richard Lepeu 85.1 Mark Cutifani 66.9 David Hathorn 66.8 Nicandro Durante 59.5 David Constable 51.9 Glyn Lewis 51.5 Whitey Basson 49.9 Alan Clark 49.7 Look for a connection between these questions and percentage increases in chapter 5. REWIND e s s - R e v i e w C o p y - C a m b r i d g e U n i v e r s i t y P r e s s - R e v i e w C o p y R e v i e w C o p y - C a m b r i d g e U n i v e r s i t y P r e s s - R e v i e w C o p y R e v i e w C o p y - C a m b r i d g e U n i v e r s i t y P r e s s - R e v i e w C o p y R e v i e w C o p y - C a m b r i d g e U n i v e r s i t y Copyright Material - Review Only - Not for Redistribution
- 408. Cambridge IGCSE Mathematics 398 Unit 5: Number a Calculate each person’s earnings per month. b Assuming a tax rate of 35%, work out how much tax each person would pay on these earnings. c How much would they earn per month after tax is deducted? d If the average working week is 40 hours long and each person took three weeks leave during the year, what did the highest and lowest earning person earn on average per working hour (before tax)? Deductions from earnings Gross income (earnings) refers to the total amount a person earns. Deductions, such as income tax, pension contributions, unemployment and health insurance and union dues are often taken from the gross earnings before the person is paid. The amount that is left over after deductions is called the net income. Net income = Gross income − deductions Exercise 17.2 1 For each person shown in the table: a calculate their net income b calculate what percentage their net income is of their gross income. Give your answers to the nearest whole percent. Employee Gross weekly earnings ($) Tax ($) Other deductions ($) B Willis 675.90 235.45 123.45 M Freeman 456.50 245.20 52.41 J Malkovich 1289.00 527.45 204.35 H Mirren 908.45 402.12 123.20 M Parker 853.30 399.10 90.56 2 Use the gross weekly earnings to work out: a the mean weekly earnings b the median weekly earnings c the range of earnings. Applying your skills 3 Study the following two pay advice slips. For each worker, calculate: a the difference between gross and net income b the percentage of gross income that each takes home as net income. Gross earnings, deductions and net income are normally shown on a payment advice (slip) which is given to each worker when they get paid. Look for a connection between these questions and percentage increases in chapter 5. REWIND e s s - R e v i e w C o p y - C a m b r i d g e U n i v e r s i t y P r e s s - R e v i e w C o p y R e v i e w C o p y - C a m b r i d g e U n i v e r s i t y P r e s s - R e v i e w C o p y R e v i e w C o p y - C a m b r i d g e U n i v e r s i t y P r e s s - R e v i e w C o p y R e v i e w C o p y - C a m b r i d g e U n i v e r s i t y Copyright Material - Review Only - Not for Redistribution
- 409. 399 Unit 5: Number 17 Managing money Poovan’s Plastics Pty Ltd PAYMENT ADVICE EMPLOYEE DETAILS SEPTEMBER M Badru Employee no: MBN 0987 Income tax no. 0987654321A Bank details Big Bucks Bank Account no. 9876598 EARNINGS DEDUCTIONS Details Taxable Amount Payable Amount Description Amount Salary Medical Car allowance 12876.98 650.50 1234.99 12876.98 0.00 0.00 Unemployment Insurance Fund (UIF) First aid course fees Group life insurance Union membership PAYE 89.35 9.65 132.90 32.00 3690.62 14762.47 12876.98 3954.52 NET PAY: 8922.46 Nehru–Kapoor Network Services Employee name: B Singh Job title: Clerk ID number: 630907000000 Hours/Days Normal hours 84.00 O/time @ 1.5 hours 11.00 Earnings Wages 1402.80 Overtime @ 1.5 275.55 Deductions Income tax 118.22 UIF 18.94 Pension fund 105.21 Loan 474.00 Sickpay 8.42 Deduct tools × 2 Deduct cellphone × 2 Year-to-date Taxable 22881.40 Benefits 0.00 Tax paid 509.30 Current period Company Contributions 358.12 TOTAL EARNINGS 1678.35 TOTAL DEDUCTIONS 724.79 NET PAY 953.56 e s s - R e v i e w C o p y - C a m b r i d g e U n i v e r s i t y P r e s s - R e v i e w C o p y R e v i e w C o p y - C a m b r i d g e U n i v e r s i t y P r e s s - R e v i e w C o p y R e v i e w C o p y - C a m b r i d g e U n i v e r s i t y P r e s s - R e v i e w C o p y R e v i e w C o p y - C a m b r i d g e U n i v e r s i t y Copyright Material - Review Only - Not for Redistribution
- 410. Cambridge IGCSE Mathematics 400 Unit 5: Number Getting information from tax tables In most countries, employers have to take taxes from earnings and pay them over to the government’s tax authority. The tax authority publishes a table of tax rates every year so that employers can work out how much tax to deduct. Here is a portion of a tax table: TAXABLE INCOME (in $) RATES OF TAX 0 – 132000 132001 – 210000 210001 – 290000 290001 – 410000 410001 – 525000 525001 and above 18% of each $1 $23760 + 25% of the amount above $132000 $43260 + 30% of the amount above $210000 $67260 + 35% of the amount above $290000 $109260 + 38% of the amount above $410000 $152960 + 40% of the amount above $525000 Worked example 4 Mr Smith’s taxable income is $153772.00 p.a. How much tax must he pay a per year? b per month? a To work out the yearly tax, find his tax bracket on the table. His income is in row two because it is between $132001 and $210000. He has to pay $23760 + 25% of his earnings above $132000. $153772 – $132000 = $21772 25% of $21772 = $5443 Tax payable = $23760 + $5443 = $29203 per year b $29203 ÷ 12 = $2433.58 To find the monthly tax, divide the total from part (a) by 12. Exercise 17.3 Applying your skills 1 Use the tax table above to work out the annual tax payable and the monthly tax deductions for each of the following taxable incomes. a $98000 b $120000 c $129000 d $135000 e $178000 2 Use the tax table below to answer the questions that follow. Single person (no dependants) Taxable income Income tax payable $0–$8375 10% of the amount over $0 $8375–$34 000 $837.50 plus 15% of the amount over $8375 $34 000–$82 400 $4681.25 plus 25% of the amount over $34 000 $82 400–$171 850 $16 781.25 plus 28% of the amount over $82 400 $171 850–$373 650 $41 827.25 plus 33% of the amount over $171 850 $373 650+ $108 421.25 plus 35% of the amount over $373 650 If you earn less than a certain amount each year you don’t have to pay income tax. This amount is called the tax threshold. In some Islamic countries, tax is not deducted from earnings. Instead people pay a portion of their earnings as a religious obligation (Zakat). e s s - R e v i e w C o p y - C a m b r i d g e U n i v e r s i t y P r e s s - R e v i e w C o p y R e v i e w C o p y - C a m b r i d g e U n i v e r s i t y P r e s s - R e v i e w C o p y R e v i e w C o p y - C a m b r i d g e U n i v e r s i t y P r e s s - R e v i e w C o p y R e v i e w C o p y - C a m b r i d g e U n i v e r s i t y Copyright Material - Review Only - Not for Redistribution
- 411. 401 Unit 5: Number 17 Managing money a Li-Gon has a taxable income of $40 000 for this tax year. He tells his friends that he is in the 25% tax bracket. i Is this correct? ii Does it mean that he pays $10 000 in income tax? Explain why or why not. iii When Li-Gon checks his tax return, he finds that he only has to pay $6181.25 income tax. Show how this amount is calculated by the revenue services. b How much tax would a person earning $250 000 pay in this tax year? c Cecelia earned $30 000 in taxable income in this year. Her employer deducts $320.25 income tax per month from her salary. i Will Cecelia have to pay in additional tax at the end of the tax year or will she be due for a tax refund as a result of overpaying? ii How much is the amount due in (i) above? 3 Income tax is one form of direct taxation. Carry out some research of your own to find out about each type of tax below, who pays this tax, how it is paid, and the rate/s at which it is charged. a Value-Added-Tax b General sales tax c Customs and Excise duties d Capital Gains Tax e Estate duties 17.2 Borrowing and investing money When you borrow money or you buy things on credit, you are normally charged interest for the use of the money. Similarly, when you save or invest money, you are paid interest by the bank or financial institution in return for allowing them to keep and use your money. Simple interest Simple interest is a fixed percentage of the original amount borrowed or invested. In other words, if you borrow $100 at an interest rate of 5% per year, you will be charged $5 interest for every year of the loan. Simple interest involves adding the interest amount to the original amount at regular intervals. The formula used to calculate simple interest is: I PRT = 100 , where: P = the principal, which is the original amount borrowed or saved R = the interest rate T = the time (in years) Worked example 5 $500 is invested at 10% per annum simple interest. How much interest is earned in three years? 10 10 100 50 % of $ $ 500 $ $ 10 $ $ 100 $ $ 500 $ $ $ $ = × $ $ $ $ = × $ $ $ $ The interest rate is 10% per annum. The interest every year is $50. So after three years, the interest is: 3 × $50 = $150 Multiply by the number of years. Per annum means each year or annually. It is often abbreviated to p.a. In Islam, interest (riba) is forbidden so Islamic banks do not charge interest on loans or pay interest on investments. Instead, Islamic banks charge a fee for services which is fixed at the beginning of the transaction (murabaha). For investments, the bank and its clients share any profits or losses incurred over a given period in proportion to their investment (musharaka). Many banks in Islamic countries have the responsibility of collecting Zakat on behalf of the government. Zakat is a religious tax which all Muslims are obliged to pay. It is usually calculated at about 2.5% of personal wealth. Business studies students will need to understand how the quantity of money in an account changes through the application of interest. LINK e s s - R e v i e w C o p y - C a m b r i d g e U n i v e r s i t y P r e s s - R e v i e w C o p y R e v i e w C o p y - C a m b r i d g e U n i v e r s i t y P r e s s - R e v i e w C o p y R e v i e w C o p y - C a m b r i d g e U n i v e r s i t y P r e s s - R e v i e w C o p y R e v i e w C o p y - C a m b r i d g e U n i v e r s i t y Copyright Material - Review Only - Not for Redistribution
- 412. Cambridge IGCSE Mathematics 402 Unit 5: Number Worked example 6 Sam invested $400 at 15% per annum for three years. How much money did he have at the end of the period? At the end of the period he would have P + I (the principal plus the interest paid). I PRT = 100 and P = 400, so: P+I = + = + = 400 = + 400 = + 100 400 = + 400 = +180 580 ( ) × × ( ) 400 ( ) 15 ( ) × × 15 × × ( ) 15 3 ( ) $ Worked example 7 How long will it take for $250 invested at the rate of 8% per annum simple interest to amount to $310? Amount = principal + interest Interest = amount − principal ∴ Interest = $310 − $250 = $60 Rate = 8% per annum = 8 100 250 20 × = 250 × = $ So the interest per year is $20. Total interest (60) ÷ annual interest (20) = 3 So it will take three years for $250 to amount to $310 at the rate of 8% per annum simple interest. Worked example 8 Calculate the rate of simple interest if a principal of $250 amounts to $400 in three years. Interest paid = $400 − $250 = $150 I PRT = 100 100I = PRT R I PT = = = = × × = 100 100 150 250 3 20 So, the interest rate = 20% Change the subject of the formula to R to find the rate. Exercise 17.4 1 For each of the following savings amounts, calculate the simple interest earned. Principal amount ($) Interest rate (%) Time invested 500 1 3 years 650 0.75 2 1 2 years 1000 1.25 5 years Remember You can manipulate the formula to find any of the values: I PRT PR PR = 100 P I RT = 100 R I PT = 100 T I PR = 100 e s s - R e v i e w C o p y - C a m b r i d g e U n i v e r s i t y P r e s s - R e v i e w C o p y R e v i e w C o p y - C a m b r i d g e U n i v e r s i t y P r e s s - R e v i e w C o p y R e v i e w C o p y - C a m b r i d g e U n i v e r s i t y P r e s s - R e v i e w C o p y R e v i e w C o p y - C a m b r i d g e U n i v e r s i t y Copyright Material - Review Only - Not for Redistribution
- 413. 403 Unit 5: Number 17 Managing money Principal amount ($) Interest rate (%) Time invested 1200 4 6 3 4 years 875 5.5 3 years 900 6 2 years 699 7.25 3.75 years 1200 8 9 months 150000 9 1 2 18 months 2 Calculate how much would have to be repaid in total for the following loans. Principal amount ($) Interest rate (%) Time invested 500 4.5 2 years 650 5 2 years 1000 6 2 years 1200 12 18 months 875 15 18 months 900 15 3 years 699 20 9 months 1200 21.25 8 months 150000 18 11 2 years 3 $1400 is invested at 4% per annum simple interest. How long will it take for the amount to reach $1624? 4 The simple interest on $600 invested for five years is $210. What is the rate percentage per annum? Applying your skills 5 If you invest a sum of money at a simple interest rate of 6%, how long will it take for your original amount to treble? 6 Jessica spends 1 4 of her income from odd jobs on books, 1 3 on transport and 1 6 on clothing. The rest she saves. a If she saves $8 per month, how much is her income each month? b How much does she save in a year at a rate of $8 per month? c She deposits one year’s savings into an account that pays 8.5% interest for five years. i How much interest would she earn? ii How much would she have altogether in the end? 7 Mrs MacGregor took a personal loan of ($)8000 over three years. She repaid ($)325 per month in that period. a How much did she repay in total? b How much interest did she pay in pounds? c At what rate was simple interest charged over the three years? Hire purchase Many people cannot afford to pay cash for expensive items like television sets, furniture and cars so they buy them on a system of payment called hire purchase (HP). On HP you pay a part of the price as a deposit and the remainder in a certain number of weekly or monthly instalments. Interest is charged on outstanding balances. It is useful to be able to work out what interest rate is being charged on HP as it is not always clearly stated. In HP agreements, the deposit is sometimes called the down- payment. When interest is calculated as a proportion of the amount owed it is called a flat rate of interest. This is the same as simple interest. e s s - R e v i e w C o p y - C a m b r i d g e U n i v e r s i t y P r e s s - R e v i e w C o p y R e v i e w C o p y - C a m b r i d g e U n i v e r s i t y P r e s s - R e v i e w C o p y R e v i e w C o p y - C a m b r i d g e U n i v e r s i t y P r e s s - R e v i e w C o p y R e v i e w C o p y - C a m b r i d g e U n i v e r s i t y Copyright Material - Review Only - Not for Redistribution
- 414. Cambridge IGCSE Mathematics 404 Unit 5: Number Worked example 9 The cash price of a car was $20000. The hire purchase price was $6000 deposit and instalments of $700 per month for two years. How much more than the cash price was the hire purchase price? Deposit = $6000 One instalment = $700 24 instalments = $700 × 24 = $16800 (once per month over two years = 24 monthly instalments) Total HP price deposit 24 instalments = + deposit = + = + = $ $ = + $ $ = + $ $ $ 6000 $ $ = + $ $ 6000 = + $ $16800 22800 The hire purchase price was $2800 more than the cash price. Worked example 10 A man buys a car for $30000 on hire purchase. A deposit of 20% is paid and interest is paid on the outstanding balance for the period of repayment at the rate of 10% per annum. The balance is paid in 12 equal instalments. How much will each instalment be? Cash price = $30000 Deposit of 20% = × = × = 20 100 30000 6000 $ Outstanding balance = $30000 − $6000 = $24000 Interest of 10% = × = × = 10 100 24000 2400 $ Amount to be paid by instalments outstanding balance inter = + outstanding balance = + es e es e t = + = $ $ = + $ $ = + $ $ $ 24 $ $ = + $ $ 24 = + $ $ $ $ 000 $ $ = + $ $ 000 = + $ $2400 26400 Each instalment = = = = 26400 12 2200 $ (divide by total number of instalments) Exercise 17.5 1 A shopkeeper wants 25% deposit on a bicycle costing $400 and charges 20% interest on the remaining amount. How much is: a the deposit b the interest c the total cost of the bicycle? 2 A person pays 30% deposit on a fridge costing $2500 and pays the rest of the money in one year with interest of 20% per year. How much does she pay altogether for the fridge? 3 A student buys a laptop priced at $1850. She pays a 20% deposit and 12 equal monthly instalments. The interest rate is charged at 15% per annum on the outstanding balance. a How much is each monthly instalment? b What is the total cost of buying the laptop on HP? 4 A large flat screen TV costs $999. Josh agrees to pay $100 deposit and 12 monthly payments of $100. a Calculate the total amount of interest Josh will pay. b What rate of interest was he charged? 5 A second-hand car is advertised for $15575 cash or $1600 deposit and 24 monthly payments of $734.70. a What is the difference between the cash price and the HP price? b What annual rate of interest is paid on the HP plan? e s s - R e v i e w C o p y - C a m b r i d g e U n i v e r s i t y P r e s s - R e v i e w C o p y R e v i e w C o p y - C a m b r i d g e U n i v e r s i t y P r e s s - R e v i e w C o p y R e v i e w C o p y - C a m b r i d g e U n i v e r s i t y P r e s s - R e v i e w C o p y R e v i e w C o p y - C a m b r i d g e U n i v e r s i t y Copyright Material - Review Only - Not for Redistribution
- 415. 405 Unit 5: Number 17 Managing money Compound interest Simple interest is calculated on the original amount saved or borrowed. It is more common, however, to earn or to be charged compound interest. With a loan where you are charged compound interest, the interest is added to the amount you owe at regular intervals so the amount you owe increases for the next period. When you invest money for a fixed period, you can earn compound interest. In this case, the interest earned is added to the amount each period and you then earn interest on the amount plus the interest for the next period. One way of doing compound interest calculations is to view them as a series of simple interest calculations. This method is shown in the following worked example. Worked example 11 Priya invests $100 at a rate of 10%, compounded annually. How much money will she have after three years? Year 1 I PRT = = = = × × = 100 100 10 × × 10 × ×1 100 10 $ P + I = $100 + $10 = $110 Use the formula for simple interest. Year 2 I PRT = = = = × × = 100 110 10 × × 10 × ×1 100 11 $ P + I = 110 + 11 = $121.00 P for year two is $110; T is one year as you are only finding the interest for year two. Year 3 I PRT = = = = × × = 100 121 10 × × 10 × ×1 100 12 10 $ . P + I = $133.10 P for year three is $121; T remains one year. When the principal, rate and time are the same, compound interest will be higher than simple interest. The exception is when the interest is only calculated for one period (for example one year), in that case, the compound interest and the simple interest will be the same. This table and graph compare the value of two $100 investments. The first is invested at 10% simple interest, the second at 10% compound interest. Year (T) Total $ 10% simple interest Total $ 10% interest compounded annually 1 110 110 2 120 121 3 130 133.10 4 140 146.41 5 150 161.05 6 160 177.16 7 170 194.87 8 180 214.36 9 190 235.79 10 200 259.37 e s s - R e v i e w C o p y - C a m b r i d g e U n i v e r s i t y P r e s s - R e v i e w C o p y R e v i e w C o p y - C a m b r i d g e U n i v e r s i t y P r e s s - R e v i e w C o p y R e v i e w C o p y - C a m b r i d g e U n i v e r s i t y P r e s s - R e v i e w C o p y R e v i e w C o p y - C a m b r i d g e U n i v e r s i t y Copyright Material - Review Only - Not for Redistribution
- 416. Cambridge IGCSE Mathematics 406 Unit 5: Number Comparison of growth of $100 under 10% simple and compound interest Amount ($) Time in years Simple interest Simple interest Compound interest 1 2 3 4 5 6 7 8 9 10 0 100 120 140 160 180 200 220 240 260 Compound interest It is clear that choosing a compound interest rate is to the advantage of the investor. Remember though, that the same effect is felt with borrowing – the outstanding debt increases each period as the interest is compounded. It takes a long time and lots of calculation to work out compound interest as a series of simple interest calculations. But there is a quicker method. Look at the calculations in the third column of the table. Year (T) Total $ 10% interest compounded annually Working using a multiplier 1 110 100 × 1.1 = 110 2 121 100 × 1.1 × 1.1 = 121 3 133.10 100 × 1.1 × 1.1 × 1.1 = 133.10 4 146.41 100 × (1.1)4 = 146.41 5 161.05 100 × (1.1)5 = 161.05 6 177.16 100 × (1.1)6 = 177.16 7 194.87 100 × (1.1)7 = 194.87 8 214.36 100 × (1.1)8 = 214.36 9 235.79 100 × (1.1)9 = 235.79 10 259.37 100 × (1.1)10 = 259.37 Can you see the rule? • Add the annual interest rate to 100 to get a percentage increase (subtract for a decrease): 100% + 10% = 110% • Express this as a decimal: 110 100 1 1 % . 1 1 1 1 = • Multiply the principal by a power of the decimal using the number of years as the power. So, for five years: 100 × (1.1)5 Indices were covered in chapter 2. REWIND Multiply the decimal by itself the same number of times as the number of years. For three years it would be 1.1 × 1.1 × 1.1 or (1.1)3 not 1.1 × 3! e s s - R e v i e w C o p y - C a m b r i d g e U n i v e r s i t y P r e s s - R e v i e w C o p y R e v i e w C o p y - C a m b r i d g e U n i v e r s i t y P r e s s - R e v i e w C o p y R e v i e w C o p y - C a m b r i d g e U n i v e r s i t y P r e s s - R e v i e w C o p y R e v i e w C o p y - C a m b r i d g e U n i v e r s i t y Copyright Material - Review Only - Not for Redistribution
- 417. 407 Unit 5: Number 17 Managing money You can also insert values into a formula to calculate the value of an investment when it is subject to compound interest. V = P 1 100 + r n , where P is the amount invested r is the percentage rate of interest n is the number of years of compound interest. Worked example 12 1 $1500 is invested at 5% p.a. compound interest. What will the investment be worth after 5 years? V = P 1 100 + r n = 1500 (1 + 0.05)5 = $1914.42 Insert values in the formula and then use your calculator. 2 A sum of money invested for 5 years at a rate of 5% interest, compounded yearly, grows to $2500. What was the initial sum invested? V = P 1 100 + r n So, P = A 1 100 + r n = 2500 05 5 ( . 1 0 ( . + 1 0 ( . 1 0 ) = $1958.82 Change the subject of the formula to make P the subject. Exercise 17.6 1 Calculate the total amount owing on a loan of $8000 after two years at an interest rate of 12%: a compounded annually b calculated as a flat rate. 2 How much would you have to repay on a credit card debt of $3500 after two years if the interest rate is: a 19.5% compounded annually? b 19.5% compounded half-yearly (the interest rate will be half of 19.5 for half a year)? 3 Calculate the total amount owing on a housing loan of $60000 after ten years if the interest rate is 4% compounded annually. 4 Jessica bought an apartment in Hong Kong for (US)$320000 as an investment. If the value of her apartment appreciates at an average rate of 3.5% per annum, what would it be worth in five years’ time? Exponential growth and decay When a quantity increases (grows) in a fixed proportion (normally a percentage) at regular intervals, the growth is said to be exponential. Similarly, when the quantity decreases (decays) by a fixed percentage over regular periods of time, it is called exponential decay. Increasing exponential functions produce curved graphs that slope steeply up to the right. Decreasing exponential functions produce curved graphs that slope down steeply to the right. E e s s - R e v i e w C o p y - C a m b r i d g e U n i v e r s i t y P r e s s - R e v i e w C o p y R e v i e w C o p y - C a m b r i d g e U n i v e r s i t y P r e s s - R e v i e w C o p y R e v i e w C o p y - C a m b r i d g e U n i v e r s i t y P r e s s - R e v i e w C o p y R e v i e w C o p y - C a m b r i d g e U n i v e r s i t y Copyright Material - Review Only - Not for Redistribution
- 418. Cambridge IGCSE Mathematics 408 Unit 5: Number E Exponential growth and decay can be expressed using formulae. For growth: y = a(1 + r)n For decay: y = a(1 − r)n Where a is the original value or principal, r is the rate of change expressed as a decimal and n is the number of time periods. Worked example 13 $100 is invested subject to compound interest at a rate of 8% per annum. Find the value of the investment correct to the nearest cent after a period of 15 years. Value = a(1 + r)n Use the formula for exponential growth and substitute the given values. = 100(1 + 0.8)15 = 100(1.08)15 = 317.2169114 Value of investment is $317.22 (correct to the nearest cent). Worked example 14 The value of a new computer system depreciates by 30% per year. If it cost $1200 new, what will it be worth in two years’ time? Value = a(1 − r)n Use the formula for exponential decay and substitute the given values. = 1200(1 − 0.3)2 = 1200(0.7)2 = 588 Value after two years is $588. Exercise 17.7 1 The human population of Earth in August 2010 was estimated to be 6.859 billion people. In August 2009, the population grew at a rate of 1.13%. Assuming this growth rate continues, estimate the population of the world in August of: a 2015 b 2020 c 2025. 2 In 2010 there were an estimated 1600 giant pandas in China. Calculate the likely panda population in 2025 if there is: a an annual growth in the population of 0.5% b an annual decline in the population of 0.5%. 3 A population of microbes in a laboratory doubles every day. At the start of the period, the population is estimated to be 1 000 000 microbes. a Copy and complete this table to show the growth in the population. Time (days) 0 1 2 3 4 5 6 7 8 Total number of microbes (millions) 1 2 4 b Draw a graph to show growth in the population over 8 days. c Use the graph to determine the microbe population after: i 2.5 days ii 3.6 days d Use the graph to determine how long it will take the microbe population to reach 20 million. When financial investments increase or decrease in value at an exponential rate we talk about appreciation (growth) and depreciation. When the number of individuals in a population increase or decrease exponentially over time, we usually talk about growth or decay. You will deal with exponential curves in more detail in chapter 18. FAST FORWARD e s s - R e v i e w C o p y - C a m b r i d g e U n i v e r s i t y P r e s s - R e v i e w C o p y R e v i e w C o p y - C a m b r i d g e U n i v e r s i t y P r e s s - R e v i e w C o p y R e v i e w C o p y - C a m b r i d g e U n i v e r s i t y P r e s s - R e v i e w C o p y R e v i e w C o p y - C a m b r i d g e U n i v e r s i t y Copyright Material - Review Only - Not for Redistribution
- 419. 409 Unit 5: Number 17 Managing money 4 This graph shows how a radio-active substance loses its radioactivity over time. 100 90 80 70 60 50 40 30 20 10 5 10 Time Mass 15 20 t g a The half life of the substance is how long it takes to decay to half its original mass. What is the half life of this substance? b What mass of the substance is left after 20 minutes? 5 Ms Singh owns a small business. She borrows $18 500 from the bank to finance some new equipment. She repays the loan in full after two years. If the bank charged her compound interest at the rate of 21% per annum, how much did she repay after two years? 6 The value of a car depreciates each year by 8%. A new small car is priced at $11 000. How much will this car be worth in: a 1 year b 3 years c 8 years d n years? 7 Nils invests his savings in an account that pays 6% interest compounded half yearly. If he puts $2300 into his account and leaves it there for two years, how much money will he have at the end of the period? 8 The total population of a European country is decreasing at a rate of 0.6% per year. In 2014, the population of the country was 7.4 million people. a What is the population likely to be in 2020 if it decreases at the same rate? b How long will it take for the population to drop below 7 million people? 9 A colony of bacteria grows by 5% every hour. How long does it take for the colony to double in size? 17.3 Buying and selling When people trade they buy goods, mark them up (decide on a price) and then sell them. The price the trader pays for goods is called the cost price. The price the goods are sold at is called the selling price. If the selling price is higher than the cost price, the goods are sold at a profit. If the selling price is lower than the cost price, the goods are sold at a loss. profit = selling price − cost price loss = cost price − selling price This is essentially the same as the compound interest formula above. E e s s - R e v i e w C o p y - C a m b r i d g e U n i v e r s i t y P r e s s - R e v i e w C o p y R e v i e w C o p y - C a m b r i d g e U n i v e r s i t y P r e s s - R e v i e w C o p y R e v i e w C o p y - C a m b r i d g e U n i v e r s i t y P r e s s - R e v i e w C o p y R e v i e w C o p y - C a m b r i d g e U n i v e r s i t y Copyright Material - Review Only - Not for Redistribution
- 420. Cambridge IGCSE Mathematics 410 Unit 5: Number Percentage profit and loss Profit and loss are normally calculated as percentages of the cost price. The following formulae are used to calculate percentage profit or loss: percentage profit actual profit cost price = × = × actual profi = ×100% percentage loss actual loss cost price = × = ×100% Worked example 15 A shopkeeper buys an article for $500 and sells it for $600. What is the percentage profit? Profit selling price cost price 1 = − selling price = − = − = $ $ = − $ $ = − $ $ $ 600 $ $ = − $ $ 600 = − $ $500 00 Percentage profit profit cost 1 5 2 = × = × profit = × = × = × = 100 00 00 100 0 % % % $ $ Worked example 16 A person buys a car for $16000 and sells it for $12000. Calculate the percentage loss. Loss cost price selling price = − cost price = − = − = $ $ = − $ $ = − $ $ $ 16 $ $ = − $ $ 16 = − $ $ $ $ 000 $ $ = − $ $ 000 = − $ $12000 4000 Percentage loss loss cost = × = × = × = × = 100 4000 16000 100 25 % % % $ $ Exercise 17.8 1 Find the actual profit and percentage profit in the following cases (use an appropriate degree of accuracy where needed): a cost price $20, selling price $25 b cost price $500, selling price $550 c cost price $1.50, selling price $1.80 d cost price 30 cents, selling price 35 cents. 2 Calculate the percentage loss in the following cases (use an appropriate degree of accuracy where needed): a cost price $400, selling price $300 b cost price 75c, selling price 65c c cost price $5.00, selling price $4.75 d cost price $6.50, selling price $5.85. 3 A market trader buys 100 oranges for $30. She sells them for 50 cents each. Calculate the percentage profit or loss she made. Calculating the selling price, cost price and mark up People who sell goods have to decide how much profit they want to make. In other words, they have to decide by how much they will mark up the cost price to make the selling price. cost price + % mark up = selling price Notice the similarity with percentage increases and decreases in chapter 5. REWIND The cost price is always 100%. If you add 10% mark up, the selling price will be 110%. e s s - R e v i e w C o p y - C a m b r i d g e U n i v e r s i t y P r e s s - R e v i e w C o p y R e v i e w C o p y - C a m b r i d g e U n i v e r s i t y P r e s s - R e v i e w C o p y R e v i e w C o p y - C a m b r i d g e U n i v e r s i t y P r e s s - R e v i e w C o p y R e v i e w C o p y - C a m b r i d g e U n i v e r s i t y Copyright Material - Review Only - Not for Redistribution
- 421. 411 Unit 5: Number 17 Managing money Worked example 17 A trader sells her product for $39. If her mark up is 30%, what is the cost price of the product? Cost price + mark up = selling price Selling price = 130% of the cost price So, $39 = 130% × selling price To find 100%: 39 130 100 30 × = 100 × = $ The cost price was $30 Worked example 18 At a market, a trader makes a profit of $1.08 on an item selling for $6.48. What is his percentage profit? Cost price + mark up = selling price Selling price − mark up = cost price $6.48 − $1.08 = $5.40 Percentageprofit actual profit price = ´ = ´ profit = ´ cost 100 1 08 5 40 100 20 1 0 1 0 5 4 5 4 % × = 100 × = Express the mark up as a percentage of cost price. Worked example 19 Find the selling price of an article bought for $400 and sold at a loss of 10%. Cost price = $400 Loss 1 of 4 = = × = × = 0 0 10 0 1 of 0 0 4 0 00 10 100 400 0 0 0 0 0 10 0 10 0 $ 0 0 0 0 $ Selling price cost price loss = = − = – $ $ = − $ $ = − $ $ $ 400 $ $ = − $ $ 400 = − $ $40 360 Exercise 17.9 1 Find the cost price of each of the following items: a selling price $130, profit 20% b selling price $320, profit 25% c selling price $399, loss 15% d selling price $750, loss 331 3 %. 2 Find the selling price of an article that was bought for $750 and sold at a profit of 12%. 3 Calculate the selling price of a car bought for $3000 and sold at a profit of 7.5%. 4 Hakim bought a computer for $500. Two years later he sold it at a loss of 28%. What was his selling price? e s s - R e v i e w C o p y - C a m b r i d g e U n i v e r s i t y P r e s s - R e v i e w C o p y R e v i e w C o p y - C a m b r i d g e U n i v e r s i t y P r e s s - R e v i e w C o p y R e v i e w C o p y - C a m b r i d g e U n i v e r s i t y P r e s s - R e v i e w C o p y R e v i e w C o p y - C a m b r i d g e U n i v e r s i t y Copyright Material - Review Only - Not for Redistribution
- 422. Cambridge IGCSE Mathematics 412 Unit 5: Number 5 An article costing $240 is sold at a loss of 8%. Find the selling price. 6 Kwame makes jewellery and sells it to her friends. Her costs to make 10 rings were $377. She wants to sell them and make a 15% profit. What should she charge? 7 Tim sells burgers for $6.50 and makes a profit of $1.43 on each one. What is his percentage profit on cost price? Applying your skills 8 VAT at a rate of 17% is added each time an item is sold on. The original cost of an item is $112.00. The item is sold to a wholesaler, who sells it on to a retailer. The retailer sells it to the public. a How much tax will the item have incurred? b Express the tax as a percentage of the original price. Discount If items are not being sold as quickly as a shop would like or if they want to clear stock as new fashions come out, then goods may be sold at a discount. Discount can be treated in the same way as percentage change (loss) as long as you remember that the percentage change is always calculated as a percentage of the original amount. Worked example 20 During a sale, a shop offers a discount of 15% on jeans originally priced at $75. What is the sale price? Discount 15 of 75 = = × = × = % . $ $ 15 100 75 11 25 Sale price original price discount = = = – – . . $ $ 75 11 – . 11 – .25 63 75 You can also work out the price by considering the sale price as a percentage of 100%. 100 − 15 = 85, so the sale price is 85% of $75: 85 100 75 63 75 × = 75 × = $ . Exercise 17.10 1 Copy and complete the following table. Original price ($) % discount Savings ($) Sale price ($) 89.99 5 125.99 10 599.00 12 22.50 7.5 65.80 2.5 10 000.00 23 e s s - R e v i e w C o p y - C a m b r i d g e U n i v e r s i t y P r e s s - R e v i e w C o p y R e v i e w C o p y - C a m b r i d g e U n i v e r s i t y P r e s s - R e v i e w C o p y R e v i e w C o p y - C a m b r i d g e U n i v e r s i t y P r e s s - R e v i e w C o p y R e v i e w C o p y - C a m b r i d g e U n i v e r s i t y Copyright Material - Review Only - Not for Redistribution
- 423. 413 Unit 5: Number 17 Managing money 2 Calculate the percentage discount given on the following sales. Give your answer rounded to the nearest whole per cent. Original price ($) Sale price ($) % discount 89.99 79.99 125.99 120.00 599.00 450.00 22.50 18.50 65.80 58.99 10 000.00 9500.00 Summary Do you know the following? • People in employment earn money for the work they do. This money can be paid as wages, salaries, commission or as a fee per item produced (piece work). • Gross earnings refers to how much you earn before deductions. Gross earnings − deductions = net earnings. Your net earnings are what you actually receive as payment. • Companies are obliged by law to deduct tax and certain other amounts from earnings. • Simple interest is calculated per time period as a fixed percentage of the original amount (the principal). The formula for finding simple interest is I PRT = 100 . • Compound interest is interest added to the original amount at set intervals. This increases the principal and further interest is compounded. Most interest in real life situations is compounded. • The formula for calculating compound interest is V P n = + 1 100 r • Hire purchase (HP) is a method of buying goods on credit and paying for them in instalments which include a flat rate of interest added to the original price. • When goods are sold at a profit they are sold for more than they cost. When they are sold at a loss they are sold for less than they cost. The original price is called the cost price. The price they are sold for is called the selling price. If goods are sold at a profit, selling price − cost price = profit. If they are sold at a loss, cost price − selling price = loss. • A discount is a reduction in the usual price of an item. A discount of 15% means you pay 15% less than the usual or marked price. Are you able to …? • use given information to solve problems related to wages, salaries, commission and piece work • read information from tables and charts to work out deductions and tax rates • calculate gross and net earnings given the relevant information • use the formula to calculate simple interest • manipulate the simple interest formula to calculate the principal amount, rate of interest and time period of a debt or investment • solve problems related to HP payments and amounts • calculate compound interest over a given time period and solve problems related to compound interest • use exponential growth and decay in relation to finance and population changes • calculate the cost price, selling price, percentage profit or loss and actual mark up using given rates and prices • work out the actual price of a discounted item and calculate the percentage discount given the original and the new price. E e s s - R e v i e w C o p y - C a m b r i d g e U n i v e r s i t y P r e s s - R e v i e w C o p y R e v i e w C o p y - C a m b r i d g e U n i v e r s i t y P r e s s - R e v i e w C o p y R e v i e w C o p y - C a m b r i d g e U n i v e r s i t y P r e s s - R e v i e w C o p y R e v i e w C o p y - C a m b r i d g e U n i v e r s i t y Copyright Material - Review Only - Not for Redistribution
- 424. Unit 5: Number 414 Examination practice Exam-style questions 1 Sayed is paid $8.50 per hour for a standard 36-hour week. He is paid ‘time-and-a-half’ for all overtime worked. Calculate: a his gross weekly earnings if he works 4 3 4 hours overtime b the hours overtime worked if he earns $420.75 for the week. 2 Ahmed bought a DVD for $15. He sold it to Barbara, making a 20% loss. a How much did Barbara pay for it? b Barbara later sold the DVD to Luvuyo. She made a 20% profit. How much did Luvuyo pay for it? 3 Last year, Jane’s wages were $80 per week. Her wages are now $86 per week. Calculate the percentage increase. 4 What is the simple interest on $160 invested at 7% per year for three years? 5 Senor Vasquez invests $500 in a Government Bond, at 9% simple interest per year. How much will the Bond be worth after three years? 6 Simon’s salary has increased by 6% p.a. over the past three years. It is now $35730.40 p.a. a What did he earn per year three years ago? b What is his gross monthly salary at the present rate? c His deductions each month amount to 22.5% of his gross salary. What is his net pay per month? 7 A new car cost $14875. Three years later, the insurance company valued it at $10700. Calculate the percentage reduction in value over the three years. 8 Exercise equipment advertised at $2200 is sold on sale for $1950. What percentage discount is this? Past paper questions 1 Robert buys a car for $8000. At the end of each year the value of the car has decreased by 10% of its value at the beginning of that year. Calculate the value of the car at the end of 7 years. [2] [Cambridge IGCSE Mathematics 0580 Paper 22 Q8 October/November 2015] 2 Anita buys a computer for $391 in a sale. The sale price is 15% less than the original price. Calculate the original price of the computer. [3] [Cambridge IGCSE Mathematics 0580 Paper 22 Q11 May/June 2014] E e s s - R e v i e w C o p y - C a m b r i d g e U n i v e r s i t y P r e s s - R e v i e w C o p y R e v i e w C o p y - C a m b r i d g e U n i v e r s i t y P r e s s - R e v i e w C o p y R e v i e w C o p y - C a m b r i d g e U n i v e r s i t y P r e s s - R e v i e w C o p y R e v i e w C o p y - C a m b r i d g e U n i v e r s i t y Copyright Material - Review Only - Not for Redistribution
- 425. 415 Unit 5: Algebra In chapter 10 you saw that many problems could be represented by linear equations and straight line graphs. Real life problems, such as those involving area; the path of a moving object; the shape of a bridge or other structure; the growth of bacteria; and variation in speed, can only be solved using non-linear equations. Graphs of non-linear equations are curves. In this chapter you are going to use tables of values to plot a range of curved graphs. Once you understand the properties of the different graphs, you will use these to sketch the graphs (rather than plotting them). You will also learn how to interpret curved graphs and how to find the approximate solution of equations from graphs. Chapter 18: Curved graphs • Quadratic • Parabola • Axis of symmetry • Turning point • Minimum • Maximum • Reciprocal • Hyperbola • Asymptote • Intersection • Exponential • Gradient • Tangent • Derived function • Differentiate Key words In this chapter you will learn how to: • construct a table of values to draw graphs called parabolas • sketch and interpret parabolas • construct a table of values to draw graphs called hyperbolas • interpret curved graphs • use graphs to find the approximate solutions to quadratic equations • construct tables of values to draw graphs in the form of axn and a x • recognise, sketch and interpret graphs of functions • estimate the gradients of curves by drawing tangents • use graphs to find the approximate solutions to associated equations • differentiate functions to find gradients and turning points. EXTENDED The water arcs from this fountain form a curved shape which is called a parabola in mathematics. e s s - R e v i e w C o p y - C a m b r i d g e U n i v e r s i t y P r e s s - R e v i e w C o p y R e v i e w C o p y - C a m b r i d g e U n i v e r s i t y P r e s s - R e v i e w C o p y R e v i e w C o p y - C a m b r i d g e U n i v e r s i t y P r e s s - R e v i e w C o p y R e v i e w C o p y - C a m b r i d g e U n i v e r s i t y Copyright Material - Review Only - Not for Redistribution
- 426. Unit 5: Algebra Cambridge IGCSE Mathematics 416 18.1 Drawing quadratic graphs (the parabola) In chapter 10 you learned that quadratic equations have an x2 term as their highest power. The simplest quadratic equation for a quadratic graph is y x = 2 . Here is a table showing the values for y x = 2 from −3 x 3. x −3 −2 −1 0 1 2 3 y = x2 9 4 1 0 1 4 9 You can use these points to plot and draw a graph just as you did with linear equations. The graph of a quadratic relationship is called a parabola. Here is the table of values for y x = − 2 from −3 x 3. x −3 −2 −1 0 1 2 3 y = −x2 −9 −4 −1 0 −1 −4 −9 When you plot these points and draw the parabola you can see that the negative sign in front of the x2 has the effect of turning the graph so that it faces downwards. If the coefficient of x2 in the equation is positive, the parabola is a ‘valley’ shaped curve. If the coefficient of x2 in the equation is negative, the parabola is a ‘hill’ shaped curve. The axis of symmetry and the turning point The axis of symmetry is the line which divides the parabola into two symmetrical halves. In the two graphs above, the y-axis (x = 0) is the axis of symmetry. The turning point or vertex of the graph is the point at which it changes direction. For both of the graphs above, the turning point is at the origin (0, 0). 8 7 6 5 4 3 2 1 9 x y –3 –2 –1 0 1 2 3 y x = 2 0 –1 –2 –3 –4 –5 –6 –7 –8 –9 x y –3 –2 –1 1 2 3 y x = − 2 For most graphs, a turning point is a local minimum or maximum value of y. For a parabola, if the x2 term is positive the turning point will be a minimum. If the x2 term is negative, the turning point will be a maximum. RECAP You should already be familiar with the following concepts from your work on straight line graphs: Plot graphs from a table of values (Chapter 10) • A table of values gives you a set of ordered pairs (x, y) that you can use to plot a graph. Gradient (Chapter 10) • Gradient = change in -values change in -values y x • Gradient can be positive or negative. Graphical solution to simultaneous equations (Chapter 14) • The point of intersection (x, y) of two straight line graphs is the simultaneous solution to the two equations (of the graphs). 1 2 3 4 5 6 0 1 2 3 4 5 –2 –1 x y 2x +y = 5 x – 3y = 6 This point is (3, –1), so x = 3 and y = –1 We often draw curved graphs to help us understand how two variables might be related in geography. For example, you may find an interesting diagram arises if we take each National Park in the UK and plot the cost of maintaining visitor facilities against the number of tourists visiting each year. LINK e s s - R e v i e w C o p y - C a m b r i d g e U n i v e r s i t y P r e s s - R e v i e w C o p y R e v i e w C o p y - C a m b r i d g e U n i v e r s i t y P r e s s - R e v i e w C o p y R e v i e w C o p y - C a m b r i d g e U n i v e r s i t y P r e s s - R e v i e w C o p y R e v i e w C o p y - C a m b r i d g e U n i v e r s i t y Copyright Material - Review Only - Not for Redistribution
- 427. Unit 5: Algebra 417 18 Curved graphs Exercise 18.1 1 Complete the following tables of values and plot the graphs on the same set of axes. Use values of −8 to 12 on the y-axis. a x −3 −2 −1 0 1 2 3 y = x2 + 1 b x −3 −2 −1 0 1 2 3 y = x2 + 3 c x −3 −2 −1 0 1 2 3 y = x2 − 2 d x −3 −2 −1 0 1 2 3 y = −x2 + 1 e x −3 −2 −1 0 1 2 3 y = 3 − x2 f What happens to the graph when the value of the constant term changes? 2 Match each of the five parabolas shown here to its equation. a y = 4 − x2 b y = x2 − 4 c y = x2 + 2 d y = 2 − x2 e y = −x2 − 2 Remember that if you square a negative number the result will be positive. If using your calculator, place brackets round any negatives. These equations are all in the form y = −x2 + c, where c is the constant term. The constant term is the y-intercept of the graph in each case. 0 x y 9 8 7 6 5 4 3 2 1 E D C B A –1 –2 –3 –4 –5 –6 –7 –8 –9 –3 –2 –1 1 2 3 e s s - R e v i e w C o p y - C a m b r i d g e U n i v e r s i t y P r e s s - R e v i e w C o p y R e v i e w C o p y - C a m b r i d g e U n i v e r s i t y P r e s s - R e v i e w C o p y R e v i e w C o p y - C a m b r i d g e U n i v e r s i t y P r e s s - R e v i e w C o p y R e v i e w C o p y - C a m b r i d g e U n i v e r s i t y Copyright Material - Review Only - Not for Redistribution
- 428. Unit 5: Algebra Cambridge IGCSE Mathematics 418 Equations in the form of y = x2 + ax + b You have seen how to construct a table of values and then plot and draw a parabola from simple quadratic equations. Now you are going to see how to draw up a table of values for more usual quadratic equations with an x2 term, an x term and a constant term. In these cases, it is easiest if you work out each term on a separate row of the table and then add them to find the value of y. Read through the two worked examples carefully to make sure you understand this. Worked example 1 Construct a table of values for y = x2 + 2x − 1 for values −4 x 2. Plot the points to draw the graph. x −4 −3 −2 −1 0 1 2 x2 16 9 4 1 0 1 4 2x −8 −6 −4 −2 0 2 4 −1 −1 −1 −1 −1 −1 −1 −1 y = x2 + 2x − 1 7 2 −1 −2 −1 2 7 In this table, you work out each term separately. Add the terms of the equation in each column to get the totals for the last row (the y-values of each point). To draw the graph: • plot the points and join them to make a smooth curve • label the graph with its equation. –4 –3 –2 1 2 7 6 5 4 3 2 1 0 x y –1 –1 –2 y x x = + − 2 2 1 e s s - R e v i e w C o p y - C a m b r i d g e U n i v e r s i t y P r e s s - R e v i e w C o p y R e v i e w C o p y - C a m b r i d g e U n i v e r s i t y P r e s s - R e v i e w C o p y R e v i e w C o p y - C a m b r i d g e U n i v e r s i t y P r e s s - R e v i e w C o p y R e v i e w C o p y - C a m b r i d g e U n i v e r s i t y Copyright Material - Review Only - Not for Redistribution
- 429. Unit 5: Algebra 419 18 Curved graphs Worked example 2 Draw the graph of y = 6 + x − x2 for values of x from −3 to 4. x −3 −2 −1 0 1 2 3 4 6 6 6 6 6 6 6 6 6 +x −3 −2 −1 0 1 2 3 4 −x2 −9 −4 −1 0 −1 −4 −9 −16 y = 6 + x − x2 −6 0 4 6 6 4 0 −6 x y –2 –3 0 1 2 3 4 –1 6 7 5 4 3 2 1 –4 –2 –3 –5 –1 –6 y x x = + − 6 2 To plot the graph of a quadratic relationship: • complete a table of values (often some of the values will be given) • rule the axes and label them • plot the (x, y) values from the table of values • join the points with a smooth curve. Exercise 18.2 1 Construct a table of values of y = x2 − 2x2 + 2 for −1 x 3 and use the (x, y) points from the table to plot and draw the graph. 2 Copy and complete this table of values and then draw the graph of y = x2 − 5x − 4. x −2 −1 0 1 2 3 4 5 6 x2 4 −5x 10 −4 −4 −4 −4 −4 −4 −4 −4 −4 −4 y 3 Construct a table of values of y = x2 + 2x − 3 from −3 x 2. Plot the points and join them to draw the graph. Some calculators have an in-built function to create tables of values. These can help you avoid errors provided you use them correctly. However, make sure that you can still do the calculations without the table function. e s s - R e v i e w C o p y - C a m b r i d g e U n i v e r s i t y P r e s s - R e v i e w C o p y R e v i e w C o p y - C a m b r i d g e U n i v e r s i t y P r e s s - R e v i e w C o p y R e v i e w C o p y - C a m b r i d g e U n i v e r s i t y P r e s s - R e v i e w C o p y R e v i e w C o p y - C a m b r i d g e U n i v e r s i t y Copyright Material - Review Only - Not for Redistribution
- 430. Unit 5: Algebra Cambridge IGCSE Mathematics 420 4 Using values of x from 0 to 4, construct a table of values and use it to draw the graph of y = −x2 − 4x. 5 Using values of x from −6 to 0, construct a table of values and use it to draw the graph of y = −x2 − 6x − 5. Applying your skills 6 People who design water displays (often set to music) need to know how high water will rise from a jet and how long it will take to return to the pool. This graph shows the height of a water arc from a fountain (in metres) over a number of seconds. a What was the greatest height reached by the water arc? b How long did it take the water to reach the greatest height? c For how long was the water arc above a height of 2.5m? d How far did the water rise in the first second? e Why do you think this graph shows only positive values of height? Sketching quadratic functions You can use the characteristics of the parabola to sketch a graph. When the equation is in the standard form y = x2 + bx + c follow these steps to sketch the graph: Step 1: Identify the shape of the graph. If the x2 term is positive the graph is ∪ shaped; if the x2 term is negative, the graph is ∩ shaped. Step 2: Find the y-intercept. You do this by making x = 0 in the equation. The coordinates of the y-intercept are (0, c). Step 3: Mark the y-intercept and x-intercept(s) and use what you know about the shape of the graph and its symmetry to draw a smooth curve. Label the graph. 1 2 3 4 0 1 2 3 4 5 6 h (m) t (s) Worked example 3 Sketch the graph of y = x2 + 2x − 3 x2 is positive, so the graph is ∪ shaped y-intercept = (0, −3) Remember there is only ever one y-intercept. 0 1 x y y = x2 + 2x − 3 –3 –3 e s s - R e v i e w C o p y - C a m b r i d g e U n i v e r s i t y P r e s s - R e v i e w C o p y R e v i e w C o p y - C a m b r i d g e U n i v e r s i t y P r e s s - R e v i e w C o p y R e v i e w C o p y - C a m b r i d g e U n i v e r s i t y P r e s s - R e v i e w C o p y R e v i e w C o p y - C a m b r i d g e U n i v e r s i t y Copyright Material - Review Only - Not for Redistribution
- 431. Unit 5: Algebra 421 18 Curved graphs x-intercepts You can find the x-intercept(s) by making y = 0 in the equation and solving for x. To find the x-intercepts of the graph in Example 3, make y = 0, so x2 + 2x − 3 = 0 (x + 3)(x − 1) = 0 x = −3 or x = 1 So, (−3, 0) and (1, 0) are the x-intercepts Turning points To find the coordinates of the turning point of a parabola, you need to find the axis of symmetry. When the equation is in standard form y = ax2 + bx + c, the axis of symmetry can be found using x b a = − 2 . This gives the x-coordinate of the turning point. You can then find the y-coordinate of the turning point by substituting the value of x into the original equation. This y-value is the minimum or maximum value of the graph. If there is only one intercept then the graph just touches the x axis. The turning point of a parabola is the minimum or maximum point of the graph. For the graph y = ax2 + bx + c, the turning point is a maximum if a is negative and a minimum if a is positive. Worked example 4 Sketch the graph y = −2x2 − 4x + 6 a = −2, so the graph is ∩ shaped. The y-intercept = (0, 6) Find the x-intercepts: −2x2 − 4x + 6 = 0 x2 + 2x − 3 = 0 (x − 1)(x + 3) = 0 x = 1 or x = −3 (1, 0) and (−3, 0) are the x-intercepts. Find the axis of symmetry using x b a = − 2 x = − = − 4 2 2 1 ( ) Substitute x = −1 into the equation to find the y-coordinate of the turning point. y = −2(−1)2 − 4(−1) + 6 = 8 The turning point is at (−1, 8) and is a maximum because a is negative. Sketch the graph and label all the important features. Find the turning point by completing the square You can find the coordinates of the turning point of a parabola algebraically by completing the square. This involves changing the quadratic equation from the standard form ax2 + bx + c = 0 to the form a(x + p)2 + q. In this form, the turning point of a parabola has the coordinates (−p, q). You learned how to solve quadratic equations by completing the square in Chapter 14. Revise that section now if you’ve forgotten how to do this. REWIND Divide both sides by common factor −2. Factorise the trinomial. Solve for x. Remember this is the x-coordinate of the turning point. x y 0 y = −2x2 − 4x + 6 –3 (–1, 8) 1 –1 8 6 E e s s - R e v i e w C o p y - C a m b r i d g e U n i v e r s i t y P r e s s - R e v i e w C o p y R e v i e w C o p y - C a m b r i d g e U n i v e r s i t y P r e s s - R e v i e w C o p y R e v i e w C o p y - C a m b r i d g e U n i v e r s i t y P r e s s - R e v i e w C o p y R e v i e w C o p y - C a m b r i d g e U n i v e r s i t y Copyright Material - Review Only - Not for Redistribution
- 432. Unit 5: Algebra Cambridge IGCSE Mathematics 422 Consider the equation y = x2 + 4x − 5 This can be rewritten as y = (x + 2)2 − 9 by completing the square. Squaring any value results in an answer that is either positive or 0. This means that for any value of x, the smallest value of (x + 2)2 is 0. This means that the minimum value of (x + 2)2 − 9 is −9 and that this occurs when x = −2 The turning point of the graph y = (x + 2)2 − 9 has the coordinates (−2, −9) Worked example 5 a Determine the equation of the axis of symmetry and turning point of y = x2 − 8x + 13 by completing the square. b Sketch the graph. a y = x2 − 8x + 13 First complete the square. y = (x − 4)2 − 16 + 13 Half of 8 is four, but (x − 4)2 = x2 − 8x + 16 so you have to subtract 16 to keep the equation balanced. y = (x − 4)2 − 3 Simplify your solution. Turning point: (4, −3) Axis of symmetry: x = 4 b To sketch the graph, you must find the intercepts. y-intercept = (0,13) You can read this from the original equation. To find the x-intercept(s), let y = 0 and solve. 0 = (x − 4)2 − 3 3 = (x − 4)2 x − 4 = ± 3 Remember there is a negative and a positive root. x = ± 3 + 4 x = 5.7 or 2.3 Sketch the graph and label it. 0 4 (4, –3) (2.3, 0) (5.7, 0) 13 x y y = x2 − 8x + 13 Exercise 18.3 1 Sketch the following graphs. a y = x2 − 3x − 4 b y = x2 − 2x − 7 c y = x2 + 4x + 4 d y = x2 + 4x − 5 e y = x2 + 6x + 8 f y = x2 − 3x − 4 g y = x2 + 7x + 12 E e s s - R e v i e w C o p y - C a m b r i d g e U n i v e r s i t y P r e s s - R e v i e w C o p y R e v i e w C o p y - C a m b r i d g e U n i v e r s i t y P r e s s - R e v i e w C o p y R e v i e w C o p y - C a m b r i d g e U n i v e r s i t y P r e s s - R e v i e w C o p y R e v i e w C o p y - C a m b r i d g e U n i v e r s i t y Copyright Material - Review Only - Not for Redistribution
- 433. Unit 5: Algebra 423 18 Curved graphs 2 Nadia sketched the following graphs and forgot to label them. Use the information on the sketch to determine the equation of each graph. a –5 0 5 1 x y b –2 2 4 x y c –2 2 4 6 –2 2 4 6 x y 0 –4 –6 d 1 –1 –2 0 –2 2 4 6 –4 –6 2 3 4 x y E 3 Sketch the following graphs. Indicate the axis of symmetry and the coordinates of the turning point on each graph. a y = x2 + 6x − 5 b 2x2 + 4x = y c y = 3 – (x + 1)2 d y = 4 − 2(x + 3)2 e y = 17 + 6x – x2 f y = 5 − 8x + 2x2 g y = 1 + 2x − 2x2 h y = −(x + 2)2 − 1 Applying your skills 4 The equation for the curved supporting arch of a bridge (shown in red on the diagram) is given by h x = 1 40 ( 20)2 − − where h m is the distance below the base of the bridge and x m is the distance from the left side. h x e s s - R e v i e w C o p y - C a m b r i d g e U n i v e r s i t y P r e s s - R e v i e w C o p y R e v i e w C o p y - C a m b r i d g e U n i v e r s i t y P r e s s - R e v i e w C o p y R e v i e w C o p y - C a m b r i d g e U n i v e r s i t y P r e s s - R e v i e w C o p y R e v i e w C o p y - C a m b r i d g e U n i v e r s i t y Copyright Material - Review Only - Not for Redistribution
- 434. Unit 5: Algebra Cambridge IGCSE Mathematics 424 a Determine the turning point of the graph of the relationship. b What are the possible values for x? c Determine the range of values of h. d Sketch a graph of the equation within the possible values. e What is the width of the supporting arch? f What is the maximum height of the supporting arch? 18.2 Drawing reciprocal graphs (the hyperbola) Equations in the form of y x = a (where a is a whole number) are called reciprocal equations. Graphs of reciprocal equations are called hyperbolas. These graphs have a very characteristic shape. Although it is one graph, it consists of two non-connected curves that are mirror images of each other, drawn in opposite quadrants. Here is a table of values for y x = 6 . x −6 −5 −4 −3 −2 −1 1 2 3 4 5 6 y x = 6 −1 −1.2 −1.5 −2 −3 −6 6 3 2 1.5 1.2 1 When you plot these points, you get this graph. x y –6 –5 –4 –3 –2 –1 1 2 3 4 5 6 6 5 4 3 2 1 0 –1 –2 –3 –4 –5 –6 y x = 6 y x = 6 Notice the following about the graph: • it has two parts which are the same shape and size, but in opposite quadrants • the curve is symmetrical • the curve approaches the axes, but it will never touch them • there is no value of y for x = 0 and no value of x for y = 0. Reciprocal equations have a constant product. If y x = 6 then xy = 6. There is no value of y that corresponds with x = 0 because division by 0 is meaningless. Similarly, if x was 0, then xy would also be 0 for all values of y and not 6, as it should be in this example. This is what causes the two parts of the curve to be disconnected. Include at least five negative and five positive values in the table of values to draw a hyperbola because it has two separate curves. e s s - R e v i e w C o p y - C a m b r i d g e U n i v e r s i t y P r e s s - R e v i e w C o p y R e v i e w C o p y - C a m b r i d g e U n i v e r s i t y P r e s s - R e v i e w C o p y R e v i e w C o p y - C a m b r i d g e U n i v e r s i t y P r e s s - R e v i e w C o p y R e v i e w C o p y - C a m b r i d g e U n i v e r s i t y Copyright Material - Review Only - Not for Redistribution
- 435. Unit 5: Algebra 425 18 Curved graphs An asymptote is a line that a graph approaches but never intersects. When the equation is in the form y a x = , the curve approaches both axes and gets closer and closer to them without ever touching them. For other reciprocal equations, the asymptotes may not be the axes, in these cases, they are normally shown on the graph as dotted lines. Worked example 6 Construct a table of values and then draw a graph of xy = −12 (x ≠ 0) for −12 x 12. xy = −12 is the same as y x = −12 . In this case, you can work out every second value as you will not need all 24 points to draw the graph. X −12 −10 −8 −6 −4 −2 2 4 6 8 10 12 y x = −12 1 1.2 1.5 2 3 6 −6 −3 −2 −1.5 −1.2 −1 Plot the points to draw the graph. y –12–10 –8 –6 –4 –2 0 2 4 6 8 10 12 12 10 8 6 4 2 –2 –4 –6 –8 –10 –12 xy = −12 xy = −12 x Notice that the graph of xy = −12 is in the top left and bottom right quadrants. This is because the value of the constant term (a in the equation y x = a ) is negative. When a is a positive value, the hyperbola will be in the top right and bottom left quadrants. To plot the graph of a reciprocal relationship: • complete a table of values (often some of the values will be given) • rule the axes and label them • plot the (x, y) values from the table of values • join the points with a smooth curve • write the equation on both parts of the graph. The quadrants are labelled in an anti-clockwise direction. The co-ordinates of any point in the first quadrant will always be positive. y x First quadrant Second quadrant Third quadrant Fourth quadrant e s s - R e v i e w C o p y - C a m b r i d g e U n i v e r s i t y P r e s s - R e v i e w C o p y R e v i e w C o p y - C a m b r i d g e U n i v e r s i t y P r e s s - R e v i e w C o p y R e v i e w C o p y - C a m b r i d g e U n i v e r s i t y P r e s s - R e v i e w C o p y R e v i e w C o p y - C a m b r i d g e U n i v e r s i t y Copyright Material - Review Only - Not for Redistribution
- 436. Unit 5: Algebra Cambridge IGCSE Mathematics 426 Sketching graphs of reciprocal functions As with the parabola, you can use the features of the hyperbola (reciprocal function) to sketch the graph. When the equation is in standard form y = a x + q (x ≠ 0, y ≠ 0) follow these steps to sketch the graph. Step 1: Identify the shape of the graph. The value of a determines where the curves will be on the graph. If a 0, the y values are positive for positive xvalues and negative for negative x. If a 0, the y values are negative for positive xvalues and positive for negative x. x y when a0 x y when a0 Step 2: Work out whether the graph intercepts the x-axis using q. If q ≠ 0, the graph will have one x-intercept. Make y = 0 to find the value of the x-intercept. 0 = a x + q So, −q = a x −qx = a x = − a q Step 3: Determine the asymptotes. One asymptote is the y-axis (the line x = 0). The other is the line y = q. Step 4: Using the asymptotes and the x-intercept, sketch and label the graph. The graph doesn’t intercept the y-axis. If q = 0, the x-axis is the other asymptote. Worked example 7 Sketch and label the graph of y = 3 x + 3 Position of the curves: a = 3, so a 0 and the right hand curve is higher. Asymptotes: x = 0 y = −3 x-intercept: 0 = 3 x + 3 −3 = 3 x x = −1 x-intercept (−1, 0) x y –1 0 y = y = 3 3 x + 3 3 e s s - R e v i e w C o p y - C a m b r i d g e U n i v e r s i t y P r e s s - R e v i e w C o p y R e v i e w C o p y - C a m b r i d g e U n i v e r s i t y P r e s s - R e v i e w C o p y R e v i e w C o p y - C a m b r i d g e U n i v e r s i t y P r e s s - R e v i e w C o p y R e v i e w C o p y - C a m b r i d g e U n i v e r s i t y Copyright Material - Review Only - Not for Redistribution
- 437. Unit 5: Algebra 427 18 Curved graphs Exercise 18.4 1 Copy and complete the following tables giving values of y correct to 1 decimal place. Use the points to plot each graph on a separate set of axes. a x −6 −4 −3 −2 −1 1 2 3 4 6 y x = 2 b x −5 −4 −3 −2 −1 1 2 3 4 5 y x = −1 c x −6 −4 −3 −2 −1 1 2 3 4 6 y x = −6 d x −6 −4 −3 −2 −1 1 2 3 4 6 y x = 4 2 Sketch and label the following graphs on separate sets of axes. a y = 3 x b xy = −4 c y = 1 x + 3 d 2y = 4 x + 7 e y = 4 x + 2 f y = − 9 x − 3 Applying your skills 3 A person makes a journey of 240km. The average speed is x km/h and the time the journey takes is y hours. a Complete this table of corresponding values for x and y: x 20 40 60 80 100 120 y 12 4 2 b On a set of axes, draw a graph to represent the relationship between x and y. c Write down the relation between x and y in its algebraic form. 4 Investigate what happens when the equation of a graph is y = 1 2 x . a Copy and complete the table of values for x-values between −4 and 4. x −4 −3 −2 −1 − 1 2 1 2 1 2 3 4 y b Plot the points to draw the graph. c How does your graph differ from the hyperbola? d Why do we not use x = 0 in the table of values? e What are the asymptotes of the graph you have drawn? f As with the hyperbola, the standard form y = 1 2 x + q can be used to work out the asymptotes. Given y = 1 2 x + 3, what would the asymptotes be? g Use what you have learned in your investigation to sketch the graphs of: i y = − 1 2 x (ii) y = x−2 + 2 Rewrite the equation in standard form before you sketch the graph. E E e s s - R e v i e w C o p y - C a m b r i d g e U n i v e r s i t y P r e s s - R e v i e w C o p y R e v i e w C o p y - C a m b r i d g e U n i v e r s i t y P r e s s - R e v i e w C o p y R e v i e w C o p y - C a m b r i d g e U n i v e r s i t y P r e s s - R e v i e w C o p y R e v i e w C o p y - C a m b r i d g e U n i v e r s i t y Copyright Material - Review Only - Not for Redistribution
- 438. Unit 5: Algebra Cambridge IGCSE Mathematics 428 18.3 Using graphs to solve quadratic equations Suppose you were asked to solve the equation x x 2 3 1 x x 3 1 x x 0 x x − − x x 3 1 − − 3 1 x x 3 1 x x − − 3 1= . To do this, you would need to find the value or values of x that make x x 2 3 1 x x 3 1 x x x x − − x x 3 1 − − 3 1 x x 3 1 x x − − 3 1 equal to 0. You can try to do this by trial and error, but you will find that the value of x you need is not a whole number (in fact, it lies between the values of 3 and 4). It is much quicker and easier to draw the graph of the equationy x = − y x = − y x2 3 1 x 3 1 − 3 1 and to use that to find a solution to the equation. Here is the graph: The solution to the equation is the point (or points) where y = 0, in other words you are looking for the value of x where the graph crosses the x-axis. If you look at the graph you can see that it crosses the x-axis in two places. The value of x at these points is 3.3 and −0.3. These two values are sometimes referred to as the roots of the equation x x 2 3 1 x x 3 1 x x 0 x x − − x x 3 1 − − 3 1 x x 3 1 x x − − 3 1= . You can use the graph to find the solution of the equation for different values of x. Work through the worked example carefully to see how to do this. Use a sharp pencil. You will be able to correct your work more easily and it will be more accurate when looking at intersections. –2 –1 0 1 2 3 4 5 –4 –2 2 4 6 8 10 x = –0.3 x = 3.3 x y y x x = − − 2 3 1 In summary, to solve a quadratic equation graphically: • read off the x co-ordinates of any points of intersection for the given y-values • you may need to rearrange the original equation to do this. Worked example 8 This is the graph of y x = − y x = − y x2 2 7 x 2 7 − 2 7. Use the graph to solve the equations: a x x 2 x x x x 2 7 x x 2 7 x x 0 x x − − x x 2 7 − − 2 7 x x 2 7 x x − − 2 7 = b x x 2 x x x x 2 7 x x 2 7 x x 3 x x − − x x 2 7 − − 2 7 x x 2 7 x x − − 2 7 = c x x 2 x x x x 2 1 x x 2 1 x x x x − = x x 2 1 − = 2 1 x x 2 1 x x − = 2 1 c Rearrange the equation x x 2 x x x x 2 1 x x 2 1 x x x x − = x x 2 1 − = 2 1 x x 2 1 x x − = 2 1 so that the left-hand side matches the equation whose graph you are using. Subtracting 7 from both sides, you get x x 2 x x x x 2 7 x x 2 7 x x 1 7 x x − − x x 2 7 − − 2 7 x x 2 7 x x − − 2 7 = − 1 7 = − 1 7, that is x x 2 x x x x 2 7 x x 2 7 x x 6 x x − − x x 2 7 − − 2 7 x x 2 7 x x − − 2 7 = − . You can now proceed as you did in parts a and b. Find the points on the curve that have a y co-ordinate of –6; they are marked S and T on the graph. The x co-ordinates of S and T are –0.4 and 2.4 The solutions of the equation x x 2 x x x x 2 1 x x 2 1 x x x x − = x x 2 1 − = 2 1 x x 2 1 x x − = 2 1 are x = −0.4 and x = 2.4 –3 –2 –1 1 2 3 4 5 –8 –6 –4 –2 0 2 4 6 8 x y Q P A B S T y = 3 y = –6 y = x2 − 2x − 7 a Since this is the graph of y x = − y x = − y x2 2 7 x 2 7 − 2 7, simply find the points on the curve that have a y co-ordinate of 0 (i.e. where the curve cuts the x-axis). There are two such points, marked A and B on the graph. The x co-ordinates of these points are –1.8 and 3.8, so the solutions of the equation x x 2 x x x x 2 7 x x 2 7 x x 0 x x − − x x 2 7 − − 2 7 x x 2 7 x x − − 2 7 = are x = −1.8 and x = 3.8 b Find the points on the curve that have a y co-ordinate of 3. (Draw in the horizontal line y = 3 to help with this.) There are two such points, marked P and Q, on the graph. The x co-ordinates of these points are –2.3 and 4.3, so the solutions of the equation x x 2 x x x x 2 7 x x 2 7 x x 3 x x − − x x 2 7 − − 2 7 x x 2 7 x x − − 2 7 = are x = −2.3 and x = 4.3 e s s - R e v i e w C o p y - C a m b r i d g e U n i v e r s i t y P r e s s - R e v i e w C o p y R e v i e w C o p y - C a m b r i d g e U n i v e r s i t y P r e s s - R e v i e w C o p y R e v i e w C o p y - C a m b r i d g e U n i v e r s i t y P r e s s - R e v i e w C o p y R e v i e w C o p y - C a m b r i d g e U n i v e r s i t y Copyright Material - Review Only - Not for Redistribution
- 439. Unit 5: Algebra 429 18 Curved graphs Exercise 18.5 1 Use this graph of the relationship y = x2 − x − 2 to solve the following equations: a x x 2 2 0 − − x x − − x x 2 0 2 0 b x x 2 2 6 − − x x − − x x 2 6 2 6 c x x 2 6 − = x x − = x x –3 –2 –1 1 2 3 4 –2 –4 0 2 4 6 8 10 x y y x x = − − 2 2 2 a Construct a table of values for y = −x2 − x + 1 for values −3 x 2. b Plot the points on a grid and join them with a smooth curve. c Use your graph to solve the equation − − + = x x − − x x − − 2 1 0 + = 1 0 + = . Give your answer correct to 1 decimal place. 3 Solve the following equations by drawing suitable graphs over the given intervals. a x x 2 3 0 − − x x − − x x 3 0 3 0 (−3 x 4) b x x 2 3 1 x x 3 1 x x 0 + + x x + + x x 3 1 + + 3 1 x x 3 1 x x + + 3 1= (−4 x 1) 4 a Use an interval of −2 x 4 to draw the graph y x x y x = − y x 4 2 y x 4 2 y x y x = − y x 4 2 y x = − + 4 2 2 4 2 4 2 . b Use the graph to solve the following equations: i 0 4 2 2 = − 0 4 = − 0 4 + x x 2 x x + x x ii 0 2 2 0 2 0 2 0 2 = − 0 2 0 2 0 2 x x 0 2 x x 0 2 0 2 0 2 x x 5 a Draw the graph of y x x = − − y x = − − y x2 2 4 x 2 4 = − − 2 4 = − − x = − − 2 4 = − − for values of x from −3 to 5. b Use your graph to find approximate solutions to the equations: i x x 2 2 4 x x 2 4 x x 0 x x − − x x 2 4 − − 2 4 x x 2 4 x x − − 2 4 = ii x x 2 2 4 x x 2 4 x x 3 x x − − x x 2 4 − − 2 4 x x 2 4 x x − − 2 4 = iii x x 2 2 4 x x 2 4 x x 1 x x − − x x 2 4 − − 2 4 x x 2 4 x x − − 2 4 = − 18.4 Using graphs to solve simultaneous linear and non-linear equations As you did with linear equations, you can use graphs to solve a linear and a non-linear equation, or two non-linear equations simultaneously. In chapter 14 you learned how to use the point of intersection of two straight lines to find the solutions to simultaneous linear equations. Revise that section now if you cannot remember how to do this. REWIND E e s s - R e v i e w C o p y - C a m b r i d g e U n i v e r s i t y P r e s s - R e v i e w C o p y R e v i e w C o p y - C a m b r i d g e U n i v e r s i t y P r e s s - R e v i e w C o p y R e v i e w C o p y - C a m b r i d g e U n i v e r s i t y P r e s s - R e v i e w C o p y R e v i e w C o p y - C a m b r i d g e U n i v e r s i t y Copyright Material - Review Only - Not for Redistribution
- 440. Unit 5: Algebra Cambridge IGCSE Mathematics 430 Worked example 9 The graphs of y = 2 + x and y x = − y x = − y x2 3 4 x 3 4 + 3 4 have been drawn on the same set of axes. Use the graphs to find the x-values of the points of intersection of the line and the curve. –1 1 2 3 4 0 2 4 6 8 x y y x = + 2 y x x = − + 2 3 4 The co-ordinates of the two points of intersection are approximately (0.6, 2.6) and (3.4, 5.4), so the x-values of the points of intersection are x = 0.6 and x = 3.4 Worked example 10 The diagram shows the graphs of y x = 8 and y = x for positive values of x. y x = y = 5 7 . 1 2 3 4 5 6 7 8 0 1 2 3 4 5 6 7 8 x y A B y x = 8 a Use the graph of y x = 8 to solve the equation 8 5 7 x = 5 7 5 7 b Find a value of x such that 8 x x = . a You have to find a point on the curve that has a y co-ordinate of 5.7. Draw the line y = 5.7 to help find this it will be where the line cuts the curve. The point is marked A on the diagram. Its x co-ordinate is 1.4, so the solution of the equation 8 5 7 x = 5 7 5 7 is x = 1.4 b The straight line y = x crosses the curve y x = 8 at the point B, with x co-ordinate is 2.8. Hence, a value of x such that 8 x x = is 2.8 Tip You might also be asked for the y-values, so it is important to pair up the correct x-value with the correct y-value. When x = 0.6, y = 2.6 and when x = 3.4, y = 5.4. E e s s - R e v i e w C o p y - C a m b r i d g e U n i v e r s i t y P r e s s - R e v i e w C o p y R e v i e w C o p y - C a m b r i d g e U n i v e r s i t y P r e s s - R e v i e w C o p y R e v i e w C o p y - C a m b r i d g e U n i v e r s i t y P r e s s - R e v i e w C o p y R e v i e w C o p y - C a m b r i d g e U n i v e r s i t y Copyright Material - Review Only - Not for Redistribution
- 441. Unit 5: Algebra 431 18 Curved graphs E Exercise 18.6 1 Find the points of intersection of the graphs and thus give the solution to the simultaneous equations. a 1 2 3 4 5 –3 –2 –1 1 2 3 x y y x2 = y x = + 2 0 b 1 2 3 4 5 –3 –2 –1 1 2 3 x y y x2 = y = 4 0 c 1 2 3 4 5 –3 –2 –1 1 2 3 x y y x2 = x y + =2 0 d 1 2 3 4 5 –3 –2 –1 0 1 2 3 x y y x = 2 3x − 4y + 2 = 0 2 Find the points of intersection of the following graphs by drawing the graphs. a y x y x y x2 and y = 3x b y = x and y x = 2 c y = 2 − x and y x = − y x = − y x2 5 6 x 5 6 + 5 6 3 Use a graphical method to solve each pair of simultaneous equations: a y x = − y x = − y x2 8 9 x 8 9 + 8 9 and y = 2x + 1 b y x x = − y x = − y x − 2 6 and y = 2 + x c y = 4x + 4 and y x x y x = − y x + 2 3 y x 2 3 y x = − 2 3 y x = − 2 3 y x = − 2 4 Show graphically that there is no value of x which satisfies the pair of equations y = −4 and y x = + y x = + y x2 = + = + 2 3 x 2 3 + 2 3 simultaneously. 18.5 Other non-linear graphs So far you have learned how to construct a table of values and draw three different kinds of graphs: • linear graphs (straight lines of equations in form of y = mx + c) • quadratic graphs (parabolas of equations in the form of y x = + y x = + y x2 = + = + a b x a b + a b) • reciprocal graphs (hyperbolas of equations in the form of y x = a ) In this section you are going to apply what you already know to plot and draw graphs formed by higher order equations (cubic equations) and those formed by equations that have combinations of linear, quadratic, reciprocal and cubic terms. e s s - R e v i e w C o p y - C a m b r i d g e U n i v e r s i t y P r e s s - R e v i e w C o p y R e v i e w C o p y - C a m b r i d g e U n i v e r s i t y P r e s s - R e v i e w C o p y R e v i e w C o p y - C a m b r i d g e U n i v e r s i t y P r e s s - R e v i e w C o p y R e v i e w C o p y - C a m b r i d g e U n i v e r s i t y Copyright Material - Review Only - Not for Redistribution
- 442. Unit 5: Algebra Cambridge IGCSE Mathematics 432 Plotting cubic graphs A cubic equation has a term with an index of three as the highest power of x. In other words, one of the terms is ax3 . For example, y x y x y x 2 y x y x3 , y x y x = − y x + + 3 2 + + 3 2 2 3 x 2 3 + + 2 3 + + x + + 2 3 + + 3 2 2 3 3 2 + + 3 2 + + 2 3 + + 3 2 x + + 3 2 + + 2 3 + + 3 2 + + and y x x y x = − y x 2 4 y x 2 4 y x = − 2 4 y x = − 2 4 y x = − 3 2 4 2 4 are all cubic equations. The simplest cubic equation is y x y x y x3 . Cubic equations produce graphs called cubic curves. The graphs you will draw will have two main shapes: If the coefficient of the x3 term is positive, the graph will take one of these shapes. If the coefficient of the x3 term is negative, the graph will be take one of these shapes. Sketching cubic functions You’ve seen that you can sketch a parabola if you know certain features of the graph. You can also sketch cubic functions if you know the following features: • The basic shape of the graph. This is determined by the highest power of the graph. • The orientation of the graph. This is determined by the sign of the coefficient of the term with the highest power. • The y-intercept. This is determined by substituting x = 0 into the equation. • The x-intercepts. When the cubic equation is given in factor form (for example y = (x + a) (x + b)(x + c), you can let y = 0 and solve for x. A cubic graph may have three, two or one x-intercepts. • The turning point/s of the graph. To find the turning points of a cubic function you need to use the differentiation techniques you will learn later in this chapter. For now, you need to remember that the graph of y = ax3 + bx2 + cx + d has two basic shapes depending on whether a 0 or a 0. You will learn more about how to work out the x-intercepts and turning points of a cubic function and use these to sketch cubic graphs later in this chapter when you deal with differentiation. In this section, you are going to use a table of values and plot points to draw some cubic graphs. If x is positive, then x3 is positive and −x3 is negative. If x is negative, then x3 is negative and −x3 is positive. Tip You are expected to deal with equations that have terms with indices that can be any whole number from −2 to 3. When you have to work with higher order equations, they will not contain more than three terms. Worked example 11 Complete the table of values and plot the points to draw the graphs on the same set of axes. a x −2 −1 0 1 2 y = x3 b x −2 −1 0 1 2 y = −x3 E Geophysicists use equations and graphs to process measurements (such as the rise or pressure of magma in a volcano) and use these to generalise patterns and make predictions. LINK e s s - R e v i e w C o p y - C a m b r i d g e U n i v e r s i t y P r e s s - R e v i e w C o p y R e v i e w C o p y - C a m b r i d g e U n i v e r s i t y P r e s s - R e v i e w C o p y R e v i e w C o p y - C a m b r i d g e U n i v e r s i t y P r e s s - R e v i e w C o p y R e v i e w C o p y - C a m b r i d g e U n i v e r s i t y Copyright Material - Review Only - Not for Redistribution
- 443. Unit 5: Algebra 433 18 Curved graphs Worked example 12 Draw the graph of the equation y = x3 − 6x for –3 x 3. Construct a table of values for whole number values of x first. Put each term in a separate row. Add the columns to find y = x3 − 6x. (Remember not to add the top row when calculating y.) x −3 −2 −1 0 1 2 3 x3 −27 −8 −1 0 1 8 27 − 6x 18 12 6 0 −6 −12 −18 y = x3 − 6x −9 4 5 0 −5 −4 9 Construct a separate table for ‘half values’ of x. x −2.5 −1.5 −0.5 0.5 1.5 2.5 x3 −15.625 −3.375 −0.125 0.125 3.375 15.625 − 6x 15 9 3 −3 −9 −15 y = x3 − 6x −0.625 5.625 2.875 −2.875 −5.625 0.625 As the value of x increases, the values of x3 increase rapidly and it becomes difficult to fit them onto the graph. If you have to construct your own table of values, stick to low numbers and, possibly, include the half points (0.5, 1.5, etc.) to find more values that will fit onto the graph. a b x −2 −1 0 1 2 y = x3 −8 −1 0 1 8 x −2 −1 0 1 2 y = −x3 8 1 0 −1 −8 x y –2 –1 0 1 2 –8 –6 –4 –2 2 4 6 8 y x = 3 y x = − 3 E e s s - R e v i e w C o p y - C a m b r i d g e U n i v e r s i t y P r e s s - R e v i e w C o p y R e v i e w C o p y - C a m b r i d g e U n i v e r s i t y P r e s s - R e v i e w C o p y R e v i e w C o p y - C a m b r i d g e U n i v e r s i t y P r e s s - R e v i e w C o p y R e v i e w C o p y - C a m b r i d g e U n i v e r s i t y Copyright Material - Review Only - Not for Redistribution
- 444. Unit 5: Algebra Cambridge IGCSE Mathematics 434 Worked example 13 a Draw the graph of the equation y = x3 − 2x2 − 1 for –1 x 3. b Use the graph to solve the equations: i x3 − 2x2 − 1 = 0 ii x3 − 2x2 = −1 iii x3 − 2x2 − 5 = 0. a Construct a table of values of y for whole and half values x. x −1 −0.5 0 0.5 1 1.5 2 2.5 3 x3 −1 −0.125 0 0.125 1 3.375 8 15.625 27 − 2x2 −2 −0.5 0 −0.5 −2 −4.5 −8 −12.5 −18 −1 −1 −1 −1 −1 −1 −1 −1 −1 −1 y = x3 − 2x2 − 1 −4 −1.625 −1 −1.375 −2 −2.125 −1 2.125 8 Plot the points against the axes and join them with a smooth curve. x y –3 –2 –1 0 1 2 3 –8 –6 –4 –2 2 4 6 8 y x x = − 3 6 Using graphs to solve higher order equations You can use cubic graphs to find approximate solutions to equations. The following worked example shows how to do this. E e s s - R e v i e w C o p y - C a m b r i d g e U n i v e r s i t y P r e s s - R e v i e w C o p y R e v i e w C o p y - C a m b r i d g e U n i v e r s i t y P r e s s - R e v i e w C o p y R e v i e w C o p y - C a m b r i d g e U n i v e r s i t y P r e s s - R e v i e w C o p y R e v i e w C o p y - C a m b r i d g e U n i v e r s i t y Copyright Material - Review Only - Not for Redistribution
- 445. Unit 5: Algebra 435 18 Curved graphs Exercise 18.7 1 Construct a table of values from −3 x 3 and plot the points to draw graphs of the following equations. a y x y x y x 2 y x y x3 b y x y x = − y x 3 y x y x3 c y x = − y x = − y x3 2 d y x = + y x = + y x 3 2 y x 3 2 y x = + 3 2 = + y x = + y x 3 2 y x = + 3 e y x x = − y x = − y x3 2 x 3 2 2 3 2 3 2 f y x x y x = − y x + 2 4 y x 2 4 y x = − 2 4 y x = − 2 4 y x = − 1 3 2 4 2 4 g y x x y x = − y x + − x + − 3 2 + − 3 2 + − x + − 3 2 + −9 h y x x = − y x = − y x3 2 2 1 x 2 1 + 2 1 3 2 2 1 3 2 x 3 2 2 1 3 2 2 a Copy and complete the table of values for the equation y x x x = − y x = − y x3 2 6 8 x x 6 8 x x + 6 8 x x x x 6 8 3 2 6 8 3 2 x x 3 2 6 8 3 2 . (You may want to add more rows to the table as in the worked examples.) x −1 −0.5 0 0.5 1.5 1 2.5 3 3.5 4 4.5 5 y x x x = − y x = − y x3 2 6 8 x x 6 8 x x + 6 8 x x x x 6 8 3 2 6 8 3 2 x x 3 2 x x 6 8 3 2 −15 −5.6 b On a set of axes, draw the graph of the equation y x x x = − y x = − y x3 2 6 8 x x 6 8 x x + 6 8 x x x x 6 8 3 2 6 8 3 2 x x 3 2 6 8 3 2 for –1 x 5. c Use the graph to solve the equations: i x x x 3 2 x x 3 2 x x 6 8 x x 6 8 x x 3 2 6 8 3 2 0 x x − + x x 3 2 − + x x 3 2 − + 3 2 6 8 − + 6 8 x x 6 8 x x − + 6 8 3 2 6 8 3 2 − + 6 8 x x 3 2 6 8 x x 3 2 − + 3 2 x x 6 8 3 2 = ii x x x 3 2 x x 3 2 x x 6 8 x x 6 8 x x 3 2 6 8 3 2 3 x x − + x x 3 2 − + x x 3 2 − + 3 2 6 8 − + 6 8 x x 6 8 x x − + 6 8 3 2 6 8 3 2 − + 6 8 x x 3 2 6 8 x x 3 2 − + 3 2 x x 6 8 3 2 = 3 a Draw the graphs of y x = 3 10 and y x x = − y x = − y x 6 y x y x y x = − y x = − 2 for −4 x 6. b Use the graphs to solve the equation x x x 3 2 10 6 0 x x 6 0 x x + − x x + − x x 2 + −6 0 6 0 Graphs of equations with combinations of terms When you have to plot graphs of equations with a combination of linear, quadratic, cubic, reciprocal or constant terms you need to draw up a table of values with at least eight values of x to get a good indication of the shape of the graph. Before drawing the axes, check the range of y-values required from your table. E b Plot the points on the axes to draw the curve. i To solve x3 − 2x2 − 1 = 0, find the point(s) on the curve that have a y co-ordinate of 0 (i.e. where the curve cuts the x-axis). There is only one point (A on the graph). The x co-ordinate of A is 2.2, so the solution of x3 − 2x2 − 1 = 0 is x = 2.2 ii To solve x3 − 2x2 = −1, rearrange the equation so that the left-hand side is the same as the equation you have just drawn the graph for. Subtracting 1 from both sides gives x3 − 2x2 − 1 = −2. Now find the point(s) on the curve that have a y co-ordinate of −2 (draw the line y = −2 to help with this). There are three points (B1 , B2 and B3 on the graph). The x co-ordinates of these points are the solutions of the equation. So the solutions of x3 − 2x2 = −1 are x = −0.6, x = 1 and x = 1.6 iii Rearrange the equation x3 − 2x2 − 5 = 0 so you can use the graph of y = x3 −2x2 − 1 to solve it. Adding 4 to both sides of the equation, you get x3 − 2x2 − 1 = 4. Find the point(s) on the curve that have a y co-ordinate of 4 (draw the line y = 4 to help with this). There is only one point (C on the graph). At C the x co-ordinate is 2.7. The approximate solution is, therefore, x = 2.7 x y –1 1 2 3 –4 –2 0 2 4 6 8 B B B A 1 C 2 3 y x x = − − 3 2 2 1 e s s - R e v i e w C o p y - C a m b r i d g e U n i v e r s i t y P r e s s - R e v i e w C o p y R e v i e w C o p y - C a m b r i d g e U n i v e r s i t y P r e s s - R e v i e w C o p y R e v i e w C o p y - C a m b r i d g e U n i v e r s i t y P r e s s - R e v i e w C o p y R e v i e w C o p y - C a m b r i d g e U n i v e r s i t y Copyright Material - Review Only - Not for Redistribution
- 446. Unit 5: Algebra Cambridge IGCSE Mathematics 436 Worked example 14 Complete this table of values for the equation y x x = + y x = + = + y x = + y x 2 y x y x = + = + y x = + y x = + 1 for 0.5 x 7 and draw the graph. x 0.5 1 2 3 4 5 6 7 2x 1 2 4 6 8 10 12 14 1 x y = 2x + 1 x x 0.5 1 2 3 4 5 6 7 2x 1 2 4 6 8 10 12 14 1 x 2 1 0.5 0.33 0.25 0.2 0.17 0.14 y = 2x + 1 x 3 3 4.5 6.33 8.25 10.2 12.17 14.14 0 1 2 3 4 5 6 7 8 5 10 15 20 y x y x x = + 2 1 Worked example 15 Complete this table of values and plot the graph of y x x = − y x = − y x3 1 for 0.2 x 3. x 0.2 0.5 1 1.5 2 2.5 3 x3 0.008 1 8 27 − 1 x y x x = − x = − 3 1 −5.0 E e s s - R e v i e w C o p y - C a m b r i d g e U n i v e r s i t y P r e s s - R e v i e w C o p y R e v i e w C o p y - C a m b r i d g e U n i v e r s i t y P r e s s - R e v i e w C o p y R e v i e w C o p y - C a m b r i d g e U n i v e r s i t y P r e s s - R e v i e w C o p y R e v i e w C o p y - C a m b r i d g e U n i v e r s i t y Copyright Material - Review Only - Not for Redistribution
- 447. Unit 5: Algebra 437 18 Curved graphs Exercise 18.8 1 Construct a table of values for −3 x 3 (including negative and positive values of 0.5 and 0.2) for each equation and draw the graph. a y x x = + y x = + y x = + y x = + y x − 3 y x y x = + = + y x = + y x = + 2 2 b y x x = − y x = − y x 3 y x y x y x = − y x = − 1 c y x x x y x = − y x + + x + + 2 + + + + 2 d y x x y x = − y x − + 3 2 1 − + 2 1 − + x − + 2 1 − + (omit the fractional values in this case) Exponential graphs Exponential growth is found in many real life situations where a quantity increases by a constant percentage in a particular time: population growth and compound interest are both examples of exponential growth. Equations in the general form of y x = a (where a is a positive integer) are called exponential equations. The shape of y x = a is a curve which rapidly rises as it moves from left to right; this is exponential growth. As x becomes more negative, the curve gets closer and closer to the x-axis but never crosses it. The x-axis is an asymptote. The shape of y x = − a is a curve which falls as it moves from left to right; this is exponential decay. An exponential graph in the form of y = ax will always intersect the y-axis at the point (0, 1) because a0 = 1 for all values of a. (You should remember this from the laws of indices.) Euler’s number, e = 2.71. . . , is so special that y x = e is known as the exponential function rather than an exponential function. x 0.2 0.5 1 1.5 2 2.5 3 x3 0.008 0.125 1 3.375 8 15.625 27 − 1 x −5 −2 −1 −0.667 −0.5 −0.4 −0.33 y = x3 − 1 x −5.0 −1.9 0 2.7 7.5 15.2 26.7 Round the y-values in the last row to 1 decimal place or it will be difficult to plot them. 1 2 3 –10 0 10 20 30 x y x y = x3 − 1 You learned about exponential growth and decay and applied a formula to calculate growth in chapter 17. REWIND E e s s - R e v i e w C o p y - C a m b r i d g e U n i v e r s i t y P r e s s - R e v i e w C o p y R e v i e w C o p y - C a m b r i d g e U n i v e r s i t y P r e s s - R e v i e w C o p y R e v i e w C o p y - C a m b r i d g e U n i v e r s i t y P r e s s - R e v i e w C o p y R e v i e w C o p y - C a m b r i d g e U n i v e r s i t y Copyright Material - Review Only - Not for Redistribution
- 448. Unit 5: Algebra Cambridge IGCSE Mathematics 438 Worked example 16 a Complete the table of values for y = 2x for −2 x 4 and draw the graph. x −2 −1.5 −1 −0.5 0 1 2 3 4 y = 2x b Use the graph to find the value of 22.5 and check your result using the fact that 2 2 2 2 5 2 2 2 5 2 2 5 5 2 2 2 2 5 2 2 2 5 = = 2 2 = = 2 22 = = . a x −2 −1.5 −1 −0.5 0 1 2 3 4 y = 2x 0.25 0.35 0.5 0.71 1 2 4 8 16 Plot the points to draw the graph. b From the graph you can see that when x = 2.5 the value of y is 5.7, so, 2 5 7 2. 2 5 2. 2 5. 5 2 5 2 5 2 5 2 5 Check: 2 2 2 3 2 32 5 656 2 5 2 2 2 5 2 2 5 2 3 2 3 5 2 2 2 2 5 2 2 2 5 . . . . = = 2 2 = = 2 22 = = = = 2 3 = = 2 3 2 3 = = 2 5 = = 2 5 5 10 15 20 x y –2 –1 0 1 2 3 4 y x = 2 Exercise 18.9 1 a Draw the graph of y x = 3 for x-values between −2 and 3. Give the values to 2 decimal places where necessary. b On the same set of axes draw the graph of y x = 3− for x-values between −3 and 2. Give the values to 2 decimal places where necessary. c What is the relationship between the graph of y x = 3 and y x = 3− ? 2 The graph of y x = 10 for −0.2 x 1.0 is shown here. 0 2 4 6 8 10 x y –0.2 0.2 0.4 0.6 0.8 1 y x =10 E e s s - R e v i e w C o p y - C a m b r i d g e U n i v e r s i t y P r e s s - R e v i e w C o p y R e v i e w C o p y - C a m b r i d g e U n i v e r s i t y P r e s s - R e v i e w C o p y R e v i e w C o p y - C a m b r i d g e U n i v e r s i t y P r e s s - R e v i e w C o p y R e v i e w C o p y - C a m b r i d g e U n i v e r s i t y Copyright Material - Review Only - Not for Redistribution
- 449. Unit 5: Algebra 439 18 Curved graphs Use the graph to find the value of: a 100.3 b 10−0.1 c Copy the diagram using tracing paper and draw a straight line graph that will allow you solve the equation 10 8 5 x x = − 8 5 = − 8 5 . 3 Mae finds the following explanation on the internet. y = 1 y - intercept = a + q a = 1, q = 1 Note: a = 1, b = 2 1 + 1 = 2 y = 2x + 1 Asymptote y = q = 1 graph above y = 1 a 0, so curve slopes upto the right Understanding exponential graphs standard equation: y = abx + q (b 0, b ≠1) (0, 2) x y q = 1 a Read the information carefully and write a step-by-step set of instructions for sketching an exponential graph. b Sketch and label the following graphs. i y = −3x ii y = 3x − 4 iii y = −2x + 1 Applying your skills 4 Bacteria multiply rapidly because a cell divides into two cells and then those two cells divide to each produce two more cells and so on. The growth rate is exponential and we can express the population of bacteria over time using the formula P = 2t (t is the period of time). 1 2 4 8 The graph shows the increase in bacteria numbers in a six-hour period. P P P t = 2 The increase in the number of bacteria over 6 hours 0 1 2 3 4 5 6 7 Time (t hours) t 10 20 30 40 50 60 70 Population (P) E e s s - R e v i e w C o p y - C a m b r i d g e U n i v e r s i t y P r e s s - R e v i e w C o p y R e v i e w C o p y - C a m b r i d g e U n i v e r s i t y P r e s s - R e v i e w C o p y R e v i e w C o p y - C a m b r i d g e U n i v e r s i t y P r e s s - R e v i e w C o p y R e v i e w C o p y - C a m b r i d g e U n i v e r s i t y Copyright Material - Review Only - Not for Redistribution
- 450. Unit 5: Algebra Cambridge IGCSE Mathematics 440 a How many bacteria are there after one hour? b How long does it take for the number of bacteria to exceed 40 cells? c How many cells will there be after six hours? d When would you expect the population to exceed one million bacteria if it continued to grow at this rate? 5 The temperature of metal in a smelting furnace increases exponentially as indicated in the table. Draw a graph to show this data. Time (min) 0 1 2 3 4 Temp (°C) 5 15 45 135 405 6 The population of bedbugs in New York City is found to be increasing exponentially. The changes in population are given below. Time (months) 0 1 2 3 4 Population 1000 2000 4000 8000 16000 a Plot a graph to show the population increase over time. b When did the bedbug population reach 10000? c What will the bedbug population be after six months if it continues to increase at this rate? Recognising which graph to draw You need to be able to look at equations and identify which type of graph they represent. This table summarises what you have learned so far. Type of graph General equation Shape of graph Straight line (linear) y = mx + c Highest power of x is 1. When x = a the line is parallel to the y-axis and when y = b the line is parallel to the x-axis. Parabola (quadratic) y = x2 y = ax2 + bx + c Highest power of x is 2. Hyperbola (reciprocal) y a x = or xy = a Can also be y a x q = + 2 Cubic curve y = x3 y = ax3 + bx2 + cx + d Highest power of x is 3. Exponential curve y = ax or y = a−x Can also be y = abx + q Combined curve (linear, quadratic, cubic and/or reciprocal) Up to three terms of: y ax bx cx x c d x e = + y a = + y ax b = + x b + + x c + + x cx + + x c x c + + + 3 2 x b 3 2 x bx c 3 2 x c x b = + x b 3 2 x b = + These figures look different to the on