Improving Healthcare Operations Using Process Data Mining
Download as PPTX, PDF2 likes4,351 views

The document outlines a comprehensive approach to improving healthcare delivery through data-informed methodologies, focusing on process mining and analysis of diverse healthcare data streams. It discusses the importance of integrating various data sources for operational efficiency, capacity planning, and enhancing patient outcomes while emphasizing the need for real-time monitoring and predictive analytics. Key capabilities include data integration, statistical analysis, and machine learning to optimize workflows and reduce costs in healthcare settings.


![44
Data Integration: Ingest any text data
4
MSH|^~&|EPIC|MGH||MGH|20150324190937|OHEDSCRIBE|ADT^A08|725
467|T|2.3|||||||||
………
PID|1||12345^^^EPI^MR||LUCUS^STEPHANEY||19751225|M|||^^^^^US^P
|||||||6100215419|999-99-9999|||||||||||N||
........
<recordTarget>
<patientRole>
<id extension="12345" root="PlaceholderOrganization" />
<addr use="HP”>
<streetAddressLine>180 Fake Road</streetAddressLine>
<city>Providence</city>
<state>RI</state>
<postalCode>02912</postalCode>
<country>US</country>
</addr>
<telecom use="WP" value="tel:+1-401-867-7949" />
<patient>
<name>
<given>Stephaney</given>
<family>Lucus</family>
</name>
<administrativeGenderCode code="F" codeSystem="2.16.840.1.113883.3.560.100.2"
displayName="Male" />
{
"resourceType": "Patient",
"identifier": [
{
"system": "urn:oid:1.2.36.146.595.217.0.1",
"value": "12345",
"period": {
"start": "2001-05-06"
}
}
],
"name": [
{
"use": "official",
"family": [”Lucus"],
"given": [”Stephaney”]
},
],
"gender": {
"coding": [
{
"system": "http://hl7.org/fhir/v3/AdministrativeGender",
"code": "M",
"display": "Male"
}
]
},
"birthDate": "1974-12-25",
"address": [
{
"use": "home",
"line": ["534 Erewhon St"],
"city": "PleasantVille",
"state": "Vic",
"zip": "3999"
}
]
}
Patient
identifier
name
telecom
gender
birthDate
deceased
address
maritalStatus
….
active](https://image.slidesharecdn.com/slprocessminingadrish-151008202758-lva1-app6891/85/Improving-Healthcare-Operations-Using-Process-Data-Mining-42-320.jpg)


Improving Healthcare Operations Using Process Data Mining
- 1. Copyright © 2015 Splunk Inc. Data Informed Healthcare Delivery Process Improvement
- 2. 2 Agenda Problem Background and Motivation Capabilities: Methodology Capabilities: Data Integration and Feature Engineering Capabilities: Statistics, Machine Learning, and Visualization Operational Integration Product Demonstration
- 3. 3 3 1. Get Ready 2. Travel by Car 3. Conference Starts 4. Join Reception 5. Have Dinner 6. Go Home 1. Get Ready 2. Travel by Car 3. Conference Starts 4. Give a Talk 5. Join Reception 6. Have Dinner 7. Go Home
- 4. 4 4 More Cases 1. Get Ready 2. Travel by Car 3. Conference Starts 4. Join Reception 5. Have Dinner 6. Go Home 7. Travel by Car 1. Get Ready 2. Travel by Car 3. Conference Starts 4. Give a Talk 5. Join Reception 6. Have Dinner 7. Go Home 8. Travel by Car 1. Get Ready 2. Travel by Air 3. Conference Starts 4. Give a Talk 5. Join Reception 6. Have Dinner 7. Go Home 8. Pay Parking 9. Travel by Car 1. Get Ready 2. Travel byTrain 3. Conference Starts 4. Join Reception 5. Have Dinner 6. Go Home 7. Pay Parking 8. Travel by Car
- 5. 5
- 6. 6 Generalized Information Flow Model for Chronic Care http://www.ncbi.nlm.nih.gov/pmc/articles/PMC3002133/
- 7. 7 Healthcare Delivery Workflow Examples #1
- 8. Healthcare Delivery Workflow Examples #2
- 10. 10 10 Process Mining Event Log Mining Techniques Mined Model 1. Start 2. Get Ready 3. Travel by Train 4. Beta Event Starts 5. Visit Brewery 6. Have Dinner 7. Go Home 8. Travel by Train 1. Start 2. Get Ready 3. Travel by Train 4. Beta Event Starts 5. Give a Talk 6. Visit Brewery 7. Have Dinner 8. Go Home 9. Travel by Train 1. Start 2. Get Ready 3. Travel by Car 4. Beta Event Starts 5. Give a Talk 6. Visit Brewery 7. Have Dinner 8. Go Home 9. Pay Parking 10. Travel by Car 1. Start 2. Get Ready 3. Travel by Car 4. Conference Starts 5. Join Reception 6. Have Dinner 7. Go Home 8. Pay Parking 9. Travel by Car 10. End Start Get Ready Travel by CarTravel by Train BETA PhD Day Starts Visit Brewery Have Dinner Go Home Travel by Train Pay for Parking Travel by Car End Give a Talk Start Get Ready Travel by Air Travel by Car Conference Starts Give a Talk Join Reception Have Dinner Go Home Travel by Train Travel by Car Pay Parking End
- 11. What is Process Mining? 1 Source: http://tinyurl.com/qzqtas8 Analyze Observed Behavior from event data and metadata to discover patterns, monitor compliance, and optimize workflow. Performance Analysis Auditing/Security Detect Bottlenecks, Deviations in Flow
- 12. 12 Process Mining Use Cases ACTION ORIENTED Redesign Process Adjust Parameters Intervene (ad-hoc problem solving) Support: Detect deviations and bottlenecks Support: Predict, Recommend GOAL ORIENTED Improve KPIs related to Time Improve KPIs related to Cost Improve KPIs related to Quality
- 13. 15 Why Process Mining? Traditional As-Is analysis of business processes strongly based on the opinion of process expert. The basic idea is to assemble an appropriate team and to organize modeling sessions in which the knowledge of the team members is used to build an adequate As- Is process model. Discover actual behavior of people, organization, and machines and relate to modeled behavior. Correlate millions of ad-hoc events showing how reality is different from perceptions, opinions, and beliefs. Provide clue for standardization and better prepare to handle ad-hoc events.
- 14. 16 Scheduling
- 15. 17 Waiting Time
- 18. 20
- 19. 21 Virtual Physical Cloud Healthcare Data is Time Oriented and Diverse 2 EHR Systems Web Services Developers App Support Telecoms Networking Desktops Servers Security Devices Storage Messaging Claims Clickstream HIE Patient Portals Healthcare Apps IT Systems and Med Devices Patient-Facing Data Medical Devices CDR Medical Records PHI Access Audit Logs HL7 Messaging Billing Departmental and Homegrown Applications
- 20. 22 Domains of Data Diversity in Health Data 2 Subjects Persons, Sensors, Actuators, Mobile Devices Information Users Clinical, Family, Patient System and Locations Home, Hospital, ER, Nursing Homes Ownership and Management
- 21. 23 Example of Events: Healthcare Services Entity ID Event ID Properties Timestamp Activity Resource 12345678 4798669 02/06/2015 14:00 Primary Care Visit Pete 4798670 04/06/2015 11:00 Surgery Rose 4798671 04/06/2015 12:00 Primary Care Visit Pete 4798672 04/06/2015 10:00 Chemotherapy John 4798673 04/06/2015 15:00 Evaluation Pete 98765432 5798670 03/06/2015 14:00 Primary Care Visit Pete 2
- 22. 24 Example of Events: Resources (Devices/Beds) Entity ID Event ID Properties Timestamp (creation) Patient identifier Begin time End time D1 4798669 02/06/2015 14:00 p1 14:00 15:00 4798670 04/06/2015 11:00 p2 15:15 16:30 4798671 04/06/2015 12:00 p3 16:45 17:00 4798672 04/06/2015 10:00 p4 17:15 18:00 4798673 04/06/2015 15:00 p5 18:15 19:00 D2 5798670 03/06/2015 14:00 p6 15:00 17:00 2
- 23. 25 Example of Events: Medications Entity ID Event ID Properties Timestamp NDCNUM Days Supply 12345678 4798669 02/06/2015 14:00 378214605 30 4798670 04/06/2015 11:00 378024301 60 4798671 04/06/2015 12:00 378024301 90 4798672 04/06/2015 10:00 378024301 90 4798673 04/06/2015 15:00 228202996 90 98765432 5798670 03/06/2015 14:00 378024301 60 2
- 24. 26 Example of Events: Lab Entity ID Event ID Properties Timestamp Key Value 12345678 4798669 02/06/2015 14:00 HbA1C 8% 4798670 04/06/2015 11:00 LDL 100 mg/dl 4798671 04/06/2015 12:00 HDL 50 mg/dl 4798672 04/06/2015 10:00 Systolic 110 4798673 04/06/2015 15:00 Diastolic 75 97865432 5798670 03/06/2015 14:00 HbA1C 9% 2
- 25. US Army Dental Command gain operational visibility and improve dental service delivery with Splunk • Integrate dental device logs, DICOM image metadata, and patient satisfaction surveys. • Alerts in case of anomalies. • Correlate wait time with patient satisfaction data and system performance degradations. • Faster identification of system capacity bottlenecks such as excessive wait time. • Proactively find unused resources and reallocate the resources. • Saved millions by not buying new devices but optimize the current resource allocations • Limited visibility into device bottlenecks and customer satisfaction factors. • Limited data for capacity planning and workflow optimization Key Challenges Key Splunk Functions Business Value
- 26. 28 Agenda Problem Background and Motivation Capabilities: Methodology Capabilities: Data Integration and Feature Engineering Capabilities: Statistics, Machine Learning, and Visualization Operational Integration Product Demonstration
- 28. 3
- 30. 3 Call for efficiency, consistency, and safety
- 31. 3 Towards a Learning Healthcare System
- 32. 3 A Connected Healthcare System
- 34. 36 Linking Data to Methods and Applications Persist, Repeat 3 Discovery Compliance Enhancement Post Mortem Pre Mortem De-facto/Discovered Process Flow: Flow, Rules, Resources Recommend next steps. Predict/Suggest Risks and likely future events Create rules and KPI from discovered process flow Monitor rules and KPI implemented in production Create alerts on non-compliance Data Method Application
- 35. 37 3 Real World Business Questions/Formulate Hypotheses Data Collection Data Preparation Modeling/Simulation Communication, Visualization Reports, Findings Evaluation Data Science for Process Mining in Action
- 36. 38 Process Mining Platform Real-Time Monitoring, Detection, and Predictions 38 Case Management Anomaly Detection, Linkage, Correlations/ Patterns Alerts Predictive Modeling/ Model Maintenance Healthcare Events Standard Reports/ Queries Data Warehouse Data Archival Rules System
- 37. 39 Agenda Problem Background and Motivation Capabilities: Methodology Capabilities: Data Integration and Feature Engineering Capabilities: Statistics, Machine Learning, and Visualization Operational Integration Product Demonstration
- 38. 40 Barriers for Business Value 4 Ability to easily ingest diverse data sets Flexibility to capture data Restricted system access Quickly getting value from data
- 39. 41 Required Capabilities 4 Schema-less approach/ late binding to schema Dynamic “normalization” of data Agile analytics and reporting Scalable search and analytics Seamless operational integration
- 40. Process Data Mining Core Engine 42 Computational Framework Integrate Untapped Data: Any Source, Type, Volume, Velocity Healthcare Apps Data/HL7 Event Logs Healthcare Apps Audit Logs Medical Device (PACS)/RFID Metadata (logs) Patient Generated Data Hadoop Clusters Relational Database No SQL Data StoreSplunk Clusters Explore Visualize Dashboard ShareAnalyze Monitor and alert External Applications Integration (SDK, REST API)
- 42. 44 Data Integration: Ingest any text data 4 MSH|^~&|EPIC|MGH||MGH|20150324190937|OHEDSCRIBE|ADT^A08|725 467|T|2.3||||||||| ……… PID|1||12345^^^EPI^MR||LUCUS^STEPHANEY||19751225|M|||^^^^^US^P |||||||6100215419|999-99-9999|||||||||||N|| ........ <recordTarget> <patientRole> <id extension="12345" root="PlaceholderOrganization" /> <addr use="HP”> <streetAddressLine>180 Fake Road</streetAddressLine> <city>Providence</city> <state>RI</state> <postalCode>02912</postalCode> <country>US</country> </addr> <telecom use="WP" value="tel:+1-401-867-7949" /> <patient> <name> <given>Stephaney</given> <family>Lucus</family> </name> <administrativeGenderCode code="F" codeSystem="2.16.840.1.113883.3.560.100.2" displayName="Male" /> { "resourceType": "Patient", "identifier": [ { "system": "urn:oid:1.2.36.146.595.217.0.1", "value": "12345", "period": { "start": "2001-05-06" } } ], "name": [ { "use": "official", "family": [”Lucus"], "given": [”Stephaney”] }, ], "gender": { "coding": [ { "system": "http://hl7.org/fhir/v3/AdministrativeGender", "code": "M", "display": "Male" } ] }, "birthDate": "1974-12-25", "address": [ { "use": "home", "line": ["534 Erewhon St"], "city": "PleasantVille", "state": "Vic", "zip": "3999" } ] } Patient identifier name telecom gender birthDate deceased address maritalStatus …. active
- 43. 45 Getting Data In 4 Universal and Heavy Forwarders Modular Input Stream, HTTP Event Collector RDBMS, Hadoop
- 45. 47 Search events with tag in any field Search events with tag in a specific field Search events with tag using wildcards Adding Metadata Knowledge: Search with Tags 4 Tag=GLYCEMIC, ASTHMA tag::DX=diabetes type 2 Tag=diabetes* 1 2 3
- 46. Aliases 4 Normalize field labels to simplify search and correlation Apply multiple aliases to a single field Example: Username | cs_username | User user Example: pid | patient | patient_id PATIENTID Aliases appear alongside original fields
- 47. Event Tagging 4 Classify and group common events Capture and share knowledge Based on search Use in combination with fields and tags to define event topography
- 48. 1) Regular Expression 2) Natural Language Processing using SDK and REST API 5 Feature Extraction from Texts
- 49. 51 Agenda Problem Background and Motivation Capabilities: Methodology Capabilities: Data Integration and Feature Engineering Capabilities: Statistics, Machine Learning, and Visualization Operational Integration Product Demonstration
- 50. Sparkline: Visualize frequency distributions Identify co-occurring spikes
- 51. Sankey Diagram: Visualize flow and frequency
- 52. Graphs: Visualize Network and Relations
- 53. Find Pathwayof SimilarPatients: SeeingMillions at a Time and VisualizePathways
- 54. Parallel Coordinates: Visualize Multivariates
- 55. Tree-Map
- 57. We should stop acting as if our goal is to author extremely elegant theories, and instead embrace complexity and make use of the best ally we have: the unreasonable effectiveness of data.
- 58. Clustering
- 61. 63 Agenda Problem Background and Motivation Capabilities: Methodology Capabilities: Data Integration and Feature Engineering Capabilities: Statistics, Machine Learning, and Visualization Operational Integration Product Demonstration
- 62. KPI Management 6
- 64. 6
- 65. 67 67 Business Value of Process Mining Save lives, reduce error, optimize time 1 Reduce cost, increase efficiency 2 3 Improve patient outcome, experience, and engagement
- 66. 68 Agenda Problem Background and Motivation Capabilities: Methodology Capabilities: Data Integration and Feature Engineering Capabilities: Statistics, Machine Learning, and Visualization Operational Integration Product Demonstration
- 67. Thank You
Editor's Notes
- #2: Do we know what a drug or diagnosis code means and does it mean the same in different EHRs? Similarly, do we know what an EHR event in an EHR event log means and does it mean the same in different systems. This last will be important for comparing process models, as EHRs are so user- customizable. “Check Meds” in one EHR might be called “Medications” in another. What exactly does “Check Meds” mean? Where, exactly, does it fit in a hierarchy of tasks, such as “checking” other things besides medications or involvement of medications in other activities besides “checking”? Is asking a patient about medications (or retrieving the medication list from online) an example of “Check Meds”? Is there a difference in the ordering and frequency of activities between patients that were treated by either a high- or low-volume surgeon? (control-flow perspective) Is there a difference in resource involvement between patients that were treated by either a high- or low-volume surgeon? (organisational perspective) Is there a difference in time-related performance between patients that were treated by either a high- or low-volume surgeon? (performance perspective) Is there a difference in the ordering and frequency of activities between patients that had surgical continuity and patients that had surgical discontinuity? (control-flow perspective) 2. Is there a difference in resource involvement between patients that had surgical continuity and patients that had surgical discontinuity? (organisational perspective) 3. Is there a difference in time-related performance between patients that had surgical continuity and patients that had surgical discontinuity? (performance perspective) Is there a difference in the ordering and frequency of activities between patients that had a throughput time of 80 and 40 minutes or less in respectively the pre-operative and final postoperative examination and patients with a longer throughput time? Is there a difference in organizational resource involvement between that had a throughput time of 80 and 40 minutes or less in respectively the pre-operative and final postoperative examination and patients with a longer throughput time? Is there a difference in time-related performance between patients that had a throughput time of 80 and 40 minutes or less in respectively the pre-operative and final postoperative examination and patients with a longer throughput time? It is apparent that the business processes in the medical domain are dynamic, ad-hoc, unstructured and multi-disciplinary in nature. he goal of clustering is to obtain homogeneous group of patients.
- #12: Discover actual behavior of people, organization, machines and relate to modeled behavior. Insights showing reality is very different from perceptions, opinions, and beliefs Correlation of Millions of ad-hoc events provide clue for standardization and better prepare to handle ad-hoc events. Different people have different views about a same process. Information about the process mat be incomplete. Discover actual behavior of people, organization, and machines and relate to modeled behavior. Correlate millions of ad-hoc events showing how reality is different from perceptions, opinions, and beliefs. Provide clue for standardization and better prepare to handle ad-hoc events.
- #14: Better use of the capacity to track patient flow through the health care system is a logical application, with potential to improve understanding of patterns of patient demand, provider supply, and bottlenecks to patient flow, and, as a result, improved revenues, hospital performance, and patient care. However, the success of these methods depends on their application simultaneously in every part of an interconnected system rather than being applied piecemeal to distinct individual processes, departments, or service lines. The notion of an integrated approach is a core concept for timely delivery of health care.
- #15: Optimizing performance requires measuring the demand, capacity, and flow into and out of each node within the system, and system-wide assessments and adjustments are required to improve the overall collection of steps, including such steps as consolidating or removing processes in order to streamline patient service flow. Systems strategies in health care delivery involve the use of scientific insights to illuminate the interdependencies of processes and elements and the effects of these interdependencies on health outcomes. Some of the causes of prolonged wait times are inefficiencies in operation, in care coordination, and in health care organizational culture that result in flow disruption, the underuse of resources, and an imbalance between the demand of patients to be seen and the supply of providers, facilities, and alternative strategies to care for them at any given time. Identify and quantify the types of variability in patient flow (demand) and the resources available to different patient groups (supply) he committee also enlisted the leaders of five institutions—Denver Health, Geisinger Health System, Kaiser Permanente, Seattle Children’s Hospital, and ThedaCare Some of the causes of prolonged wait times are inefficiencies in operation, in care coordination, and in health care organizational culture that result in flow disruption, the underuse of resources, and an imbalance between the demand of patients to be seen and the supply of providers, facilities, and alternative strategies to care for them at any given time. development, redesign, implementation, and delivery of such technology-based services. The health care system is a complex collection of interacting elements, each of which affects the others in myriad ways. Effectively dealing with any health care system issue—especially as basic as scheduling and access— requires dealing with the various system dynamics in a coordinated way that takes into account how changes in one area will affect the functions in other areas. That is, it requires systems strategies and approaches. Common to each of these practice areas is the integrative dimension. A systems approach emphasizes integration of all the systems and subsystems involved in a particular outcome. Adjusting each component of a system separately does not lead to an overall improved system. A health information technology infrastructure, including the creation and implementation of electronic health records (EHRs), is designed to generate data that will enhance the quality of patient care. Better use of the capacity to track patient flow through the health care system is a logical application, with potential to improve understanding of patterns of patient demand, provider supply, and bottlenecks to patient flow, and, as a result, improved revenues, hospital performance, and patient care. Several aspects of health care scheduling and access that should be measured and for which standards should be identified include: patient and family experience and satisfaction; care match with patient goals; scheduling practices, patterns, and wait times; cycle times, provision and performance experience for alternative care models (e.g., telehealth and other remote site services); and effective care continuity. analysis of data trends and predictions, and the integration of real-time monitoring of operations. Transparency helps employees understand the relevance and impact of change, informs and motivates their actions (on access, scheduling, or the other important elements of the care process), and helps organizations track the progress that they are making toward the desired new culture. Applied to scheduling and access, transparency about operational processes and their effectiveness can facilitate identification of delays and their causes, and also the progress made to reduce those delays. Finally, transparency facilitates messaging that creates organizational consistency—when everyone hears the same message from their leaders, they are motivated to respond in similar ways, and this behavior change can reinforce culture change.
- #22: A defining characteristic of modern health care is the rapidly accelerating increase in information that is available to assist with the delivery of care and system management. Time oriented data, 2. High diversity, 3. Some data is functional others are event logs generated by machines. Data came from activities which are part of sequential process Data is timestamped Activities are interdependent discrete events Machine data is generated by many different sources within the healthcare IT infrastructure. These sources include healthcare specific data sources such as electronic health record (EHR) systems, HL7 messaging, and connected medical devices. The data sources include core IT systems that support different applications such as desktops, servers, storage and network devices. Finally, they include all the patient facing applications and systems – portals, billing systems, claim management systems. Machine data generated by this infrastructure shares the core characteristics of big data – lot of data (high volume), created rapidly (high velocity), from different sources (variety), and data that changes over time (variability). Getting timely and relevant insight into this data can be a source of huge value for the healthcare ecosystem.
- #23: Subjects, locations, users, different data governance rules and standards that may conflict with each other
- #30: Data Science: validate your assumptions, formulate your hypotheses and test it, find simple principles that may have large impacts and generalized across the population.
- #31: End to End Value stream: Sequential time oriented tasks, resources are dependent on each other, multiple functional disciplines Value each others time and contributions. Any production problems would be quickly detected and corrected.
- #37: Threats follow the steps at the top right -to-to enter an org and exfiltrate data. To spot this you need to connect the dots as they move through this process. To do this you need data from the 4 data source categories on the far left. Examples are to the right. Note – “malware sandbox” includes FireEye and Palo Alto Network’s Wildfire technology which detonates email and web-based payloads and attachments and links in a virtual sandbox to see what they do & if they are malicious. Sometimes this category is also called “payload analysis” or “advanced malware detection”. ETDR is Endpoint Threat Detection and Response, an emerging category of next-gen endpoint technology. Cyvera (now part of Palo Alto Networks), Carbon Black (part of Bit9), RSA ECAT, Bromium, and Mandiant MIR fall into this category. Tell this slide perhaps as a “story” where you start with an alert at top (threat intel) and then pivot and use the other data sources to complete the investigation. See the appendix slide with a sample story.
- #42: One reason for agility is handling of data in scale using parallel data processing techniques. And lastly, we enable operational integration- two ways 1) speed of computations, 2) second is system integration through REST API support.
- #43: Splunk products are being used for data volumes ranging from gigabytes to hundreds of terabytes per day. Splunk software and cloud services reliably collects and indexes machine data, from a single source to tens of thousands of sources. All in real time. Once data is in Splunk Enterprise, you can search, analyze, report on and share insights form your data. The Splunk Enterprise platform is optimized for real-time, low-latency and interactivity, making it easy to explore, analyze and visualize your data. This is described as Operational Intelligence. The insights gained from machine data support a number of use cases and can drive value across your organization. [In North America] Splunk Cloud is available in North America and offers Splunk Enterprise as a cloud-based service – essentially empowering you with Operational Intelligence without any operational effort.
- #53: algorithm=LLB means “bivariate local level”
- #54: Vmware – House of Demos app. VM forest, esx server. Status of VMs when you click on particular one. One of the most useful types of visualizations is a “Sankey diagram”, which is used to describe flows through systems. These can be customer flows through marketing or sales funnels, traffic flows through the actual network, energy flows through a physical system, capital flows through a financial system, etc. It’s a very streamlined form of visualization that cuts out everything unrelated to “flow”. Technically, this is a graph visualization: the nodes are smushed to these bars along the side, and edges are represented by these fat bars connecting nodes. The width of a node is proportional to the volume of flow in and out of the node, and the width of an edge is proportional to the flow from the start node to the end node.
- #55: Customer journey: convert, repeat Mobile Patent Suits Dashed links are resolved suits; green links are licensing. “Thomson Reuters published a rather abysmal infographic showing the "bowl of spaghetti" that is current flurry of patent-related suits in the mobile communications industry. So, inspired by a comment by John Firebaugh, I remade the visualization to better convey the network. That company in the center? Yeah, it's the world's largest, so little wonder it has the most incoming suits.” mbostock’s block #1153292 August 18, 2011 http://bl.ocks.org/mbostock/1153292
- #56: Differentiate normal sequences vs. abnormal sequences or attributions. Reveal normal patterns of patient care by medical condition/ by providers/by drug/by medical equipment and corresponding expenditures. Use the acquired knowledge to correlate current events. Patterns outside these norms receive special attention and require validation by human investigators.
- #60: Case in point: http://www.wolframalpha.com/input/?i=diabetes
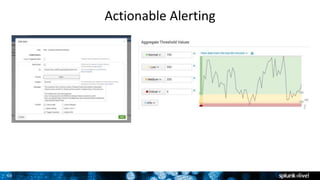
- #66: Alerts are triggered when certain conditions are met by the results of the search upon which it is based. Alerts can be based on both historical and real-time searches. When an alert is triggered, it performs an alert action. This action can be the sending of the alert information to a designated set of email addresses, or the posting of the alert information to an RSS feed. Alerts can also be set up to run a custom script when they are triggered. You can base these alerts on a wide range of threshold and trend-based scenarios, including empty shopping carts, brute force firewall attacks, and server system errors.